Massachusetts General Hospital ANNUAL REPORT ON EQUITY IN HEALTH CARE QUALITY 2016–2017 MGH/MGPO EDWARD P. LAWRENCE CENTER FOR QUALITY AND SAFETY Elizabeth A. Mort, MD, MPH • Syrene Reilly, MBA • Andrea T. Tull, PHD • Taekyu Kim, MBA • Robert J. Malin, MHA MASSACHUSETTS GENERAL HOSPITAL DISPARITIES SOLUTIONS CENTER Joseph R. Betancourt, MD, MPH • Aswita Tan-McGrory, MBA, MSPH • Karey S. Kenst, MPH
Transcript
Massachusetts General Hospital
ANNUAL REPORT ON EQUITY IN HEALTH CARE QUALITY 2016–2017
MGH/MGPO EDWARD P. LAWRENCE CENTER FOR QUALITY AND SAFETYElizabeth A. Mort, md, mph • Syrene Reilly, mba • Andrea T. Tull, phd • Taekyu Kim, mba • Robert J. Malin, mha
MASSACHUSETTS GENERAL HOSPITAL DISPARITIES SOLUTIONS CENTER Joseph R. Betancourt, md, mph • Aswita Tan-McGrory, mba, msph • Karey S. Kenst, mph
ACKNOWLEDGEMENTSThe MGH/MGPO wishes to acknowledge and thank the following individuals for their contributions to the development of this report:
Steven J. Atlas, md, mph
Primary Care, Department of Medicine
Stephen Buonopane, Senior Business ManagerAdmitting & Registration
Jeffrey Ecker, md
Department of Obstetrics and Gynecology
Wei He, ms, Senior Systems AnalystGeneral Medicine
Chris Kirwan, Project CoordinatorMGH Interpreter Services
Emily Kung, Pediatric HospitalistMassGeneral Hospital for Children
Andrea Madu, Senior Research AssistantDisparities Solutions Center
Allison Bryant Mantha, md, mph
Department of Obstetrics and Gynecology
Anabela Nunes, mba, Director of Medical InterpretersMGH Interpreter Services
Joan Quinlan, mpa
Vice President for Community Health
Vickie Stringfellow, Program Manager for Surveys & AnalysisCenter for Quality & Safety
ii MGH ANNUAL REPORT ON EQUITY IN HEALTH CARE QUALITY 2016–2017
The report examines several priority areas, including person-centered care, patient safety, healthy living, effective treatment, care coordination, and care affordability.
1MGH ANNUAL REPORT ON EQUITY IN HEALTH CARE QUALITY 2016–2017
EXECUTIVE SUMMARY
This ninth edition of the MGH Annual Report on Equity in Health Care Quality (AREHQ) monitors quality of care by race, ethnicity, and language to identify disparities among racial and ethnic
minorities and patients with limited English proficiency . It was developed in response to the Institute of Medicine (IOM) Report, Crossing the Quality Chasm, which identifies equity—the principle that quality of care should not vary by race, ethnicity, or gender—as one of six pillars of quality .1
Massachusetts General Hospital (Mass General) embraces the recommendations of the Chasm report, as well as another important IOM report entitled Unequal Treatment, which highlighted that minorities, even those with health insurance, often receive lower quality care than their white counterparts . Unequal Treatment defines disparities as “racial or ethnic differences in the quality of healthcare that are not due to access-related factors or clinical needs, preferences, and appropriateness of intervention .”2
Evidence of disparities at a national level motivates efforts to monitor for equity of care at MGH . The Agency for Healthcare Research and Quality’s annual National Healthcare Quality and Disparities Report assesses the performance of the U .S . healthcare system and identifies disparities in access to and quality of healthcare . The report examines several priority areas, including person-centered care, patient safety, healthy living, effective treatment, care coordination, and care affordability . The 2016 report revealed the following national trends:
• Most disparities have not changed for any racial and ethnic groups over time . Disparities persist, especially for poor and uninsured populations in all priority areas .
• Quality of healthcare has improved overall, but the pace of improvement has been slower for measures related to care coordination and care affordability than measures in other priority areas .
• Most measures related to healthcare access have not improved over time, although uninsurance rates have decreased from 2010 to 2016 .3
This report provides an analysis of measures of quality stratified by patient race, ethnicity, and language . It also identifies areas for quality improvement, and reports on the progress of initiatives currently addressing disparities at Mass General . The report includes standard process of care and patient experience measures required by the Joint Commission and Centers for Medicare/Medicaid Services, stratified by race, ethnicity, and primary language . White and English-speaking groups are used as the reference group for statistical analyses throughout the report . In some cases, it can be challenging
2 MGH ANNUAL REPORT ON EQUITY IN HEALTH CARE QUALITY 2016–2017
to tease out the root causes of differences identified in the data . For example, some differences may be due to variation in clinical appropriateness or cultural preference, while some may reflect a true disparity in the quality of care provided due to structural factors, cultural competency of providers, communication barriers, and a host of other factors .
Not only does this report allow us to measure the equity of the care provided, but given that it was the first of its kind in the nation, it establishes Mass General as a national leader in monitoring and addressing disparities and promoting high quality care for all patients regardless of race, ethnicity, culture, socioeconomic status, or language proficiency . Several hospitals around the country have followed Mass General’s efforts in this arena and have gained expertise through Mass General’s Disparities Leadership Program to develop similar reports for their organizations (https://mghdisparitiessolutions .org/the-dlp/) .
What’s New? In 2016, the Mass General renewed our commitment to equity and diversity through revision of the hospital’s credo and boundaries statements to include specific mention of health equity, diversity, and inclusion as core institutional values . These documents represent the code of conduct and core values for over 25,000 Mass General employees . This report highlights our new credo, diversity statement, and boundaries statements, and describes the Mass General’s ongoing efforts to promote diversity and health equity for patients and employees .
This year’s report includes an expanded focus on readmissions, a prominent measure of quality and efficiency . Reducing unnecessary readmissions is an important goal for Mass General, and the hospital has several improvement efforts underway to reduce our 30-day readmission rate . This report explores opportunities for readmission reduction among patients with limited English proficiency (LEP), a vulnerable population particularly with regard to care transitions affecting the likelihood of readmission . Building on the analysis presented in the 2015 report, we specified a logistic regression model to understand whether language or race were significant drivers of the readmission rate at Mass General .
This report also includes several new National Hospital Quality Measures (NHQMs), such as care for Ischemic Stroke, Venous Thromboembolism (VTE), and Endoscopy for Polyp Surveillance . Many of the NHQM measures from prior reports have been retired by oversight organizations as hospitals have reached uniform high quality . Therefore, we believe public reporting of clinical process measures remains an important avenue for eliminating disparities in care .
Mass General is committed to sharing this important work and sharing data publicly . This report is shared on the Disparities Solutions Center and Mass General Quality and Safety websites .
3MGH ANNUAL REPORT ON EQUITY IN HEALTH CARE QUALITY 2016–2017
Background: Demographic Profile of Mass General Patients • In calendar year 2016, as in previous years, the racial and ethnic composition of Mass General’s
patient population roughly mirrored the catchment area of Eastern Massachusetts, although Mass General inpatients were slightly more likely to be white and English speaking .
• A greater proportion of African American and Hispanic patients are seen in the Emergency Department, compared to inpatient services . There is also variation in the distribution among racial and ethnic minority patients within inpatient services .
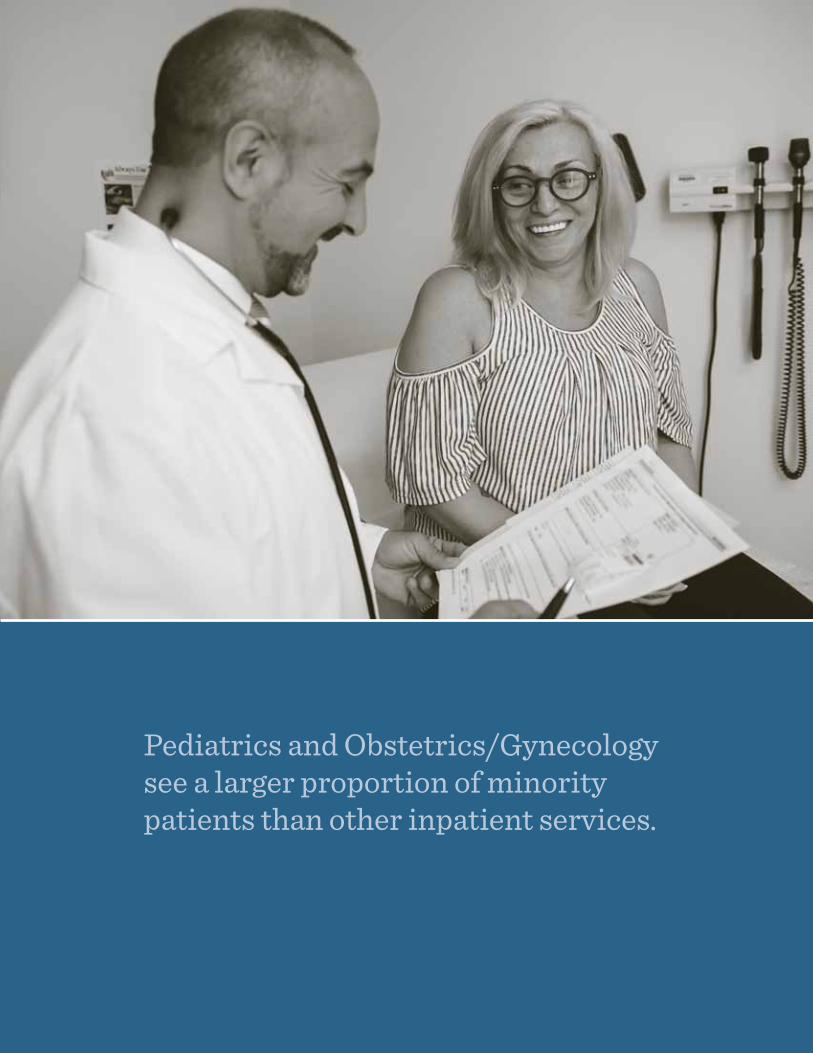
• Pediatrics and Obstetrics/Gynecology see a larger proportion of minority patients than other inpatient services due to their larger Hispanic population .
• Mass General’s health centers (Chelsea, Charlestown, and Revere) and primary care locations see a relatively larger proportion of minority patients, compared to outpatient specialty care practices . Hispanic representation in the health centers is higher than any other area of the hospital system (33% in health centers vs . 6% at Mass General main campus and satellite practices) .
The Disparities Reporting Committee (L–R): Andrea Tull, Syrene Reilly, Elizabeth Mort, Joseph Betancourt, Karey Kenst, and Aswita Tan-McGrory.
4 MGH ANNUAL REPORT ON EQUITY IN HEALTH CARE QUALITY 2016–2017
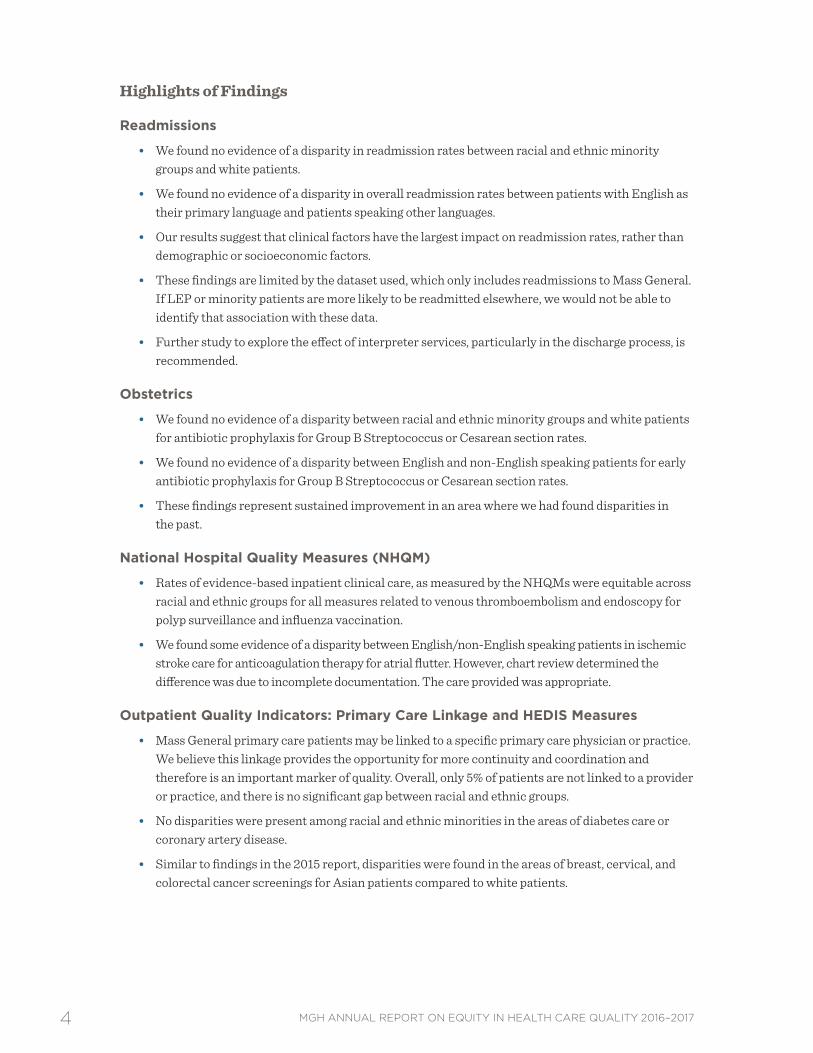
Highlights of Findings
Readmissions
• We found no evidence of a disparity in readmission rates between racial and ethnic minority groups and white patients .
• We found no evidence of a disparity in overall readmission rates between patients with English as their primary language and patients speaking other languages .
• Our results suggest that clinical factors have the largest impact on readmission rates, rather than demographic or socioeconomic factors .
• These findings are limited by the dataset used, which only includes readmissions to Mass General . If LEP or minority patients are more likely to be readmitted elsewhere, we would not be able to identify that association with these data .
• Further study to explore the effect of interpreter services, particularly in the discharge process, is recommended .
Obstetrics
• We found no evidence of a disparity between racial and ethnic minority groups and white patients for antibiotic prophylaxis for Group B Streptococcus or Cesarean section rates .
• We found no evidence of a disparity between English and non-English speaking patients for early antibiotic prophylaxis for Group B Streptococcus or Cesarean section rates .
• These findings represent sustained improvement in an area where we had found disparities in the past .
National Hospital Quality Measures (NHQM)
• Rates of evidence-based inpatient clinical care, as measured by the NHQMs were equitable across racial and ethnic groups for all measures related to venous thromboembolism and endoscopy for polyp surveillance and influenza vaccination .
• We found some evidence of a disparity between English/non-English speaking patients in ischemic stroke care for anticoagulation therapy for atrial flutter . However, chart review determined the difference was due to incomplete documentation . The care provided was appropriate .
Outpatient Quality Indicators: Primary Care Linkage and HEDIS Measures
• Mass General primary care patients may be linked to a specific primary care physician or practice . We believe this linkage provides the opportunity for more continuity and coordination and therefore is an important marker of quality . Overall, only 5% of patients are not linked to a provider or practice, and there is no significant gap between racial and ethnic groups .
• No disparities were present among racial and ethnic minorities in the areas of diabetes care or coronary artery disease .
• Similar to findings in the 2015 report, disparities were found in the areas of breast, cervical, and colorectal cancer screenings for Asian patients compared to white patients .
5MGH ANNUAL REPORT ON EQUITY IN HEALTH CARE QUALITY 2016–2017
Inpatient Patient Experience: HCAHPS
• Asians reported significantly less positive experiences than non-Hispanic whites for 4 of 11 HCAHPS measures .
• Asians, Hispanics and persons of Other races reported significantly less positive experiences than non-Hispanic whites on the new care transitions measures, which assess the patient experience with coordination and transitioning out of the hospital .
Outpatient Patient Experience: CG-CAHPS and Pediatric CG-CAHPS
• Disparities were identified for most racial and ethnic minority groups for both outpatient C/G-CAHPS measures . African Americans, Hispanic, Asian/Pacific Islander, and Other patients reported lower overall provider ratings . The scores for willingness to recommend were lower for Asian/Pacific Islander, and Other patients, compared to white patients .
• Adult patients who indicated Spanish as their primary language provided significantly higher ratings for willingness to recommend their outpatient provider on CG-CAHPS surveys, an improvement from last year . However, scores on overall provider rating continue to be lower for Spanish-speaking patients compared to patients with English as their primary language .
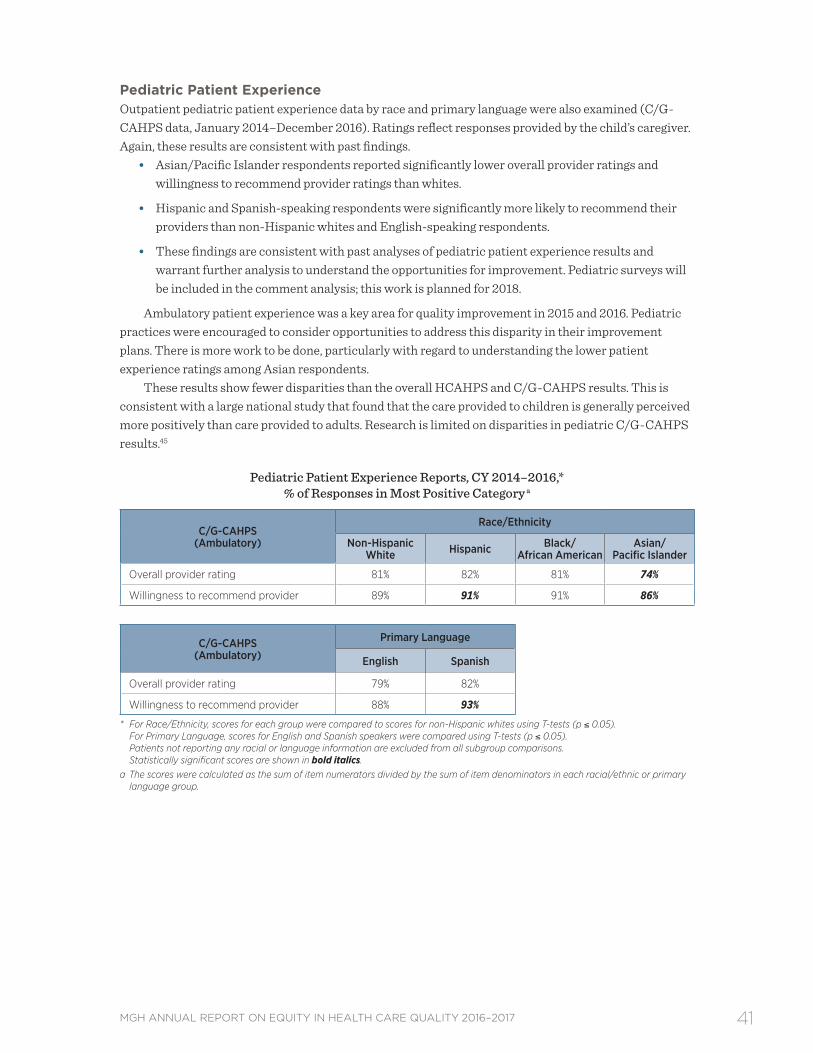
• Among pediatric patients, Asian/Pacific Islander respondents reported significantly lower overall provider ratings and willingness to recommend provider ratings than whites . Hispanic and Spanish-speaking respondents were significantly more likely to recommend their providers than non-Hispanic whites and English-speaking respondents .
6 MGH ANNUAL REPORT ON EQUITY IN HEALTH CARE QUALITY 2016–2017
As the healthcare landscape changes with the national and local policy environment, the process of promoting equity in healthcare becomes even more critical.
7MGH ANNUAL REPORT ON EQUITY IN HEALTH CARE QUALITY 2016–2017
MASS GENERAL COMMITMENT TO EQUITY AND INCLUSION
A t the Massachusetts General Hospital, we view health equity and the elimination of disparities as the foundation to providing the highest quality care to patients . Each year, we undertake the process of
stratifying our quality measures by race and language to seek out and eliminate disparities in care . As the healthcare landscape changes with the national and local policy environment, this process of promoting equity in healthcare becomes even more critical . As such, Mass General leadership revised the hospital’s credo and boundaries statements to include specific mention of health equity, diversity, and inclusion as core institutional values . These documents represent the code of conduct and core values for over 25,000 Mass General employees .
These values have always been a part of our institution, but this change in our credo and boundaries statements crystallizes and provides high visibility to the principles of equity and diversity . In 2016, Mass General also adopted a new diversity and inclusion position statement describing how these core values help Mass General achieve our mission .
In 2014, the Center for Diversity and Inclusion (formerly the Multicultural Affairs Office) worked with researchers at the Mongan Institute Health Policy Center to identify best practices for measuring diversity, inclusion, and engagement in the Massachusetts General Hospital workforce . That report, Mass General Diversity Metrics Project: Supporting Effective Strategies to Develop a Diverse Workforce, recommended two approaches to collecting these data . First, a dashboard of inclusion metrics that would show applicants, employees, promotions, and terminations by key diversity components of race, ethnicity, sex, disability, and veterans status (all demographic measures that are already part of standard reports) . Second, a diversity culture survey was recommended to gather demographic information that is not usually collected by HR (sexual orientation, preferred language, religion, nationality) and to understand the culture of diversity and respectful treatment . In October–November 2016, a collaborative team of researchers, health professionals, administrative, and support staff, a subgroup of the Mass General Diversity Committee, developed the Mass General Diversity Culture Survey . The survey included items on work environment, respectful treatment, and the experience of diversity in the workforce . More than 7,500 people responded across the organization . Results are currently being analyzed for later dissemination to leadership and staff .
8 MGH ANNUAL REPORT ON EQUITY IN HEALTH CARE QUALITY 2016–2017
MGH DIVERSITY & INCLUSION STATEMENT
Diversity is the richness of human differences. Inclusion is when everyone is valued, engaged, and feels connected. At Massachusetts General Hospital, we believe that because of diversity we will excel; through inclusion we will respect; focused on equity we will serve, heal, educate and innovate.
Because of diversity we will excel. We think broadly about diversity and everything that makes us unique . It is core to our mission . Our differences make the MGH a more interesting and distinctive environment in which to work and are an important means of providing the very best care to every one of our patients, regardless of race, ethnicity, gender, gender identity, religion, age, sexual orientation, disabilities, life experiences, geographic backgrounds, skills and talents among others . We will not excel without recognizing and appreciating everyone’s perspectives .
Through inclusion we will respect. Together we work hard to make this hospital a diverse and inclusive place of healing . Encouraging a broad range of opinions, ideas and perspectives drives creativity, innovation and excellence . Our continued engagement in our nationally recognized initiatives and programs highlights our commitment to diversity and inclusion . But this ongoing work will not be complete until every employee, every patient, every family member, every visitor feels safe, respected, welcome, comfortable, supported and accepted within our walls .
Focused on equity we will serve, heal, educate and innovate. Our job is to improve health and save lives, regardless of what our patients or colleagues look like, where they come from, what they believe, or who they love . Issues of equity and justice are not separate but rather intertwined with patient care, education, research, and community health . Targeting inequality enhances the quality of care for all . We believe in treating our patients and each other with the dignity that every human being deserves .
“Massachusetts General Hospital—strengthened by diversity, unified through inclusion, committed to equity.”
“Everyone is appreciated and valued here.”
9MGH ANNUAL REPORT ON EQUITY IN HEALTH CARE QUALITY 2016–2017
MGH CREDO
As a member of the MGH community and in service of our mission, I believe that:
• The first priority at MGH is the well-being of our patients, and all our work, including research, teaching and improving the health of the community, should contribute to that goal .
• Our primary focus is to give the highest quality of care to each patient delivered in a culturally sensitive, compassionate and respectful manner .
• My colleagues and I are MGH’s greatest assets; understanding and valuing our differences helps us excel .
• Teamwork and clear communication are essential to providing exceptional care .
As a member of the MGH community and in service of our mission, I will:
• Provide compassionate, equitable, and patient centered care .
• Listen and respond to patients, patients’ families, caregivers, colleagues and community members .
• Ensure that the MGH is safe, accessible, inclusive and welcoming to everyone .
• Share my successes and errors with my colleagues so we can all learn from one another .
• Make wise use of the hospital’s human, financial and environmental resources .
• Be accountable for my actions .
• Uphold professional and ethical standards .
MGH BOUNDARIES
As a member of the MGH community and in service of our mission, I will never:
• Knowingly ignore MGH policies and procedures .
• Criticize or take action against any member of the MGH community raising or reporting a safety concern .
• Speak or act disrespectfully toward anyone .
• Engage in, tolerate or fail to address abusive, disruptive, discriminatory, or culturally insensitive behaviors .
• Look up or discuss private information about patients or staff for any purpose outside of my specified job responsibilities .
• Work while impaired by any substance or condition that compromises my ability to function safely and competently .
10 MGH ANNUAL REPORT ON EQUITY IN HEALTH CARE QUALITY 2016–2017
Pediatrics and Obstetrics/Gynecology see a larger proportion of minority patients than other inpatient services.
11MGH ANNUAL REPORT ON EQUITY IN HEALTH CARE QUALITY 2016–2017
DEMOGRAPHIC PROFILE OF MASS GENERAL PATIENTS
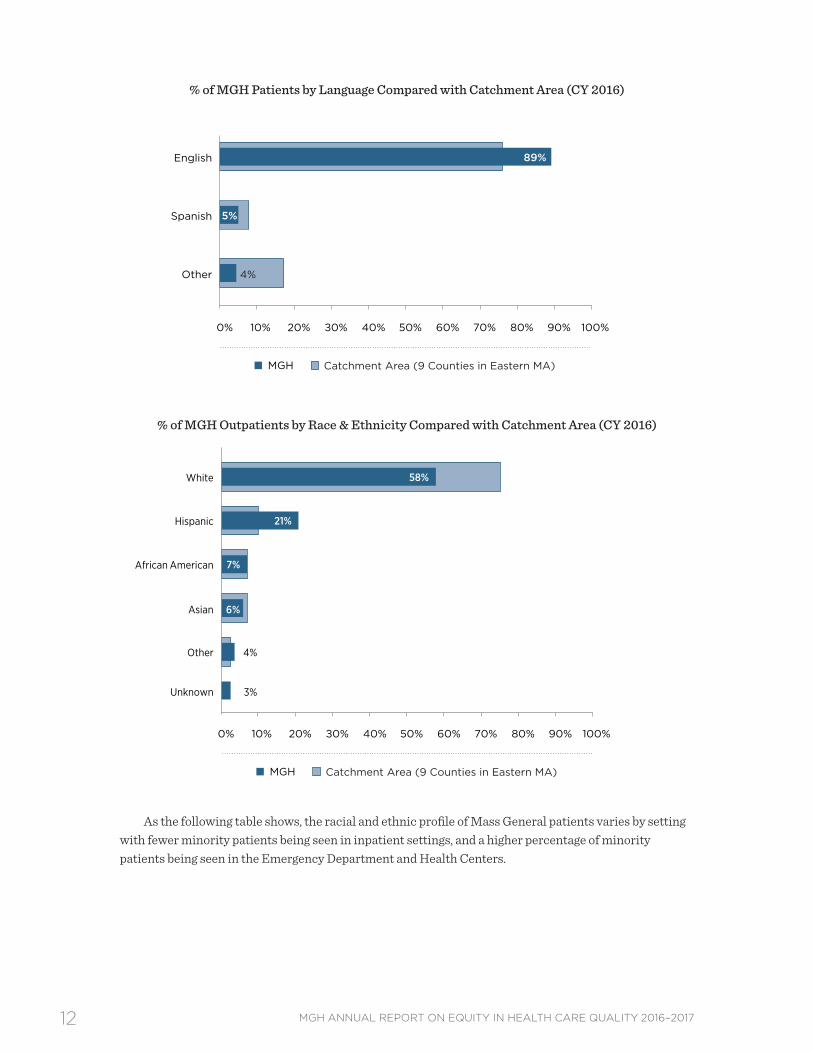
This section provides a graphical overview of the racial, ethnic, and linguistic diversity of patients receiving care at Mass General during calendar year 2016 compared with the diversity of Mass
General’s catchment area (9 counties in Eastern Massachusetts) . When compared to the demographic profiles of the surrounding communities, Mass General inpatients are more likely to be white and English speaking . Mass General’s outpatient population, however, has a higher concentration of Hispanic patients and lower concentration of white patients .
% of MGH Inpatients by Race & Ethnicity Compared with Catchment Area (CY 2016)
Other
Asian
African American
Hispanic
White
MGH Catchment Area (9 Counties in Eastern MA)
4%
Unknown 4%
6%
8%
76%
0% 10% 20% 30% 40% 50% 60% 70% 80% 90% 100%
3%
12 MGH ANNUAL REPORT ON EQUITY IN HEALTH CARE QUALITY 2016–2017
% of MGH Patients by Language Compared with Catchment Area (CY 2016)
Other
Spanish
English
MGH Catchment Area (9 Counties in Eastern MA)
89%
4%
5%
0% 10% 20% 30% 40% 50% 60% 70% 80% 90% 100%
% of MGH Outpatients by Race & Ethnicity Compared with Catchment Area (CY 2016)
As the following table shows, the racial and ethnic profile of Mass General patients varies by setting with fewer minority patients being seen in inpatient settings, and a higher percentage of minority patients being seen in the Emergency Department and Health Centers .
Other
Asian
African American
Hispanic
White
MGH Catchment Area (9 Counties in Eastern MA)
6%
Unknown 3%
7%
21%
58%
0% 10% 20% 30% 40% 50% 60% 70% 80% 90% 100%
4%
13MGH ANNUAL REPORT ON EQUITY IN HEALTH CARE QUALITY 2016–2017
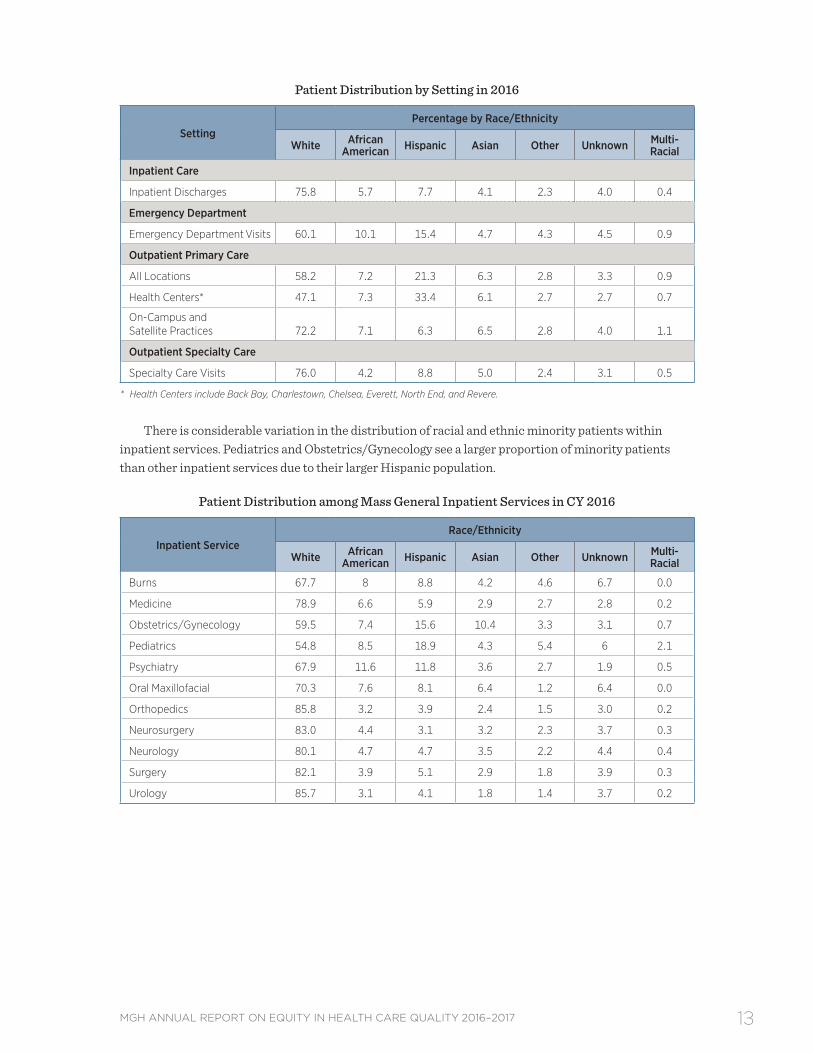
Patient Distribution by Setting in 2016
SettingPercentage by Race/Ethnicity
White African American Hispanic Asian Other Unknown Multi-
Racial
Inpatient Care
Inpatient Discharges 75.8 5.7 7.7 4.1 2.3 4.0 0.4
Emergency Department
Emergency Department Visits 60.1 10.1 15.4 4.7 4.3 4.5 0.9
Specialty Care Visits 76.0 4.2 8.8 5.0 2.4 3.1 0.5
* Health Centers include Back Bay, Charlestown, Chelsea, Everett, North End, and Revere.
There is considerable variation in the distribution of racial and ethnic minority patients within inpatient services . Pediatrics and Obstetrics/Gynecology see a larger proportion of minority patients than other inpatient services due to their larger Hispanic population .
Patient Distribution among Mass General Inpatient Services in CY 2016
Inpatient Service Race/Ethnicity
White African American Hispanic Asian Other Unknown Multi-
14 MGH ANNUAL REPORT ON EQUITY IN HEALTH CARE QUALITY 2016–2017
The challenge for hospitals nationwide is to provide a safe transition to the patient’s discharge destination and coordinate follow-up care to prevent unnecessary readmissions.
15MGH ANNUAL REPORT ON EQUITY IN HEALTH CARE QUALITY 2016–2017
NEW AREAS OF EXPLORATION: READMISSION
4.1 | Background on Disparities in Readmission RatesThe national focus on maximizing the value of healthcare has led to conversations about improving outcomes for patients while simultaneously reducing the costs of care .4 Readmission rates, typically within thirty days of hospital discharge, continue to be used as a principal measure of value . CMS and state payers have initiated financial penalties for providers with “excess” readmissions, and readmission rates- both hospital-wide and for selected medical conditions and procedures- are now publicly reported . While some readmissions are preventable and may result from inadequate outpatient follow-up or the development of complications, not all readmissions are avoidable . The challenge for hospitals nationwide is to provide a safe transition to the patient’s discharge destination and coordinate follow-up care to prevent unnecessary readmissions .5
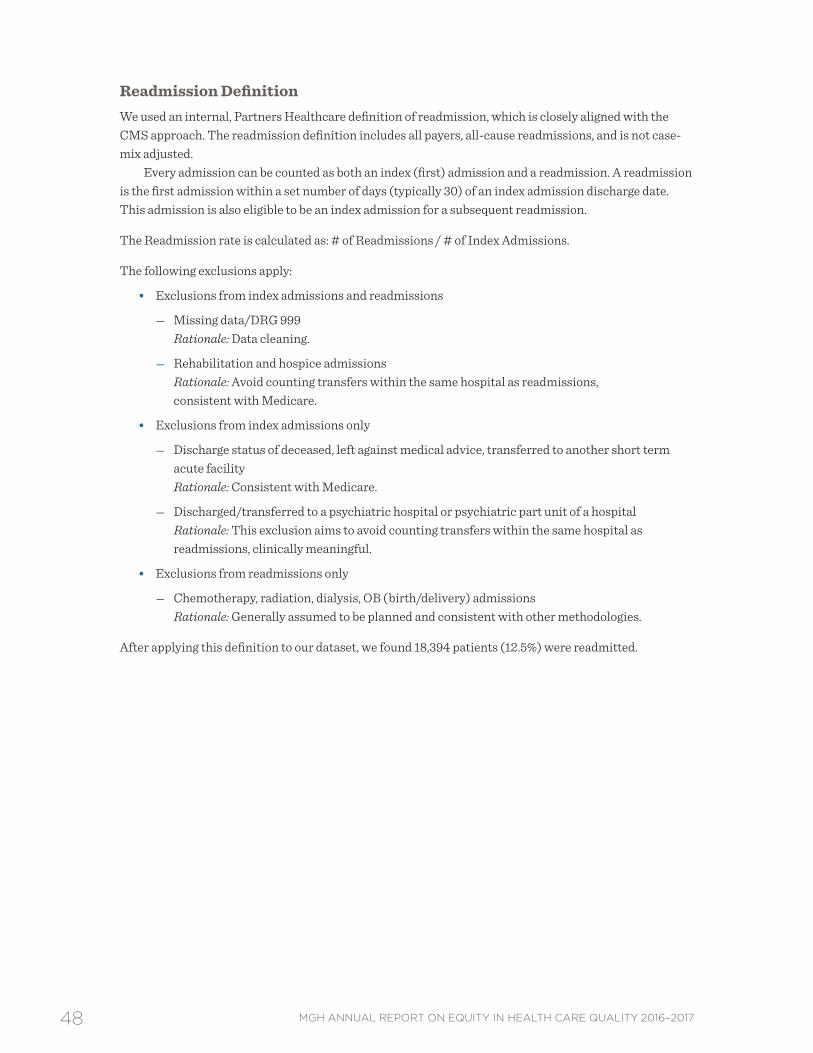
A readmission occurs when a patient returns to the hospital for a subsequent inpatient stay within 30 days of discharge .i Emergency Department visits or observation stays are not considered readmissions . Some planned readmissions are excluded (for example, chemotherapy, childbirth, radiation, dialysis, and some instances of follow-up care for heart attack and pneumonia patients) .ii This approach is consistent with how CMS and other payers define readmissions .
Reduction of preventable readmissions has been a Mass General goal for several years . Multiple efforts are underway across all departments to reduce unnecessary returns to the hospital, including improving the way we manage discharge transitions, calculating the risk of readmission for each individual patient and providing special supportive services to high risk patients, providing more specific and user-friendly discharge instructions to patients, and closely monitoring readmission rates within each department and service . Mass General also engages interpreter services to support the communication needs of our patients at discharge . Despite these efforts, readmission rates have been relatively stable for several years between 12–12 .5% .
Research suggests patients who are readmitted tend to be the most medically complex and socioeconomically disadvantaged .6 Research has shown that hospitals serving vulnerable and minority populations are more likely than others to incur readmission penalties, in part because their patient
i Readmission rates include returns to Mass General (discharging hospital) only . ii Other exclusions to the readmission rate are: patients with a discharge status of deceased, left against medical advice,
transferred to another short term acute facility, transferred to a psychiatric hospital, transfer within the same hospital (for psychiatry, rehabilitation, or hospice) in the index admission .
16 MGH ANNUAL REPORT ON EQUITY IN HEALTH CARE QUALITY 2016–2017
population faces financial, social, cultural, and linguistic barriers that make them more likely to have problems after discharge, even if the hospital is trying to oversee their recuperation .6 As such, disparities in readmission rates for vulnerable populations may be driven by a more complex set of factors than disparities in the process of care measures explored in other sections of this report .7 Preventing avoidable readmissions requires assuring that patients have the social support needed to manage their condition and addressing the social determinants that put them at continued and repetitive risk for returning to the hospital after their initial hospitalization .
4.2 | Previous Exploration of Disparities in Readmission RatesIn 2015, we began to explore differences in readmission rates by race and language to uncover any evidence of disparities for our patients . Given that communication of a discharge plan would appear to be a critical part of a safety discharge plan, we looked at patients with limited English proficiency (LEP) as a group to see if their readmission rates were higher than their English-speaking counterparts . We hypothesized that patients with LEP might have higher readmission rates, due to the complexities of care transitions and the potential for miscommunication, particularly when complicated discharge instructions or handoffs to other providers are involved .
Our initial analysis focused on exploration of the racial/ethnic differences in overall readmission rates, followed by differences in readmission rates between patients with a primary language of English versus patients with LEP . There were a number of interesting and surprising findings that spurred us to complete deeper analyses of the readmission phenomenon .
The diagrams below provide a visual overview of the initial analyses we conducted .
Data Analysis Process
Readmission Rates by Race and EthnicityWe used three fiscal years of data from 2012–2014 to examine readmission rates by race/ethnicity and found no evidence of racial or ethnic disparities in overall readmission rates; we did not see higher readmission rates among African American, Hispanic, Asian, or patients of other races .
* Comparison is statistically significant at P<0.05 using CHI Square Test. Statistically significant scores are show in bold italics.
STEP 1:Readmission Rates by Race and Ethnicity
White African-American Hispanic Asian All Other
English Other PrimaryLanguage
STEP 2:Readmission Rates by Primary Language
17MGH ANNUAL REPORT ON EQUITY IN HEALTH CARE QUALITY 2016–2017
Readmission Rates by Primary LanguageWe then looked at readmission rates by primary language and found that contrary to our hypothesis, patients with LEP had lower rates of readmission compared to patients who speak English (11 .4% vs . 12 .3% respectively) . Further stratification of readmission rates by sociodemographic factors such as age, gender, and other factors revealed the following patterns of interest:
• Readmission rates were statistically higher for patients with LEP age 65 or older compared with their English-speaking counterparts (16 .1% vs . 13 .9%) .
• Asian patients with LEP had a readmission rate of 13 .2%, compared with 8 .7% for Asians with English as their primary language .
Readmission Rates by Primary Language: October 2012–September 2014*
Readmission Rates
Primary Language
English Other
N % N %
Total
All Patients 126,759 12.3% 12,807 11.4%
Gender
Male 62,026 13.3% 5,435 13.7%
Female 64,733 11.2% 7,372 9.6%
Age
Age 0–17 6,160 8.9% 1,248 7.5%
Age 18–64 72,411 11.4% 7,224 9.2%
Age 65+ 48,188 13.9% 4,335 16.1%
Race
White 105,514 12.6% 3,207 13.1%
Black 6,862 13.0% 870 11.0%
Hispanic 4,471 10.4% 5,147 11.1%
Asian 3,657 8.7% 1,518 13.2%
Other/Unknown 6,255 9.1% 2,065 8.3%
Primary Payer
Commercial (HMO) 17,102 9.9% 604 7.3%
Commercial (PPO) 25,433 9.4% 918 6.4%
Medicaid 15,551 13.4% 5,173 9.6%
Medicare 53,012 14.9% 3,754 15.9%
Other 15,661 9.5% 2358 10.9%
Discharge Status
Home/Self 69,866 9.7% 7,512 8.3%
Home Health Service 32,858 15.4% 3,159 15.3%
Skilled Nursing Facility 23,883 15.5% 2,121 16.4%
Other/Unknown 152 7.9% 15 6.7%
* Comparison of LEP rate to English speaking rate is statistically significant at P<0.05 using CHI Square test. Scores for LEP patients that exhibit a statistically significant difference are in bold italics.
18 MGH ANNUAL REPORT ON EQUITY IN HEALTH CARE QUALITY 2016–2017
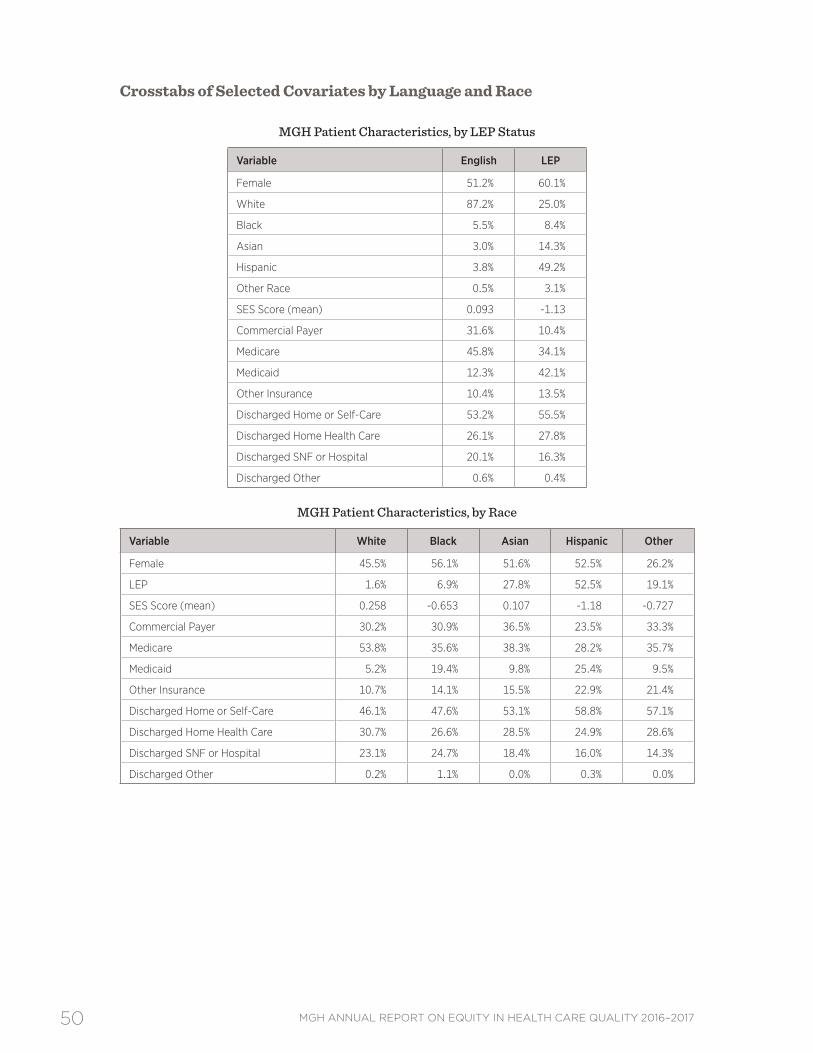
Although these findings suggested possible disparities for sub-populations within the LEP population (older and Asian), further analysis was required to determine whether these differences remained after controlling for other sociodemographic and clinical factors . We developed a multivariate model to account for these other factors, and the results are described in the next section .
4.3 | Multivariate Analysis of Readmission RatesMany factors—including clinical, demographic, social, and economic—affect a patient’s chances of being readmitted . Our aim was to conduct a multivariate analysis that would allow us to explore how these characteristics taken together influence readmission rates, particularly for patients with LEP . Our principal question was whether any difference in readmission rates would be present for LEP patients after controlling for other socio-demographic and clinical factors . In other words, is LEP a significant predictor of readmission, or do other factors exert greater influence on the likelihood of a patient being readmitted?
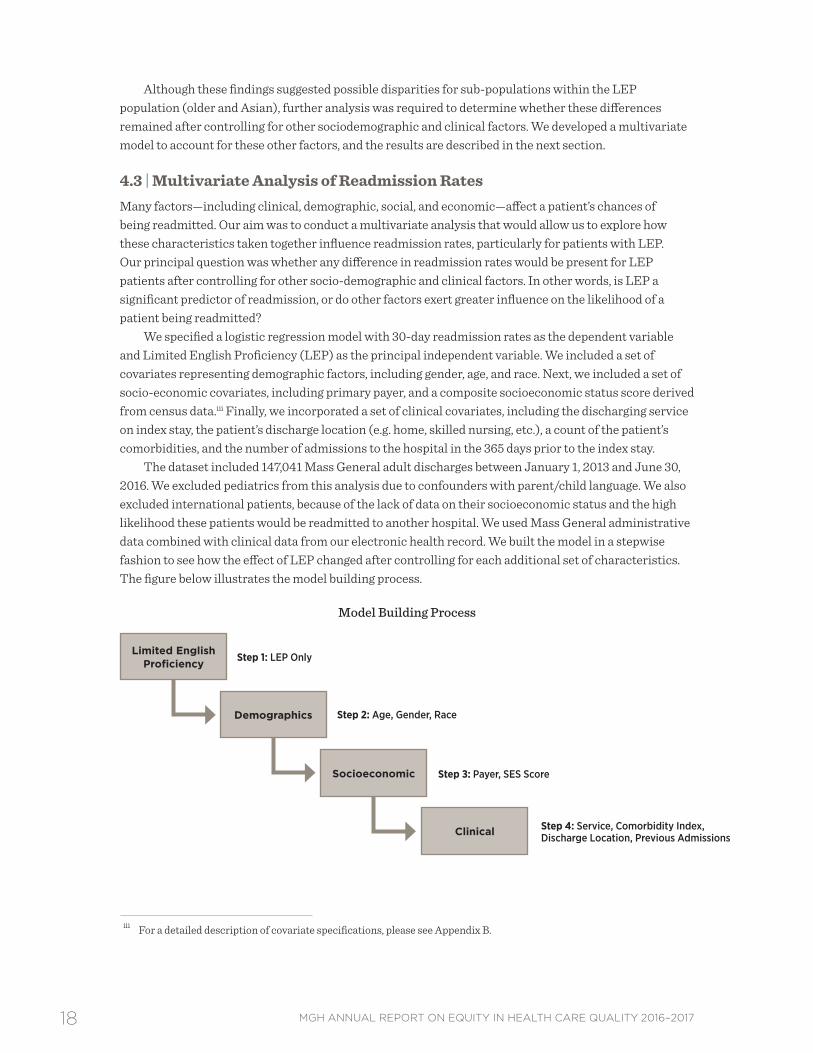
We specified a logistic regression model with 30-day readmission rates as the dependent variable and Limited English Proficiency (LEP) as the principal independent variable . We included a set of covariates representing demographic factors, including gender, age, and race . Next, we included a set of socio-economic covariates, including primary payer, and a composite socioeconomic status score derived from census data .iii Finally, we incorporated a set of clinical covariates, including the discharging service on index stay, the patient’s discharge location (e .g . home, skilled nursing, etc .), a count of the patient’s comorbidities, and the number of admissions to the hospital in the 365 days prior to the index stay .
The dataset included 147,041 Mass General adult discharges between January 1, 2013 and June 30, 2016 . We excluded pediatrics from this analysis due to confounders with parent/child language . We also excluded international patients, because of the lack of data on their socioeconomic status and the high likelihood these patients would be readmitted to another hospital . We used Mass General administrative data combined with clinical data from our electronic health record . We built the model in a stepwise fashion to see how the effect of LEP changed after controlling for each additional set of characteristics . The figure below illustrates the model building process .
iii For a detailed description of covariate specifications, please see Appendix B .
19MGH ANNUAL REPORT ON EQUITY IN HEALTH CARE QUALITY 2016–2017
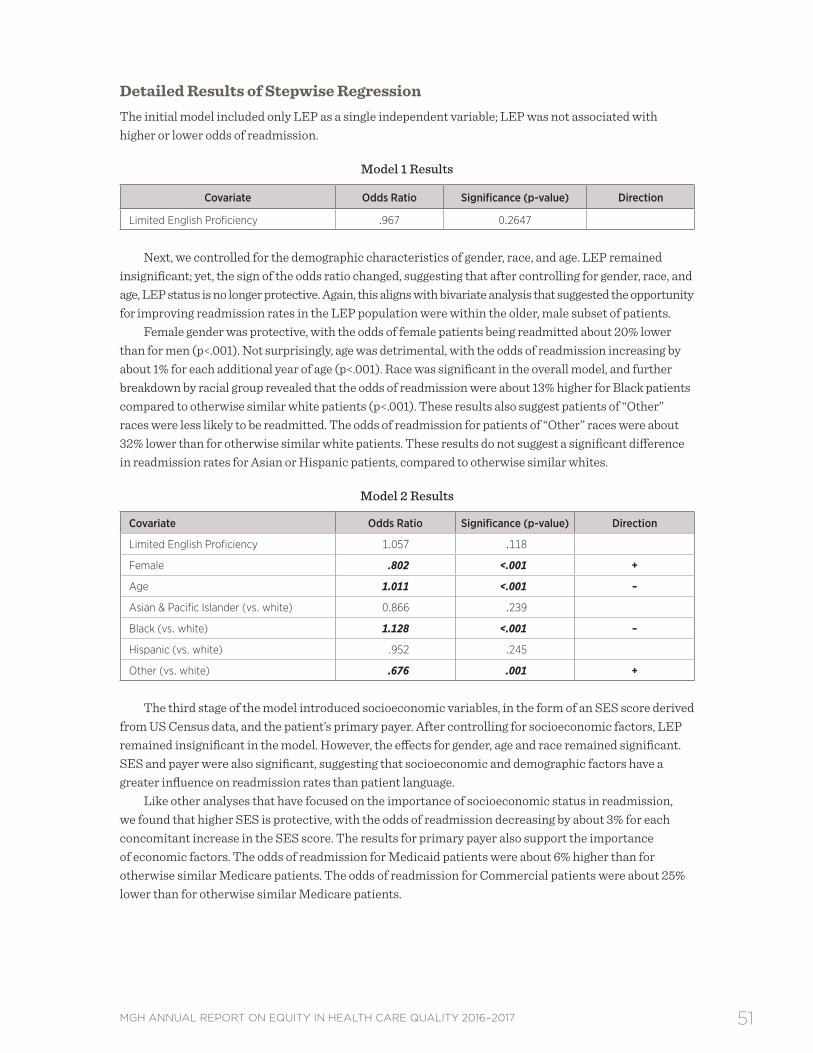
The logistic regression results are displayed in the table below . Please refer to the technical appendix for a more detailed discussion of the regression findings . The table summarizes the predictors of readmission (odds ratios) for the overall MGH population . The odds ratios measure the relative odds of occurrence of a readmission, given exposure to the covariates in the model . Odds ratios that were statistically significant using a 95% confidence interval are discussed as findings . They are interpreted as follows:
• Odds ratios greater than 1 suggest higher odds of readmission with exposure to the characteristic .
• Odds ratios less than 1 suggest lower odds of readmission with exposure to the characteristic .
• Odds ratios equal to 1 suggest exposure to the characteristic does not affect the odds of readmission .
This approach yielded some surprising results, mainly that neither LEP status nor race/ethnicity were significant predictors of readmission for MGH patients . These findings are aligned with our previous bivariate analysis, which showed LEP patients at the Mass General had lower readmission rates compared to English-speaking patients, and no disparities by race .
Overall, these results suggest other clinical and economic factors have the greatest effect on a patient’s likelihood of being readmitted .
• Patients with Medicaid as their primary payer were more likely to be readmitted than those with Medicare .
• One of the biggest predictors of readmission was the number of days in the hospital in the previous year . The odds of readmission increased by approximately 23% with each additional day of hospitalization in the prior year .
• MGH patients with multiple comorbidities were more likely to be readmitted . The odds of readmission increase by about 13% with each additional comorbidity .
• MGH patients who were discharged home with services had 44% higher odds of being readmitted compared to those who were discharged home without services .
• Similarly, patients discharged to other locations, such as long term care hospitals, had higher odds of readmission than those discharged home without services .
• Patients discharged from the OB/GYN, Urology and other services had reduced likelihood of readmission, relative to those discharged from the Medicine service . This finding is what we would expect based on readmission trends by service at Mass General .
20 MGH ANNUAL REPORT ON EQUITY IN HEALTH CARE QUALITY 2016–2017
Characteristics Contributing to the Odds of Readmission among MGH Patients
Characteristic Odds Ratio Odds of Readmission
Limited English Proficiency 1.015
Female .905*** Lower
Age .998** Lower
Asian & Pacific Islander (vs. white) 1.025
Black (vs. white) .965
Hispanic (vs. white) .938
Other (vs. white) .780
Commercial Payer (vs. Medicare) .964
Medicaid (vs. Medicare) 1.066*** Higher
Other Payer (vs. Medicare) .904 Lower
Socioeconomic Status Score .992
Number Admission Prior 365 Days 1.227*** Higher
Elixhauser Comorbidity Index 1.128*** Higher
Neurology Service (vs. Medicine) .757
OB/GYN Service (vs. Medicine) .343*** Lower
Other Service (vs. Medicine) .887** Lower
Psychiatry Service (vs. Medicine) .619
Surgery Service (vs. Medicine) .723
Urology Service (vs. Medicine) .785** Lower
Home Health Care (vs. Home) 1.442*** Higher
Skilled Nursing Facility or Hospital (vs. Home) .848** Lower
Other Discharge Location (vs. Home) 1.247** Higher
** Statistical significance with p<.05; *** statistical significance with P<.01.
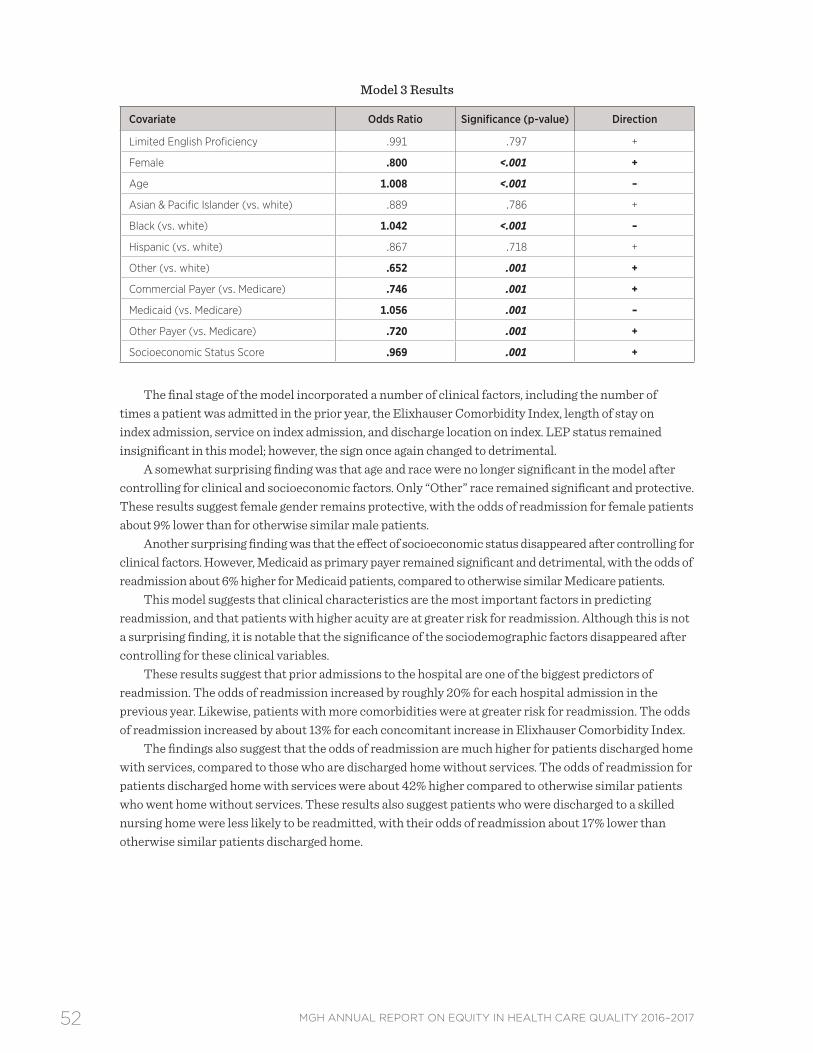
Discussion & Future DirectionsThis multivariate analysis revealed some notable findings about the effects of primary language and race on readmission rates at Mass General . The results suggest that readmission rates at the Mass General are most influenced by clinical factors such as previous hospital admissions, a higher number of comorbidities, and discharge location . Patients who are discharged home with services appear to be at greater risk for readmission . White, English-speaking patients with Medicaid as their primary payer appear to be at higher risk for readmission, but Medicaid status was not a significant predictor for LEP or minority patients .
Based on these data, neither primary language nor race were found to be significant predictors of readmission for Mass General patients . Though reassuring, this finding is somewhat surprising because we expected to see some impact for race and language based on prior research .8,9 Perhaps these patients have other protective factors that cannot be directly measured, such as stronger family ties and greater social support . Another possibility is that LEP patients are readmitted elsewhere . One limitation of our dataset is it only includes readmissions to Mass General . If LEP or minority patients are more likely to be readmitted elsewhere, we would not be able to pick up on that association with these data .
Our findings on socioeconomic status were particularly interesting, given other studies that have found a strong correlation between SES and readmission .8,10 Our SES data were coded at the block level, and therefore represent a proxy of SES . Our hospital, like many others, does not collect individual
21MGH ANNUAL REPORT ON EQUITY IN HEALTH CARE QUALITY 2016–2017
data on household income and education, and the Census approach is commonly used as a proxy SES measure .11,12 In this study, the effect of SES disappeared after controlling for clinical factors, suggesting that patient acuity and the matrix of clinical factors is a greater influence on readmission rates than socio-economic status . In other words, patients with multiple previous hospitalizations and multiple comorbidities were more likely to be readmitted, regardless of their socio-economic status .
Yet, patients with Medicaid as their primary payer remained at higher risk for readmission, independent of SES . Research by the Massachusetts Hospital Association8 suggests the Medicaid population in Massachusetts is more likely to have multiple comorbidities, including psychiatric diagnoses, which may increase the risk of readmission . Surprisingly though, this finding was not robust with regard to LEP or minority status . Medicaid status appears to be a more important predictor for white, English speaking patients .
These findings also suggest patients who were discharged home with services were more likely to be readmitted, compared to those who are sent home without services . These patients have sufficient medical complications to require additional in-home support, but not enough to warrant skilled nursing care . Perhaps these patients are more likely to live alone or have less social support than those who are sent home without services . This is an important finding that suggests more could be done to monitor and coordinate care for these patients . The Mass General is testing a new care model that involves nurse practitioner home visits and phone check-ins for patients with complex medical issues who are sent home with services . These results support the need for that intervention and improved care coordination .
We conducted several additional sensitivity analyses which are discussed in the technical appendix of this report, including running stratified models by race and language to detect any differences in predictors of readmission within the groups of interest . These additional analyses suggest our findings are robust and reliable for Mass General patients . We cannot say that these finding are generalizable to patients at other hospitals in the area . Perhaps the LEP patients who choose Mass General are somehow different from those who may choose other hospitals .
Although we did not find evidence of a disparity by LEP status, these results highlight the need to pay particular attention to medically complex patients—many of whom may not speak English as their primary language . These results suggest patients with multiple comorbidities and hospitalizations, and who are discharged home with services are particularly at risk . Some of these patients will have the additional challenge of not speaking English as their primary language, and these patients warrant special attention . The Mass General offers comprehensive interpreter services to LEP patients, and these findings highlight the importance of using a professional interpreter, especially in situations where LEP patients are at high risk for readmission .
It may be worthwhile to explore the hospital’s data on interpreter services to understand the characteristics of the patients served . It is possible that the use of an interpreter, particularly in high risk patients, reduces the risk of readmission for LEP patients . Future analyses linking the readmission data to interpreter services data could address questions about the mode and frequency of interpreter services during the inpatient stay and whether the use of interpreter services has a positive impact on reducing readmissions for non-English speaking patients .
It may also be worthwhile to revise the model to explore contributors to readmission within certain disease groupings,13 such as heart failure or chronic obstructive pulmonary disease . It is possible that we did not detect disease-specific disparities in readmission by looking at the broader patterns of readmission across the Mass General population as a whole .
Overall, these findings are encouraging from a health equity point of view . Neither English proficiency nor race were significant predictors of readmission . Yet, the results echo other studies on Mass General’s readmission rates, which suggest the patients who are readmitted here tend to be very complex and require additional coordination and support .14 It is important for Mass General to not lose sight of the additional complexities and needs of LEP patients who are at high risk for readmission .
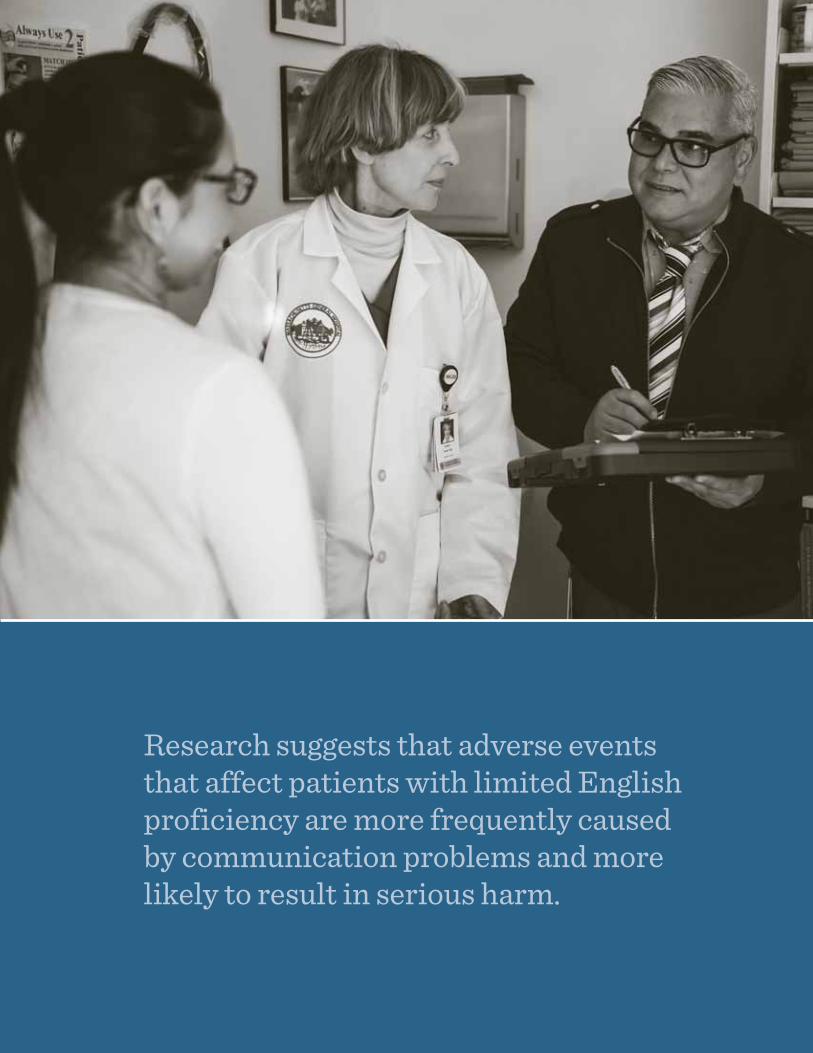
Research suggests that adverse events that affect patients with limited English proficiency are more frequently caused by communication problems and more likely to result in serious harm.
23MGH ANNUAL REPORT ON EQUITY IN HEALTH CARE QUALITY 2016–2017
IMPROVEMENT INITIATIVES: PATIENTS WITH LIMITED ENGLISH PROFICIENCY
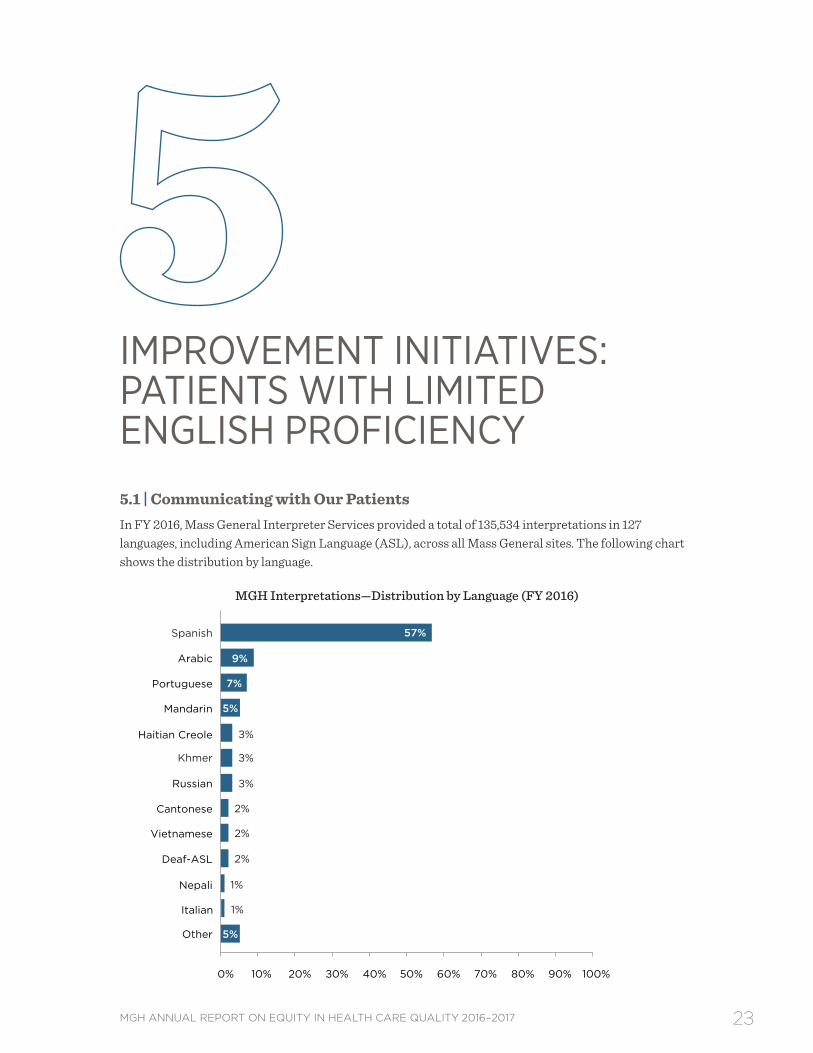
5.1 | Communicating with Our Patients In FY 2016, Mass General Interpreter Services provided a total of 135,534 interpretations in 127 languages, including American Sign Language (ASL), across all Mass General sites . The following chart shows the distribution by language .
MGH Interpretations—Distribution by Language (FY 2016)
1% Nepali
5% Other
2% Deaf-ASL
2% Cantonese
3% Russian
3% Khmer
3% Haitian Creole
Mandarin
7% Portuguese
9% Arabic
57% Spanish
0% 10% 20% 30% 40% 50% 60% 70% 80% 90% 100%
1% Italian
2% Vietnamese
5%
24 MGH ANNUAL REPORT ON EQUITY IN HEALTH CARE QUALITY 2016–2017
Of the 135,534 interpretations, 35% (n=35,997) were face-to-face, 60% (n=91,629) were telephonic, and 15% (n=7,908) were video interpretations . Video interpretations saw a slight decrease from the previous year . Based on the technological initiatives put in place the prior year, the goal was set to provide MGH interpreters to as many of our patient/provider encounters as possible . MGH interpreters were able to increase face-to-face interpretations by 3 .4% and telephonic interpretations by 5 .3% . Technology allowed for greater access to MGH interpreters over various modalities . This resulted in the department’s ability to provide MGH interpreters to these encounters more than 56% percent of the time . Not only have these efforts created efficiencies, reduced costs, and increased productivity, but patients and providers were offered more timely, highly qualified, and more experienced professional medical interpreters .
5.2 | Improving Care for Patients with Limited English ProficiencyThe role of language barriers and their impact on adverse events is now receiving greater attention . Research suggests that adverse events that affect patients with LEP are more frequently caused by communication problems and more likely to result in serious harm, compared to English-speaking patients .15 Language barriers also lead to longer length of stay and higher readmission rates .16 To address this, the Joint Commission has developed a set of standards on patient-centered communication that emphasize the importance of language, cultural competence, and patient-centered care, and hospitals seeking accreditation were expected to comply with these recommendations as of 2012 .
As part of efforts to develop strategies and systems to prevent medical errors and address disparities between patients with LEP and English-speaking patients, the following initiatives are being undertaken:
Training for Mass General Clinicians on Providing Safe Care for Patients with LEPThe Disparities Solutions Center, in collaboration with the MGH Institute of Health Professions, developed the interprofessional curriculum, Providing Safe, Effective Care for Patients with Limited English Proficiency . The program consists of three e-learning modules that address the evidence of disparities and high rate of medical errors for patients with LEP, provide training on concrete skills for working with professional interpreters as integral members of the care team, and explore how systems of care can be improved for patients with LEP . Following a successful pilot with physicians and midwives in the Department of Obstetrics in 2014, the module on working with interpreters was rolled out as part of the MGPO’s mandatory training requirements in FY 2016 and FY 2017 for MDs, PhDs, trainees, physician assistants, nurse practitioners, and ambulatory nurses . The training has reached a total of 6,046 Mass General employees to date . In FY 2017, all three modules were adapted for broader roll-out throughout the Partners system . Modules will be assigned to providers, frontline staff, and non-patient facing employees based on the content that is most relevant to their roles .
Clinical Process Improvement Leadership Program (CPIP) on the Pediatric FloorsAn interdisciplinary group including nursing, residents, hospitalists, and support staff on the pediatric inpatient floors (Ellison 17 and 18) was formed as part of the CPIP program to identify and address the needs of patients with LEP and their families . Based on feedback from a staff survey, certain barriers to care were identified: the time required to locate and connect IPOPs/VPOPs (Interpreter Phones on a Pole and Video Phones on a Pole), and the length of time for an in-person interpreter to arrive on the floor . Additional IPOPs/VPOPs were obtained for Ellison 17 and 18, and staff were instructed to leave a device in each LEP patient room from the time of admission to the time of discharge . Education was provided to nursing, residents, and pediatric hospitalists regarding accessing interpreter services and indications for placement of phones . Through a series of PDSA cycles (Plan, Do, Study, Act) a trend toward an increased number of interpretations per day was identified . Planning is in process for further outreach to medical subspecialty attendings and surgical teams on the floors, as well as sharing lessons learned with teams in other pediatric inpatient units in the hospital so they can identify and address similar disparities .
25MGH ANNUAL REPORT ON EQUITY IN HEALTH CARE QUALITY 2016–2017
Rounding on Newly Admitted Patients with LEPMass General Medical Interpreter Services is partnering with Volunteer Services to create a program to round on newly admitted patients with LEP to introduce them to the language services available at Mass General, provide business cards in their language with phone numbers on how to contact Interpreter Services, and inform them of their right to a professional medical interpreter at no cost . Additional resources that will be made available to patients include Point to Talk booklets in their language and VPOPs (Video Phones on a Pole) . The objective is to ensure that patients and families know that language assistance is available 24/7 in a variety of modalities; and make it easy for clinicians to work with a professional medical interpreter by ensuring that devices for interpretation are readily available in the room .
26 MGH ANNUAL REPORT ON EQUITY IN HEALTH CARE QUALITY 2016–2017
Patients with MassHealth as their primary payer are more likely to be non-white and non-English speaking, making them an important population to seek out disparities in care.
27MGH ANNUAL REPORT ON EQUITY IN HEALTH CARE QUALITY 2016–2017
DEPARTMENT-SPECIFIC QUALITY MEASURES
MassHealth and Joint Commission Perinatal Quality MeasuresMass General submits data to MassHealth, the Massachusetts Medicaid program, as well as the Joint Commission (TJC) on several maternity quality measures . Patients with MassHealth as their primary payer are more likely to be non-white and non-English speaking, making them an important population to seek out disparities in care . The Joint Commission measures represent a sample of all obstetrics patients, regardless of payer . We report on three years of data at a time to ensure an adequate sample size to detect a disparity . There are two quality measures with three or more years of data: Intrapartum Antibiotic Prophylaxis for Group B Streptococcus (MassHealth), and Cesarean Births (TJC) .
Group B StreptococcusGroup B strep (GBS) is a bacterium that can cause life-threatening infections in newborns .17,18 Perinatal GBS infection is preventable with the administration of intrapartum antibiotics to women at risk of transmitting the bacterium their newborns, largely as determined by results of screening cultures .19 Studies have confirmed that Black infants have higher rates of early-onset GBS compared with white infants, and that Black women are more likely to carry GBS, a known risk factor for late-onset disease .20–27 Additionally, a 2002–2003 study in North Carolina found that Hispanic women receiving care at a hospital or health department clinic were less likely to receive prenatal screening for GBS .19 Another study in Northern California found that Black women were less likely to be screened, seemingly related to practice variation in an era before screening was the standard of care for GBS prevention .24
This measure is reported to MassHealth only . Mass General data submitted to MassHealth from 2009–2012 suggested a disparity in administration/documentation of appropriate intrapartum antibiotic prophylaxis for Group B streptococcus among eligible patients with limited English proficiency . Based on chart review analysis, the Department of Obstetrics and Gynecology found that the disparity was partially attributable to precipitous deliveries, defined as a labor that lasts no more than three hours from onset of regular contractions to delivery, as well as unscheduled Cesarean deliveries .
Following review of the cases in which appropriate intrapartum antibiotic prophylaxis was not delivered, the Department of Obstetrics and Gynecology reviewed protocols and patient scenarios to encourage appropriate antibiotic use, particularly in cases in which patients arrive to the hospital in later
28 MGH ANNUAL REPORT ON EQUITY IN HEALTH CARE QUALITY 2016–2017
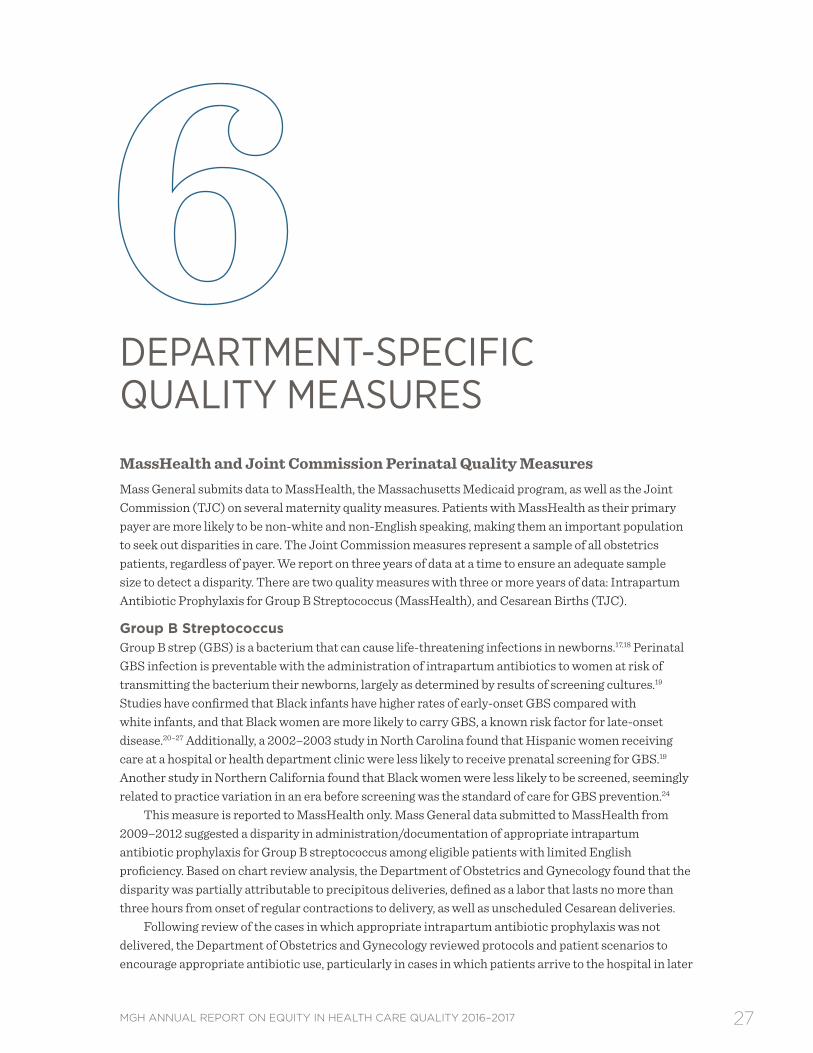
stages of labor or in need of unscheduled Cesarean deliveries . Mass General OB leadership continues to reinforce to providers the importance of encouraging women colonized with GBS to present early in labor . The disparity in appropriate antibiotic use by primary language is no longer apparent and that result has been sustained for four consecutive years . Efforts to monitor performance on this measure and achieve high reliability care for all women continue within the department .
Intrapartum Antibiotic Prophylaxis for GBS, Mass Health Population*
* P < 0.05, difference in responses for patients reporting belonging to other race/primary language group compared to the Non-Hispanic white and English-speaking respondent using Chi-Square test. Statistically significant scores are show in bold italics.
29MGH ANNUAL REPORT ON EQUITY IN HEALTH CARE QUALITY 2016–2017
NTSV Cesarean DeliveriesThe Cesarean delivery rate in the U .S . has been steadily rising over the last two decades, reaching its highest rate of 32 .9% in 2009 .28 These deliveries are associated with increased maternal morbidity, longer recovery period, and future pregnancy complications .
Approximately 60% of all Cesarean deliveries are first Cesarean deliveries . Nationally, fewer than one in 10 women with a prior Cesarean delivery will have a vaginal birth in a later pregnancy .29 For this reason, efforts to reduce the Cesarean delivery rate have focused on women who are at “low risk” to require a first Cesarean delivery, defined as nulliparous (first-time mothers) and term (greater or equal to 37 weeks) women carrying a singleton and vertex-presenting (head down) fetus, or NTSV . Since 2009, several national organizations have issued objectives to track Cesarean deliveries among women with NTSV pregnancies, including the U .S . Department of Health and Human services, the Joint Commission, and the American College of Obstetricians and Gynecologists .
Mass General has submitted data to the Joint Commission on NTSV Cesarean section rates since 2013 . We explored NTSV Cesarean delivery rates among white/non-white and English/non-English speaking patients . No evidence of a disparity was present for either group .
* P < 0.05, difference in responses for patients reporting belonging to other race/primary language group compared to the Non-Hispanic white and English-speaking respondent using Chi-Square test. Statistically significant scores are show in bold italics.
30 MGH ANNUAL REPORT ON EQUITY IN HEALTH CARE QUALITY 2016–2017
Public reporting of quality measures is an important intervention for reducing disparities.
31MGH ANNUAL REPORT ON EQUITY IN HEALTH CARE QUALITY 2016–2017
RACIAL AND ETHNIC DISPARITIES: STANDARD REPORTING MEASURES 7.1 | Inpatient Clinical Quality Indicators
National Hospital Quality MeasuresMass General reports National Hospital Quality Measures (NHQMs) on stroke care, venous thromboembolism (VTE), endoscopy surveillance for colon polyps, and Influenza immunization rates to CMS and the Joint Commission as part of nationally mandated public quality reporting on clinical processes of care . The NHQMs are analyzed and reported by race (for white and Other), and primary language (for English and Other) . We include three years of data to ensure a large enough sample size to detect disparities by race and language .
Mass General has analyzed the NHQMs since the inception of this report, as they provide an opportunity to explore potential disparities in key clinical processes . However, many of the NHQMs reported below were discontinued by CMS and the Joint Commission in 2016 because performance has topped out at or near 100% nationwide . Evidence of disparities lessens as providers approach uniform high quality on publicly reported measures, which is why public reporting of quality measures is an important intervention for reducing disparities .
Based on the most recent three-year sample of patients, we see some evidence of a disparity in clinical processes for stroke care, with non-English speaking patients less likely to receive anticoagulation therapy for atrial flutter . Yet, these results must be interpreted with caution . As providers move toward uniform high quality, a small number of failures can result in a statistically significant finding, particularly when coupled with small sample sizes for minority/non-English speaking patients . These statistically-significant results were driven by 3 failures on this measure .
Case review suggests failures were the result of incorrect documentation rather than failure to provide the appropriate care . In fact, case review determined that none of the three patients had atrial fibrillation and therefore did not require anticoagulation . These cases failed because the physicians incorrectly indicated the patient had a history of afib, when they intended to indicate the patient was evaluated for afib . This was caused by confusing prompts in the electronic medical record, which were subsequently changed to be more clear . Unfortunately, these cases still counted as failures in the measure
32 MGH ANNUAL REPORT ON EQUITY IN HEALTH CARE QUALITY 2016–2017
even though it was a documentation issue not a care issue . CMS is very precise in their requirements for what qualifies as appropriate documentation; but there have been instances where although evidence of proper care is in the record, it is not documented in a way that meets CMS requirements .
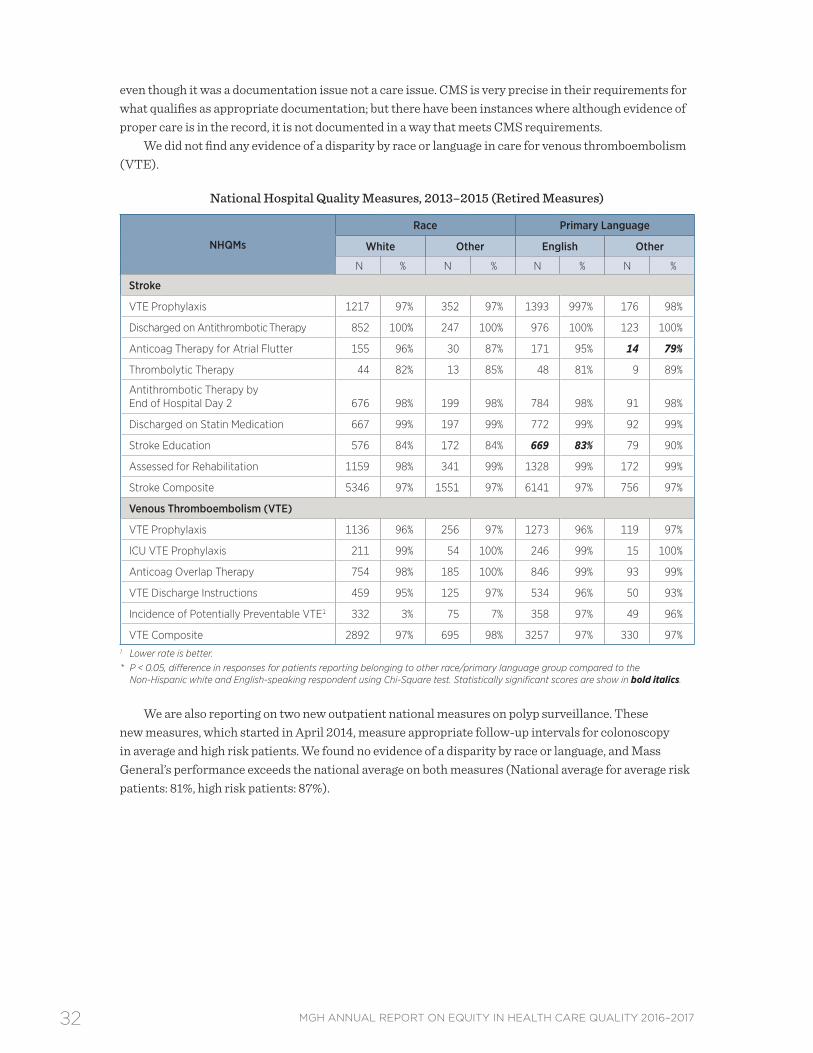
We did not find any evidence of a disparity by race or language in care for venous thromboembolism (VTE) .
National Hospital Quality Measures, 2013–2015 (Retired Measures)
VTE Composite 2892 97% 695 98% 3257 97% 330 97%1 Lower rate is better. * P < 0.05, difference in responses for patients reporting belonging to other race/primary language group compared to the
Non-Hispanic white and English-speaking respondent using Chi-Square test. Statistically significant scores are show in bold italics.
We are also reporting on two new outpatient national measures on polyp surveillance . These new measures, which started in April 2014, measure appropriate follow-up intervals for colonoscopy in average and high risk patients . We found no evidence of a disparity by race or language, and Mass General’s performance exceeds the national average on both measures (National average for average risk patients: 81%, high risk patients: 87%) .
33MGH ANNUAL REPORT ON EQUITY IN HEALTH CARE QUALITY 2016–2017
National Hospital Quality Measures, New Endoscopy Measures (April 2014–December 2016)
NHQMs
Race Primary Language
White Other English Other
N % N % N % N %
Endoscopy/Polyp Surveillance*
Appropriate Follow-up Interval for Normal Colonoscopy in Average Risk Patients
235 93% 58 94% 262 93% 31 94%
Colonoscopy Interval for patients with a History of Adenomatous Polyps— Avoidance of Inappropriate Use
266 95% 38 100% 286 95% 18 100%
* P < 0.05, difference in responses for patients reporting belonging to other race/primary language group compared to the Non-Hispanic white and English-speaking respondent using Chi-Square test. Statistically significant scores are show in bold italics.
Influenza VaccinationThe literature suggests rates of Influenza vaccination among adults age 18 and older are significantly lower among Hispanics and non-Hispanic Blacks than among non-Hispanic whites .30 Hispanic patients whose preferred language is Spanish are significantly less likely to receive flu vaccinations compared with those who prefer to speak English .31,32 Possible explanations for these disparities include language barriers and poor communication between providers and patients, patient knowledge and attitudes toward flu vaccination, and health provider bias .33,34
In 2012, CMS and the Joint Commission added a new measure for Influenza vaccination, which tracks vaccination for all inpatients regardless of diagnosis (previous measures were limited to patients with pneumonia) . We now have data for four consective Influenza seasons, and have not seen any evidence to date of a disparity by race or language . This finding is reassuring given the evidence of lower vaccination rates for these populations in the literature .
Inpatient Influenza Vaccination Rates*
Time Period
Race/Ethnicity
White All Non-White (excludes unknown)
N % N %
October 2012–March 2013 426 99% 105 99%
October 2013–March 2014 444 95% 95 99%
October 2014–March 2015 432 96% 91 98%
October 2015–March 2016 399 95% 104 97%
October 2016–March 2017 413 99% 100 97%
* Comparison is statistically significant at P<0.05 using CHI Square Test. Statistically significant scores are show in bold italics.
34 MGH ANNUAL REPORT ON EQUITY IN HEALTH CARE QUALITY 2016–2017
7.2 | Outpatient Clinical Quality Indicators
Linking Patients to Primary Care PhysiciansNational literature suggests people with a usual source of care tend to have better health outcomes and experience fewer disparities .35 Being linked to a primary care physician (PCP) is especially important, as PCPs develop ongoing relationships with patients and provide integrated services in the context of the patients’ family and community .35 In one study, patients who identified the ED or a hospital outpatient clinic as their usual source of care were more likely to postpone care than those who identified a specific practice as their usual source of care . Racial and ethnic disparities disappeared when controlling for usual source of care .36 Finally, patients who have both a usual place of care and a usual care provider have consistently higher rates of having received preventative services than those who are linked to a usual place of care only or are not linked at all .37
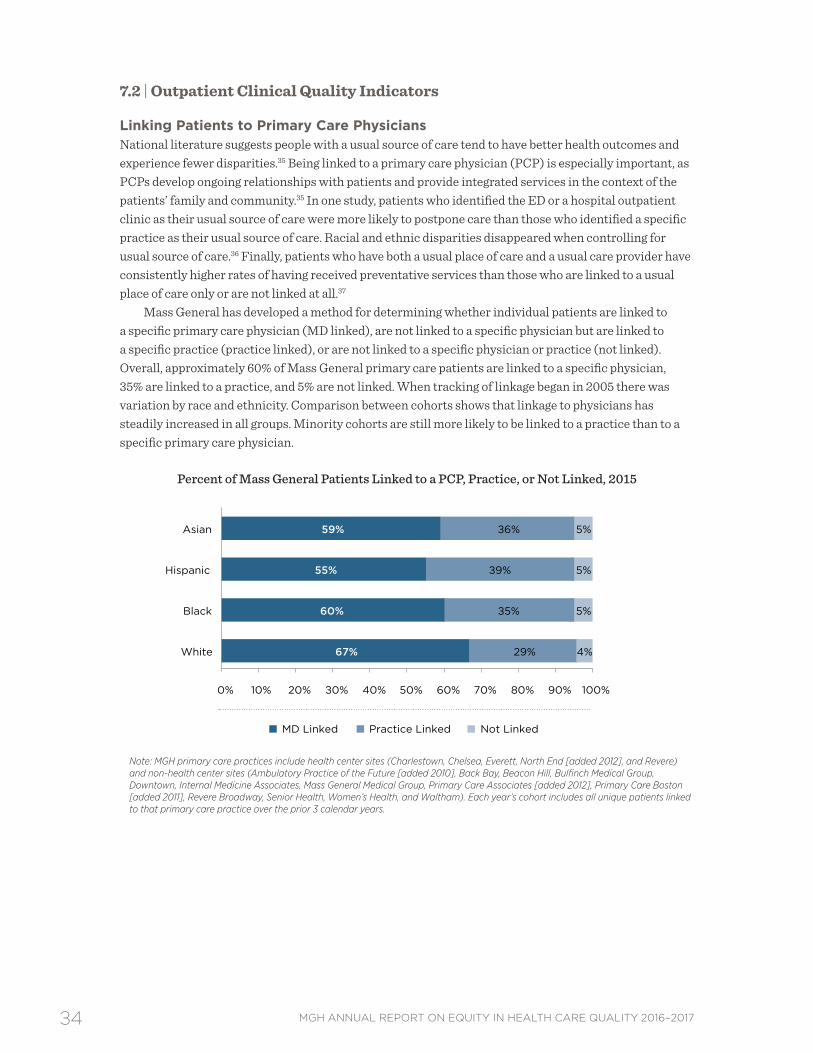
Mass General has developed a method for determining whether individual patients are linked to a specific primary care physician (MD linked), are not linked to a specific physician but are linked to a specific practice (practice linked), or are not linked to a specific physician or practice (not linked) . Overall, approximately 60% of Mass General primary care patients are linked to a specific physician, 35% are linked to a practice, and 5% are not linked . When tracking of linkage began in 2005 there was variation by race and ethnicity . Comparison between cohorts shows that linkage to physicians has steadily increased in all groups . Minority cohorts are still more likely to be linked to a practice than to a specific primary care physician .
Percent of Mass General Patients Linked to a PCP, Practice, or Not Linked, 2015
Note: MGH primary care practices include health center sites (Charlestown, Chelsea, Everett, North End [added 2012], and Revere) and non-health center sites (Ambulatory Practice of the Future [added 2010], Back Bay, Beacon Hill, Bulfinch Medical Group, Downtown, Internal Medicine Associates, Mass General Medical Group, Primary Care Associates [added 2012], Primary Care Boston [added 2011], Revere Broadway, Senior Health, Women’s Health, and Waltham). Each year’s cohort includes all unique patients linked to that primary care practice over the prior 3 calendar years.
67%
60%
55%
59%
29%
35%
39%
36%
4%
5%
5%
5%
0% 10% 20% 30% 40% 50% 60% 70% 80% 90% 100%
White
Black
Hispanic
Asian
MD Linked Practice Linked Not Linked
35MGH ANNUAL REPORT ON EQUITY IN HEALTH CARE QUALITY 2016–2017
HEDIS Measures by Linkage CategoryThe outpatient clinical quality indicators show performance measures based on HEDIS (Healthcare Effectiveness Data and Information Set) standards for patients seen between 2013 and 2015 . As in other sections of the report, results are based on comparison of racial and ethnic minority groups to the white reference group . For nearly all comparisons, adherence rates were higher for patients linked to a physician compared to patients linked to a practice . These findings indicate an opportunity to evaluate the practice-specific model to identify opportunities for performance improvement . While there are differences in adherence rates for each measure by race, patterns are not consistent across measures, and the results are not adjusted for clinical severity .
Racial and ethnic disparities were found at Mass General in three out of seven measures analyzed (breast, cervical, and colorectal cancer screening):
• Breast and cervical cancer screening rates were lower for Asians in practice-linked arrangements, compared to whites . Hispanics and patients identifying as Other race had higher screening rates for these measures .
• Asians (physician linked) and African Americans (practice linked) had lower screening rates for colorectal cancer, while Hispanics (physician linked) had higher screening rates .
• No disparities were evident in diabetes care or coronary artery disease . In fact, patients identifying as Other race had higher screening rates for both measures of diabetes care, compared to whites . Diabetic patients identifying as African American also had higher rates of HbA1c screening compared to whites . Asian patients in physician linked arrangements had higher HbA1c screening rates compared to whites . Patients with coronary artery disease identifying as Other race had higher rates of LDL testing compared to whites (practice linked cohort) .
Disparities in cancer screening rates for Asians are reflected in the national literature . According to the 2013 National Health Interview Survey, overall screening rates were 72 .4% for breast cancer, 80 .8% for cervical cancer, and 58 .6% for colorectal cancer . The screening rates for breast, cervical, and colorectal cancer were lower for Asian Americans than for white Americans (50 .3% vs . 52 .1% for breast cancer, 70 .6% vs . 82 .8% for cervical cancer, and 53 .2% vs . 60 .5% for colorectal cancer) .38 Research has shown that foreign birth and limited English proficiency may be associated with lower screening rates among Asian Americans .39–41 Additionally cultural beliefs (modesty, shame, and fatalism) and structural barriers to care (lack of insurance and distance to healthcare services) may negatively impact cancer screening rates among Asian American immigrants .38,41
Efforts to improve quality of care measures for all Mass General patients, including racial and ethnic minorities, include a population health program targeting chronic disease management and cancer prevention . This program specifically addresses gaps in care between patients with well-established ties to a primary care physician and those whose care is more sporadic and is only linked to a practice rather than a specific physician . Many of these “practice-linked” patients have socioeconomic and other barriers to accessing care that are being addressed through efforts that move care outside of the office visit . Moreover, these population health efforts are also working to coordinate with patient navigator programs that are focused on Mass General community health centers and target those individuals who have language or cultural barriers to care .
36 MGH ANNUAL REPORT ON EQUITY IN HEALTH CARE QUALITY 2016–2017
HEDIS Quality Indicators Stratified by Physician or Practice-Linked Patients, 2013–2015
Service
Race/Ethnicity
White African American Hispanic Asian Other (excludes
P < 0.05, difference in screening adherence comparing selected race group to those in the white race category, controlling for patient age, practice location, & gender if applicable. Statistically significant differences in scores are shown in bold italics.
Note: Outpatient clinical quality indicators were supplied by the Primary Care Operations Improvement program. MGH primary care practices include health center sites (Charlestown, Chelsea, Everett, North End [added 2012], and Revere) and non-health center sites (Ambulatory Practice of the Future [added 2010], Back Bay, Beacon Hill, Bulfinch Medical Group, Downtown, Everett, Internal Medicine Associates, Mass General Medical Group, Primary Care Associates [added 2012], Primary Care Boston [added 2011], Revere Broadway, Senior Health, Women’s Health, and Waltham). Each year’s cohort includes all unique patients linked to that primary care practice over the prior 3 calendar years.” Non-Partners data are not completely captured. Data sources vary for each outcome, so one should focus on relative differences rather than absolute differences among measures and physician/practice linkages. White is the reference for racial and ethnic group comparison. The “Other” category includes all races other than white, Asian, Black, or Hispanic, including Native American, Pacific Islander, and Declined to Answer. The computer system also allows for a choice of Other.
37MGH ANNUAL REPORT ON EQUITY IN HEALTH CARE QUALITY 2016–2017
7.3 | Patient Experiences of Care
Analysis of HCAHPS and C/G-CAHPSMass General has been collecting patient experience data through the inpatient HCAHPS survey since 2007 and the ambulatory C/G-CAHPS survey since 2008 . Surveys are administered in English and Spanish . This report reflects responses from January 2014 through December 2016 . Results are presented as the percentage of patients who provide the most positive response to a given question (i .e . top-box score), divided by the number of patients who provide any response to the question .
Inpatient (HCAHPS)Results for inpatient HCAHPS scores are consistent with prior findings and suggest differences by race, ethnicity, and language in the following areas:
• Asian/Pacific Islander patients reported significantly less positive experiences than non-Hispanic whites for 5 of 11 measures . Conversely, for 1 measure (quiet at night), patients who identified themselves as Asian or Pacific Islander reported more positive experiences than non-Hispanic whites .
• Hispanics reported significantly more positive experiences with care than non-Hispanic whites for 8 of 11 measures .
• For the quiet at night measure, almost all racial and ethnic groups reported a more positive experience than the non-Hispanic white reference group .
• In 2014, new measures of Care Transitions were added to the HCAHPS survey to assess patient experience with the coordination of care during the discharge process, and we now have 3 years of data to explore disparities in this important dimension of patient experience . These questions address patients’ understanding of their self-care role after leaving the hospital, medication management, and recognition of their preferences in the care plan . Hispanic, Asian/Pacific Islander, and patients of Other race reported significantly more negative experiences on care transitions than non-Hispanic whites . It is notable that the response options for the Care Transitions questions differ from the other survey domains (Strongly Disagree, Disagree, Agree, Strongly Agree for Care Transitions, versus Never, Sometimes, Usually, Always for all other questions) . This structural difference may be driving some of the lower scores . The national 90th percentile for the Care Transitions composite measure is relatively low at 61%iv suggesting providers nationwide have some distance to go to achieve uniform high quality on these measures .
• Spanish-speaking respondents reported significantly more positive experiences compared to the English-speaking cohort for 10 of the 11 inpatient measures . For the most recently added measure (Care Transitions), Spanish-speaking respondents reported significantly more negative experiences than English-speaking respondents .
iv Source: http://www .hcahpsonline .org, CMS, Baltimore, MD . October 2, 2017 .
38 MGH ANNUAL REPORT ON EQUITY IN HEALTH CARE QUALITY 2016–2017
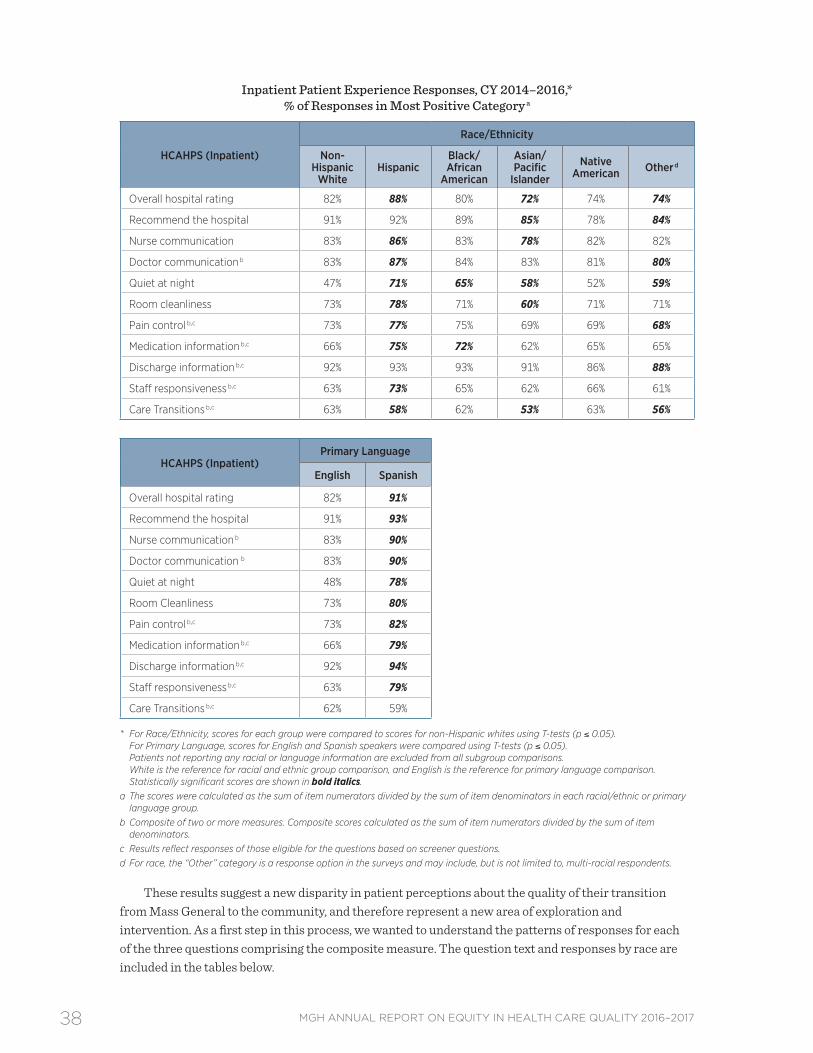
Inpatient Patient Experience Responses, CY 2014–2016,* % of Responses in Most Positive Category a
HCAHPS (Inpatient)
Race/Ethnicity
Non-Hispanic
WhiteHispanic
Black/African
American
Asian/Pacific
Islander
NativeAmerican Other d
Overall hospital rating 82% 88% 80% 72% 74% 74%
Recommend the hospital 91% 92% 89% 85% 78% 84%
Nurse communication 83% 86% 83% 78% 82% 82%
Doctor communication b 83% 87% 84% 83% 81% 80%
Quiet at night 47% 71% 65% 58% 52% 59%
Room cleanliness 73% 78% 71% 60% 71% 71%
Pain control b,c 73% 77% 75% 69% 69% 68%
Medication information b,c 66% 75% 72% 62% 65% 65%
Discharge information b,c 92% 93% 93% 91% 86% 88%
Staff responsiveness b,c 63% 73% 65% 62% 66% 61%
Care Transitions b,c 63% 58% 62% 53% 63% 56%
HCAHPS (Inpatient)Primary Language
English Spanish
Overall hospital rating 82% 91%
Recommend the hospital 91% 93%
Nurse communication b 83% 90%
Doctor communication b 83% 90%
Quiet at night 48% 78%
Room Cleanliness 73% 80%
Pain control b,c 73% 82%
Medication information b,c 66% 79%
Discharge information b,c 92% 94%
Staff responsiveness b,c 63% 79%
Care Transitions b,c 62% 59%
* For Race/Ethnicity, scores for each group were compared to scores for non-Hispanic whites using T-tests (p ≤ 0.05). For Primary Language, scores for English and Spanish speakers were compared using T-tests (p ≤ 0.05). Patients not reporting any racial or language information are excluded from all subgroup comparisons. White is the reference for racial and ethnic group comparison, and English is the reference for primary language comparison. Statistically significant scores are shown in bold italics.a The scores were calculated as the sum of item numerators divided by the sum of item denominators in each racial/ethnic or primary
language group.b Composite of two or more measures. Composite scores calculated as the sum of item numerators divided by the sum of item
denominators.c Results reflect responses of those eligible for the questions based on screener questions. d For race, the “Other” category is a response option in the surveys and may include, but is not limited to, multi-racial respondents.
These results suggest a new disparity in patient perceptions about the quality of their transition from Mass General to the community, and therefore represent a new area of exploration and intervention . As a first step in this process, we wanted to understand the patterns of responses for each of the three questions comprising the composite measure . The question text and responses by race are included in the tables below .
39MGH ANNUAL REPORT ON EQUITY IN HEALTH CARE QUALITY 2016–2017
Asian patients were the only racial/ethnic group to report statistically lower agreement with the first question about whether the staff took patient and family preferences into account at discharge . Asian, Hispanic and patients of “Other” races all reported statistically lower agreement on both questions about their understanding of their care plan . These findings suggest Mass General has an opportunity to better listen to our racially diverse patients, take their beliefs into account when developing care plans, and do more to ensure patients understand their discharge instructions and have a good sense of how to care for themselves when they leave the hospital .
We will continue to explore this area and develop specific interventions for improvement . A first step in that process will be to explore the survey comments for any themes that could help us improve, and potentially doing some focus groups or interviews with patients to learn more about their experience with the discharge process and what Mass General can do to improve the process for all patients .
Details of Questions Included in HCAHPS “Care Transitions” Composite
HCAHPS Question Number
Label Question Text Response Options
23 Patient/Family Preferences Taken into Account at Discharge
During this hospital stay, staff took my preferences and those of my family or caregiver into account in deciding what my health care needs would be when I left.
Top-Box Scoresa for Individual Items in HCAHPS “Care Transitions,” Composite by Racial/Ethnic Group, CY 2014–2016*
HCAHPS Item
Race/Ethnicity
Non-Hispanic
WhiteHispanic
Black/African-
American
Asian/Pacific
Islander
NativeAmerican Other b
Patient/Family Preferences Taken into Account at Discharge
54%(N=10,618)
51%(N=706)
51%(N=492)
38%(N=351)
48%(N=25)
51%(N=412)
Patient Had Good Understanding of Responsibilities for Managing Health at Discharge
66%(N=11,125)
61%(N=765)
63%(N=537)
57%(N=387)
75%(N=24)
60%(N=454)
Patient Understood Purpose for Taking Each Medication at Discharge
70%(N=8980)
65%(N=680)
73%(N=475)
62%(N=349)
72%(N=18)
60%(N=376)
* For Race/Ethnicity, scores for each group were compared to scores for non-Hispanic whites using T-tests (p ≤ 0.05). Patients not reporting any racial information are excluded from all subgroup comparisons. Statistically significant scores are shown in bold italics.
a The scores were calculated as the sum of item numerators divided by the sum of item denominators in each racial/ethnic or primary language group.
b For race, the “Other” category is a response option in the CAHPS surveys and may include, but is not limited to multi-racial respondents.
40 MGH ANNUAL REPORT ON EQUITY IN HEALTH CARE QUALITY 2016–2017
Outpatient (C/G-CAHPS)Results for ambulatory patient experience measures are consistent with prior findings . Although we have done work in this area to improve overall provider ratings and willingness to recommend, more work needs to be done .
• With regard to the overall provider rating measure, the results suggest a disparity (significantly lower rating) for all racial/ethnic groups compared to non-Hispanic whites, with the exception of the Native American cohort . This finding is consistent with past results at Mass General, with some improvement in top-box scores among Asian patients (from 71% to 74%) compared to the 2015 Equity Report .
• Respondents who identified as Asian/Pacific Islander or Other race reported significantly more negative experiences on the willingness to recommend measure .
• Spanish speaking patients reported significantly less positive overall provider ratings, but were significantly more likely to recommend their provider than non-Hispanic whites .
Differences among certain racial and ethnic groups should be interpreted with caution . There may be cultural barriers or norms at play, as well as perceptions of bias and discrimination that impact how different groups perceive their care experiences, as well as the healthcare system more broadly .42,43
Overall, the survey results are consistent with research in the field that demonstrates variations in patient-reported experiences by characteristics such as race, ethnicity, and culture .44 However, it is important not to generalize or stereotype entire populations based on these findings, given the heterogeneity within these groups . Instead, ways to explore the root causes of these differences and strategies to address them, as appropriate, must be considered . To that end, we plan to conduct a qualitative review of the comments to help put these scores into context and potentially identify improvement strategies .
Ambulatory Patient Experience Responses, CY 2014-2016,* % of Responses in Most Positive Category a
C/G-CAHPS (Ambulatory)
Race/Ethnicity
Non- Hispanic
WhiteHispanic
Black/African-
American
Asian/Pacific
Islander
Native American Other b
Overall provider rating 85% 81% 82% 74% 83% 77%
Willingness to recommend provider 90% 90% 89% 82% 90% 86%
C/G-CAHPS (Ambulatory)
Primary Language
English Spanish
Overall provider rating 84% 81%
Willingness to recommend provider 89% 92%
* For Race/Ethnicity, scores for each group were compared to scores for non-Hispanic whites using T-tests (p ≤ 0.05). For Primary Language, scores for English and Spanish speakers were compared using T-tests (p ≤ 0.05). Patients not reporting any racial or language information are excluded from all subgroup comparisons. White is the reference for racial and ethnic group comparison, and English is the reference for primary language comparison. Statistically significant scores are shown in bold italics. a The scores were calculated as the sum of item numerators divided by the sum of item denominators in each racial/ethnic or primary
language group.b For race, the “Other” category is a response option in the surveys and may include, but is not limited to, multi-racial respondents.
41MGH ANNUAL REPORT ON EQUITY IN HEALTH CARE QUALITY 2016–2017
Pediatric Patient ExperienceOutpatient pediatric patient experience data by race and primary language were also examined (C/G-CAHPS data, January 2014–December 2016) . Ratings reflect responses provided by the child’s caregiver . Again, these results are consistent with past findings .
• Asian/Pacific Islander respondents reported significantly lower overall provider ratings and willingness to recommend provider ratings than whites .
• Hispanic and Spanish-speaking respondents were significantly more likely to recommend their providers than non-Hispanic whites and English-speaking respondents .
• These findings are consistent with past analyses of pediatric patient experience results and warrant further analysis to understand the opportunities for improvement . Pediatric surveys will be included in the comment analysis; this work is planned for 2018 .
Ambulatory patient experience was a key area for quality improvement in 2015 and 2016 . Pediatric practices were encouraged to consider opportunities to address this disparity in their improvement plans . There is more work to be done, particularly with regard to understanding the lower patient experience ratings among Asian respondents .
These results show fewer disparities than the overall HCAHPS and C/G-CAHPS results . This is consistent with a large national study that found that the care provided to children is generally perceived more positively than care provided to adults . Research is limited on disparities in pediatric C/G-CAHPS results .45
Pediatric Patient Experience Reports, CY 2014–2016,* % of Responses in Most Positive Category a
C/G-CAHPS (Ambulatory)
Race/Ethnicity
Non-Hispanic White Hispanic Black/
African AmericanAsian/
Pacific Islander
Overall provider rating 81% 82% 81% 74%
Willingness to recommend provider 89% 91% 91% 86%
C/G-CAHPS (Ambulatory)
Primary Language
English Spanish
Overall provider rating 79% 82%
Willingness to recommend provider 88% 93%
* For Race/Ethnicity, scores for each group were compared to scores for non-Hispanic whites using T-tests (p ≤ 0.05). For Primary Language, scores for English and Spanish speakers were compared using T-tests (p ≤ 0.05). Patients not reporting any racial or language information are excluded from all subgroup comparisons. Statistically significant scores are shown in bold italics.
a The scores were calculated as the sum of item numerators divided by the sum of item denominators in each racial/ethnic or primary language group.
42 MGH ANNUAL REPORT ON EQUITY IN HEALTH CARE QUALITY 2016–2017
REFERENCES 1. Institute of Medicine Committee on Quality of Health Care in America . Crossing the Quality Chasm:
A new health system for the 21st century. National Academies Press; 2001 .2. Smedley BD, Stith AY, Nelson AR . Unequal Treatment: Confronting racial and ethnic disparities in
health care (full printed version) . National Academies Press; 2002 .3. 2016 National Healthcare Quality and Disparities Report. Rockville, MD: Agency for Healthcare
Research and Quality;July 2017 . AHRQ Pub . No . 17-0001 .4. Porter ME, Teisberg EO . Redefining health care: creating value-based competition on results. Harvard
Business Press; 2006 .5. AHC Media . Readmissions Are Down, Penalties Are Up—What Do You Do Now? Hospital Case
Management. January 2017;25(1):1–16 .6. Joynt KE, Jha AK . Thirty-day readmissions—truth and consequences . N Engl j med . Apr 12
2012;366(15):1366–1369 .7. Martsolf GR, Barrett ML, Weiss AJ, et al . Impact of Race/Ethnicity and Socioeconomic Status on
Risk-Adjusted Readmission Rates: Implications for the Hospital Readmissions Reduction Program . INQUIRY: The Journal of Health Care Organization, Provision, and Financing . 2016;53:1–9 .
8. Boutwell AE, Noga PM, Defossez SM . State of the State: Reducing Readmissions in Massachusetts. Burlington MA: Massachusetts Hospital Association; March 2016 .
9. Karliner LS, Kim SE, Meltzer DO, Auerbach AD . Influence of language barriers on outcomes of hospital care for general medicine inpatients . Journal of hospital medicine. May–Jun 2010;5(5):276–282 .
10. Joynt KE, Orav EJ, Jha AK . Thirty-day readmission rates for Medicare beneficiaries by race and site of care . JAMA. Feb 16 2011;305(7):675–681 .
11. Diez-Roux AV, Kiefe CI, Jacobs DR, Jr ., et al . Area characteristics and individual-level socioeconomic position indicators in three population-based epidemiologic studies . Annals of epidemiology. Aug 2001;11(6):395–405 .
12. Shahian DM, Meyer GS, Mort E, et al . Association of National Hospital Quality Measure adherence with long-term mortality and readmissions . BMJ quality & safety. Apr 2012;21(4):325–336 .
13. Kheirbek RE, Wojtusiak J, Vlaicu SO, Alemi F . Lack of Evidence for Racial Disparity in 30-Day All-Cause Readmission Rate for Older US Veterans Hospitalized with Heart Failure . Quality management in health care. Oct/Dec 2016;25(4):191–196 .
14. Cronin PR, Greenwald JL, Crevensten GC, Chueh HC, Zai AH . Development and implementation of a real-time 30-day readmission predictive model . AMIA Annu Symp proc. 2014;2014:424–431 .
15. Divi C, Koss RG, Schmaltz SP, Loeb JM . Language proficiency and adverse events in US hospitals: a pilot study . Int j qual health care . Apr 2007;19(2):60–67 .
16. Lindholm M, Hargraves JL, Ferguson WJ, Reed G . Professional language interpretation and inpatient length of stay and readmission rates . J Gen Intern Med. Oct 2012;27(10):1294–1299 .
17. MedicineNet . Definition of Infection, group B strep . Medterms http://www .medterms .com/script/main/art .asp?articlekey=8352 . Accessed July 1, 2013 .
18. About Group B Strep . Centers for Disease Control and Prevention http://www .cdc .gov/groupbstrep/about/index .html . Accessed July 1, 2013 .
19. Disparities in universal prenatal screening for group B streptococcus—North Carolina, 2002–2003 . Morbidity and Mortality Weekly Report . Vol 28: Centers for Disease Control and Prevention; 2005:700–703 .
43MGH ANNUAL REPORT ON EQUITY IN HEALTH CARE QUALITY 2016–2017
20. Phares CR, Lynfield R, Farley MM, et al . Epidemiology of invasive group B streptococcal disease in the United States, 1999–2005 . JAMA . May 7 2008;299(17):2056–2065 .
21. Schrag SJ, Zell ER, Lynfield R, et al . A population-based comparison of strategies to prevent early-onset group B streptococcal disease in neonates . N Engl j med . Jul 25 2002;347(4):233–239 .
22. Schuchat A, Wenger JD . Epidemiology of group B streptococcal disease . Risk factors, prevention strategies, and vaccine development . Epidemiol rev . 1994;16(2):374–402 .
23. Trends in perinatal group B streptococcal disease—United States, 2000–2006 . Morbidity and Mortality Weekly Report. Vol 58: Centers for Disease Control and Prevention; 2009:109–112 .
24. Bryant AS, Cheng YW, Caughey AB . Equality in Obstetrical Care: Racial/Ethnic Variation in Group B Streptococcus Screening . Matern Child Health J. Nov 2011;15(8):1160–1165 .
25. Hickman ME, Rench MA, Ferrieri P, Baker CJ . Changing epidemiology of group B streptococcal colonization . Pediatrics. 1999;104(2):203–209 .
26. Newton ER, Butler MC, Shain RN . Sexual behavior and vaginal colonization by group B streptococcus among minority women . Obstetrics & Gynecology. 1996;88(4):577–582 .
27. Taylor JK, Hall RW, Dupre AR . The incidence of group B streptococcus in the vaginal tracts of pregnant women in central Alabama . Clin lab sci. Winter 2002;15(1):16–17 .
28. Osterman MJ, Martin JA . Trends in low-risk cesarean delivery in the United States, 1990–2013 . Natl vital stat rep. Nov 5 2014;63(6):1–16 .
29. Curtin SC, Gregory KD, Korst LM, Uddin SF . Maternal Morbidity for Vaginal and Cesarean Deliveries, According to Previous Cesarean History: New Data From the Birth Certificate, 2013 . Natl vital stat rep. May 20 2015;64(4):1–13, back cover .
30. Seasonal Influenza Vaccination Coverage-United States, 2009-10 and 2010-11 . CDC Health Disparities and Inequalities Report—United States, MMWR Vol 62 (Suppl 3): Centers for Disease Control and Prevention; 2013:65–68 .
31. Pearson WS, Zhao G, Ford ES . An Analysis of Language as a Barrier to Receiving Influenza Vaccinations among an Elderly Hispanic Population in the United States . Adv prev med. 2011;298787 .
32. DuBard CA, Gizlice Z . Language spoken and differences in health status, access to care, and receipt of preventive services among US Hispanics . Am j public health. Nov 2008;98(11):2021–2028 .
33. Fiscella K . Commentary—anatomy of racial disparity in influenza vaccination . Health serv res. Apr 2005;40(2):539–549 .
34. Haviland AM, Elliott MN, Hambarsoomian K, Lurie N . Immunization disparities by Hispanic ethnicity and language preference . Arch intern med. Jan 24 2011;171(2):158–165 .
35. 2020 Topics & Objectives: Access to Health Services . US Department of Health and Human Services http://www .healthypeople .gov/2020/topicsobjectives2020/objectiveslist .aspx?topicId=1 . Accessed 19 December, 2013 .
36. Shi L, Nie X, Wang TF . Type of usual source of care and access to care . J ambul care manage. Jul–Sep 2013;36(3):209–221 .
37. Blewett LA, Johnson PJ, Lee B, Scal PB . When a usual source of care and usual provider matter: adult prevention and screening services . J Gen Intern Med. Sep 2008;23(9):1354–1360 .
38. American Cancer Society . Cancer Prevention & Early Detection Facts & Figures 2015–2016 . Atlanta: American Cancer Society; 2015 .
39. Kandula NR, Wen M, Jacobs EA, Lauderdale DS . Low rates of colorectal, cervical, and breast cancer screening in Asian Americans compared with non-Hispanic whites: Cultural influences or access to care? Cancer. Jul 1 2006;107(1):184–192 .
40. Lee HY, Ju E, Vang PD, Lundquist M . Breast and cervical cancer screening disparity among Asian American women: does race/ethnicity matter? J womens health (Larchmt) . Oct 2010;19(10):1877–1884 .
44 MGH ANNUAL REPORT ON EQUITY IN HEALTH CARE QUALITY 2016–2017
41. Pourat N, Kagawa-Singer M, Breen N, Sripipatana A . Access versus acculturation: identifying modifiable factors to promote cancer screening among Asian American women . Med Care. Dec 2010;48(12):1088–1096 .
42. Joint Pew Hispanic Center and Robert Wood Johnson Foundation . Hispanics and Healthcare in the United States: Access, Information, and Knowledge. August 2008 .
43. Sorkin DH, Ngo-Metzger Q, De Alba I . Racial/ethnic discrimination in health care: impact on perceived quality of care . J Gen Intern Med. May 2010;25(5):390–396 .
44. Elliott MN, Lehrman WG, Goldstein E, Hambarsoomian K, Beckett MK, Giordano LA . Do hospitals rank differently on HCAHPS for different patient subgroups? Medical Care Research and Review. 2010;67(1):56–73 .
45. Chen AY, Elliott MN, Spritzer KL, et al . Differences in CAHPS reports and ratings of health care provided to adults and children . Med Care. Nov 2012;50 Suppl:S35–39 .
46. Health Research and Educational Trust . Reducing health care disparities: Collection and use of race, ethnicity and language data. Chicago: Health Research & Educational Trust;2013 .
45MGH ANNUAL REPORT ON EQUITY IN HEALTH CARE QUALITY 2016–2017
APPENDIX A: METHODS AND DATA COLLECTIONThe data in this report are drawn from a wide variety of institutional sources (see Appendix C for a complete list of data sources) . The time periods vary depending on the measure and availability of data being presented . In several cases, groups needed to be combined into white and Other and English-speaking and Other groupings in order to meet minimum sample size requirements . For some measures, multiple years of data have been combined to ensure that sample sizes are adequate to draw meaningful conclusions . White and English-speaking groups are used as the reference group for statistical analyses throughout the report . Finally, the naming conventions for the data elements are based on the nomenclature of the data sources . This explains why in some cases “white” is used, while in other cases “Non-Hispanic white” is used .
Collection of Data on Race, Ethnicity, and Language at Mass GeneralIn July 2014, Mass General transitioned from its existing registration and billing system to Epic as part of the Partners-wide eCare implementation . In doing so, Mass General changed its race and ethnicity data collection slightly . In the past, when patients presented for registration, registrars asked them to identify first their race and then their ethnicity using categories that were standard across the state; whether a patient identified as Hispanic/Latino was included in the question about race . During registration in Epic, registrars now ask patients to first identify their ethnicity, then race, and then answer the OMB standard question “Hispanic/Latino: Yes/No .”
With the transition to Epic, the category lists for both ethnicity and race remain largely the same, using pre-existing lists as a model . Training surrounding the collection of this data remains the same as well . When a patient asks why Mass General requests this data, registration staff are trained to explain that we collect this information to better serve our diverse patient population . Because self-identification is the gold standard for collecting data on race and ethnicity,46 registrars are trained never to enter their perception of the patient’s race or ethnicity . If a patient does not wish to provide this information, registrars select the value of “Declined .” Patients rarely decline to answer these questions (1 .2% decline rate for race, and 4 .5% decline rate for ethnicity in CY 2015 .v If a patient’s stated race or ethnicity is not an option available to registrars in the system, the patient is registered with a code of “Other,” and additional information is entered in the free text fields to communicate the person’s self-reported race or ethnicity .
Registrars continue to collect data on patients’ preferred languages with the question, “In what language do you prefer to discuss health-related concerns?” With the implementation of Epic, registrars now ask an additional question regarding language preferences: “In what language do you prefer to receive written materials?”
Similarly, the data collection around patient disabilities slightly expanded with the implementation of Epic . In addition to pre-existing values (Blind/Visual Impairment, Cognitive, Deaf/Hard of Hearing, Physical/Congenital, Multiple, Declined, None, and Unavailable), Mass General registrars are now able to document Speech Impairments and Special Requests . A free-text comment box accompanies the value entered . As the ambulatory scheduling system and patient placement system (IDX and AllScripts, respectively) moved to Epic as well, this data continues to remain integrated across the front-end to allow for proactive accommodations for inpatients as well as outpatient practices .
v July 2014 coincides with the date of Epic go-live at Mass General . The decline rates are based on any new Mass General MRNs created or any MRNs with edited race and ethnicity information from July-December 2014 . Since Epic go-live, the decline rates have decreased and are leveling off close to the 2013 rates of 0 .9% for race and 3 .4% for ethnicity .
46 MGH ANNUAL REPORT ON EQUITY IN HEALTH CARE QUALITY 2016–2017
All data collected at the patient’s initial Mass General registration, including data on race, ethnicity, language, and disability, are confirmed during subsequent registration updates . The accuracy of these data has increased markedly in the last decade as a result of standardizing the methodology for objectively assessing race .
47MGH ANNUAL REPORT ON EQUITY IN HEALTH CARE QUALITY 2016–2017
APPENDIX B: READMISSION MODEL METHODOLOGY AND DETAILED RESULTSThis section outlines the methods and data sources used to specify the readmission model described in Section 4 of this report . Additional sensitivity analyses are also described .
Data Sources and SampleThe model uses administrative (billing) data from Mass General databases, as well as clinical data from our eCare electronic medical record . In addition, we also used a vendor to impute SES scores from geocoded US Census data, at the block level .
We included all adult discharges between January 1, 2013 and 6/30/2016 . Pediatric cases were excluded, as well as international patients . We also excluded any cases with missing data on the covariates . The table below summarizes the excluded cases and resulting sample .
Dataset Construction N Excluded % Excluded Total
All Index Admissions Eligible for Readmission (1/1/13–6/30/16) — — 161,881
Exclusions Applied
Race is unknown/unavailable 4,106 2.5% 157,775
Language is unknown/unavailable 636 0.4% 157,139
Age < 18 8,749 5.4% 148,390
Pediatric and Pediatric Surgery Services 1,077 0.7% 147,313
Birth or Newborn Admit Type 15 0.0% 147,298
International 40 0.0% 147,258
Admit Type is unknown/unavailable 20 0.0% 147,238
Discharge Status is unknown/unavailable 6 0.0% 147,232
Missing Comorbidity Score 191 0.1% 147,041
Index Admissions for Modeling 147,041
48 MGH ANNUAL REPORT ON EQUITY IN HEALTH CARE QUALITY 2016–2017
Readmission DefinitionWe used an internal, Partners Healthcare definition of readmission, which is closely aligned with the CMS approach . The readmission definition includes all payers, all-cause readmissions, and is not case-mix adjusted .
Every admission can be counted as both an index (first) admission and a readmission . A readmission is the first admission within a set number of days (typically 30) of an index admission discharge date . This admission is also eligible to be an index admission for a subsequent readmission .
The Readmission rate is calculated as: # of Readmissions / # of Index Admissions .
The following exclusions apply:
• Exclusions from index admissions and readmissions
– Missing data/DRG 999 Rationale: Data cleaning .
– Rehabilitation and hospice admissions Rationale: Avoid counting transfers within the same hospital as readmissions, consistent with Medicare .
• Exclusions from index admissions only
– Discharge status of deceased, left against medical advice, transferred to another short term acute facility Rationale: Consistent with Medicare .
– Discharged/transferred to a psychiatric hospital or psychiatric part unit of a hospital Rationale: This exclusion aims to avoid counting transfers within the same hospital as readmissions, clinically meaningful .
• Exclusions from readmissions only
– Chemotherapy, radiation, dialysis, OB (birth/delivery) admissions Rationale: Generally assumed to be planned and consistent with other methodologies .
After applying this definition to our dataset, we found 18,394 patients (12 .5%) were readmitted .
49MGH ANNUAL REPORT ON EQUITY IN HEALTH CARE QUALITY 2016–2017
Covariate Definitions and Expected SignsOur model included four distinct groups of covariates: Limited English proficiency, the principal independent variable, other demographic factors, socioeconomic factors, and clinical factors . The table below describes the definition, frequencies, and expected signs for each of the covariates in the model .
Variable Description Frequency Expected Sign
English Speaking (Principal IV)
English as primary language English Speaking: 92.4%Non-English: 7.6%
Reference-
Gender Male Reference Group Female: 51.8% Male: 48.2%
SES Score Composite score representing the dimensions of 1) median household wealth, 2) median household income, percentage of adults 25 years of age or older who had completed 3) high school or 4) college, percentage of employed persons 16 years of age or older in 5) white collar or 6) blue collar occupations were combined into a composite z score to capture socioeconomic status.
High School: 26%College: 40%White Collar: 27%Blue Collar: 40%Mean HH Income: $69,654 Mean HH Wealth: $377,885
+
Elixhauser Comorbidity Index
Elixhauser comorbidity index based on simple count of the comorbidities
Mean HCUP Score: -
Discharge Status Categorical variable describing where patient is discharged
50 MGH ANNUAL REPORT ON EQUITY IN HEALTH CARE QUALITY 2016–2017
Crosstabs of Selected Covariates by Language and Race
MGH Patient Characteristics, by LEP Status
Variable English LEP
Female 51.2% 60.1%
White 87.2% 25.0%
Black 5.5% 8.4%
Asian 3.0% 14.3%
Hispanic 3.8% 49.2%
Other Race 0.5% 3.1%
SES Score (mean) 0.093 -1.13
Commercial Payer 31.6% 10.4%
Medicare 45.8% 34.1%
Medicaid 12.3% 42.1%
Other Insurance 10.4% 13.5%
Discharged Home or Self-Care 53.2% 55.5%
Discharged Home Health Care 26.1% 27.8%
Discharged SNF or Hospital 20.1% 16.3%
Discharged Other 0.6% 0.4%
MGH Patient Characteristics, by Race
Variable White Black Asian Hispanic Other
Female 45.5% 56.1% 51.6% 52.5% 26.2%
LEP 1.6% 6.9% 27.8% 52.5% 19.1%
SES Score (mean) 0.258 -0.653 0.107 -1.18 -0.727
Commercial Payer 30.2% 30.9% 36.5% 23.5% 33.3%
Medicare 53.8% 35.6% 38.3% 28.2% 35.7%
Medicaid 5.2% 19.4% 9.8% 25.4% 9.5%
Other Insurance 10.7% 14.1% 15.5% 22.9% 21.4%
Discharged Home or Self-Care 46.1% 47.6% 53.1% 58.8% 57.1%
Discharged Home Health Care 30.7% 26.6% 28.5% 24.9% 28.6%
Discharged SNF or Hospital 23.1% 24.7% 18.4% 16.0% 14.3%
Discharged Other 0.2% 1.1% 0.0% 0.3% 0.0%
51MGH ANNUAL REPORT ON EQUITY IN HEALTH CARE QUALITY 2016–2017
Detailed Results of Stepwise RegressionThe initial model included only LEP as a single independent variable; LEP was not associated with higher or lower odds of readmission .
Model 1 Results
Covariate Odds Ratio Significance (p-value) Direction
Limited English Proficiency .967 0.2647
Next, we controlled for the demographic characteristics of gender, race, and age . LEP remained insignificant; yet, the sign of the odds ratio changed, suggesting that after controlling for gender, race, and age, LEP status is no longer protective . Again, this aligns with bivariate analysis that suggested the opportunity for improving readmission rates in the LEP population were within the older, male subset of patients .
Female gender was protective, with the odds of female patients being readmitted about 20% lower than for men (p< .001) . Not surprisingly, age was detrimental, with the odds of readmission increasing by about 1% for each additional year of age (p< .001) . Race was significant in the overall model, and further breakdown by racial group revealed that the odds of readmission were about 13% higher for Black patients compared to otherwise similar white patients (p< .001) . These results also suggest patients of “Other” races were less likely to be readmitted . The odds of readmission for patients of “Other” races were about 32% lower than for otherwise similar white patients . These results do not suggest a significant difference in readmission rates for Asian or Hispanic patients, compared to otherwise similar whites .
Model 2 Results
Covariate Odds Ratio Significance (p-value) Direction
Limited English Proficiency 1.057 .118
Female .802 <.001 +
Age 1.011 <.001 -
Asian & Pacific Islander (vs. white) 0.866 .239
Black (vs. white) 1.128 <.001 -
Hispanic (vs. white) .952 .245
Other (vs. white) .676 .001 +
The third stage of the model introduced socioeconomic variables, in the form of an SES score derived from US Census data, and the patient’s primary payer . After controlling for socioeconomic factors, LEP remained insignificant in the model . However, the effects for gender, age and race remained significant . SES and payer were also significant, suggesting that socioeconomic and demographic factors have a greater influence on readmission rates than patient language .
Like other analyses that have focused on the importance of socioeconomic status in readmission, we found that higher SES is protective, with the odds of readmission decreasing by about 3% for each concomitant increase in the SES score . The results for primary payer also support the importance of economic factors . The odds of readmission for Medicaid patients were about 6% higher than for otherwise similar Medicare patients . The odds of readmission for Commercial patients were about 25% lower than for otherwise similar Medicare patients .
52 MGH ANNUAL REPORT ON EQUITY IN HEALTH CARE QUALITY 2016–2017
Model 3 Results
Covariate Odds Ratio Significance (p-value) Direction
Limited English Proficiency .991 .797 +
Female .800 <.001 +
Age 1.008 <.001 -
Asian & Pacific Islander (vs. white) .889 .786 +
Black (vs. white) 1.042 <.001 -
Hispanic (vs. white) .867 .718 +
Other (vs. white) .652 .001 +
Commercial Payer (vs. Medicare) .746 .001 +
Medicaid (vs. Medicare) 1.056 .001 -
Other Payer (vs. Medicare) .720 .001 +
Socioeconomic Status Score .969 .001 +
The final stage of the model incorporated a number of clinical factors, including the number of times a patient was admitted in the prior year, the Elixhauser Comorbidity Index, length of stay on index admission, service on index admission, and discharge location on index . LEP status remained insignificant in this model; however, the sign once again changed to detrimental .
A somewhat surprising finding was that age and race were no longer significant in the model after controlling for clinical and socioeconomic factors . Only “Other” race remained significant and protective . These results suggest female gender remains protective, with the odds of readmission for female patients about 9% lower than for otherwise similar male patients .
Another surprising finding was that the effect of socioeconomic status disappeared after controlling for clinical factors . However, Medicaid as primary payer remained significant and detrimental, with the odds of readmission about 6% higher for Medicaid patients, compared to otherwise similar Medicare patients .
This model suggests that clinical characteristics are the most important factors in predicting readmission, and that patients with higher acuity are at greater risk for readmission . Although this is not a surprising finding, it is notable that the significance of the sociodemographic factors disappeared after controlling for these clinical variables .
These results suggest that prior admissions to the hospital are one of the biggest predictors of readmission . The odds of readmission increased by roughly 20% for each hospital admission in the previous year . Likewise, patients with more comorbidities were at greater risk for readmission . The odds of readmission increased by about 13% for each concomitant increase in Elixhauser Comorbidity Index .
The findings also suggest that the odds of readmission are much higher for patients discharged home with services, compared to those who are discharged home without services . The odds of readmission for patients discharged home with services were about 42% higher compared to otherwise similar patients who went home without services . These results also suggest patients who were discharged to a skilled nursing home were less likely to be readmitted, with their odds of readmission about 17% lower than otherwise similar patients discharged home .
53MGH ANNUAL REPORT ON EQUITY IN HEALTH CARE QUALITY 2016–2017
Model 4 Results
Covariate Odds Ratio Significance (p-value) Direction
Limited English Proficiency 1.031 .421
Female .905 .001 +
Age .998 .018 +
Asian & Pacific Islander (vs. white) 1.025 .044 -
Black (vs. white) .965 .441
Hispanic (vs. white) .938 .957
Other (vs. white) .780 .049 +
Commercial Payer (vs. Medicare) .964 .271
Medicaid (vs. Medicare) 1.066 .001 -
Other Payer (vs. Medicare) .904 .001 +
Socioeconomic Status Score .992 .154
Number Admission Prior 365 Days 1.227 .001 +
Elixhauser Comorbidity Index 1.128 .001 -
Neurology Service (vs. Medicine) .757 .051 +
OB/GYN Service (vs. Medicine) .343 .001 +
Other Services (vs. Medicine) .887 .001 +
Psychiatry (vs. Medicine) .619 .072
Surgery Service (vs. Medicine) .723 .179
Urology Service (vs. Medicine) .785 .025 +
Home Health Care (vs. Home) 1.421 .001 -
Skilled Nursing Facility or Hospital (vs. Home) .829 .004 +
Other Discharge Location (vs. Home) 1.161 .001 -
Sensitivity Analyses: MGH ModelWe ran several additional models to test the robustness of these results, including:
• Hierarchical regression model by service: The aim of this model was to determine if the results changed by allowing the intercept to vary by service . We thought this might be important because there could be differences in the services themselves that account for some of the differences in readmission rates . For example, the processes of care, communication and discharge processes are likely very different between different services . The analysis revealed the same pattern of results, with LEP being insignificant . Furthermore, the addition of the hierarchical modeling did not add much to the overall explanatory value of the model . Therefore, we opted for the simpler logistic model for this report .
• Limited model to more recent time period: The model presented in Section 4 includes data from January, 2013 to June, 2016 . We wanted to make sure there were no differences using a more recent subset of the data . We specified the same model using data from 2013 to 2014, and then from 2015 2016 and found the same patterns in terms of variable significance . This suggests there are not recent changes in readmission trends that differ from the overall findings presented in this report .
• Interactions between Payer and SES: Medicaid as primary payer and socioeconomic status are correlated, so we specified a model with only SES (no payer) and another model without payer (no SES) . SES was significant in the model without payer, but significance thresholds and signs for
54 MGH ANNUAL REPORT ON EQUITY IN HEALTH CARE QUALITY 2016–2017
all other covariates were similar to the original model . When controlling for payer but not SES, Medicaid and Other payer were significant (Medicaid detrimental and Other protective); no other differences in signs or significance were present for other covariates . We decided to control for both SES and payer, given the additional explanatory power of SES .
• Surgery service as reference group: We specified a separate model with the surgical service as the reference group, to obtain a point estimate for the Medicine service . The odds of readmission for patients admitted to the Medicine service (on index) were about 21% higher than for otherwise similar patients admitted to the Surgical service (OR: 1 .213, p< .001) .
• Finally, we specified a model using the weighted version of the comorbidity score (Van Walraven Score) versus the Elixhauser score, which is a simple count of comorbidities . This did not add any explanatory value to the overall model, and did not affect the patterns of significance or direction .
Sensitivity Analyses: Stratified Model Results by LEP Status and RaceThe findings in the initial regression model led us to further explore the predictors of readmission within the LEP and minority populations . What if there are differences between LEP and English speaking patients that cannot be directly measured? Would the same factors that predict readmission in the overall MGH population hold true for LEP patients? What about for minorities? Are there different predictors of their likelihood of readmission that could help us understand how to reduce their risk of readmission? We specified two additional models to address these questions, one stratified by LEP/English speaking and one stratified by minority/white race .
The analysis by LEP status suggested a similar pattern of characteristics influences readmission within the LEP population, compared to the MGH population as a whole .
• The findings for race/ethnicity are reassuring . Race was not a significant predictor of readmission within the LEP population . This suggests the earlier bivariate findings, which suggested Asian LEP patients had higher readmission rates, can be explained by other clinical and economic factors . No disparities were present by race within the English speaking cohort .
• Clinical factors are the main drivers of readmission for both English and non-English speakers: prior admissions, comorbidities, and being discharged home with services were the most important predictors of readmission for both groups .
• Female patients had lower odds of readmission in both cohorts .
• Medicaid as primary payer, socioeconomic status and age were not significant predictors of readmission in the LEP population .
• Discharge to skilled nursing facility was protective for English speaking patients, but not a significant factor for LEP patients .
55MGH ANNUAL REPORT ON EQUITY IN HEALTH CARE QUALITY 2016–2017
Stratified Model Results: LEP vs. English Speaking Patients
Covariate Odds Ratio (LEP) Odds Ratio (English)
Female .838** .909***
Age 1.001 .997**
Asian & Pacific Islander (vs. white) .954 1.039
Black (vs. white) 1.039 .952
Hispanic (vs. white) .956 .942
Other (vs. white) .643** .825
Commercial Payer (vs. Medicare) .894 .961
Medicaid (vs. Medicare) 1.083 1.069***
Other Payer (vs. Medicare) 1.034 .888***
Socioeconomic Status Score 1.020 .989**
Number Admission Prior 365 Days 1.182*** 1.229***
Elixhauser Comorbidity Index 1.145*** 1.126***
Neurology Service (vs. Medicine) .885 .746
OB/GYN Service (vs. Medicine) .230*** .364***
Other Service (vs. Medicine) 1.349 .847**
Psychiatry Service (vs. Medicine) .800 .600**
Surgery (vs. Medicine) .759 .721
Urology Service (vs. Medicine) 1.032 .775***
Home Health Care (vs. Home) 1.474** 1.439***
Skilled Nursing Facility or Hospital (vs. Home) .669 .851**
Other Discharge Location (vs. Home) 1.075 1.260***
** Statistical significance with p<.05; *** statistical significance with P<.01.
Likewise, the findings for the race-stratified model were likewise reassuring .
• These results suggest LEP is not a significant predictor of readmission for whites or minorities .
• The odds of readmission are lower for both white and minority women .
• Clinical factors are the principal drivers of readmission for both white and non-white patients: prior admissions, multiple comorbidities, and being discharged with home health services were significant predictors of readmission in both groups .
• Interestingly, Medicaid status and SES were significant predictors of readmission for white patients, but not for minorities .
• Discharge to skilled nursing and other discharge locations were significant for whites but not non-whites .
56 MGH ANNUAL REPORT ON EQUITY IN HEALTH CARE QUALITY 2016–2017
Stratified Model Results: Non-white vs. White Patients
Covariate Odds Ratio (Non-white) Odds Ratio (White)
LEP 1.022 1.055
Female .868** .911***
Age .999 .999
Commercial Payer (vs. Medicare) .967 .963
Medicaid (vs. Medicare) 1.012 1.089***
Other Payer (vs. Medicare) .888 .901**
Socioeconomic Status Score 1.012 .988**
Number Admission Prior 365 Days 1.242*** 1.224***
Elixhauser Comorbidity Index 1.108*** 1.130***
Neurology Service (vs. Medicine) .748 .759
OB/GYN Service (vs. Medicine) .287*** .376**
Other Service (vs. Medicine) .926 .875
Psychiatry Service (vs. Medicine) .558 .639
Surgery (vs. Medicine) .694 .728
Urology Service (vs. Medicine) .766 .791
Home Health Care (vs. Home) 1.545** 1.425***
Skilled Nursing Facility or Hospital (vs. Home) .815 .851**
Other Discharge Location (vs. Home) 1.271 1.242**
** Statistical significance with p<.05; *** statistical significance with P<.01.
57MGH ANNUAL REPORT ON EQUITY IN HEALTH CARE QUALITY 2016–2017
APPENDIX C: DATA SOURCES AND DATES PRESENTED
Data/Measures Source of Data/Measures Dates Presented
Catchment Area Demographics American Community Survey Data (US Census database), Patcom/EPIC (registration/scheduling), EPSI (MGH billing), EDIS (ED data)
CY 2014
Patient Population by Setting Patcom/EPIC, EPSI, EDIS, EPIC CY 2016
Patient Distribution among Inpatient Services Patcom/EPIC, EPSI, EDIS, EPIC CY 2016