Massachusetts Part B State Annual Performance Report (MA APR) for FFY2012 Submitted to the U.S. Department of Education, Office of Special Education Programs February 3, 2014 Massachusetts Department of Elementary and Secondary Education 75 Pleasant Street, Malden, MA 02148-4906 Phone 781-338-3000 TTY: N.E.T. Relay 800-439-2370 www.doe.mass.edu
Transcript
Massachusetts Part B State Annual Performance Report (MA APR) for FFY2012Submitted to the U.S. Department of Education, Office of Special Education ProgramsFebruary 3, 2014
Massachusetts Department of Elementary and Secondary Education75 Pleasant Street, Malden, MA 02148-4906Phone 781-338-3000 TTY: N.E.T. Relay 800-439-2370www.doe.mass.edu
This document was prepared by the Massachusetts Department of Elementary and Secondary Education
Mitchell D. Chester, Ed.D.Commissioner
The Massachusetts Department of Elementary and Secondary Education, an affirmative action employer, is committed to ensuring that all of its programs and facilities are accessible to all members of the public.
We do not discriminate on the basis of age, color, disability, national origin, race, religion, sex, gender identity, or sexual orientation.
Inquiries regarding the Department’s compliance with Title IX and other civil rights laws may be directed to the Human Resources Director, 75 Pleasant St., Malden, MA 02148-4906. Phone: 781-338-6105.
Cover Letter / Overview of MA APR DevelopmentU.S Department of EducationOffice of Special Education ProgramsPotomac Center PlazaMail Stop 2600, Room 4166550 12th Street S.W.Washington, DC 20202
Re: Massachusetts Part B Annual Performance Report (MA APR) for FFY2012 and Massachusetts Part B State Performance Plan (MA SPP)
Dear Sir or Madam:
On behalf of the Massachusetts Department of Elementary and Secondary Education (MASSDE), I have enclosed the Massachusetts Annual Performance Report (MA APR) for FFY2012, and a revised copy of the Massachusetts Part B State Performance Plan (MA SPP). The MA APR responds directly to the instructions included in Information Collection 1820-0624, Part B State Performance Plan (Part B-SPP) and Annual Performance Report (Part B-APR), and OSEP Memorandum 14-2, submitted to States on October 30, 2013.
The MA APR contains actual target data from the FFY2012 reporting period, or 2011-2012 consistent with instructions for a data lag for certain indicators, and other responsive information for all indicators during this final year of reporting under the current SPP. The APR also contains information addressing the areas identified in the Massachusetts Part B FFY2011 SPP/APR Letter and Response Table. Although some indicators (Indicators 16 (complaint timelines) and 17 (hearing timelines)) are no longer required to be reported in the APR, MASSDE has reported this data here. For Indicator 2 (dropout), MASSDE has elected to report using the same data source and measurement used in prior years.
MASSDE works with a broad group of stakeholders, including the Statewide Special Education Steering Committee, the Statewide Advisory Council, advocacy groups and parent organizations, and other state and local agencies, on efforts to support children with disabilities, their families, and their educators in order to improve student outcomes. Throughout the year, MASSDE shares information contained in the reports with these stakeholders, and also makes this information available for public review and discussion in other forums, and on the MASSDE website at http://www.doe.mass.edu/sped/spp/. School districts’ data for specific Indicators are publicly reported at http://profiles.doe.mass.edu/state_report/special_ed.aspx. The website is in the process of being updated to include information from the FFY2012 MA APR.
Please contact me at 781.338.3388 or [email protected], if you have any questions or if you need additional information.
Sincerely,
Marcia MittnachtState Director of Special EducationSpecial Education Planning and Policy Development OfficeMassachusetts Department of Education
C: Mitchell D. Chester, Ed.D., Commissioner of Elementary and Secondary Education
Massachusetts Part B Annual Performance Report for FFY2012 1Submitted February 3, 2014
Effective General Supervision / Effective TransitionIndicator 12: Early Childhood Transition 56Indicator 13: Secondary Transition 60Indicator 14: Post-School Outcomes 63
Effective General Supervision / General SupervisionIndicator 15: Identification and Correction of Noncompliance 71Indicator 16: Complaint Timelines 74Indicator 17: Due Process Timelines 76Indicator 18: Hearing Requests Resolved by Resolution Sessions 78Indicator 19: Mediation Agreements 80Indicator 20: State Reported Data 82
AppendicesAppendix A: Selected Cross-Cutting Improvement Activities 84Appendix B: Indicator 15 Worksheet (FFY2012) 108Appendix C: IDEA Part B - Dispute Resolution School Year: 2012-13 113
Massachusetts Part B Annual Performance Report for FFY2012 2Submitted February 3, 2014
Massachusetts
Part B State Annual Performance Report (APR) for FFY2012Overview of the Annual Performance Report Development:
Monitoring Priority: FAPE in the LRE
Indicator 1: Percent of youth with IEPs graduating from high school with a regular diploma.
(20 U.S.C. 1416 (a)(3)(A))
Measurement: States must report using the graduation rate calculation and timeline established by the Department under the ESEA.
FFY Measurable and Rigorous Target
2012 (2011-2012 data)
77.5%
Actual Target Data for FFY2012 (2011-2012 data and target, based on instructions for a data lag):
Number of Students with IEPs in 2011-2012 cohort
Number of Students with IEPs in cohort who graduated in
four years or less
2011-2012 Four Year Graduation Rate for Students
with IEPs
14,812 10,161 68.6%
MASSDE’s reported data, measurement, and target are aligned with the expectations and measurements of graduation for all students as described by MASSDE under Title I of the Elementary and Secondary Education Act (ESEA). MASSDE based targets for this indicator on a “closing the gap” progression that will eventually bring all students with disabilities to the same level as students without disabilities.
To receive a diploma from a Massachusetts public high school, a student must: (1) earn a Competency Determination (i.e., achieve a specified level of proficiency on the Grade 10 English Language Arts (ELA), Mathematics, and beginning with the class of 2010, the Science, Technology, and Engineering (STE) statewide assessments administered through the Massachusetts Comprehensive Assessment System (MCAS), or on the MCAS-Alt), and (2) meet local graduation requirements. Students receiving a diploma in four years or less are counted as graduates for purposes of reporting these data in the Massachusetts State Performance Plan (MA SPP) and Annual Performance Report (APR).
Although MASSDE is not required to report here a five-year graduation rate, MASSDE regularly calculates and publicly reports this rate because it is an additional measure of the year-to-year progress for all students, including students with IEP’s. The five-year graduation rate for students with IEPs in 2011-2012 is 73.8%. This is a 3 percentage point increase over the five-year graduation rate reported in the FFY2011 APR and it is also a 5.2 percentage point increase over the four-year graduation rate for the current reporting period. MASSDE will continue to calculate and publicly report the five-year rate for subsequent cohorts as an additional measure of the year-to-year progress for students with and without IEPs.
Increasing the number of students graduating in five years is also a stated goal of MASSDE’s overall Delivery Plan. The five-year rate is included in the Plan as the target measure to increase support and programmatic
Massachusetts Part B Annual Performance Report for FFY2012 3Submitted February 3, 2014
Massachusetts
opportunities for student success throughout high school, particularly for those students for whom it may take a longer period of time to graduate including students with IEP’s. The table below compares the 4year and 5 year graduation rates throughout the full SPP/APR reporting period. There is a significant increase in graduation rates when students are allowed to finish high school in five years.
Table 1.1: Comparison of Four Year and Five Year Graduation Rates: FFY2005-FFY2011
Statewide graduation data are reported at http://www.doe.mass.edu/infoservices/reports/gradrates/. District level information about Indicator 1 is available at http://profiles.doe.mass.edu/state_report/special_ed.aspx.
Discussion of Improvement Activities and Explanation of Slippage, if the State did not meet its target, that occurred for FFY2012 (2011-2012 data):As required by instructions from OSEP, MASSDE has examined data for the year before the reporting year (i.e., data from 2011-2012), and compared the results to the target for the data period.
As noted in Figure 1.1 below, the four-year graduation rate of students with IEPs has fluctuated throughout the SPP period between a low of 61.1% in 2005-2006 to a high of 68.6% in this reporting year. This year’s rate of 68.6% shows an increase of 3.0 percentage points over last year’s reported graduation rate for students with IEP’s, which makes this the highest single year increase since the reporting began in 2005-2006. The graduation rate for all students increased by 1.3 percentage points during the same reporting period.
During the SPP period, the four year graduation rate for students with IEPs has increased by 7.5 percentage points.
Figure 1.1: Four Year Graduation Rate of Students with IEPs: FFY2005-FFY2011
Source: Massachusetts Student Information Management System
MASSDE would like to highlight the longitudinal increase of graduation rates for all students and for students with IEP’s from the 2005-2006 school year through this reporting year of 2011-2012. The graduation rate of all
Massachusetts Part B Annual Performance Report for FFY2012 4Submitted February 3, 2014
students increased by 4.8 percentage points while the graduation rate of students with IEPs improved by 7.5 percentage points during this period. The comparison of the 4 year graduation rate of students with IEPs with all students is seen in the table below:
Table 1.2: Comparison of the Four Year Graduation Rates of All Students and Students with IEPs: FFY2005-FFY2011
All students 79.9% 80.9% 81.2% 81.5% 82.1% 83.4% 84.7%
Students with IEPs
61.1% 62.8% 64.1% 64.9% 64.1% 65.6% 68.6%
Improvement Activities
Consistent with instructions from OSERS, MASSDE is reporting one set of improvement activities in Appendix A of this report. Each activity references the relevant indicators, and is also listed in the MA SPP for those indicators.
For this report, MASSDE would like to highlight the new Massachusetts Early Warning Indicator System (EWIS) designed to provide information to districts and schools on the likelihood their students will reach key academic goals. The EWIS report includes all students in grades 1 – 12 thus allowing schools to intervene sooner and more quickly so students remain in-school, and on-track to graduate. The following chart explains the grade level groupings and academic goals by groupings.
Massachusetts EWIS Grade Level Groupings and Associated Academic Goals
Age GroupsGrade Levels
Academic GoalsExpected student outcomes for each Age Group
Early Elementary
1, 2,3 Reading by the end of third grade: Proficient or advanced on 3rd grade English language arts MCAS
Late Elementary
4, 5, 6 Middle school ready: Proficient or advanced on 6th grade ELA and Mathematics MCAS
Middle Grades 7, 8, 9 High school ready: Passing grades on all 9th grade courses
High School 10, 11, 12 High school graduation: Completing all local and state graduation requirements
Students are placed in a risk category – low risk means a student is likely to reach the academic goal; moderate risk indicates a student has some factors that make reaching the academic goal difficult; and high risk means a student is unlikely to reach the academic goal. Schools can use information from the EWIS to support students who are at risk of not meeting an expected academic goal with both school-wide strategies and individual, targeted interventions. Early users of this system have reported identifying middle school students at high risk for not passing grade 9 courses and providing interventions such as academic tutors, after school programming and summer transition programs to lower the risk level and prepare the student for success. Districts and schools can also use EWIS data to examine school-level patterns over time in order to address systemic issues that may impede a student's ability to meet academic goals. In this instance schools have reported changing the daily schedule, changing instructional staff, or changing a program to improve outcomes. Using the EWIS is an improvement activity that will benefit both this Indicator as well as Indicator 2, which calculates students dropping out of school.
Massachusetts Part B Annual Performance Report for FFY2012 5Submitted February 3, 2014
Massachusetts
Revisions, with Justification, to Proposed Targets / Improvement Activities / Timelines / Resources for FFY2011 (2011-2012):The MA SPP includes new or revised improvement activities, timelines, and resources to reflect new initiatives or to update existing initiatives.
Massachusetts Part B Annual Performance Report for FFY2012 6Submitted February 3, 2014
Massachusetts
Part B State Annual Performance Report (APR) for FFY2012Overview of the Annual Performance Report Development:
Monitoring Priority: FAPE in the LRE
Indicator 2: Percent of youth with IEPs dropping out of high school.
(20 U.S.C. 1416 (a)(3)(A))
Measurement: States must report using the dropout data used in the ESEA graduation rate calculation and follow the timeline established by the Department under the ESEA.
FFY Measurable and Rigorous Target
2012 (2011-2012 data)
4.3%
Actual Target Data for FFY2012 (2011-2012 data and target, based on instructions for a data lag):
Number of Students with IEPs enrolled in 2011-2012
(Grades 9-12)
Number of Dropouts with IEPs in 2011-2012
(Grades 9-12)
2011-2012Dropout Rate for Students with IEPs
44,476 1611 3.6%
In Massachusetts, a dropout – regardless of disability status – is defined as a student in grades 9-12 in a public school who, prior to graduation, leaves school for reasons other than a transfer to another public school, and who does not re-enroll before the following October 1. To calculate this rate, MASSDE uses dropout data obtained through the Student Information Management System (SIMS) October 1 enrollment report, and omits from the final count any student identified as enrolled on that date who earned a General Educational Development (GED) credential. MASSDE also identifies “summer dropouts” and adds their total into the count.1 Additional information on the data collection and calculation is included in the MA SPP for FFY2005-2012, available at http://www.doe.mass.edu/sped/spp/maspp.html.
Statewide dropout data are reported at http://www.doe.mass.edu/infoservices/reports/gradrates/, and district level information for Indicator 2 is available at http://profiles.doe.mass.edu/state_report/special_ed.aspx.
As required by instructions from OSEP, MASSDE has examined data for the year before the reporting year (i.e., data from 2011-2012), and compared the results to the target for the data period. For this reporting year, 3.6%
1 As described in OSEP Memorandum 13-6, for Indicator 2, States could choose to report using the same data source and measurement that the State used for the FFY2010 APR submitted on February 2, 2012, or use the data source and measurement included in the Part B Measurement Table that expires July 31, 2015 (i.e., “report a percentage using the number of youth with IEPs (ages 14-21) who exited special education due to dropping out in the numerator and the number of all youth with IEPs who left high school (ages 14-21) in the denominator”). MASSDE has elected to use the same data source and measurement that it used in previous reporting years. The calculation methodology is described in the MA SPP for Indicator 2.
Massachusetts Part B Annual Performance Report for FFY2012 7Submitted February 3, 2014
of students with IEPs in grades 9-12 dropped out of school in the 2011-2012 school year. This result is 0.7 percentage points better than the proposed target of 4.3%.
This is the final year of reporting following the current format. Next year, MASSDE will report the dropout data following new guidelines published by OSEP (see footnote 1 above).
Figure 2.1: Data Results for Annual Dropout Rate for Students with IEPs: FFY2005-FFY2011
Source: Massachusetts Student Information Management System (SIMS), Massachusetts Department of Elementary and Secondary Education
An additional note: MASSDE is reporting, for the first time in five years, a decline in the number of students with IEPs in conjunction with the improved dropout rate as reflected in Table 2.1 below.
Table 2.1: Data Results for Number of Students with IEPs in Conjunction with the Dropout Rate: FFY2007-FFY2011
School YearTotal number of
students with IEPsTotal number of
students with IEPs who dropped out
Annual Dropout Rate
2007-2008 44,448 2,429 5.5%
2008-2009 44,693 2,246 5.0%
2009-2010 44,874 2,122 4.7%
2010-2011 45,059 2,088 4.6%
2011-2012 44,476 1,611 3.6%
Massachusetts Part B Annual Performance Report for FFY2012 8Submitted February 3, 2014
Massachusetts
MASSDE credits this improvement trend, in part, to the continued efforts of statewide dropout prevention and re-engagement initiatives. One such initiative, Massachusetts Early Warning Indicator System (EWIS) is described in greater detail in Indicator 1 but is equally important for not only improving graduation rates but also for dropout prevention. Descriptions of other successful initiatives can be found in Appendix A.
Discussion of Improvement Activities and Explanation of Slippage, if the State did not meet its target, that occurred for FFY2012 (data from 2011-2012):Improvement Activities
Consistent with instructions from OSERS, MASSDE is reporting one set of improvement activities in Appendix A of this report. Each activity references the relevant indicators, and is also listed in the MA SPP for those indicators. Additionally, the discussion of improvement activities in the Indicator 1 MA APR is applicable here.
Revisions, with Justification, to Proposed Targets / Improvement Activities / Timelines / Resources for FFY2012 (data from 2011-2012):The MA SPP includes new or revised improvement activities, timelines, and resources to reflect new initiatives or to update existing initiatives.
Massachusetts Part B Annual Performance Report for FFY2012 9Submitted February 3, 2014
Massachusetts
Part B State Annual Performance Report (APR) for FFY2012Overview of the Annual Performance Report Development:
Monitoring Priority: FAPE in the LRE
Indicator 3: Participation and performance of children with IEPs on statewide assessments:
A. Percent of districts with a disability subgroup that meets the State’s minimum “n” size that meet the State’s AYP/AMO targets for the disability subgroup.
B. Participation rate for children with IEPs.
C. Proficiency rate for children with IEPs against grade level, modified2 and alternate academic achievement standards.
(20 U.S.C. 1416 (a)(3)(A))
Measurement:A. (choose either A.1 or A.2)3
A.1 AYP percent = [(# of districts with a disability subgroup that meets the State’s minimum “n” size that meet the State’s AYP targets for the disability subgroup) divided by the (total # of districts that have a disability subgroup that meets the State’s minimum “n” size)] times 100.
A.2 AMO percent = [(# of districts with a disability subgroup that meets the State’s minimum “n” size that meet the State’s AMO targets for the disability subgroup) divided by the (total # of districts that have a disability subgroup that meets the State’s minimum “n” size)] times 100.
B. Participation rate = [(# of children with IEPs participating in the assessment) divided by the (total # of children with IEPs enrolled during the testing window, calculated separately for reading and math)]. The participation rate is based on all children with IEPs, including both children with IEPs enrolled for a full academic year and those not enrolled for a full academic year.
C. Proficiency rate = [(# of children with IEPs enrolled for a full academic year scoring at or above proficient) divided by the (total # of children with IEPs enrolled for a full academic year, calculated separately for reading and math)].
Measurable and Rigorous Targets
FFY 2011 (2011-2012)
A.2: Districts Meeting Accountability Targets for
Disability Subgroup
B: Participation Rate for Students with IEPs
C: Proficiency Rate (CPI) for Students with IEPs
Cumulative PPI ELA MATH ELA MATH
Target 30.7% 99% 99% 70.9 57.7
Actual Data 17% 98.3% 98.4% 66.8 57.4
2 Massachusetts does not have modified academic achievement standards for students with disabilities.3 Consistent with the waiver of certain requirements of the No Child Left Behind (NCLB) Act granted to Massachusetts by the U.S. Department of Education in FFY2011, Massachusetts no longer reports Adequate Yearly Progress (AYP). Rather, Massachusetts reports district and school progress toward narrowing proficiency gaps using a new 100-point Progress and Performance Index (PPI). MASSDE has elected to use A.2 for calculating the number of districts meeting state accountability targets for the disability subgroup.
Massachusetts Part B Annual Performance Report for FFY2012 10Submitted February 3, 2014
Massachusetts
Discussion of Improvement Activities and Explanation of Slippage, if the State did not meet its target that occurred for FFY2012 (2012-2013):Indicator 3A.2: District Meeting Accountability TargetsUnder the terms of the flexibility waiver granted to Massachusetts in February 2012, Massachusetts is exempt from certain provisions of the No Child Left Behind (NCLB) Act. Among other changes, Massachusetts now uses an alternative accountability measurement known as the Progress and Performance Index (PPI) to calculate whether school districts are meeting accountability targets. A description of the key changes to the state’s accountability system as a result of the waiver is available in the Indicator 3 FFY2011 APR at http://www.doe.mass.edu/sped/spp/. Complete information about the state system of accountability is available at http://www.doe.mass.edu/apa/accountability/default.html?section=2013.
For Indicator 3A.2, MASSDE uses a cumulative PPI to report the percent of school districts meeting the accountability targets for the disability subgroup. A district’s, school’s, or subgroup’s cumulative PPI is the average of its annual PPIs over the most recent four year period, weighting recent years the most (1-2-3-4). A cumulative PPI, reported on a 100-point scale, is calculated for a group if it has at least three annual PPIs. If a group is missing an annual PPI for one year, that year is left out of the weighting (e.g., 1-X-3-4). For a school to be considered to be making progress toward narrowing proficiency gaps, the cumulative PPI for all students and high needs students must be 75 or higher. A sample calculation of PPI is included in the table below.
Table 3.1: Sample PPI Calculation: FFY2009-FFY2012
Sample PPI Calculation 2010 2011 2012 2013English Language Arts
High School Annual dropout rate 75 100 75 100Cohort graduation rate 75 75 75 75
Sample PPI Calculation 2010 2011 2012 2013Points awarded for achievement, growth, and high school indicators 375 400 500 625Points awarded for extra credit 0 25 50 75Total points awarded 375 425 550 700Number of achievement, growth, and high school indicators 7 7 7 7Annual PPI 54 61 79 100Cumulative PPI (2010*1 + 2011*2 + 2012*3 + 2013*4) ÷ 10 81
Based on the cumulative PPI, of the 307 school districts with a disability subgroup in FFY2012, 52, or 17%, met the accountability targets for the disability subgroup. This represents a slippage of 6 percentage points from FFY2011 and is below this year’s target rate of 30.7%.
Slippage is primarily isolated in lower grade performance in ELA, a result that is consistent with the performance of students without disabilities in the same period. In other content areas such as Math and Science, the trend is reversed as measured by Composite Proficiency Index (CPI) and Student Growth Percentile (SGP). In the upper grades, students with IEPs have shown significant growth in ELA. There is a four year trend of strong
Massachusetts Part B Annual Performance Report for FFY2012 11Submitted February 3, 2014
improvements in ELA among 10h grade students with IEPs. Gains in ELA among this cohort have far exceeded the gains made by general education peers. Tenth graders with IEPs have demonstrated 12.5% increase in their performance statewide in ELA MCAS scores over a four year period, compared to the 5% gains made by their peers in general education.
MASSDE publicly reports accountability data at: http://profiles.doe.mass.edu/accountability/report/school.aspx?orgcode=000000.
Indicator 3B: Participation rate for children with IEPsMASSDE continues to report high participation rates for students with IEPs. The participation rates in FFY2012 were 98.2% for the ELA assessment and 98.4% for the Mathematics assessment. During this period, 90,740 students participated in the ELA MCAS, and 90,799 participated in the Mathematics MCAS. The participation rate for students with IEPs on statewide assessments has remained stable compared to previous years and is approaching the rigorous target of 99% participation.
Table 3.2: Calculation of MCAS Participation Rates - Percent = [(c +d + e + f) divided by (a) X 100]
(c) & (d) (e) & (f) (b) (a) Percent
ELA 9,376 + 71,059 19 + 8,502 89,121* 90,740 98.2%
MATH 8,878 + 71,710 22 + 8,583 89,348* 90,799 98.4%
* Note: First-year ELL students with disabilities are not included in performance level or CPI results. However, first-year ELL students with disabilities who took the MEPA test are counted as ELA participants. Also, first-year ELL students with disabilities who are present for Mathematics/Science and Technology/Engineering are counted as participants. More information is available in the principal's administration manual (PAM), the most recent version of which is available at http://www.doe.mass.edu/mcas/testadmin/manual/PAM.pdf#search=%22PAM%22n. In FFY2012, 165 first-year ELL students with disabilities took the MEPA and 155 first-year ELL students were present for Mathematics/Science and Technology/Engineering.
Student non-participation in assessments was due to one of three reasons: 1) the student was absent during testing opportunities, 2) the student received a medical exemption, or 3) the student first enrolled in a Massachusetts school after October 1 and could not engage meaningfully in the assessment process due to limited English proficiency.
The tables below provide an aggregate accounting of student participation as well as participation data by grade level for FFY2012.
Massachusetts Part B Annual Performance Report for FFY2012 12Submitted February 3, 2014
Table 3.3: Participation Rate for Students with IEPs (Indicator 3B): FFY2012
English Language Arts Mathematics
W/ Accom.
W/O Accom.
1st yr
LEP TotalW/
Accom.W/O
Accom.
1st yr
LEP Total# of Students with IEPs Participating in Regular Assessment (“c” and “d”)
71,059 9,376 80,435 71,710 8,878 80,588# of Students with IEPs Participating in Alternate Assessment (Grade Level Standards “e”)
N/A 19 19 N/A 22 22# of Students with IEPs Participating in Alternate Assessment (ALT) (“f”)
N/A 8,502 8,502 N/A 8583 8,583Total # of Students with IEPs Assessed (“b”)
71,059 17,897 165 89,121 71,710 17,483 155 89,348Total # of Students with IEPs Enrolled in Assessed Grades (“a”)
90,740 90,799% of Students with IEPs Participation Statewide
98.2% 98.4%
Massachusetts Part B Annual Performance Report for FFY2012 13Submitted February 3, 2014
Massachusetts
Table 3.4: Participation Rate for Students with IEPs by Grade Level (Indicator 3B): FFY2012
FFY2012
(2012-2013)
Grades 3-5 Grades 6-8 Grades 9-12 Total
# # # #
a # of Students with IEPs Enrolled in Assessed Grades
ELA 39,043 39,939 11,758 90,740
Math 39,055 39,972 11,772 90,799
b # of Students with IEPs Assessed
ELA 38,701 39,320 11,100 89,121
Math 38,769 39,383 11,196 89,348
c# of Students with IEPs in regular assessment with no accommodations
ELA 4,675 3,775 926 9,376
Math 4,182 3,649 999 8,830
d# of Students with IEPs in regular assessment with accommodations
ELA 29,977 31,805 9,277 71,059
Math 30,545 31,874 9,291 71,710
e
# of Students with IEPs in alternate assessment against grade-level standards
ELA 5 9 5 19
Math 3 13 6 22
f
# of Students with IEPs in alternate assessment against alternate academic achievement standards
ELA 3,971 3,648 883 8,502
Math 3,954 3,748 881 8,583
Source: Massachusetts Comprehensive Assessment System (MCAS).
Massachusetts Part B Annual Performance Report for FFY2012 14Submitted February 3, 2014
Massachusetts
The figure below provides a longitudinal view of participation rates of students with disabilities in statewide assessments from FFY2005 to FFY2012. At no time during the SPP period has participation been less than 97.6%.
Figure 3.5: Participation Rates for Students with IEPs; Longitudinal Data: FFY2006-2012
FFY12 Target
Actual FFY 2006
Actual FFY 2007
Actual FFY 2008
Actual FFY 2009
Actual FFY 2010
Actual FFY 2011
Actual FFY 2012
97%
98%
99%
100%
Source: Massachusetts Comprehensive Assessment System (MCAS) and Massachusetts Student Information Management System (SIMS). In accordance with 34 CFR §300.160(f), MASSDE publicly reports data regarding the participation of children with IEPs in statewide assessments at the district and school level on the MCAS 2013 results page, through a web link in the “Related Links” box at: http://profiles.doe.mass.edu/mcas/participation.aspx?linkid=26&orgcode=00000000&fycode=2013&orgtypecode=0&.
Indicator 3C: Proficiency rates for children with IEPs against grade level standards and alternative achievement standardsBased on MASSDE’s ESEA waiver, the NCLB goal of 100 percent of students reaching proficiency by the 2013-2014 school year has been replaced with the goal of reducing proficiency gaps by half by the end of the 2016-2017 school year. The 100-point Composite Performance Index (CPI), a measure of the extent to which all students in a district, school, or subgroup are progressing toward proficiency, will gauge progress toward this goal. For additional details on the CPI, please see the School Leaders’ Guide to the 2013 Accountability Reports, at: http://www.doe.mass.edu/apa/ayp/2013/SchoolLeadersGuide.docx.
In FFY2012, the target CPI based on reducing the proficiency gap by half by the end of the 2016-2017 school year for the students with disabilities subgroup was 70.9 in ELA, and 57.7 in Mathematics. Actual FFY2012 data show that the CPI for students with disabilities was 66.8 in ELA and 57.4 in Mathematics. This represents a decrease in ELA of 0.5 percentage points over FFY2011 results, and a 0.5 percentage point increase in Mathematics. While these results fell short of the targets, they represent gains from the baselines determined in FFY2005 (64.4 in ELA, 51.5 in Mathematics). Longitudinal data illustrating improvement in increasing the CPI for students with disabilities from FFY2005-FFY2012 is provided in the figure below.
Massachusetts Part B Annual Performance Report for FFY2012 15Submitted February 3, 2014
Source: Massachusetts Comprehensive Assessment System (MCAS) and Massachusetts Student Information Management System (SIMS).
The Tables below are populated with data used to calculate FFY2012 state proficiency rates for children with IEPs. Aggregated proficiency rates for students on IEPs in ELA and Mathematics, as measured by CPI, and data disaggregated by grade level are provided. Statewide data of 2013 MCAS disaggregated results are at http://profiles.doe.mass.edu/mcas/subgroups2.aspx?linkid=25&orgcode=00000000&fycode=2013&orgtypecode=0&.
Table 3.7: Proficiency Rate for Students with IEPs (Indicator 3C): FFY2012
English Language Arts Mathematics
W/ Accom.
W/O Accom.
1st yr LEP
Total W/ Accom. W/O Accom.
1st yr LEP Total
# of Students with IEPs Scoring Proficient or Above in Regular Assessment
21,772 4,745 26,517 15,872 4,017 19,889
# of Students with IEPs Scoring Proficient or Above in Alternate Assessment
N/A 0 0 N/A 2 2
Total # of Students with IEPs Scoring Proficient or Above
21,772 4,745 26,517 15,872 4,019 19,891
Total # of Students with IEPs Assessed
71,059 17,897 165 89,121 71,710 17,483 155 89,348
% of Students with IEPs Scoring Proficient or Above on Statewide Assessment
30.6% 26.5% 29.8% 22.1% 23.0% 22.3%
CPI 63.4 80.4 66.8 52.7 76.9 57.4
Massachusetts Part B Annual Performance Report for FFY2012 16Submitted February 3, 2014
Source: Massachusetts Comprehensive Assessment System (MCAS) and Massachusetts Student Information Management System (SIMS).
Table 3.8: Proficiency Rate for Students with IEPs in Statewide Assessments: FFY2012
FFY2012
(2012-2013)Grades 3-5 Grades 6-8 Grades 9-12 Total
# # # #
a
# of Students with IEPs Scoring Proficient or Above in Regular Assessment with Accommodations
ELA 5,486 9,733 6,553 21,772
Math 7,003 4,974 3,895 15,872
b
# of Students with IEPs Scoring Proficient or Above in Regular Assessment without Accommodations
ELA 1,867 2,104 774 4,745
Math 2,030 1,350 630 4,010
c
# of Students with IEPs Scoring Proficient or Above in Alternate Assessment against Grade Level Standards
ELA 0 0 0 0
Math 0 0 0 0
d
# of Students with IEPs Scoring Proficient or Above in Alternate Assessment against Alternate Academic Achievement Standards
ELA 0 0 0 0
Math 0 0 0 0
eTotal # of Students with IEPs Scoring Proficient or Above
ELA 7,353 11,837 7,327 26,517
Math 9,036 6,327 4,528 19,891
f Total # of Students with IEPs assessed
ELA 38,701 39,320 11,100 89,121
Math 38,769 39,383 11,196 89,348
CPIELA 60.4 67.0 88.4 66.8
Math 60.8 50.6 70.0 57.4
Source: Massachusetts Comprehensive Assessment System (MCAS) and Massachusetts Student Information Management System (SIMS).
Because of the identified slippage (0.5 percentage points) in CPI for ELA in FFY2012 compared by FFY2011, MASSDE took a closer look at the ELA data over time to examine possible trends and issues. The data presented below provides a longitudinal view of student performance as measured by CPI in ELA. The
Massachusetts Part B Annual Performance Report for FFY2012 17Submitted February 3, 2014
Massachusetts
Composite Performance Index is reported for students with IEPs by grade level. Likewise, CPI is reported for all students by grade level.
Table 3.9: Longitudinal Data of ELA CPI; Students with IEPs: FFY2009-FFY2012
FFY2009-FFY2012 Longitudinal Data of ELA CPI; Students with IEPs
Students with IEPs
2010 2011 2012 2013 4-Year Change
2-Year Change
Gr. 3 68.2 64.9 64.7 63.4 -4.8 -1.3
Gr. 4 58.9 57.9 57.6 55.5 -3.4 -2.1
Gr. 5 63.1 66.1 60.5 62.3 -0.8 1.8
Gr. 6 65.8 66.0 62.9 63.1 -2.7 0.2
Gr. 7 68.9 70.8 67.7 68.3 -0.6 0.6
Gr. 8 71.4 73.5 74.5 69.9 -1.5 -4.6
Gr. 10 75.7 80.2 85.8 88.4 12.7 2.6
All Grades 67.3 68.3 67.3 66.8 -0.5 -0.5
Source: Massachusetts Comprehensive Assessment System (MCAS) and Massachusetts Student Information Management System (SIMS).
Table 3.10: Longitudinal Data of ELA CPI; All Students: FFY2009-FFY2012
Longitudinal Data of ELA CPI; All Students
All Students
2010 2011 2012 2013 4-Year Change
2-Year Change
Gr. 3 85.8 83.9 84.1 83.3 -2.5 -0.8
Gr. 4 80.1 79.4 80.0 78.9 -1.2 -1.1
Gr. 5 84.2 86.0 82.5 84.7 0.5 2.2
Gr. 6 86.8 86.6 84.8 85.1 -1.7 0.3
Gr. 7 88.6 89.5 88.1 88.4 -0.2 0.3
Gr. 8 90.4 91.1 91.8 90.1 -0.3 -1.7
Gr. 10 91.9 93.9 95.8 96.9 5 1.1
All Grades 86.9 87.2 86.7 86.8 -0.1 0.1
Source: Massachusetts Comprehensive Assessment System (MCAS) and Massachusetts Student Information Management System (SIMS). Analysis of the states slippage in Proficiency Rates for students with IEPs included disaggregated longitudinal data from CPI and SGP (Student Growth Percentiles), as well as statewide assessments across content areas and grade levels. Based on the analysis, MASSDE has determined that the trends in the data for special education students mirror the trends seen in the data for general education students. Slippage for both
Massachusetts Part B Annual Performance Report for FFY2012 18Submitted February 3, 2014
Massachusetts
populations is largely isolated to ELA performance in the lower grades. Additionally, there is a four year trend of strong improvements in ELA among grade 10 students with disabilities, gains which have exceeded the gains made among grade 10 students in general education. Tenth graders with IEPs have demonstrated 12.7 increase in ELA CPI scores over a four year period, compared to the 5 point gains made by their general education peers.
The proficiency rate for students with IEPs against grade level standards slipped in ELA from a CPI of 67.3 in FFY2011 to a CPI of 66.8 in FFY2012. Over the same time period proficiency rates improved in mathematics from a CPI of 56.9 in FFY2011 to 57.4 in FFY2012. The slippage in ELA Proficiency rates is largely attributed to primary grade performances. Notably, grade 10 ELA scores on statewide assessments have steadily improved over a four year period. The overall trends in special education mirror those of the general education with regards to proficiency in both ELA and Mathematics.
Improvement Activities
Consistent with instructions from OSERS, MASSDE is reporting one set of improvement activities in Appendix A of this report. Each activity references the relevant indicators, and is also listed in the MA SPP for those indicators.
Revisions, with Justification, to Proposed Targets / Improvement Activities / Timelines / Resources for FFY2012 (2012-2013):The MA SPP includes new or revised improvement activities, timelines, and resources to reflect new initiatives or to update existing initiatives.
Massachusetts Part B Annual Performance Report for FFY2012 19Submitted February 3, 2014
Massachusetts
Part B State Annual Performance Report (APR) for FFY2012Overview of the Annual Performance Report Development:
Monitoring Priority: FAPE in the LRE
Indicator 4: Rates of suspension and expulsion:
A. Percent of districts that have a significant discrepancy in the rate of suspensions and expulsions of greater than 10 days in a school year for children with IEPs; and
B. Percent of districts that have: (a) a significant discrepancy, by race or ethnicity, in the rate of suspensions and expulsions of greater than 10 days in a school year for children with IEPs; and (b) policies, procedures or practices that contribute to the significant discrepancy and do not comply with requirements relating to the development and implementation of IEPs, the use of positive behavioral interventions and supports, and procedural safeguards.
(20 U.S.C. 1416(a)(3)(A); 1412(a)(22))
Measurement:A. Percent = [(# of districts that have a significant discrepancy in the rates of suspensions and expulsions for
greater than 10 days in a school year of children with IEPs) divided by the (# of districts in the State)] times 100.
Massachusetts’ definition of “significant discrepancy” is a suspension/expulsion rate of five times the state rate for two consecutive years.
B. Percent = [(# of districts that have: (a) a significant discrepancy, by race or ethnicity, in the ratesof suspensions and expulsions of greater than 10 days in a school year of children with IEPs; and (b) policies, procedures or practices that contribute to the significant discrepancy and do not comply with requirements relating to the development and implementation of IEPs, the use of positive behavioral interventions and supports, and procedural safeguards) divided by the (# of districts in the State)] times 100.
Massachusetts’ definition of ”significant discrepancy”, by race or ethnicity, is a suspension /expulsion rate for students with disabilities in a particular race that is five times the state suspension rate for students with disabilities for three consecutive years.
Measurable and Rigorous Targets
FFY2012(2011-2012 data)
A: Percent of districts that have a significant discrepancy in the rates of
suspensions and expulsions for greater than 10 days in a school year of children
with IEPs
B: Percent of districts that have: (a) a significant discrepancy, by race or ethnicity, in
the rates of suspensions and expulsions of greater than 10 days in a school year of
children with IEPs; and (b) policies, procedures or practices that contribute to the
significant discrepancy and do not comply with requirements relating to the development and implementation of IEPs, the use of positive
behavioral interventions and supports, and procedural safeguards
0% 0%
Massachusetts Part B Annual Performance Report for FFY2012 20Submitted February 3, 2014
Massachusetts
Actual Target Data for FFY2012 (2011-2012 data per instructions for a one year data lag):
Indicator 4A: Districts that have rates of suspensions and expulsions for greater than 10 days in a school year of students with IEPs that are five times the State Rate for two consecutive years.
Total Number of Districts
2011-2012
2011-2012
State Suspension/ Expulsion Rate
for students with IEPs
Number of districts with suspension/
expulsion rate of five times State Rate in
2011-2012
% of districts with significant discrepancy in the rate of
suspensions and expulsions for two consecutive years (2010-2011 and 2011-2012)
386 1.1% 6 0.7%
(3 Districts)
*Thirteen districts with 30 or fewer students in special education were not included in the calculation.
Indicator 4B: Districts with (a) a discrepancy, by race or ethnicity, in the rates of suspensions and expulsions of greater than 10 days in a school year of students with IEPs 5 times the State Rate for three consecutive years; and (b) policies, procedures, or practices that contribute to the significant discrepancy and do not comply with requirements relating to the development and implementation of IEPs, the use of positive behavioral interventions and supports, and procedural safeguards
Year Total Number of Districts
2011-2012
Number of districts that have (a) a
significant discrepancy, by race or ethnicity, in the
rates of suspensions and expulsions of greater than 10 days in a school
year of children with IEPs
Number of districts that also have (b)
policies, procedures or practices that contribute to the
significant discrepancy and do
not comply with requirements relating to the
development and implementation of
IEPs, the use of positive behavioral interventions and
supports, and procedural safeguards
% of Districts
2011-2012 383 3 1 0.3%
* Ten districts with 10 or fewer students with disabilities in at least one ethnic group were not included in the calculation.
District level data for Indicator 4 are reported at http://profiles.doe.mass.edu/state_report/special_ed.aspx.
Discussion of Improvement Activities and Explanation of Slippage, if the State did not meet its target that occurred for FFY2012 (2011-2012 data):Indicator 4A
Massachusetts Part B Annual Performance Report for FFY2012 21Submitted February 3, 2014
The School Safety and Discipline Report (SSDR) provides individual level data on the disciplinary action received by a student for a drug or violence related incident, the disciplinary action received by a student with an IEP for any infraction, and an expulsion or suspension of more than 10 consecutive school days of a student without an IEP for non-drug or violence related activities. In-school suspensions, out-of-school suspensions, and removals to alternative educational settings are all counted. If the same student is disciplined on more than one occasion, he/she is counted separately for each infraction. MASSDE has noted significant variation anecdotally in how or if suspensions are reported across school districts; therefore, we present this data with caution. Notably, MASSDE is required to employ a one year data lag when reporting upon Indicator 4 data.
Three districts, or 0.7% of the districts in Massachusetts, had a suspension/expulsion rate five times the state rate for students with an IEP for greater than 10 days for two consecutive years. This is an improvement over the FFY2011 rate of significant discrepancy, which was 1.1%. Figure 4.1 below, shows the state’s results for Indicator 4A during the SPP period.
During 2011-2012, six districts (1.5%), including the three identified with significant discrepancy, had a suspension/expulsion rate five times the state rate for students with an IEP for greater than 10 days in FFY2012 only. This represents marginal improvement from the FFY2004 baseline of 1.8% for districts reporting a single year of exclusion that was five times the state rate. This change has occurred during a period in which special education enrollment is increasing. This trend is similar to the small decrease in statewide data for suspensions/expulsion for all students over the same time period as shown in Figure 4.2 below.
Figure 4.1: Percent of Districts with Significant Discrepancy in the Rate of Suspensions and Expulsions for Students with IEPs: FFY2005 – FFY2012
Source: Massachusetts Student Information Management System
Verification of Correction of Noncompliance (FFY2012)
MASSDE is reporting less than 100% compliance (greater than 0% target data for this indicator) for FFY2012 (2011-2012 data), and is therefore required to report on the verification of correction of noncompliance identified in accordance with the requirements of OSEP Memorandum 09-02: each district identified as noncompliant: 1) is correctly implementing the specific regulatory requirement(s), based upon a review of updated data; and 2) has corrected each individual case of noncompliance, unless the child is no longer within the jurisdiction of the district, consistent with OSEP Memo 09-02.
For each district reported to have a significant discrepancy, MASSDE engaged in a corrective actions process through Program Quality Assurance Services (PQA), focused on the programs review process (either the Coordinated Program Review (CPR) or a Mid-Cycle Review (MCR)). Specific corrective actions mandated by the state for the three districts reported here included a review and required revision of procedures, policies, and practices relating to the discipline of students with IEPs and students on accommodations plans under Section 504 of the Rehabilitation Act. Each district engaged in local analyses, and created and submitted corrective action plans for review by MASSDE.
MASSDE requires districts to submit reports and subsequent, updated data documenting successful implementation of corrective actions no later than one year following a finding of noncompliance. Inclusive of these reports, districts must identify specific steps for corrective actions and report progress made towards correcting issues of noncompliance. MASSDE reviewed these reports and additional data and information, as well as individual student records, to verify that 1) each district LEA has corrected individual cases of noncompliance for students currently within the district’s jurisdiction, and 2) each LEA is correctly implementing the regulatory requirements based upon the State’s review of updated data. MASSDE has verified that two of these districts have corrected identified noncompliance in accordance with OSEP Memorandum 09-02. To date, only one district has an “open” noncompliance finding related to Indicator 4A data reported here and the one-year period for correction has not yet been completed.
Verification of Correction of Noncompliance (FFY2010-FFY2011)
OSEP has instructed MASSDE to include in this report additional information about the steps that the state took
to verify that the noncompliance identified in FFY2010 (2009-2010 data) and FFY2011 (2010-2011 data) as a
result of its review conducted pursuant to Indicator 4 requirements. In accordance with the process described
above, MASSDE has verified that each LEA with noncompliance identified in FFY2010 and FFY2011 has: (1) correctly implemented the specific regulatory requirements based on a review of updated data and (2) has corrected each individual case of noncompliance, (unless the child is no longer within the jurisdiction of the LEA). Specific actions taken to verify corrections of noncompliance include review of subsequent data and
Massachusetts Part B Annual Performance Report for FFY2012 23Submitted February 3, 2014
Massachusetts
information collected through PQA monitoring processes, as well as secondary analysis such as desk reviews, on-site monitoring, and the statewide data collection of School Safety and Discipline Reports. There is no remaining outstanding noncompliance under Indicator 4A identified in the FFY2010 or FFY2011 APRs.
Indicator 4B For districts that have a significant discrepancy by race or ethnicity in the rates of suspensions and expulsions of greater than 10 days in a school year of children with IEPs, Indicator 4B requires MASSDE to engage in a secondary analysis of policies, procedures, or practices (PPPs) to determine whether the PPPs contributed to the significant discrepancy and do not comply with requirements relating to the development and implementation of IEPs, the use of positive behavioral interventions and supports, and procedural safeguards. Any district identified using this two-part analysis is considered to be noncompliant under Indicator 4B.
Using data from the FFY2012 reporting period (based on Massachusetts’ definition of significant discrepancy involving analysis of data from three consecutive years, concluding with 2011-2012), MASSDE conducted a secondary analysis for three districts flagged as having a rate of suspension that exceeds 5 times the state rate for three consecutive years. MASSDE determined that only one district had PPPs that contributed to the significant discrepancy. This is a noncompliance rate of 0.3%, and is the same as the rate reported in the FFY2011 APR.
There were modest improvements in the percentage of districts with suspension rates exceeding five times the State Rate for three consecutive years for students with IEPs by race or ethnicity from 2010-2011 to 2011-2012 (part (a) of the Indicator 4B analysis). In the FFY2011 APR, MASSDE identified five districts, out of 383 districts, with discrepancies that exceeded five times the state rate for three consecutive years. In this report, MASSDE identified three districts with discrepancies of the same scale. Since the FFY2010 report, the number of districts flagged under part (a) of the Indicator 4B analysis has declined annually, from seven, to five in the FFY2011 report, to three in this year’s reporting cycle.
Verification of Correction of Noncompliance (FFY2012)
MASSDE is required to report on the correction of noncompliance identified for this FFY2012 report. MASSDE found three districts that had a discrepancy by race or ethnicity, in the rates of suspensions and expulsions of greater than 10 days in a school year of children with IEPs. Of those districts, one had policies, procedures, or practices that contributed to the significant discrepancy and did not comply with requirements relating to the development and implementation of IEPs, the use of positive behavioral interventions and supports, and procedural safeguards. It is the same district for which noncompliance was identified in the FFY2011 MA APR with which MASSDE is continuing to work to verify correction of noncompliance.
Similar to the process under Indicator 4A for verifying that the identified noncompliance has been corrected, the MASSDE Special Education Planning and Policy (SEPP) office worked in cooperation with PQA to review the district’s compliance with federal and state laws regarding discipline for students with disabilities, their correct implementation of IEPs, the use of positive behavioral interventions and supports, and procedural safeguards. Subsequent data collection and information review by PQA, are used to verify that the district is correctly implementing all applicable regulatory requirements in the districts that have been identified as having significant discrepancy. Through these processes, PQA identifies deficiencies in policies, procedures, and practices that may contribute to significant discrepancy, orders corrective actions, provides technical assistance, and conducts subsequent review of student records and related information to ensure that any individual cases of noncompliance are corrected, unless the child is no longer within the district’s jurisdiction, and that the district is correctly implementing the specific regulatory requirements.
Since the district’s noncompliance was first identified, this district has made steady progress, with technical assistance from MASSDE, in reducing the rate of suspensions by race or ethnicity. While suspension rates for this district have consistently dropped over the course of three school years (FFY2010 - 8.8, FFY2011 - 7.5, FFY2012 - 6.4), the rate continues to exceed five times the annual state rate, however. Additionally, the district has addressed all concerns identified by MASSDE with regard to noncompliant policies, practices, and procedures that may have contributed to the significant discrepancy. As of the date of this report, MASSDE has verified that the district has corrected the identified noncompliance in accordance with the two step process required by OSEP Memorandum 09-02.
Verification of Correction of Noncompliance (FFY2011)
Massachusetts Part B Annual Performance Report for FFY2012 24Submitted February 3, 2014
Massachusetts
OSEP has instructed MASSDE to include in this report additional information about the steps that the state took to verify that the noncompliance identified in the FFY2011 APR has been corrected. The district identified in the FFY2011 APR is the same district identified under Indicator 4B in this FFY2012 report. As noted above, MASSDE, through its Program Quality Assurance unit, worked with the district to ensure that the identified noncompliance with regard to policies, practices, and procedures has been corrected, and has verified, in accordance with the two-step process required by OSEP Memorandum 09-02, that the noncompliance has been corrected appropriately.
Improvement Activities
Consistent with instructions from the Office of Special Education and Rehabilitative Services, MASSDE is reporting one set of improvement activities in Appendix A of this report. Each activity references the relevant indicators, and is also listed in the Massachusetts State Performance Plan (MA SPP) for those indicators. For purposes of this report, MASSDE would like to highlight several initiatives relevant to addressing issues identified under Indicator 4.
MASSDE has continued its statewide efforts to improve the quality of Indicator 4 data collection and reporting by local districts to the State. Based on reviews of district practices, MASSDE has identified data variations which are the result of inconsistent definitions in use at the local level. In response to these variations, MASSDE has increased its efforts to work with school districts on definitions and reporting systems to ensure that the data are appropriately identified and reported. Furthermore, MASSDE continues to target professional development and technical assistance to ensure that districts have an improved understanding of alternatives to suspension.
Dissemination of resources such as Technical Assistance Advisory SPED 2012-2: Improving Data and Practices Regarding Disciplinary Removals of Students with Disabilities, available at http://www.doe.mass.edu/sped/advisories/12_2ta.html, facilitates coordinated work in improving data collection and current practices. This technical assistance memorandum clarifies disciplinary policies, practices, procedures, and definitions including, but not limited to, suspension that constitutes a removal and must be reported to MASSDE. The advisory also incorporates a district self assessment of policies, procedures, or practices that may contribute to the number of students suspended for more than ten days or patterns of removal that represent a change in special education placement.
The Disciplinary Removals Self-Assessment Inventory, available at http://www.doe.mass.edu/sped/advisories/disciplinary_removals.pdf, is required to be completed for school districts that are identified as having a rate of suspension and expulsion in excess of five times the state rate, consistent with the measurements of Indicator 4. MASSDE is in the process of developing ways to work with districts to support their completion of the self-assessment and implementation of focused corrective actions that may be necessary to improve policies, practices, and procedures. This tool is available to all districts, also.
In addition, MASSDE has increased its efforts to design activities that benefit all students – those with or without IEPs – and align definitions, policies, procedures and intervention activities, wherever possible, to be consistent for all students. MASSDE’s Office of Tiered System of Support (OTSS) continues to focus on development of and implementation of the Massachusetts Tiered System of Support (MTSS), a framework for developing system level change across the classroom, school, and district to meet the academic and non-academic needs of all students, including students with disabilities, English language learners, and students who have already demonstrated mastery of the concepts and skills being taught. OTSS developed and posted an MTSS Blueprint (http://www.doe.mass.edu/sped/mtss.html) to assist districts with the implementation of supports for all students, as well as an MTSS district self-assessment tool to measure the level of implementation and fidelity of implementation of the tiers of supports. This self-assessment includes sections on High Quality School-wide Behavior/Social Rules, Supports and Expectations and Student Support including School Culture, Family and Community Engagement, and Problem Solving.
These collaborative efforts focused on improving data collection and reporting, and district practice for preventing suspension and promoting inclusion, and supportive school environments, will appropriately address continuous improvement for and compliance with Indicator 4 requirements.
Massachusetts Part B Annual Performance Report for FFY2012 25Submitted February 3, 2014
Revisions, with Justification, to Proposed Targets / Improvement Activities / Timelines / Resources for FFY2012 (2011-2012 data):The MA SPP includes new or revised improvement activities, timelines, and resources to reflect new initiatives or to update existing initiatives.
Part B State Annual Performance Report (APR) for FFY2012Overview of the Annual Performance Report Development:
Monitoring Priority: FAPE in the LRE
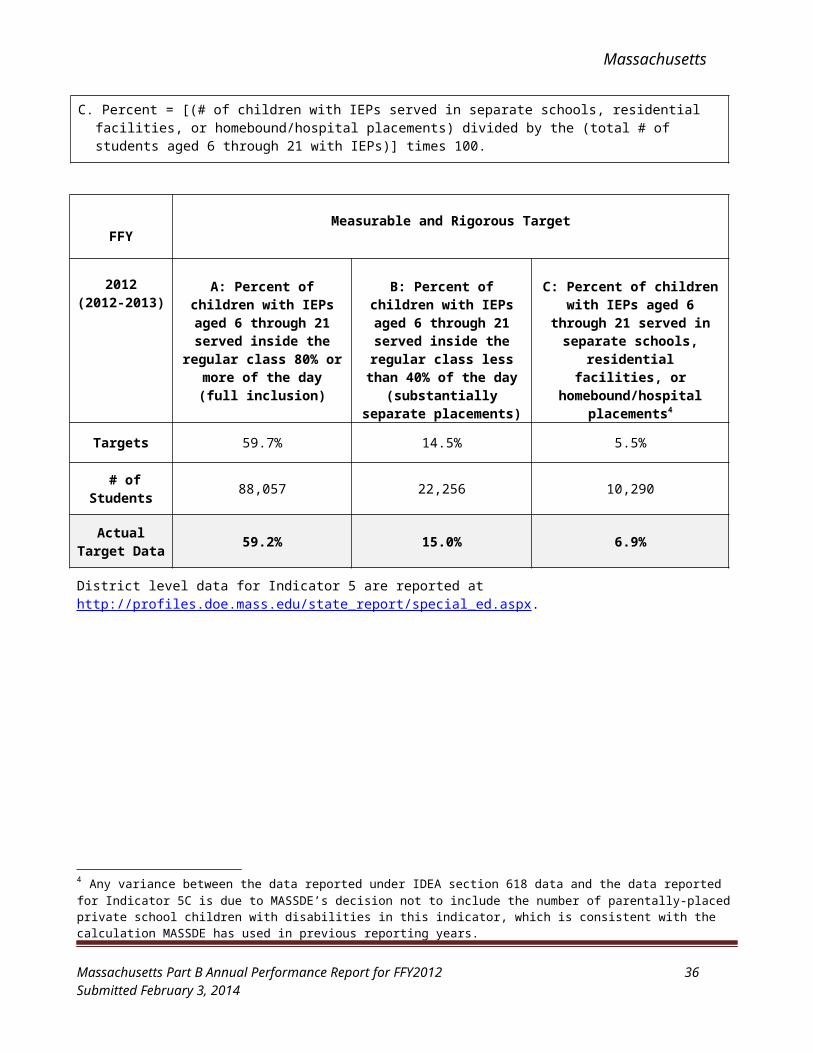
Indicator 5: Percent of children with IEPs aged 6 through 21 served:
A. Inside the regular class 80% or more of the day;
B. Inside the regular class less than 40% of the day; and
C. In separate schools, residential facilities, or homebound/hospital placements.
(20 U.S.C. 1416(a)(3)(A))
Measurement: A. Percent = [(# of children with IEPs served inside the regular class 80% or more of the day) divided by the
(total # of students aged 6 through 21 with IEPs)] times 100.
B. Percent = [(# of children with IEPs served inside the regular class less than 40% of the day) divided by the (total # of students aged 6 through 21 with IEPs)] times 100.
C. Percent = [(# of children with IEPs served in separate schools, residential facilities, or homebound/hospital placements) divided by the (total # of students aged 6 through 21 with IEPs)] times 100.
FFYMeasurable and Rigorous Target
Massachusetts Part B Annual Performance Report for FFY2012 26Submitted February 3, 2014
Massachusetts
2012 (2012-2013)
A: Percent of children with IEPs aged 6 through
21 served inside the regular class 80% or more of the day (full
inclusion)
B: Percent of children with IEPs aged 6 through
21 served inside the regular class less than
40% of the day (substantially separate
placements)
C: Percent of children with IEPs aged 6 through 21
served in separate schools, residential facilities, or homebound/hospital
placements4
Targets 59.7% 14.5% 5.5%
# of Students 88,057 22,256 10,290
Actual Target Data 59.2% 15.0% 6.9%
District level data for Indicator 5 are reported at http://profiles.doe.mass.edu/state_report/special_ed.aspx.
4 Any variance between the data reported under IDEA section 618 data and the data reported for Indicator 5C is due to MASSDE’s decision not to include the number of parentally-placed private school children with disabilities in this indicator, which is consistent with the calculation MASSDE has used in previous reporting years.
Massachusetts Part B Annual Performance Report for FFY2012 27Submitted February 3, 2014
Discussion of Improvement Activities and Explanation of Slippage, if the State did not meet its target, that occurred for FFY2012 (2012-2013):MASSDE’s FFY2012 data for Indicator 5 is consistent with the trends seen over the previous seven years of SPP data collection and reporting of educational placements of students on IEPs. While the percentage of students on IEPs who are served in the general education classroom for 80% or more of the day continued to rise in FFY2012, the percentage of students served in substantially separate and out-of-district placements remained stable (see Figure 5.1). As in previous years, the greatest year over year change in Massachusetts’ placement data was seen in the number of students with IEPs transitioning from partial inclusion (40-79% of the day spent in the general education environment) to full inclusion.
Figure 5.1: State Trends of Students with IEPs, Aged 6-21: FFY2004–FFY2012
*Out-of-District placements include separate schools, residential facilities, and homebound/hospital placements.
Source: Massachusetts Student Information Management System (SIMS).
Massachusetts Part B Annual Performance Report for FFY2012 28Submitted February 3, 2014
Massachusetts
Indicator 5A – Full Inclusion
In FFY2012, the total number of students between the ages of 6 and 21 receiving special education services was 148,846. Of those students, 88,058 (59.2%) had full inclusion placements or were served in the general education classroom for 80% or more of the school day. While this did not meet MASSDE’s rigorous target of 59.7%, it is a 1.1 percentage point increase in full inclusion placements from FFY2011 (see Figure 5.2). As noted above, the majority of movement in student placements was from partial inclusion to full inclusion.
Figure 5.2: Data Results for Students with IEPs in Full Inclusion: FFY2005-FFY2012
FFY 2005
FFY 2006
FFY 2007
FFY 2008
FFY 2009
FFY 2010
FFY 2011
FFY2012
0%
10%
20%
30%
40%
50%
60%
70%
49.1%52.9%
55.7% 56.8% 57.0% 57.9% 58.1% 59.2%
43.4% 43.4%
54.3% 55.5% 56.8% 58.0% 58.8% 59.7%
ActualTarget
Source: Massachusetts Student Information Management System (SIMS).
Indicator 5B – Substantially Separate PlacementsDuring the FFY2012 reporting period, 15.0% of students on IEPs, ages 6 through 21, were served in substantially separate placements. These 22,256 students spent less than 40% of the school day in the general education classroom. There was no change in the percentage of students served in substantially separate placements between FFY2011 and FFY2012 (see Figure 5.3). While MASSDE did not meet its rigorous target of 14.5%, the difference between the target and actual data was only 672 students.
The FFY2012 data for Indicator 5B remains consistent with the trend seen over the previous seven years; the percentage of students being served in substantially separate placements has remained nearly constant since the first data reported in the SPP in FFY2005. In FFY2013, as MASSDE considers making revisions to the IEP and accompanying forms, there will be an opportunity for the state and stakeholders to evaluate the forms and processes currently being used by districts to make placement decisions. Using this and other data, MASSDE will evaluate whether additional communication and support to districts around LRE decision-making would be appropriate.
Massachusetts Part B Annual Performance Report for FFY2012 29Submitted February 3, 2014
Massachusetts
Figure 5.3: Data Results for Students with IEPs in Substantially Separate Placements: FFY2005-FFY2012
Source: Massachusetts Student Information Management System (SIMS).
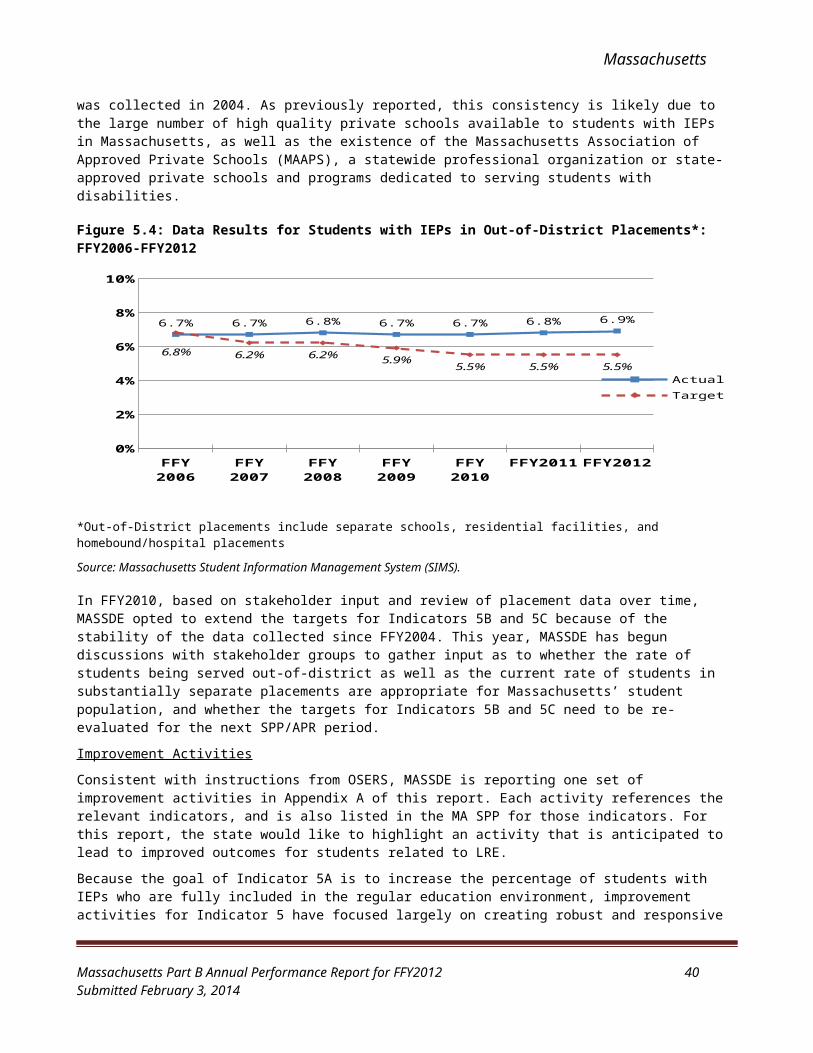
Indicator 5C – Separate Schools, Residential Facilities, or Homebound/Hospital PlacementsIn FFY2012, 10,290 students with IEPs (6.9%) had placements in separate schools, residential facilities, and/or homebound/hospital placements (see Figure 5.4). This was a 0.1 percentage point increase from FFY2011, but fell short of MASSDE’s target of 5.5% by only 140 students. As with Indicator 5B, the data for out-of-district placements has been nearly constant since baseline data for Indicator 5C was collected in 2004. As previously reported, this consistency is likely due to the large number of high quality private schools available to students with IEPs in Massachusetts, as well as the existence of the Massachusetts Association of Approved Private Schools (MAAPS), a statewide professional organization or state-approved private schools and programs dedicated to serving students with disabilities.
Figure 5.4: Data Results for Students with IEPs in Out-of-District Placements*: FFY2006-FFY2012
*Out-of-District placements include separate schools, residential facilities, and homebound/hospital placements
Source: Massachusetts Student Information Management System (SIMS).
Massachusetts Part B Annual Performance Report for FFY2012 30Submitted February 3, 2014
Massachusetts
In FFY2010, based on stakeholder input and review of placement data over time, MASSDE opted to extend the targets for Indicators 5B and 5C because of the stability of the data collected since FFY2004. This year, MASSDE has begun discussions with stakeholder groups to gather input as to whether the rate of students being served out-of-district as well as the current rate of students in substantially separate placements are appropriate for Massachusetts’ student population, and whether the targets for Indicators 5B and 5C need to be re-evaluated for the next SPP/APR period.
Improvement Activities
Consistent with instructions from OSERS, MASSDE is reporting one set of improvement activities in Appendix A of this report. Each activity references the relevant indicators, and is also listed in the MA SPP for those indicators. For this report, the state would like to highlight an activity that is anticipated to lead to improved outcomes for students related to LRE.
Because the goal of Indicator 5A is to increase the percentage of students with IEPs who are fully included in the regular education environment, improvement activities for Indicator 5 have focused largely on creating robust and responsive learning environments to support all students and on training educators and administrators in effective inclusive practices. The Partnership Project (TPP), a five-year project funded by an OSEP State Personnel Development Grant (SPDG), is one such initiative. Through TPP, MASSDE will support six districts as they implement evidence-based practices to create and/or strengthen accessible inclusive learning environments within a multi-tiered system of support. These six districts will serve as regional model sites that demonstrate the implementation of evidence-based practices and will provide opportunities for educators from across the Commonwealth to observe effective inclusive practices in action. As MASSDE’s data on student placements continue to show a strong correlation between districts in accountability levels 3 and 4 and districts with low rates of inclusion for students with IEPs, all but one of the districts chosen to become TPP model sites are Level 3 districts.
Educators and administrators in the six TPP districts will have access to evidence-based professional development activities, including face-to-face and online courses, trainings, and technical assistance. Topics of these professional development activities will include Universal Design for Learning (UDL), Positive Behavioral Interventions and Supports (PBIS), developing district-level structures and supports, academic content areas including literacy and mathematics, screening tools and professional development around the social emotional needs of young children, secondary transition and post-secondary planning, family engagement, and evidence-based professional development methods, including instructional rounds, coaching and mentoring, and professional learning communities (PLCs). TPP professional development activities will be supplemented with on-site support to ensure the implementation of newly acquired knowledge and skills with fidelity. These professional development activities, as well as practices, materials, and case studies developed through TPP, will be made available to districts across the Commonwealth, further building the capacity of Massachusetts districts to better serve all students in inclusive learning environments.
See Appendix A for additional information about TPP and other relevant improvement activities.
Revisions, with Justification, to Proposed Targets / Improvement Activities / Timelines / Resources for FFY2012 (2012-2013):The MA SPP includes new or revised improvement activities, timelines, and resources to reflect new initiatives or to update existing initiatives.
Massachusetts Part B Annual Performance Report for FFY2012 31Submitted February 3, 2014
Massachusetts
Part B State Annual Performance Report (APR) for FFY2012
Overview of the Annual Performance Report Development:
Monitoring Priority: FAPE in the LRE
Indicator 6: Percent of children aged 3 through 5 with IEPs attending a:
A. Regular early childhood program and receiving the majority of special education and related services in the regular early childhood program; and
B. Separate special education class, separate school or residential facility.
I(20 U.S.C. 1416(a)(3)(A))
Measurement: A. Percent = [(# of children aged 3 through 5 with IEPs attending a regular early childhood program and receiving the majority of special education and related services in the regular early childhood program) divided by the (total # of children aged 3 through 5 with IEPs)] times 100.
B. Percent = [(# of children aged 3 through 5 with IEPs attending a separate special education class, separate school or residential facility) divided by the (total # of children aged 3 through 5 with IEPs)] times 100.
Measurable and Rigorous Target and Actual Target Data for FFY2012 (2012-2013):
FFY2012 A: Percent of preschool students with IEPs receiving the majority of
services in the early childhood program
B: Percent of preschool students attending a separate special education class,
separate school, or residential facility
Target24% 13.9%
Actual Target Data
38.9% 15.1%
Discussion of Improvement Activities and Explanation of Slippage, if the State did not meet its target that occurred for FFY2012 (2012-2013):
Indicator 6A: During the FFY2012 reporting period, the total number of students with IEPs ages 3 through 5 was 16,583. Of those, 38.9%, or 6446 students, received a majority of their special education services in the early childhood program. This represents an increase of 14.9 percentage points from FFY2011 and exceeds MASSDE’s measurable and rigorous target of 24% of students receiving services in the early childhood program.
Indicator 6B:
Massachusetts Part B Annual Performance Report for FFY2012 32Submitted February 3, 2014
Massachusetts
The percentage of preschool students ages 3 through 5 attending a separate special education class, separate school, or residential facility in FFY2012 was 15.1% or 2,503 students. This was a 1.1 percentage point increase from FFY2011. MASSDE did not meet its measurable and rigorous target of 13.9%.
An analysis of the Indicator 6B data to evaluate the possible cause of this increase shows that there was no change year over year in this indicator for students identified in the state’s two largest disability categories, Developmental Delay and Communication. However, the third largest category, students with autism, saw both an increase in the number of students and the percentage placed in substantially separate settings. This may account for a portion of the year over year increase in Indicator 6B. Massachusetts is engaged in a number of ongoing improvement activities targeting preschool special education and Indicator 6 more specifically. Highlights of those activities are outlined below.
In addition, MASSDE conducted a district by district analysis of this data to identify any outliers on Indicators 6A and 6B. If districts with enrollment in the top 20 percent statewide for students with disabilities ages 3 to 5, saw significant changes in the Indicator 6 data year over year, MASSDE sent the district its local FFY2011 and FFY2012 data and state level data to evaluate the change. MASSDE contacted districts to discuss the results, including examining programmatic changes at the local level that may have affected the results, and to identify any data collection and reporting issues that may be contributed to the changes. MASSDE provided individualized technical assistance to the few districts where data reporting issues were identified. MASSDE was pleased to hear an overall trend across districts of a shift to inclusionary practices that contributed to the increase in Indicator 6A.
District level data for Indicator 6 are reported at: http://profiles.doe.mass.edu/state_report/special_ed.aspx.
Improvement Activities
Consistent with instructions from the Office of Special Education and Rehabilitative Services, MASSDE is reporting one set of improvement activities in Appendix A of this report. Each activity references the relevant indicators, and is also listed in the Massachusetts State Performance Plan (MA SPP) for those indicators. For this report, MASSDE would like to highlight several ongoing inter-agency initiatives that are aligned with efforts to improve data quality and to ensure that young children are served in the least restrictive environment.
In FFY2011, Massachusetts applied for and received a Race to the Top Early Learning Challenge Fund Award of $50 million for its proposal: From Birth to School Readiness: Massachusetts Early Learning Plan, 2012-1015. This initiative is advancing the goal of ensuring that all children, particularly high-needs children, have access to quality pre-K education. Key strategies of the plan include:
Aligning early education and grades K-3 to promote healthy child development; Implementing standards for early learning and development, including English language development
standards for children from birth to age 5; Creating the Massachusetts Early Learning and Development Assessment System (MELD) for birth to
grade three, including expanding screening for children and developing a common tool for kindergarten entry assessment;
Providing targeted technical assistance and professional development opportunities to early childhood educators to enhance their effectiveness; and
Increasing engagement with parents, families, and community members that is culturally and linguistically appropriate.
In FFY2012 MASSDE worked with WIDA (World-Class Instructional Design and Assessment) to support the roll-out of the Early English Language Development Framework and the Early Spanish Language Development Framework (MELD). MASSDE is in its second year of implementation of MELD with approximately 80 districts implementing new assessments as part of the kindergarten entry assessment initiative. An additional 90 districts will begin professional development for this project in FFY2013.
Additionally, in partnership with the Massachusetts Department of Early Education and Care (MEEC), MASSDE supports professional development and technical assistance activities for school district personnel focused on Indicator 6 data collection and support of young children and families. MEEC oversees The Inclusive Preschool Learning Environments Grant (IPLE), formerly known as Chapter 188/Phase I Direct Services of Community Partnership for Children Grant (CPC), that allows lead agencies to serve preschoolers with disabilities in high-
Massachusetts Part B Annual Performance Report for FFY2012 33Submitted February 3, 2014
quality inclusive settings with their typically developing same-aged peers. In addition, during FFY2012, Communities of Practice meetings were held quarterly throughout the state to support cross-systems collaborations on inclusive learning environments.
Revisions, with Justification, to Proposed Targets / Improvement Activities / Timelines / Resources for FFY2012 (2012-2013): The MA SPP includes new or revised improvement activities, timelines, and resources to reflect new initiatives or to update existing initiatives.
Massachusetts Part B Annual Performance Report for FFY2012 34Submitted February 3, 2014
Massachusetts
Part B State Annual Performance Report (APR) for FFY2012Overview of the Annual Performance Report Development:
Monitoring Priority: FAPE in the LRE
Indicator 7: Percent of preschool children aged 3 through 5 with IEPs who demonstrate improved:
A. Positive social-emotional skills (including social relationships);
B. Acquisition and use of knowledge and skills (including early language/ communication and early literacy); and
C. Use of appropriate behaviors to meet their needs.
(20 U.S.C. 1416 (a)(3)(A))
Measurement: Outcomes:
A. Positive social-emotional skills (including social relationships);
B. Acquisition and use of knowledge and skills (including early language/communication and early literacy); and
C. Use of appropriate behaviors to meet their needs.
Progress categories for A, B and C:
a. Percent of preschool children who did not improve functioning = [(# of preschool children who did not improve functioning) divided by (# of preschool children with IEPs assessed)] times 100.
b. Percent of preschool children who improved functioning but not sufficient to move nearer to functioning comparable to same-aged peers = [(# of preschool children who improved functioning but not sufficient to move nearer to functioning comparable to same-aged peers) divided by (# of preschool children with IEPs assessed)] times 100.
c. Percent of preschool children who improved functioning to a level nearer to same-aged peers but did not reach it = [(# of preschool children who improved functioning to a level nearer to same-aged peers but did not reach it) divided by (# of preschool children with IEPs assessed)] times 100.
d. Percent of preschool children who improved functioning to reach a level comparable to same-aged peers = [(# of preschool children who improved functioning to reach a level comparable to same-aged peers) divided by (# of preschool children with IEPs assessed)] times 100.
e. Percent of preschool children who maintained functioning at a level comparable to same-aged peers = [(# of preschool children who maintained functioning at a level comparable to same-aged peers) divided by (# of preschool children with IEPs assessed)] times 100.
Summary Statements for Each of the Three Outcomes:Summary Statement 1: Of those preschool children who entered the preschool program below age expectations in each Outcome, the percent who substantially increased their rate of growth by the time they turned 6 years of age or exited the program.
Measurement for Summary Statement 1: Percent = # of preschool children reported in progress category (c) plus # of preschool children reported in category (d) divided by [# of preschool children reported in progress category (a) plus # of preschool children reported in progress category (b) plus # of preschool children reported in progress category (c) plus # of preschool children reported in progress category (d)] times 100.
Massachusetts Part B Annual Performance Report for FFY2012 35Submitted February 3, 2014
Massachusetts
Summary Statement 2: The percent of preschool children who were functioning within age expectations in each Outcome by the time they turned 6 years of age or exited the program.
Measurement for Summary Statement 2: Percent = # of preschool children reported in progress category (d) plus [# of preschool children reported in progress category (e) divided by the total # of preschool children reported in progress categories (a) + (b) + (c) + (d) + (e)] times 100.
Measurable and Rigorous Targets and Actual Target Data for FFY2012 (2012-2013):
Summary StatementsActual
FFY2011(% and # children)
Actual FFY2012 (% and # children)
Target FFY2012
(% of children)
Outcome A: Positive social-emotional skills (including social relationships)
1. Of those children who entered or exited the program below age expectations in Outcome A, the percent who substantially increased their rate of growth by the time they exited the program. Formula: c+d/ a+b+c+d
83.1%n=1108
84.3%n=750
92%
2. The percent of children who were functioning within age expectations in Outcome A by the time they exited the program. Formula: d+e/ a+b+c+d+e
54.4%n=1108
47.5%n=750
88%
Outcome B: Acquisition and use of knowledge and skills (including early language/communication and early literacy)
1. Of those children who entered or exited the program below age expectations in Outcome B, the percent who substantially increased their rate of growth by the time they exited the program. Formula: c+d/ a+b+c+d
83.3%n=1108
84.6%n=750
92%
2. The percent of children who were functioning within age expectations in Outcome B by the time they exited the program. Formula: d+e/ a+b+c+d+e
54.9%n=1108
49.5%n=750
88%
Outcome C: Use of appropriate behaviors to meet their needs
1. Of those children who entered or exited the program below age expectations in Outcome C, the percent who substantially increased their rate of growth by the time they exited the program. Formula: c+d/ a+b+c+d
85.3%n=1108
87.7%n=750
92%
2. The percent of children who were functioning within age expectations in Outcome C by the time they exited the program. Formula: d+e/ a+b+c+d+e
66.5%n=1108
59.9%n=750
88%
District level outcomes data for Indicator 7 are available at http://profiles.doe.mass.edu/state_report/special_ed.aspx.
Massachusetts Part B Annual Performance Report for FFY2012 36Submitted February 3, 2014
Progress Data for Preschool Children FFY2012 (2012-2013):
Outcome A: Positive social-emotional skills (including social relationships)
Number of children
% of children
a. Percent of children who did not improve functioning 17 2.3%
b. Percent of children who improved functioning but not sufficient to move nearer to functioning comparable to same-aged peers 87 11.6%
c. Percent of children who improved functioning to a level nearer to same-aged peers but did not reach 290 38.7%
d. Percent of children who improved functioning to reach a level comparable to same-aged peers 270 36.0%
e. Percent of children who maintained functioning at a level comparable to same-aged peers 86 11.5%
Total 750 100%
Outcome B: Acquisition and use of knowledge and skills (including early language/communication and early literacy)
Number of children
% of children
a. Percent of children who did not improve functioning 12 1.6%
b. Percent of children who improved functioning but not sufficient to move nearer to functioning comparable to same-aged peers 88 11.7%
c. Percent of children who improved functioning to a level nearer to same-aged peers but did not reach 279 37.2%
d. Percent of children who improved functioning to reach a level comparable to same-aged peers 272 36.2%
e. Percent of children who maintained functioning at a level comparable to same-aged peers 99 13.2%
Total 750 100%
Outcome C: Use of appropriate behaviors to meet their needs Number of children
% of children
a. Percent of children who did not improve functioning 14 1.9%
b. Percent of children who improved functioning but not sufficient to move nearer to functioning comparable to same-aged peers 60 8.0%
c. Percent of children who improved functioning to a level nearer to same-aged peers but did not reach 227 30.3%
d. Percent of children who improved functioning to reach a level comparable to same-aged peers 299 39.9%
e. Percent of children who maintained functioning at a level comparable to same-aged peers 150 20.0%
Total 750 100%
Massachusetts Part B Annual Performance Report for FFY2012 37Submitted February 3, 2014
Massachusetts
Discussion of Improvement Activities and Explanation of Slippage, if the State did not meet its target, that occurred for FFY2012 (2012-2013):Outcome A: Positive social-emotional skills (including social relationships)
Summary Statement 1: Of those children who entered or exited the program below age expectations in Outcome A, the percent who substantially increased their rate of growth by the time they exited the program.
The FFY2012 Summary State 1 result for Outcome A was 84.3%, representing an increase of 1.2 percentage points over the FFY2011 result of 83.1%, but falling short of the measurable and rigorous target of 92%. As shown in Figure 7.1 below, the FFY2012 results are consistent with an overall trend of improvement in Outcome A, Summary Statement 1 and reflect a greater than 20 percentage point increase over the FFY2006 results.
Summary Statement 2: The percent of children who were functioning within age expectations in Outcome A by the time they exited the program.
The FFY2012 Summary Statement 2 result for Outcome A was 47.5% , a decrease of 6.9 percentage points from FFY2011 and below the target of 88%. In FFY2011 and FFY2012, MASSDE had several initiatives that focused on improving the quality of Indicator 7 data, including professional development on understanding the Child Outcomes Summary Form ratings and age expected functioning as it relates to the ratings. As anticipated, MASSDE has seen a slight downward shift in Summary Statement 2 for all three outcomes as knowledge of how to use the rating scale appropriately has minimized the over identification of students as functioning within age expectations across settings and situations at exit. From FFY2007 to FFY2012, MASSDE has seen fairly stable results for Outcome A, Summary Statement 2.
Figure 7.1: Summary Statement Results for Outcome A (Positive Social-Emotional Skills): FFY2006-FFY2012
Source: Massachusetts Part B Indicator 7 District Reported Student Outcomes Data
Massachusetts Part B Annual Performance Report for FFY2012 38Submitted February 3, 2014
Massachusetts
Progress Data for Outcome A:
The progress data for Outcome A reflect the statewide trend across all three outcomes in which there is an increase in the percentage of children who substantially increased their rate of growth, but a decrease in the number of children who are functioning within age expectations by the time they exited the program. For Outcome A, MASSDE saw increases in FFY2012 over FFY2011 in progress categories a (children who did not improve functioning) and c (children who improved functioning to a level nearer to same-aged peers but did not reach) of 1.2 and 7.3 percentage points, respectively. The FFY2012 result for progress category a was 2.3% and for progress category c it was 38.7%. The percentage of students in progress category b (the percent of children who improved functioning but not sufficient to move nearer to functioning comparable to same-aged peers) decreased to 11.6% from 13.1% in FFY2011. MASSDE also saw decreases in progress categories d (percent of children who improved functioning to reach a level comparable to same–aged peers) and e (percent of children who maintained functioning at a level comparable to same-aged peers), consistent with more accurate use of the Child Outcome Summary Form Rating Scale and an improved understanding by districts of age expected functioning as it relates to the three Outcomes. The FFY2012 result for progress category d was 36%, a decrease of 2.4 percentage points from the FFY2011 results, and the FFY2012 result for progress category e was 11.5%, a decrease of 4.6 percentage points from the FFY2011 results.
Outcome B: Acquisition and use of knowledge and skills (including early language/ communication and early literacy)
Summary Statement 1: Of those children who entered or exited the program below age expectations in Outcome B, the percent who substantially increased their rate of growth by the time they exited the program.
The FFY2012 result for Outcome B, Summary Statement 1 was 84.6%, a 1.3 percentage point increase over the FFY2011 result of 83.3%. While this represents an improvement year over year, MASSDE did not reach its target of 92%. However, as shown in Figure 7.2, this increase is consistent with an overall upward trend in Summary Statement 1 for Outcome B, with an increase of over 20 percentage points from FFY2006.
Summary Statement 2: The percent of children who were functioning within age expectations in Outcome B by the time they exited the program.
The FFY2012 result for Outcome B, Summary Statement 2 was 49.5%, a 5.4 percentage point decrease over the FFY2011 result of 54.9% and below the target of 88%. As described above and in Appendix A, MASSDE sponsored a number of improvement activities that focused on improving the quality of Indicator 7 data and understanding of age expected functioning. These results are consistent with an expectation that this improved understanding might lead to lower Summary Statement 2 results in FFY2012 across the outcomes as data more accurately represents actual levels of functioning.
Massachusetts Part B Annual Performance Report for FFY2012 39Submitted February 3, 2014
Massachusetts
Figure 7.2: Summary Statement Results for Outcome B (Acquisition of Knowledge and Skills): FFY2006-FFY2012
Source: Massachusetts Part B Indicator 7 District Reported Student Outcomes Data
Progress Data for Outcome B:
The progress category data for outcome B was very similar to Outcome A, with increases from FFY2011 in progress categories a and c and decreases from FFY2011 in progress categories b, d, and e. In progress category a, MASSDE saw an increase of 0.4 percentage point from the FFY2011 result (1.2%). The FFY2012 result of 37.2% for progress category c is an increase of 5.8 percentage points over the FFY2011 result of 31.4%. Progress categories b and d saw small decreases from FFY2011 of .8 and .6 percentage points, respectively. The FFY2012 results were 11.7% for progress category b and 36.2% for progress category d. MASSDE saw the greatest decrease for Outcome B in progress category e. The FFY2012 result was 13.2%, a 4.9 percentage point decrease from the FFY2011 result of 18.1%, indicating that a smaller percentage of students maintained functioning at a level comparable to same-aged peers than in FFY2011, consistent with MASSDE’s findings on the other outcomes.
Outcome C: Use of appropriate behaviors to meet their needsSummary Statement 1: Of those children who entered or exited the program below age expectations in Outcome C, the percent who substantially increased their rate of growth by the time they exited the program.
The FFY2012 result for Outcome C, Summary Statement 1 was 87.7%, an increase of 2.4 percentage points from the FFY2011 result of 85.3%. While MASSDE has seen its greatest rate of growth and the highest percentage of students exiting at age expected functioning in this outcome, MASSDE did not meet its target of 92%.
Summary Statement 2: The percent of children who were functioning within age expectations in Outcome C by the time they exited the program.
The FFY2012 result for Outcome C, Summary Statement 2 was 59.9%, a decrease of 6.1 percentage points from the FFY2011 result of 66.0%. MASSDE did not meet its target of 88%. However, the results for Outcome
Massachusetts Part B Annual Performance Report for FFY2012 40Submitted February 3, 2014
Massachusetts
C, Summary Statement 2, are the highest of the three Summary Statement 2 results. Figure 7.3 shows the results for Summary Statements 1 and 2 for Outcome C over time.
Figure 7.3: Summary Statement Results for Outcome C (Appropriate Behavior to Meet Their Needs): FFY2006-FFY2012
Source: Massachusetts Part B Indicator 7 District Reported Student Outcomes Data
Progress Data for Outcome C:
Similar to Outcomes A and B, for Outcome C MASSDE saw increases in progress categories a and c and decreases in progress categories b, d, and e. For FFY2012, the progress category results were as follows: progress category a (1.9%, an increase of 1.4 percentage points over the FFY2011 result of 0.5%); progress category b (8.0%, a decrease of 2.5 percentage points over the FFY2011 result of 10.6%); progress category c (30.3%, a decrease of 7.8 percentage points over the FFY2011 result of 22.5%); progress category d (39.9%, a decrease of 1.4 percentage points over the FFY2011 result of 41.3%); and progress category e (20.0%, a decrease of 5.2 percentage points over the FFY2011 result of 25.2%).
Longitudinal discussion
From FFY2006 to FFY2012, MASSDE has seen a fairly steady increase in the summary statement results for all three Indicator 7 outcomes. MASSDE has consistently seen the most positive results for Outcome C: Appropriate behavior to meet their needs. Outcomes A and B have seen somewhat lower percentages for both summary statements across the data collection timeframe but have still seen increases year over year. MASSDE saw the lowest results for both summary statements on all three outcomes in FFY2006. Given that FFY2006 was the first year of data collection and that the data set only included students from one cohort, some data reporting variation is to be expected. As described earlier, the overall decreases in the Summary Statement 2 values for each outcome in FFY2012 are the result of increased understanding of age expected functioning and appropriate use of the seven point Child Outcomes Summary Process rating scale as a result of ongoing training. While MASSDE did not meet its rigorous targets for any of the summary statements, the strong results for FFY2012 reflect a continuing trend of improvement and are the result of ongoing statewide and individualized technical assistance intended to improve outcomes for students receiving early childhood special education services across Massachusetts.
Massachusetts Part B Annual Performance Report for FFY2012 41Submitted February 3, 2014
Massachusetts
Improvement Activities
Consistent with instruction from OSERS, MASSDE is reporting one set of improvement activities in Appendix A of this report. Each activity references the relevant indicators, and is also listed in the MA SPP for those indicators. For this report, MASSDE would like to highlight several ongoing inter-agency initiatives that are aligned with efforts to improve data quality and to ensure that young children are served in the least restrictive environment. In addition, MASSDE would like to highlight several activities from FFY2012 that have focused on improving the quality of data collection and reporting for this indicator, and early childhood outcomes.
Throughout the data collection and analysis process, MASSDE provided technical assistance to district personnel and implemented additional processes to ensure the accuracy of reported data, including following up with districts whose data was questionable or incomplete. MASSDE also requested copies of Child Outcomes Summary Forms (COSFs) from a subset of districts reporting exit data in FFY2012. COSFs were reviewed by ESE staff and individualized technical assistance was provided based on the COSFs received.
Districts are asked to report their data using the COS Calculator Model 2.0 – Analytic Versions with Expanded Descriptive Output and Summary Statements for 150 Cases (4/16/10). This excel file, created by the Early Childhood Outcomes Center, has functionality that allows districts to use summary form ratings data to generate OSEP progress category information on child outcomes, summary statement percentages, charts showing entry and exit ratings, descriptive information on “a” and “e” progress categories across all three outcomes, and basic descriptive information about the data. Each district received training on how to input student data into the spreadsheet, instructions on how to transmit the data to MASSDE, and how to interpret the charts and information generated by the spreadsheet.
In collaboration with the Massachusetts Department of Early Education and Care (MEEC), MASSDE supported additional activities related to improving early childhood outcomes and Indicator 7. Trainers from the Early Childhood Outcomes Center hosted two 1-day trainings in June 2013 on the Child Outcomes Summary Process titled “It’s Not Just the Numbers: Making the Child Outcomes Summary (COS) Process a Meaningful Part of Your Practice & Program”. Special Education Directors, Early Childhood Coordinators, and teachers participating in the Child Outcomes Summary Process (Indicator 7) were invited to attend. In addition, MEEC offered three 2-day trainings on social/emotional management across the Commonwealth. Communities of Practice meetings were also held across the state, including: “Engaging families through social emotional development resources: Using the CSEFEL family tools and materials.”
Revisions, with Justification, to Proposed Targets / Improvement Activities / Timelines / Resources for FFY2012 (2012-2013): The MA SPP includes new or revised improvement activities, timelines, and resources to reflect new initiatives or to update existing initiatives.
Massachusetts Part B Annual Performance Report for FFY2012 42Submitted February 3, 2014
Massachusetts
Part B State Annual Performance Report (APR) for FFY2012Overview of the Annual Performance Report Development:
Monitoring Priority: FAPE in the LRE
Indicator 8: Percent of parents with a child receiving special education services who report that schools facilitated parent involvement as a means of improving services and results for children with disabilities.Indicator #8: Parent Involvement(20 U.S.C. 1416(a)(3)(A))
Measurement: Percent = [(# of respondent parents who report schools facilitated parent involvement as a means of improving services and results for children with disabilities) divided by the (total # of respondent parents of children with disabilities)] times 100.
FFY Measurable and Rigorous Target
2012 (2012-2013)
85%
Actual Target Data for FFY2012 (2012-2013):
FFY # of Surveys Issued
# of Surveys Returned
% of Surveys Returned
# of Surveys Meeting
Standard*
% of Surveys Meeting Standard
2012 (2012-2013) 36,045 2,933 8.1% 2,377 79.7%
*The standard adopted to demonstrate “that schools facilitated parent involvement as a means of improving services and results for students with disabilities” requires the survey respondent to agree, strongly agree, or very strongly agree on at least 50% of the survey items (13 of 26 items for parents of students with disabilities in preschool through grade 6; 15 of 29 items for parents of students with disabilities in middle school, high school and post high school).
In FFY2012, MASSDE surveyed Massachusetts schools using the established cohort model of data collection, as described in the MA SPP. The Indicator 8 survey is available for all families of each district within the cohort. A total of 96 districts representative of the state were included in the survey process. Response rates were calculated based on an estimated parent population of 251,573, of which, 36,045 are parents of students with disabilities. Of the 12,139 survey responses received, 2,933 were from parents who reported their child received special education services, yielding a response rate of 8.1 percent based on the estimated parent population of 36,045.
Of the parents of students with disabilities, 79.7% reported that schools facilitated their involvement as a means of improving services and results for students with disabilities. MASSDE did not meet the FFY 2012 measureable and rigorous target of 85%.
District level data for Indicator 8 are reported at http://profiles.doe.mass.edu/state_report/special_ed.aspx.
Massachusetts Part B Annual Performance Report for FFY2012 43Submitted February 3, 2014
Discussion of Improvement Activities and Explanation of Slippage, if the State did not meet its target that occurred for FFY2012 (2012-2013):In FFY2012, the percentage of surveys meeting the established standard was 79.7%, 5.3 percentage points below the measurable and rigorous target of 85.0% for the reporting period, and 2.8 percentage points below the FFY2011 reported rate.
For the parent survey, the percent of parents reporting that schools facilitate their involvement is based on the total number of questions that were answered by parents of students with disabilities and is defined as follows:
1. For parents of early childhood/elementary students with a disability, this represents the percent of parents who were in agreement with 13 or more of the 26 questions answered.
2. For parents of middle, high and post high school students with a disability, this represents the percent of parents who were in agreement with 15 or more of the 29 questions answered.
Overall, 2,337 of the 2,933, or 79.7 percent, of parents of students with disabilities reported that schools facilitate their involvement. 74.3 percent of all parents of students with disabilities responding to the early childhood and elementary school survey items agreed with more than half of these items. 67.7 percent of all parents of students with disabilities responding to the middle, high and post high school survey items agreed with half of these items.
Analysis of the data from the past four surveys reveals that families of students with disabilities consistently indicate the same items as areas of high and low agreement. In early childhood/elementary grades, families have a relatively high rate of agreement (81.0-84.0%) that their children had a positive experience during his/her preparation to transition from grade to grade. In contrast, there is a lower rate of agreement (50.0-59.0%) that families are given information about organizations that support parents for parents of students with disabilities; and that the school invites parents to attend training sessions relating to the needs of children with disabilities and their families (55.0%). Families of students with disabilities in middle school/high school/post high school report that their children received enough information about the new school/next grade to prepare him/her for the transition (75.0-80.0%), yet have a low rate of agreement (48.0-52.0%) that the school staff provides information on community resources that can assist in the transition from school to adult life.
The web-based tool methodology resulted in the calculation of “response rates” for the internet-based survey based on the total estimated parent population for the cohort and not on the number of parents who actually received a parent survey. (Prior to 2009, parents of students with disabilities were mailed a parent survey.) This calculation supposes that all parents of enrolled students in the participating districts have received the survey. Under this methodology, MASSDE has reported lower response rates for parents of students with disabilities compared to response rates seen prior to the revision. (See Table 8.1 below.) This “response rate” may be artificially low because all parents did not directly receive the survey, but instead, had to access the survey independently.
Massachusetts Part B Annual Performance Report for FFY2012 44Submitted February 3, 2014
Massachusetts
Figure 8.1: Data Results for Parents Reporting that Schools Facilitates Parent Involvement as a Means of Improving Service and Results for Students with Disabilities: FFY2005-FFY2012
Source: Massachusetts Parent Involvement Survey for FFY2012.
Figure 8.1 above indicates the longitudinal data for Indicator 8. There has been an overall trend of increased agreement from parents of students with disabilities as indicated by a 3.7 percentage point increase since FFY2005.
For FFY2012, MASSDE provided technical assistance to school districts to support their efforts to increase survey response rates. The focused activities were a direct result of discussions with stakeholders. Massachusetts recognized that an increased response rate results in richer data. MASSDE’s assistance included informing districts of timelines, providing resources about the fundamentals of family engagement, and developing strategies for outreach to families about the survey. Informational Webinars and increased follow-up with districts during the survey period informed districts of the process and their status. As a result, the FFY2012 response rate of 8.1% was an increase of 0.9% from the FFY2011 response rate of 7.2%.
While the data indicate an increase in the response rate for FFY2012, the response rate remains low, particularly from non-English speaking families. While the response rate is low from non-English speaking families, as reflected in previous years’ results, the highest level of parent agreement was related to teachers and school personnel respecting cultural heritage with an agreement rate of 93.3% by families of students with disabilities with a primary language of the home other than English. MASSDE continues to work with stakeholders to enhance outreach activities to multilingual families.
Improvement Activities
Consistent with instructions from OSERS, MASSDE is reporting one set of improvement activities in Appendix A of this report. Each activity references the relevant indicators, and is also listed in the MA SPP for those indicators. For this report, Massachusetts would like to highlight several activities focusing on supporting districts with the Indicator 8 survey process and family engagement generally that occurred in FFY2012. MASSDE conducted a webinar on the survey process and facilitation was provided along with teleconference opportunities. Outreach to districts during the survey period was increased to include strategies to encourage participation, updates on participation and information on how to interpret district data.
To increase awareness and enhance family engagement activities in education, MASSDE has developed professional development in family and school partnerships as part of the coursework available through the Mass Focus Academy. The course provides educators with the knowledge and skills required to develop and strengthen collaborative partnerships with families. Educators are able to enroll and participate in semester long courses offered in the fall and spring.
MASSDE continues to work in partnership with the Federation of Children with Special Needs (FCSN) around family engagement outreach and activities. MASSDE has worked with FCSN to expand the A.P.P.L.E
Massachusetts Part B Annual Performance Report for FFY2012 45Submitted February 3, 2014
Massachusetts
(Advancing Parent-Professional Leadership in Education) Project. The FCSN, with support from MASSDE offered a 3 day training program for nine school district teams; including parents and a special education administrator. This program fosters strong and effective parent-professional collaboration which improves results for children.
Revisions, with Justification, to Proposed Targets / Improvement Activities / Timelines / Resources for FFY2012 (2012-2013):The MA SPP includes new or revised improvement activities, timelines, and resources to reflect new initiatives or to update existing initiatives.
Massachusetts Part B Annual Performance Report for FFY2012 46Submitted February 3, 2014
Massachusetts
Part B State Annual Performance Report (APR) for FFY2012Overview of the Annual Performance Report Development:
Monitoring Priority: Disproportionality
Indicator 9: Percent of districts with disproportionate representation of racial and ethnic groups in special education and related services that is the result of inappropriate identification.
y – Child with a Disability(20 U.S.C. 1416(a)(3)(C))
Measurement:Percent = [(# of districts with disproportionate representation of racial and ethnic groups in special education and related services that is the result of inappropriate identification) divided by the (# of districts in the State)] times 100.
State’s definition of “disproportionate representation”:
Massachusetts defines “disproportionate representation” using a calculation of weighted or alternate risk ratio and a review of the appropriateness of a district’s policies, procedures, and practices (PPPs) for identifying students as disabled.
MASSDE calculates a weighted or alternate risk ratio for each school district using the techniques described in detail in Westat’s Methods for Assessing Racial/Ethnic Disproportionality in Special Education (http://www.ideadata.org/docs/Disproportionality%20Technical%20Assistance%20Guide.pdf). The state uses a minimum cell size of 10 for each race/ethnic group in every district. A cell of less than 10, though removed from the calculation, is reviewed individually to see if data irregularities for specific racial and ethnic groups in the district would suggest disproportionate representation due to inappropriate identification. All cells of greater than 10 are retained in the data set and are used to calculate disproportionate representation. Once the calculation is made for each district, the weighted risk ratios are compared to the two previous years’ weighted risk ratios. Districts are flagged if for 3 consecutive years, they exhibit a weighted risk ratio of 3.0 or greater for possible over-representation.
All districts identified by way of this quantitative analysis are then subject to a review of the appropriateness of their PPPs for special education eligibility determination and disability identification.
Description of determination that disproportionate representation is due to inappropriate identification:A district identified using the measurement techniques described above submits its current PPPs to MASSDE where they are reviewed. If the reviewers conclude that the PPPs were inappropriate or otherwise inconsistent with federal and state regulations, and concludes that the PPPs likely caused the disproportionate representation at least to some degree, then a district is identified as having disproportionate representation due to inappropriate identification.
FFYMeasurable and Rigorous Target
2012(2012-2013) 0%
Massachusetts Part B Annual Performance Report for FFY2012 47Submitted February 3, 2014
Number of Districts with Disproportionate Representation of Racial and Ethnic Groups that was the Result of Inappropriate
Identification
Percent of Districts
2012 (2012-2013) 400 0 0 0%
District level data for Indicator 9 are reported at http://profiles.doe.mass.edu/state_report/special_ed.aspx.
Discussion of Improvement Activities and Explanation of Slippage, if the State did not meet its target, that occurred for FFY2012 (2012-2013):Massachusetts used the October 1, 2012 enrollment and child count data to calculate disproportionality in the FFY2012 APR. In this reporting period, one out of 400 districts were excluded from the numerator as a result of the minimum n size requirement; all districts were included in the denominator.
Using the measurement criteria establish above, MASSDE determined that zero districts met the data threshold for disproportionate over-representation of racial and ethnic groups in special education and related services. MASSDE was therefore, not required to engage in the second step of the analysis and did not review any district’s policies, practices, and procedures to assess possible inappropriate identification. In FFY2012, MASSDE met its measurable and rigorous target.
For the past four reporting cycles, MASSDE has identified an average of approximately one district each year as meeting the threshold for disproportionate over-representation of racial and ethnic groups in special education and services. Looking longitudinally, MASSDE reached its measurable and rigorous target each year.
Table 9.1: Data Results for Disproportionate Representation of Racial and Ethnic Groups in Special Education That Was the Result of Inappropriate Identification: FFY2009-FFY2012
Fiscal Year
Number of Districts with Disproportionate
Representation of Racial and Ethnic Groups in Special
Education
Number of Districts with Disproportionate Representation of Racial and Ethnic
Groups in Special Education That Was the Result of Inappropriate Identification
Percent of Districts
2012 0 0 0%
2011 2 0 0%
2010 0 0 0%
2009 1 0 0%
Improvement Activities
Consistent with instruction from OSERS, MASSDE is reporting one set of improvement activities in Appendix A of this report. Each activity references the relevant indicators, and is also listed in the MA SPP for those indicators.
For purposes of this report, MASSDE would like to highlight the distribution of a document, Disproportionality in Special Education Identification: FAQ, to districts this year upon the identification of disproportionate representation in specific disability categories or racial and ethnic groups in special education. The document was written in response to questions from the field about the measurement of disproportionality, its implications, and necessary actions MASSDE and the district must take when disproportionality is identified.
Massachusetts Part B Annual Performance Report for FFY2012 48Submitted February 3, 2014
Revisions, with Justification, to Proposed Targets / Improvement Activities / Timelines / Resources for FFY2012 (2012-2013):The MA SPP for Indicator 9 was revised to correct a misreporting of the minimum cell size for the calculation. The correct cell size, which has been used in each year of the SPP/APR reporting period, is 10.
Massachusetts Part B Annual Performance Report for FFY2012 49Submitted February 3, 2014
Massachusetts
Part B State Annual Performance Report (APR) for FFY2012Overview of the Annual Performance Report Development:
Monitoring Priority: Disproportionality
Indicator 10: Percent of districts with disproportionate representation of racial and ethnic groups in specific disability categories that is the result of inappropriate identification.I(20 U.S.C. 1416(a)(3)(C))
Measurement:Percent = [(# of districts with disproportionate representation of racial and ethnic groups in specific disability categories that is the result of inappropriate identification) divided by the (# of districts in the State)] times 100.
State’s definition of “disproportionate representation”:
Massachusetts defines “disproportionate representation” using a calculation of weighted or alternate risk ratio and a review of the appropriateness of a district’s policies, practices, and procedures (PPPs) for identifying students as disabled.
MASSDE calculates a weighted or alternate risk ratio for every school district in each of the six required disability categories (intellectual impairments, specific learning disabilities, emotional disturbance, speech/language impairments, other health impairments, autism) using the techniques described in Westat’s Methods for Assessing Racial/Ethnic Disproportionality in Special Education (http://www.ideadata.org/docs/Disproportionality%20Technical%20Assistance%20Guide.pdf ). The state uses a minimum cell size of 10 for each racial/ethnic disability group in every district. Cells less than 10, though removed from the calculation, are reviewed individually to see if data irregularities for specific racial and ethnic groups in these districts would suggest disproportionate representation due to inappropriate identification. All cells of greater than 10 are retained in the data set and are used to calculate disproportionate representation. Once the calculation is made for each district, the weighted risk ratios are compared to the two previous years’ weighted risk ratios. Districts are flagged if for 3 consecutive years, they exhibit a weighted risk ratio of 4.0 or greater for possible over-representation.
All districts identified by way of this quantitative analysis are then subject to a review of the appropriateness of their PPPs for special education eligibility determination and disability identification.
Description of determination that disproportionate representation is due to inappropriate identification:A district identified using the measurement techniques described above submits its current PPPs to MASSDE where they are reviewed. If the reviewers conclude that the PPPs were inappropriate or otherwise inconsistent with federal and state regulations, and concludes that the PPPs likely caused the disproportionate representation at least to some degree, then a district is identified as having disproportionate representation due to inappropriate identification.
FFY Measurable and Rigorous Target
2012 (2012-2013) 0%
Actual Target Data for FFY2012 (2012-2013):
Massachusetts Part B Annual Performance Report for FFY2012 50Submitted February 3, 2014
Disproportionate Representation in Specific Disability
Categories
Number of Districts with Disproportionate Representation of Racial and Ethnic Groups in
Specific Disability Categories That Was the Result of Inappropriate
Identification
Percent of Districts
2012 (2012-2013) 400 7 0 0%
District level data for Indicator 10 are reported at http://profiles.doe.mass.edu/state_report/special_ed.aspx.
Discussion of Improvement Activities and Explanation of Slippage, if the State did not meet its target, that occurred for FFY2012 (2012-2013):Massachusetts used the October 1, 2012 enrollment and child count data to calculate disproportionality in the FFY2012 APR. In this reporting period, 16 out of 400 districts were excluded from the numerator as a result of the minimum n size requirement; all districts were included in the denominator. Using the measurement criteria established above, MASSDE determined that 7 districts met the data threshold for disproportionate over-representation of racial and ethnic groups in special education and related services. Following a review of districts’ policies, practices, and procedures to determine which disproportionate representation, if any, were the result of the inappropriate identification, MASSDE determined that 7, or 0% of districts, were noncompliant with the requirements of Indicator 10. These FFY2012 results match the results from FFY2011 where 0% of districts were identified as such.
For the past four reporting cycles, MASSDE has identified an average of 8.5 districts each year as meeting the threshold for disproportionate over-representation of racial and ethnic groups in special education and services. Looking longitudinally, MASSDE reached its measurable and rigorous target each year and is in the process of making determinations for this reporting year.
Table 10.1: Data Results for Disproportionate Representation of Racial and Ethnic Groups in Specific Disability Categories: FFY2009-FFY2012
Fiscal Year
Number of Districts with Disproportionate Representation in
Specific Disability Categories
Number of Districts with Disproportionate Representation of
Racial and Ethnic Groups in Specific Disability Categories That Was the
Result of Inappropriate Identification
Percent of Districts
2012 7 0 0%
2011 10 0 0%
2010 8 0 0%
2009 9 0 0%
Improvement Activities
Consistent with instruction from OSERS, MASSDE is reporting one set of improvement activities in Appendix A of this report. Each activity references the relevant indicators, and is also listed in the MA SPP for those indicators.
For purposes of this report, MASSDE would like to highlight the distribution of a document, Disproportionality in Special Education Identification: FAQ, to districts this year upon the identification of disproportionate representation in specific disability categories or racial and ethnic groups in special education. The document was written in response to questions from the field about the measurement of disproportionality, its implications, and necessary actions MASSDE and the district must take when disproportionality is identified.
Massachusetts Part B Annual Performance Report for FFY2012 51Submitted February 3, 2014
Revisions, with Justification, to Proposed Targets / Improvement Activities / Timelines / Resources for FFY2012 (2012-2013):There are no changes to the SPP for Indicator 10; proposed targets, improvement activities, timelines, and resources in the MA SPP remain appropriate.
Massachusetts Part B Annual Performance Report for FFY2012 52Submitted February 3, 2014
Massachusetts
Part B State Annual Performance Report (APR) for FFY2012Overview of the Annual Performance Report Development:
Monitoring Priority: Effective General Supervision Part B / Child Find
Indicator 11: Percent of children who were evaluated within 60 days of receiving parental consent for initial evaluation or, if the State establishes a timeframe within which the evaluation must be conducted, within that timeframe.
(20 U.S.C. 1416(a)(3)(B))
Measurement: a. # of children for whom parental consent to evaluate was received.
b. # of children whose evaluations were completed within 60 days (or State-established timeline).
Account for children included in (a) but not included in (b). Indicate the range of days beyond the timeline when the evaluation was completed and any reasons for the delays.
Percent = [(b) divided by (a)] times 100.
FFY Measurable and Rigorous Target
2012 (2012-2013)
100%
Actual Target Data for FFY2012 (2012-2013):
a. Number of children for whom parental consent to evaluate was received 2297
b. Number of children whose evaluations were completed within 60 days (or State- established timelines) 2236
Percent of children with parental consent to evaluate, who were evaluated within 60 days (or State-established timeline)
Percent = [2236 divided by 2297] times 100.
97.3%
The FFY2012 data is based on a cohort of school districts reporting on initial evaluations that were begun in the months of October, November, and December, 2012. Data collection procedures are described in the MA SPP for Indicator 11. If a student’s evaluation was completed and the eligibility determination was made by the Team within 45 school working days, consistent with the State-established timeline (see 603 CMR 28.05(1)), the evaluation was deemed timely and in compliance. Additionally, the compliance rate also includes cases in which any delay in meeting the timeline were attributable to factors that were beyond the districts’ ability to control, including delays due to school closures for weather or unanticipated emergencies, parent scheduling needs or parents and/or child missing a scheduled meeting, extended student absences or student illnesses, and also evaluations extended with agreement of students’ parents.
District level data for Indicator 11 are reported at http://profiles.doe.mass.edu/state_report/special_ed.aspx.
Massachusetts Part B Annual Performance Report for FFY2012 53Submitted February 3, 2014
Discussion of Improvement Activities and Explanation of Slippage, if the State did not meet its target, that Occurred for FFY2012: During the FFY2012 data collection period, school districts in the data reporting cohort received parental consent for initial evaluation for 2,297 students. Of those, 2,236 students’ evaluations, or 97.3%, were completed timely. This is notable because it is an increase of 3.6 percentage points over the FFY2011 actual target data. This improvement is due in part to the improved performance of the largest school district in this cohort, which is required to report Indicator 11 data annually. In FFY2012, this district met the State’s measurable and rigorous target of 100%, which is an increase of 10 percentage points over the district’s FFY2011 compliance rate. The district engaged in thoughtful analysis of root causes of noncompliance, developed targeted improvement activities aligned to causal factors, and implemented and executed such activities.
In FFY2012, there were 61 students in the cohort districts for whom initial evaluations were not completed timely. On average, those delayed evaluations exceeded the State-established timeline by 17.5 school working days. The five evaluations exceeding the State-established timeline by the largest number of school working days were reported from one district. The district reported that the delays were due to insufficient staff availability to complete the evaluation on time. When these five records are excluded from the cohort data, the average delay is 13 school working days, which is a decrease of one day when compared to the FFY2011 reported data of 14 school working days.
Of the 2,297 initial evaluations completed, 1,278 students, or 55.6%, were deemed to be eligible for special education services. Of these eligibility determinations, 1,246, or approximately 97.5%, were completed within the state established timelines or a timeline that was appropriately extended. The data are generally consistent with data reported for FFY2011. We are exploring technical assistance activities focused on increasing the percentage of “appropriate” referrals for initial evaluation as it appears that there is a high rate of inappropriate referrals (only 55.6% of referrals resulted in findings of eligibility). If fewer inappropriate referrals are made, it is our hope that sufficient staff availability will result in even higher percentage of referrals being completed within appropriate timelines. We would conjecture that some of the staff availability issues are resulting from this very high demand on evaluation services.
Figure 11.1 below, indicates the longitudinal data for Indicator 11. There has been an overall trend of increased compliance. The current 8.8% increase of compliance since FFY2005 is due to district root cause analysis and development and implementation of improvement activities aligned to causal factors.
As illustrated in Table 11.1 below, in FFY2012, school districts most often claimed that unavailability of staff to complete evaluations was the reason for missing the state-established timeline. The Department considers that any delay in the evaluation timeline that is attributable to a circumstance that is arguably within the school district’s control is an unacceptable reason for extending the established timeframe for initial evaluation.
In FFY2012, 29.5% of unacceptable delays cited were due to “insufficient staff” or “excessive caseload.” While the reasons given in FFY2011 and FFY2012 for delayed evaluations are similar, FFY2012 data show a decrease of 7.3 percentage points from FFY2011, for these reasons for delay. Unavailability of resources does not justify a district’s noncompliance. It is important to note that a comparative analysis of FFY2008 and FFY2012 data show a shift in the cited reasons for unacceptable delays. Since FFY2008, the frequency of cited reasons for “insufficient staff availability” and “evaluator reports not received on time” has decreased by 41% and 49% respectively, while cited reasons for “district scheduling” have increased by 39%. MASSDE will continue to work with school districts to ensure that students’ needs are timely met. MASSDE remains committed to assisting school districts in meeting the State’s measurable and rigorous target by supporting school districts’ analysis of root causes of noncompliance, so that targeted improvement activities can be more closely assigned to causal factors. Self-assessment tools and activities focused on identifying causal factors resulting in noncompliance and other delays in evaluation timelines have been effectively utilized by districts to address specific areas of need and improve timeliness of evaluation activities.
Massachusetts Part B Annual Performance Report for FFY2012 54Submitted February 3, 2014
Massachusetts
Figure 11.1: Data Results for Percent of Initial Referrals with Timely Evaluations: FFY2005-FFY2012
Source: Massachusetts Part B Indicator 11 District Reported Initial Evaluations
Table 11.1: Data results for Reasons for District Delay in Meeting Timelines – Matters within School Districts’ Control: FFY2012
Insufficient staff availability to complete the evaluation on time (excessive caseload) 29.5%
Delay due to district’s scheduling need or conflict 26.2%
Delay due to evaluator reports not received on time 8.2%
Delay due to lack of qualified staff to complete the evaluation on time 18.0%
“Other” (e.g., need for bilingual evaluator) 18.0%
Source: Massachusetts Department of Elementary and Secondary Education.
Improvement Activities
Verification of Correction of Noncompliance
As instructed by OSEP in the Massachusetts Part B FFY2011 SPP/APR Response Table, MASSDE is required to report on actions taken to verify correction of noncompliance identified in FFY2011 data for Indicator 11. Based on FFY2010 data, MASSDE issued five findings of non-compliance in March, 2012. With these findings, MASSDE notified the districts that they were required to complete corrective actions consistent with the identification and verification of correction of noncompliance requirements in OSEP Memorandum 09-02. MASSDE required each district to (1) submit additional data demonstrating the district completed, though late, the evaluation of any child whose initial evaluation was not timely, unless the student was not longer within the district’s jurisdiction; (2) review its practices, procedures, and policies and revise them as necessary to ensure that they did not present barriers to timely completion of initial evaluations and eligibility determination in the future; and (3) to complete the second prong of correction by submitting a subsequent data set on initial
Massachusetts Part B Annual Performance Report for FFY2012 55Submitted February 3, 2014
Massachusetts
evaluations that demonstrated compliance with the requirements for timely initial evaluation. MASSDE reviewed the subsequent data submitted by each district to verify correction of identified noncompliance. As of the date of this report, MASSDE has verified that the five identified districts have taken appropriate actions to correct the identified noncompliance and notified each that the finding is resolved.
Based on the FFY2011 data, MASSDE issued one finding of non-compliance in September, 2013. With this finding, MASSDE notified the district that it was required to complete corrective actions consistent with the process of identification and verification of correction of noncompliance described above. As of the date of this report, MASSDE has verified through review of subsequent data that the district is (1) correctly implementing the specific regulatory requirements based on a review of updated data subsequently collected; and (2) has corrected each individual case of noncompliance, unless the child is no longer within the jurisdiction of the LEA, consistent with OSEP Memorandum 09-02. The identified district has taken appropriate actions to correct the identified noncompliance and MASSDE has notified the district that the finding is resolved.
Based on the FFY2012 data, MASSDE has issued one finding of non-compliance, and will report in the next APR for Indicator 11 on its activities to verify that the district has corrected the identified noncompliance.
Additional Improvement Activities
Consistent with instruction from OSERS, MASSDE is reporting one set of improvement activities in Appendix A of this report. Each activity references the relevant indicators, and is also listed in the MA SPP for those indicators.
For purposes of this report, MASSDE would like to highlight the technical assistance opportunities that were provided in FFY2012 for local districts to incorporate data collection for SPP/APR into a continuous cycle of improvement. The activities included new webinar trainings, conference calls and technical assistance to targeted districts to improve data collection activities, to conduct root cause analysis, and to identify additional corrective actions to address noncompliance.
Revisions, with Justification, to Proposed Targets / Improvement Activities / Timelines / Resources for FFY2012 (2012-2013): There are no changes to the SPP for Indicator 11; proposed targets, improvement activities, timelines, and resources in the MA SPP remain appropriate.
Massachusetts Part B Annual Performance Report for FFY2012 56Submitted February 3, 2014
Massachusetts
Part B State Annual Performance Report (APR) for FFY2012Overview of the Annual Performance Report Development:
Monitoring Priority: Effective General Supervision Part B / Effective Transition
Indicator 12: Percent of children referred by Part C prior to age 3, who are found eligible for Part B, and who have an IEP developed and implemented by their third birthdays.
Indicator #12: Early Childhood Transition(20 U.S.C. 1416(a)(3)(B))
Measurement: a. # of children who have been served in Part C and referred to Part B for Part B eligibility determination.
b. # of those referred determined to be NOT eligible and whose eligibility was determined prior to their third birthdays.
c. # of those found eligible who have an IEP developed and implemented by their third birthdays.
d. # of children for whom parental refusal to provide consent caused delays in evaluation or initial services or to whom exceptions under 34 CFR §300.301(d) applied.
e. # of children determined to be eligible for early intervention services under Part C less than 90 days before their third birthdays.
Account for children included in (a) but not included in (b), (c), (d) or (e). Indicate the range of days beyond the third birthday when eligibility was determined and the IEP developed and the reasons for the delays.
Percent = [(c) divided by (a - b - d - e)] times 100.
FFY Measurable and Rigorous Target
2012(2012-2013) 100%
Massachusetts Part B Annual Performance Report for FFY2012 57Submitted February 3, 2014
Massachusetts
Actual Target Data for FFY2012 (2012-2013):
a. # of children who have been served in Part C and referred to Part B for Part B eligibility determination
202
b. # of those referred determined to be NOT eligible and whose eligibility was determined prior to their third birthdays
68
c. # of those found eligible who have an IEP developed and implemented by their third birthdays
70
d. # of children for whom parent refusal to provide consent caused delays in evaluation or initial services or to whom exceptions under 34 CFR §300.301(d) applied
59
e. # of children determined to be eligible for early intervention series under Part C less than 90 days before their third birthdays
5
Percent = [(c) divided by (a – b – d – e)] times 100 100%
For FFY2012, 100% of the children referred by Part C prior to age 3, who were found eligible for special education services under Part B, had an IEP developed and implemented on or before their third birthdays.
States are also required to indicate the range of days beyond the third birthday when eligibility was determined and the IEP was developed, and the reasons for the delays, for children included in (a) but not included in (b), (c), (d) or (e). MASSDE reviewed data from each district in the participating cohort to determine this information. Fifteen districts reported that eligible students received services 10 days or fewer after the student’s third birthday; nine districts reported that students received services between 11 and 31 days after the third birthday; fourteen districts reported that eligible students received services more than 31 days after their third birthday.
No more than 10 days after the child’s birthday—21.6% (29 individual cases) More than 10 days but not more than 31 days after the child’s third birthday—9% (12 individual cases) More than 31 days after the child’s third birthday—17.2% (23 individual cases)
Of these, the reported reason for delay included parental delay in providing consent to evaluate and other types of “parent-related “delays (44%) for which noncompliance is not identified. Additionally, late referral from Part C early intervention services to Part B accounted for 3.7% of delays in implementing services by the third birthday. MASSDE continues to work with cohort districts to provide training and best practice resources to mitigate any type of delay to ensure that services are identified and implemented on or before the students third birthday for eligible children.
District level data for Indicator 12 are reported at http://profiles.doe.mass.edu/state_report/special_ed.aspx.
Discussion of Improvement Activities and Explanation of Slippage, if the State did not meet its target that occurred for FFY2012 (2011-2012):In FFY2012, the participating cohorts reported a 100% compliance rate. This is an increase of 6.3 percentage points from FFY2011. MASSDE considers this progress to be attributable to continued professional development, technical assistance, and improved resources available to school districts, including resources and information developed by MASSDE in partnership with other agencies supporting Part C to Part B transition, the Departments of Early Education and Care (MEEC) and Public Health (MDPH). Improvements are also attributable to the improved data collection tool and technical assistance on the process of completing the tool and reporting to MASSDE.
Massachusetts Part B Annual Performance Report for FFY2012 58Submitted February 3, 2014
Figure 12.1: Data Results for Percent of Children Referred by Part C Who Are Eligible for Part B and Have an IEP Implemented On or Before Age 3: FFY2004 – FFY2012
Source: Massachusetts Part B Indicator 12 District Reported Implementation
Figure 12.1 above indicates the longitudinal data for Indicator 12. There has been a consistent trend of increased compliance year over year. The increase of 23 percentage points is indicative of the development and implementation of improvement activities
Improvement Activities
Verification of Correction of Noncompliance
As instructed in the Massachusetts Part B FFY2011 SPP/APR Response Table, MASSDE is required to report on actions taken to verify correction of noncompliance identified in FFY2011. The noncompliance reported in the FFY2011 APR was attributed to one school district that had been previously identified as having noncompliant practices related to Part C to Part B transition timelines; the original finding of noncompliance remained open. In FFY2012, MASSDE verified that the district has corrected the identified noncompliance and achieved a compliance rate of 100% for Indicator 12. To support the district’s efforts to correct the identified noncompliance, MASSDE supported the district’s development and implementation of a series of corrective action plans and strategies focused on addressing the root causes of the identified noncompliance. The district’s work focused largely on making additional staff available to complete children’s evaluations timely and communicating better with families about the eligibility process and meeting scheduling. The district reviewed practices and procedures for accepting and acting upon referrals from Part C, and took steps to restructure district staff and systems to be able to ensure that eligible children received preschool special education services by their third birthdays. MASSDE examined student-level data and a subsequent data set to confirm that the district (1) is correctly implementing the specific regulatory requirements related to Part C to Part B transition, and (2) has corrected each individual case of noncompliance, unless the child is no longer within the jurisdiction of the school district. This verification process was consistent with the requirements of OSEP Memorandum 09-02.
Additional Improvement Activities
Consistent with instruction from OSERS, MASSDE is reporting one set of improvement activities in Appendix A of this report. Each activity references the relevant indicators, and is also listed in the MA SPP for those indicators.
MASSDE would like to highlight activities in FFY2012 that supported Part C to Part B transition for children. In collaboration with state partners MEEC and MDPH, MASSDE sponsored a series of professional development activities for Early Intervention programs and school districts. In the spring of 2013, the agencies hosted
Massachusetts Part B Annual Performance Report for FFY2012 59Submitted February 3, 2014
Massachusetts
transition forums across the state for school districts and their EI program partners to come together to receive information, and to work collaboratively on creating or revising current policies and practices governing early childhood transition. EI programs and school districts worked on developing local Memoranda of Understanding focused on facilitating the development of and implementation of the IEP on or before the child’s third birthday. Participants reported that this collaborative activity has led to greater communication between the programs.
Revisions, with Justification, to Proposed Targets / Improvement Activities / Timelines / Resources for FFY2012 (2012-2013): The MA SPP includes new or revised improvement activities, timelines, and resources to reflect new initiatives or to update existing initiatives.
Massachusetts Part B Annual Performance Report for FFY2012 60Submitted February 3, 2014
Massachusetts
Part B State Annual Performance Report (APR) for FFY2012Overview of the Annual Performance Report Development:
Monitoring Priority: Effective General Supervision Part B / Effective Transition
Indicator 13: Percent of youth with IEPs aged 16 and above with an IEP that includes appropriate measurable postsecondary goals that are annually updated and based upon an age appropriate transition assessment, transition services, including courses of study, that will reasonably enable the student to meet those postsecondary goals, and annual IEP goals related to the student’s transition services needs. There also must be evidence that the student was invited to the IEP Team meeting where transition services are to be discussed and evidence that, if appropriate, a representative of any participating agency was invited to the IEP Team meeting with the prior consent of the parent or student who has reached the age of majority.
(20 U.S.C. 1416(a)(3)(B))
Measurement: Percent = [(# of youth with IEPs aged 16 and above with an IEP that includes appropriate measurable postsecondary goals that are annually updated and based upon an age appropriate transition assessment, transition services, including courses of study, that will reasonably enable the student to meet those postsecondary goals, and annual IEP goals related to the student’s transition services needs. There also must be evidence that the student was invited to the IEP Team meeting where transition services are to be discussed and evidence that, if appropriate, a representative of any participating agency was invited to the IEP Team meeting with the prior consent of the parent or student who has reached the age of majority) divided by the (# of youth with an IEP age 16 and above)] times 100.
FFY Measurable and Rigorous Target
2012
(2012-2013)
100%
Actual Target Data for FFY2012 (2011-2012):
# of Student Records reviewed
# of student records with appropriate measurable postsecondary goals that are annually updated and based upon an age
appropriate transition assessment; transition services, including courses of study, that will reasonably enable the student to meet
those postsecondary goals; annual IEP goals related to the student’s transition services needs; evidence that the student was invited to the IEP Team meeting where transition services
are to be discussed; and evidence that, if appropriate, a representative of any participating agency was invited to the IEP
Team meeting with the prior consent of the parent or student who has reached the age of majority
Percentage of student records in
compliance
1277 1277 100%
District level data for Indicator 13 are reported at http://profiles.doe.mass.edu/state_report/special_ed.aspx.
Massachusetts Part B Annual Performance Report for FFY2012 61Submitted February 3, 2014
Discussion of Improvement Activities and Explanation of Slippage, if the State did not meet its target that occurred in FFY2012 (2012-2013):Massachusetts is committed to ensuring that appropriate transition planning occur for every student. This year’s compliance rate of 100% achieves the measurable and rigorous target for Indicator 13 and reflects steady progress since FFY2005. As described below, Massachusetts’ technical assistance to and close work on best practice in secondary transition with the school districts in this year’s data collection cohort resulted in full compliance with the requirements of IDEA for secondary transition and strengthened practices in school districts.
Figure 13.1: Data Results for Compliance with Secondary Transition Requirements: FFY2005-FFY2012
Source: District-reported data using the Massachusetts Postsecondary Transition Planning Checklist for Indicator 13
Note: FFY2005 and FFY2009 were baseline years; a new Indicator 13 measurement was introduced in FFY2009.
Improvement Activities
Consistent with instructions from OSERS, MASSDE is reporting one set of improvement activities in Appendix A of this report. Each activity references the relevant indicators, and is also listed in the MA SPP for those indicators.
Several other activities have been especially focused on supporting state and local efforts to achieve 100% compliance with Indicator 13. MASSDE continues to provide districts with high quality technical assistance and professional development that is both broad-based and individualized to areas of need identified through data collection and analysis. In September 2012, MASSDE issued a new technical assistance advisory, Postsecondary Goals and Annual IEP Goals in the Transition Planning Process, which is now widely used across the state to inform educator training in secondary transition.
Additionally, in consultation with a broad cross-section of stakeholders and with graphics expertise donated by the Institute for Community Inclusion at UMass Boston, MASSDE created the Massachusetts Student-Driven Secondary Transition Model to visually represent the movement from school to post-school life for students with IEPs aged 14-22. This visual model was unveiled at the April 2013 Massachusetts Secondary Transition Capacity-Building Conference, an event which drew 120 four-person teams of educators from districts, special education collaboratives, vocational-technical schools, and approved special education private schools. During the course of the day, these educators heard from noted speakers such as Dr. Michael Wehmeyer, from the University of Kansas, Dr. Thomas Hehir, from Harvard University, and Dr. Joseph Madaus, from the University of Connecticut. They also heard from self advocates and from their colleagues across the state who are exemplars of best practice. This conference was held with a twofold purpose: (a) to provide district leadership
Massachusetts Part B Annual Performance Report for FFY2012 62Submitted February 3, 2014
teams with essential knowledge about the transition planning process, both as a cohesive, integrated system and from the perspective of evidence-based practices in Self Determination; Transition Assessment; Career Development; Postsecondary Education and Training; and Family Engagement and Community Collaboration, and (b) to engage district leadership teams in a data-based planning process designed to improve postsecondary outcomes for all students with disabilities. In order to attend the conference, all teams were required to complete the new Massachusetts District/School Secondary Transition Needs Assessment and to engage in planning during the conference itself, using the new District/School Strategic Planning Tool. To extend strategic planning begun at the conference, MASSDE has subsequently offered a targeted grant opportunity in the areas of transition assessment and student self determination to conference attendees.
As a follow-up to state legislation in March 2012 creating a Massachusetts educator and rehabilitation counselor licensure endorsement in transition services, MASSDE developed the new Guidelines for the Transition Specialist Endorsement to inform the development of university educator preparation programs.
Verification of Correction of Noncompliance
OSEP has instructed MASSDE to report here on the status of correction of noncompliance identified in FFY2011 for Indicator 13, including findings identified in this period based on FFY2010 data. MASSDE uses as process for verifying the correction of noncompliance consistent with OSEP Memorandum 09-02. Districts that receive a finding of noncompliance under Indicator 13 are instructed to submit hard copy documentation (e.g., IEP forms and other related records) to MASSDE as evidence that that transition planning had been completed for each individual student affected by the noncompliance, unless the child was no longer within the jurisdiction of the district. Districts are also required to sign a statement of assurance certifying that the identified student(s) had received appropriate transition planning and that the district had in place the appropriate policies, practices, and procedures to ensure that all students entitled to transition planning services were receiving such services in a timely manner. In addition, districts are required to collect and electronically submit via secure portal subsequent, updated student data demonstrating that districts are correctly implementing the specific regulatory requirements (i.e., achieved 100% compliance). Depending on what is identified as the causes of the noncompliance, MASSDE may order additional corrective actions, up to and including professional development and training for district staff.
If all conditions and criteria are met within one year of the finding of noncompliance, MASSDE considers the noncompliance as timely corrected. If all conditions and criteria are not met within that timeframe, MASSDE issues a determination that the finding will remain open, and additional corrective action will be required.
In FFY2010, MASSDE reported a compliance rate of 99.1%. Two districts were found to be in noncompliance with the requirements of Indicator 13 and were notified by letter on April 9, 2012. Therefore, corrective actions were to have been completed as soon as possible, but in no case later than April 9, 2013. All conditions and criteria described above were met by both districts, but in both cases beyond the one-year timeline. MASSDE has verified that the identified noncompliance has been corrected for individual students and that the district is correctly implementing the applicable regulatory requirements.
In FFY2011, MASSDE reported a compliance rate of 99.2%. One district was found to be in noncompliance with the requirements of Indicator 13 and was notified by letter on May 1, 2013. The district engaged in the corrective action activities described above, and MASSDE verified correction of this identified noncompliance consistent with OSEP Memorandum 09-02 within one year. This finding was timely corrected.
Revisions, with Justification, to Proposed Targets / Improvement Activities / Timelines / Resources for FFY2012 (2012-2013):
The MA SPP for Indicator 13 includes new or revised improvement activities, timelines, and resources to reflect new initiatives or to update existing initiatives.
Massachusetts Part B Annual Performance Report for FFY2012 63Submitted February 3, 2014
Part B State Annual Performance Report (APR) for FFY2012
Overview of the Annual Performance Report Development:
Monitoring Priority: Effective General Supervision Part B / Effective Transition
Indicator 14: Percent of youth who are no longer in secondary school, had IEPs in effect at the time they left school, and were:
A. Enrolled in higher education within one year of leaving high school.
B. Enrolled in higher education or competitively employed within one year of leaving high school.
C. Enrolled in higher education or in some other postsecondary education or training programs; or competitively employed or in some other employment within one year of leaving high school.
(20 U.S.C. 1416(a)(3)(B))
Measurement: A. Percent enrolled in higher education = [(# of youth who are no longer in secondary school, had IEPs in effect at the time they left school and were enrolled in higher education within one year of leaving high school) divided by the (# of respondent youth who are no longer in secondary school and had IEPs in effect at the time they left school)] times 100.
B. Percent enrolled in higher education or competitively employed within one year of leaving high school = [(# of youth who are no longer in secondary school, had IEPs in effect at the time they left high school and were enrolled in higher education or competitively employed within one year of leaving high school) divided by the (# of respondent youth who are no longer in secondary school and had IEPs in effect at the time they left school)] times 100.C. Percent enrolled in higher education, or in some other postsecondary education or training program; or competitively employed or in some other employment = [(# of youth who are no longer in secondary school, had IEPs in effect at the time they left school and were enrolled in higher education, or in some other postsecondary education or training program; or competitively employed or in some other employment) divided by the (# of respondent youth who are no longer in secondary school and had IPEs in effect at the time they left school)} times 100.
FFY Measurable and Rigorous Target
2012 (2012-2013)
A: Enrolled in higher education within one year
of leaving high school(Definition I)
B: Enrolled in higher education or competitively
employed within one year of leaving high school
(Definitions I + II)
C: Enrolled in higher education or competitively employed or in some other
employment within one year of leaving high school
(Definitions I + II + III + IV)
45% 80% 87%
Actual Numbers 553 553 + 411 553 + 411 + 96 + 43
Actual Target Data
46.6% 81.3% 93%
Massachusetts Part B Annual Performance Report for FFY2012 64Submitted February 3, 2014
Massachusetts
FFY2012 is the fourth year in a four-year cohort cycle in which the revised postsecondary outcomes survey of students with disabilities who exited high school the previous year, aligned with a revised measurement and definitions, was conducted in Massachusetts. Students’ responses were recorded on the Massachusetts After High School Survey or the Career/Vocational Technical Education (CVTE) Graduate One-Year Follow-Up Survey.Of the 3,151 students with IEPs in the exiting cohort, school districts reported survey responses from 1,186, representing a response rate of 37.6%. Respondents reported post-secondary engagement in one of the following unduplicated categories:
I. Higher Education means youth have been enrolled on a full- or part-time basis in a community college (2-year program), or college/university (4- or more year program) for at least one complete term, at any time in the year since leaving high school = 553.
II. Competitive Employment means that youth have worked for pay at or above the minimum wage in a setting with others who are nondisabled for a period of 20 hours a week for at least 90 days at any time in the year since leaving high school, including military employment = 411.
III. Other Postsecondary Education or Training means youth enrolled on a full- or part-time basis for at least one complete term at any time in the year since leaving high school in an education or training program (e.g., Job Corps, adult education, workforce development program, or vocational technical school which is less than a 2-year program) = 96.
IV. Some Other Employment means youth have worked for pay or been self-employed for a period of at business (e.g., farm, store, fishing, ranching, catering services, etc.) = 43.
V. Respondents not engaged in a manner meeting the definitions included in Indicator 14 = 83.
Figure 14.1: Data Results for the Percent of Respondents by Outcome Category: FFY2012
I. Higher Education47%
II. Competitive Employment
35%
III. Other Education or Training
8%
IV. Some Other Employment
4%
V. Not Engaged According to In-dicator 14 Definitions
7%
Source: District-reported data from the Massachusetts After High School Survey or the Career/Vocational Technical Education (CVTE) Graduate One-Year Follow-Up Survey.
As shown in Figure 14.2 below, from FFY2009 to FFY2012, Massachusetts has demonstrated a steady increase in postsecondary engagement according to the Indicator 14 definitions revised for the FFY2009 data collection. Engagement in higher education, competitive employment, and other education or training has increased, and participation in some other employment has held steady. Involvement in postsecondary education or employment outside of the Indicator 14
Massachusetts Part B Annual Performance Report for FFY2012 65Submitted February 3, 2014
Massachusetts
definitions – in other words, education or employment that is less sustained, less well paid, or for fewer hours – has decreased.
Figure 14.2: Data Results for Postsecondary Engagement: FFY2009-FFY2012
FFY2009 FFY2010 FFY2011 FFY20120%
10%
20%
30%
40%
50%
60%
42%
51%
41%
47%
29% 29% 29%
35%
4% 5% 4%8%
6% 5%
13%
3%
19%
11%13%
7%
Higher Education
Competitive Employment
Other Education or Training
Some Other Employment
Not Engaged According to Indicator 14 Definitions
Source: District-reported data from the Massachusetts After High School Survey or the Career/Vocational Technical Education (CVTE) Graduate One-Year Follow-Up Survey.
Note: FFY2009 is the baseline for the new Indicator 14 measurements introduced that year.
Figure 14.3 below demonstrates upward progress over time in all three of the Indicator 14 measurements, from the FFY2009 baseline onward. For Measurements A, B, and C, FFY2012 data for all respondents collectively exceeded FFY2012 targets by 1.6, 1.3, and 6.0 percentage points, respectively. Growth in each measurement exceeded FFY2011 results by 5.0, 10.0, and 6.1 percentage points, respectively.
Figure 14.3: Data Results for the Percent of Respondents Engaged by Postsecondary Measurements (A,B,C)/Year: FFY2009-FFY2012
FFY2009 FFY2010 FFY2011 FFY2012 FFY2012 Target30%
40%
50%
60%
70%
80%
90%
100%
42.3%
50.7%
41.0%
46.6%45.0%
72.0%
79.8%
70.0%
81.3%80.0%
81.3%
88.9% 86.9%
93.0%87.0%
ABC
Massachusetts Part B Annual Performance Report for FFY2012 66Submitted February 3, 2014
Massachusetts
Source: District-reported data from the Massachusetts After High School Survey or the Career/Vocational Technical Education (CVTE) Graduate One-Year Follow-Up Survey.
Note: FFY2009 is the baseline for the new Indicator 14 measurements introduced that year.
In Figure 14.4 below, FFY2012 data disaggregated by disability type demonstrate that numerous respondents are engaged at rates exceeding FFY2012 targets. For Measurement A, all disability categories are at or above the target of 45% except for respondents with intellectual, multiple, or emotional disabilities. We note that individuals with emotional disabilities are slightly underrepresented in this data collection, a fact which may exert downward pressure on their Measurement A results. However, the factors which cause individuals with emotional disabilities to be unresponsive to a survey may be similar to the factors which contribute to low levels of enrollment by these individuals in higher education. Individuals with intellectual and multiple disabilities have traditionally been excluded from higher education, but we note that Massachusetts is a leader in the effort to make higher education more accessible. For example, the Institute for Community Inclusion at UMass Boston, Massachusetts houses the National Coordinating Center for the Transition and Postsecondary Programs for Students with Intellectual Disabilities OSEP grant program . Individuals with intellectual disabilities are attending higher education programs in Massachusetts at steadily increasing rates. For Measurement B, which includes both higher education and competitive employment, half of the disability categories are above the FFY2012 target of 80%, and half are below. See the subsequent figure below for a discussion of competitive employment data.For Measurement C, all disability categories exceed the FFY2012 target of 87% except for respondents with multiple disabilities (68.2%) intellectual disabilities (73.9%), and autism (82.4%). These categories may include individuals with high levels of need. Massachusetts is working to continuously improve educational and employment opportunities for all of its students, including students with these profiles.Figure 14.4: Data Results for the Percentage of Respondents Engaged by Postsecondary Measurement (A,B,C), by Disability Category: FFY2012
Massachusetts Part B Annual Performance Report for FFY2012 67Submitted February 3, 2014
Source: District-reported data from the Massachusetts After High School Survey or the Career/Vocational Technical Education (CVTE) Graduate One-Year Follow-Up Survey.
In the area of competitive employment, FFY2012 data for Definition II as depicted in Figure 14.5 below, indicate that respondents with certain categories of disability are more likely to be competitively employed one year after exit than are others. For example, respondents with health disabilities in this sample were four times more likely to be competitively employed than respondents with autism. Given their low rate of competitive employment, it should be noted that the number of respondents with vision impairments was extremely small. This is to be expected because of the low incidence of this disability. As a point of reference, the U.S. Department of Labor reported the June 2013 employment rate for youth aged 16-19 with disabilities at 14.4%. For ages 20-24, the rate was 33.2%. The Department of Labor does not distinguish between competitive and non-competitive employment, and all part-time and temporary work is included in their data, as well as regular full-time year-round employment. Competitive employment in Massachusetts exists in its own unique labor market, with varying regional conditions, each of which influences the availability of competitive work.Figure 14.5: Data Results for the Percentage of Respondents Competitively Employed (Definition II), by Disability Category: FFY2012
Massachusetts Part B Annual Performance Report for FFY2012 68Submitted February 3, 2014
Source: District-reported data from the Massachusetts After High School Survey or the Career/Vocational Technical Education (CVTE) Graduate One-Year Follow-Up Survey.
A disaggregated analysis of data from respondents who attend CVTE schools reveals that these individuals enjoy higher rates of competitive employment than their peers in the rest of the Indicator 14 sample. In Massachusetts, students who receive career vocational technical education do so through three types of schools: regional vocational and technical schools, city vocational and technical schools, or Chapter 74 Approved CTE Programs Embedded in Traditional High Schools. While the data for students attending regional CVTE schools is incorporated into the aggregate data reported above, outcomes data for the 264 respondent students exiting the eight regional CVTEs that were surveyed in FFY2012 are reflected in the following figure.
Figure 14.6: Data Results for the Percentage of Respondents by Outcome Category, Regional CVTEs: FFY2012
Massachusetts Part B Annual Performance Report for FFY2012 69Submitted February 3, 2014
Massachusetts
I. Higher Education43%
II. Competitive Employment
52%
III. Other Education or Training1%
V. Not Engaged According to In-dicator 14 Definitions
4%
Source: Data from the Career/Vocational Technical Education (CVTE) Graduate One-Year Follow-Up Survey.
Regional CVTE students are entering higher education in numbers comparable to those of their peers in non-regional CVTE schools, 43% versus 47%. However, rates of competitive employment for regional CVTE students are considerably higher, at 52% for CVTE students versus 35% for non-CVTE students. A possible explanation is suggested by a July 2013 MASSDE-commissioned report by Dr. Thomas Hehir and Associates, Students with Disabilities in Massachusetts Career and Technical Education Programs. Dr. Hehir’s report noted that regional CVTE schools tend to enroll students with low-incidence disabilities at much lower rates than traditional high schools. Indeed in this CVTE sample, students with specific learning, health, and communication disabilities make up 81.1% of the whole, whereas they comprise 67.8% of overall Indicator 14 respondents. Only 1.5% of this CVTE sample is classified as having high levels of need, as opposed to 13.7% of the overall Indicator 14 sample. Therefore, the CVTE data included in this FFY2012 Indicator 14 report is consistent with data from individuals who attended non-CVTE schools. As depicted in Figure 14.7 below, response rates over the entire eight-year data collection cycle show a steady consistency, with some upward and downward movement but an overall flat trend. MASSDE will review its data collection procedures in consultation with district stakeholders and will research methodologies utilized in other states to determine how response rates may be meaningfully improved.
Massachusetts Part B Annual Performance Report for FFY2012 70Submitted February 3, 2014
Source: District-reported data from the Massachusetts After High School Survey or the Career/Vocational Technical Education (CVTE) Graduate One-Year Follow-Up Survey.
However, given that the Massachusetts cohort system for Indicator data collection is representative of the state as a whole, and given MASSDE’s NPSO Representativeness calculation showing only a small underrepresentation from individuals with emotional disabilities, MASSDE is confident that this FFY2012 Indicator 14 data is accurate and representative. We note that students with high incidence disabilities, e.g., those with Specific Learning Disabilities, responded to the survey at very high levels.
The figure below depicts the response rate for each disability category.Figure 14.8: Data Results for the Percentage Respondents by Disability Category: FFY2012
Massachusetts Part B Annual Performance Report for FFY2012 71Submitted February 3, 2014
Massachusetts
Source: District-reported data from the Massachusetts After High School Survey or the Career/Vocational Technical Education (CVTE) Graduate One-Year Follow-Up Survey.
District level data for Indicator 14 are reported at http://profiles.doe.mass.edu/state_report/special_ed.aspx.
Discussion of Improvement Activities Completed and Explanation of Slippage, if State did not meet its target, that occurred for FFY2012 (2012-2013):Improvement ActivitiesConsistent with instructions from OSERS, MASSDE is reporting one set of improvement activities in Appendix A of this report. Each activity references the relevant indicators, and is also listed in the MA SPP for those indicators.
Revisions, with Justification, to Proposed Targets / Improvement Activities / Timelines / Resources for FFY2012 (2012-2013):
The MA SPP for Indicator 14 includes new or revised improvement activities, timelines, and resources to reflect new initiatives or to update existing initiatives.
Massachusetts Part B Annual Performance Report for FFY2012 72Submitted February 3, 2014
Part B State Annual Performance Report (APR) for FFY2012Overview of the Annual Performance Report Development:
Monitoring Priority: Effective General Supervision Part B / General Supervision
Indicator 15: General supervision system (including monitoring, complaints, hearings, etc.) identifies and corrects noncompliance as soon as possible but in no case later than one year from identification.
Indicator #15: Identification and Correction of Noncompliance(20 U.S.C. 1416 (a)(3)(B))
Measurement: Percent of noncompliance corrected within one year of identification:a. # of findings of noncompliance. b. # of corrections completed as soon as possible but in no case later than one year from
identification.Percent = [(b) divided by (a)] times 100.
States are required to use the “Indicator 15 Worksheet” to report data for this indicator.
FFY Measurable and Rigorous Target
2012
(2012-2013) 100%
Actual Target Data for FFY2012 (2012-2013) based on findings of noncompliance made in July 1, 2011 to June 30, 2012):
FFY2012
(2012-2013)
(a) Findings of Noncompliance
Findings5
(b) Corrections completed as soon as possible but in no case later than one year of
identification
Percent
715 709 99.2%
Discussion of Improvement Activities and Explanation of Slippage, if the State did not meet its target, that occurred for FFY2012 (2012-2013):The data are reported in the Indicator 15 Worksheet for FFY2012, included here as Appendix B. Of the 715 findings of noncompliance issued between July 1, 2011 and June 30, 2012, 709 were verified as corrected within one year of identification for a compliance rate of 99.2%, 0.8 percentage point below the compliance rate target of 100%.
5 Findings of special education noncompliance are made through the Problem Resolution System (PRS), Coordinator Program Reviews (CPRs), Mid-cycle Reviews (MCRs), State Performance Plan compliance indicators, and the Bureau of Special Education Appeals (BSEA).
Massachusetts Part B Annual Performance Report for FFY2012 73Submitted February 3, 2014
Massachusetts
During the SPP period, MASSDE has significantly improved its compliance rate for Indicator 15 and has been able to report results at or near full compliance for the last several years (Figure 15.1). This improvement is primarily the result of coordinated efforts by the Program Quality Assurance (PQA) to improve timeline tracking systems and refine its technical assistance activities in which staff assist school districts with identifying root causes of noncompliance, and creating and implementing timely, focused corrective actions to remedy identified problems that had resulted in noncompliance.
The noncompliance not timely corrected was six findings identified through the SPP/APR data reporting process for the compliance indicators 4B (suspension/expulsion), 11 (evaluation timelines), 12 (Part C to Part B transition timelines), and 13 (secondary transition). MASSDE has reported on actions taken to verify that the identified noncompliance has been corrected in the APRs for those indicators. Only one instance of noncompliance remains open as of the date of this report. The noncompliance was identified through data analysis for Indicator 4B using data reported in the FFY2011 APR and in this report. The district’s corrective action and verification activities are ongoing, and are anticipated to be concluded in spring 2014. MASSDE will report on the verification activities during the clarification period.
Delays in the verification of correction activities were related to a variety of factors including staff turnover at the state and local levels, and the necessity of having district staff participate in several in-depth professional development and technical assistance training activities to promote systemic change in district practices and procedures. Sometimes the necessary changes that are required for the district to be able to demonstrate to the state that they have corrected the identified noncompliance and are implementing correctly all applicable regulatory requirements cannot be accomplished within one year. MASSDE recognizes the importance of timely correction of noncompliance, and is confident that these activities, however, have resulted in lasting change in district practice that will not only improve districts’ compliance with the requirements of IDEA, but support improved outcomes for the affected students and for all students in the districts.
Figure 15.1: Data Results for Correction of Noncompliance As Soon As Possible but in No Case Later Than One Year from Identification: FFY2005-FFY2012
Source: MA Department of Elementary and Secondary Education, IDEA Part B Dispute Resolution Tables.
Massachusetts Part B Annual Performance Report for FFY2012 74Submitted February 3, 2014
Massachusetts
Improvement Activities
Consistent with instruction from OSERS, MASSDE is reporting one set of improvement activities in Appendix A of this report. Each activity references the relevant indicators, and is also listed in the MA SPP for those indicators.
In FFY2012, MASSDE continued to work to integrate better its general supervision systems in order to ensure that noncompliance is corrected within required timelines, and is done so most effectively to address its contributing factors.
Revisions, with Justification, to Proposed Targets / Improvement Activities / Timelines / Resources for FFY2012 (2012-2013):There are no changes to the SPP for Indicator 15; proposed targets, improvement activities, timelines, and resources in the MA SPP remain appropriate.
Massachusetts Part B Annual Performance Report for FFY2012 75Submitted February 3, 2014
Massachusetts
Part B State Annual Performance Report (APR) for FFY2012Overview of the Annual Performance Report Development:
Monitoring Priority: Effective General Supervision Part B / General Supervision
Indicator 16: Percent of signed written complaints with reports issued that were resolved within 60-day timeline or a timeline extended for exceptional circumstances with respect to a particular complaint, or because the parent (or individual or organization) and the public agency agree to extend the time to engage in mediation or other alternative means of dispute resolution, if available in the State.
(20 U.S.C. 1416(a)(3)(B))
Measurement: Percent = [(1.1(b) + 1.1(c)) divided by 1.1] times 100.
FFY Measurable and Rigorous Target
2012
(2012-2013)100%
Actual Target Data for FFY2012 (2012-2013):
Complaints with reports issued [1.1]
Reports within 60-day timeline [1.1(b)]
Reports within timeline extended for exceptional circumstances or upon
agreement [1.1(c)]
Percent of signed, written complaints issued within
appropriate timelines
182 180 2 100%
Pursuant to OSEP Memorandum 13-6 and the Part B State Performance (SPP) and Annual Performance Report (APR) Part B Indicator Measurement Table, Indicator 16 has been deleted from the SPP/APR, effective with the FFY2011 submission. However, in the interest of consistency with prior SPPs/APRs, MASSDE has chosen to continue to include specific information in the FFY2012 APR.
MASSDE reported data through the IDEA Part B - Dispute Resolution School Year: 2012-13 table, attached here as Appendix C.
Discussion of Improvement Activities and Explanation of Slippage, if the state did not meet its target, that occurred for FFY2012 (2012-2013):Massachusetts met its measureable and rigorous target of 100% compliance with the requirements of timely issuance of reports in response to complaints received. The longitudinal compliance rate for Indicator 16 is included in Figure 16.1, below.
Massachusetts Part B Annual Performance Report for FFY2012 76Submitted February 3, 2014
Massachusetts
Figure 16.1: Data Results for Compliance with Written Complaint Report Timelines: FFY2005-FFY2012
Source: MA Department of Elementary and Secondary Education, Program Quality Assurance Services
Improvement Activities
Consistent with instruction from OSERS, MASSDE is reporting one set of improvement activities in Appendix A of this report. Each activity references the relevant indicators, and is also listed in the MA SPP for those indicators.
Revisions, with Justification, to Proposed Targets / Improvement Activities / Timelines / Resources for FFY2012 (2012-2013):There are no changes to the SPP for Indicator 16; proposed targets, improvement activities, timelines, and resources in the MA SPP remain appropriate.
Massachusetts Part B Annual Performance Report for FFY2012 77Submitted February 3, 2014
Massachusetts
Part B State Annual Performance Report (APR) for FFY2012Overview of the Annual Performance Report Development:
Monitoring Priority: Effective General Supervision Part B / General Supervision
Indicator 17: Percent of adjudicated due process hearing requests that were adjudicated within the 45-day timeline or a timeline that is properly extended by the hearing officer at the request of either party or in the case of an expedited hearing, within the required timelines.
I(20 U.S.C. 1416(a)(3)(B))
Measurement: Percent = [(3.2(a) + 3.2(b)) divided by 3.2] times 100.
FFY Measurable and Rigorous Target
2012 (2012-2013)
100%
Actual Target Data for FFY2012 (2012-2013):
Hearings fully adjudicated
Decisions within timeline (including
expedited)
Decisions within extended timeline
Percent of hearings adjudicated within the
45-day timeline or timeline properly
extended
18 1 16 94.4%
Indicator 17 has been deleted from the SPP/APR, effective with the FFY2011 submission. However, in the interest of consistency with prior SPPs/APRs, MASSDE has chosen to continue to report on this indicator for FFY2012.
MASSDE reported data through the IDEA Part B - Dispute Resolution School Year: 2012-13 table, attached here as Appendix C.
Discussion of Improvement Activities and Explanation of Slippage, if the State did not meet its target, that occurred for FFY2012 (2012-2013):Of the 18 hearings fully adjudicated in FFY2012, one hearing decision was not issued within the required timeline. This single decision was issued within 2 days of the required timeline. This accounts for the compliance rate of 94.4%, which is below the compliance target of 100%.
While Massachusetts has, over the past several years, consistently been slightly below the compliance target in meeting the timelines for hearing decisions, the failure to meet the 100% target has been attributable to a single hearing decision in each year, and in most if not all years, the delay in issuance beyond the required timeline has been de minimis.
Massachusetts Part B Annual Performance Report for FFY2012 78Submitted February 3, 2014
Massachusetts
In reviewing performance during the SPP period (Figure 17.1), the compliance rate for this indicator has been between 94% and 96% for all years, with the exception of a low of 88.8% during the first reporting year (FFY2005) and full compliance (100%) in FFY2008.
Figure 17.1: Data Results for Due Process Requests Adjudicated Within Timelines: FFY2005-FFY2012
BSEA reviewed its systems to determine whether failure to meet timelines was the result of systemic failure of administrative procedures and timeline tracking systems. No such deficiencies contributed to the two-day delay in issuing the hearing decision in FFY2012. The BSEA will continue to work toward 100% compliance.
Improvement Activities
Consistent with instructions from OSERS, MASSDE is reporting one set of improvement activities in Appendix A of this report. Each activity references the relevant indicators, and is also listed in the MA SPP for those indicators.
Revisions, with Justification, to Proposed Targets / Improvement Activities / Timelines / Resources for FFY2012 (2012-2013):There are no changes to the SPP for Indicator 17; proposed targets, improvement activities, timelines, and resources in the MA SPP remain appropriate.
Massachusetts Part B Annual Performance Report for FFY2012 79Submitted February 3, 2014
Massachusetts
Part B State Annual Performance Report (APR) for FFY2012Overview of the Annual Performance Report Development:
Monitoring Priority: Effective General Supervision Part B / General Supervision
Indicator 18: Percent of hearing requests that went to resolution sessions that were resolved through resolution session settlement agreements.
Indicator #18: Hearing Requests Resolved by Resolution Sessions(20 U.S.C. 1416(a)(3)(B))
Measurement: Percent = (3.1(a) divided by 3.1) times 100.
FFY Measurable and Rigorous Target
2012 (2012-2013)
48% - 58%
Actual Target Data for FFY2012 (2012-2013):
Resolution meetings held
Number of resolution session settlement
agreements
Percent of hearing requests that went to resolution session resolved through
resolution session agreements
23 11 47.8%
Discussion of Improvement Activities and Explanation of Slippage, if the State did not meet the target that occurred for FFY2012 (2012-2013):MASSDE reported data through the IDEA Part B - Dispute Resolution School Year: 2012-13 table, attached here as Appendix C.
Of the 23 resolution meetings held by school districts that were reported to the Bureau of Special Education Appeals, 11 were resulted in resolution session agreements, yielding a performance rate of 47.8%. This is only 0.2 percentage points below the measureable and rigorous target range, and 2 percentage points above last year’s reported rate. The results are consistent with prior year’s data for Indicator 18, which are largely at or near the target range. During the SPP period (Figure 18.1), in only three of the seven SPP reporting years were the actual target data for Indicator 18 below 42% or above 55%.
The data contained in this report must be viewed and interpreted with caution because the reporting sample appears to be extremely low given that there were 552 due process complaints filed during this period (by parents and school districts). As noted in prior reports, data reported here are collected by the BSEA in communications with parties. The data do not include agreements reached in resolution sessions not reported to the BSEA; agreements reached outside of the resolution session process other dispute resolution mechanisms that may have been used by the parties; or qualitative outcomes of the resolution session process.
Massachusetts Part B Annual Performance Report for FFY2012 80Submitted February 3, 2014
Massachusetts
BSEA and MASSDE continue to evaluate data reporting strategies in order to yield more comprehensive information about the resolution session process.
Figure18.1: Reported Rates of Agreement in Resolution Sessions: FFY2005-FFY2012
Consistent with instructions from the Office of Special Education and Rehabilitative Services, MASSDE is reporting one set of improvement activities in Appendix A of this report. Each activity references the relevant indicators, and is also listed in the Massachusetts State Performance Plan (MA SPP) for those indicators.
Revisions, with Justification, to Proposed Targets / Improvement Activities / Timelines / Resources for FFY2012 (2012-2013):
There are no changes to the SPP for Indicator 18; proposed targets, improvement activities, timelines, and resources in the MA SPP remain appropriate.
Massachusetts Part B Annual Performance Report for FFY2012 81Submitted February 3, 2014
Massachusetts
Part B State Annual Performance Report (APR) for FFY2012Overview of the Annual Performance Report Development:
Monitoring Priority: Effective General Supervision Part B / General Supervision
Indicator 19: Percent of mediations held that resulted in mediation agreements.
Measurement: Percent = [(2.1(a)(i) + 2.1(b)(i)) divided by 2.1] times 100.
FFY Measurable and Rigorous Target
2012
(2012-2013)77% - 87%
Actual Target Data for FFY2012 (2012-2013):
Mediations held Mediation agreements related to due process
complaints
Mediation agreements not related to due
process
Percent of mediations held that resulted in
mediation agreements
692 22 575 86.3%
Discussion of Improvement Activities and Explanation of Slippage, if the State did not meet its target, that occurred for FFY2012 (2012-2013):MASSDE reported data through the IDEA Part B - Dispute Resolution School Year: 2012-13 table, attached here as Appendix C.
The data reveal that of the 692 mediations conducted by the Massachusetts Bureau of Special Education Appeals (BSEA) in 2012-2013, 86.3% (597) resulted in a mediated agreement, putting the BSEA at the upper range of the target range. The BSEA has consistently, in the eight years covered by the State Performance Plan, implemented a mediation program that has resulted in agreement rates that are at the top of the target range. (Figure 19.1)
Massachusetts Part B Annual Performance Report for FFY2012 82Submitted February 3, 2014
Massachusetts
Figure 19.1: Data Results for Percentage of Mediations Resulting in Mediation Agreements: FFY2005-FFY2012
Source: Massachusetts Bureau of Special Education Appeals.
Improvement Activities
Consistent with instructions from OSERS, MASSDE is reporting one set of improvement activities in Appendix A of this report. Each activity references the relevant indicators, and is also listed in the MA SPP for those indicators.
In FFY2012, the BSEA’s mediators participated in a variety of training and professional development activities (both delivering and receiving) that have served to strengthen an already successful dispute resolution program. Trainings delivered tended to focus on providing school district personnel, parents, and advocates with more information about the mediation program, so that future participants can more successfully access and participate in the mediation process. Additionally, the BSEA’s Coordinator of Mediation regularly provided 1-1 coaching for the mediators and facilitators.
Revisions, with Justification, to Proposed Targets / Improvement Activities / Timelines / Resources for FFY2012 (2012-2013):There are no changes to the SPP for Indicator 19; proposed targets, improvement activities, timelines, and resources in the MA SPP remain appropriate.
Massachusetts Part B Annual Performance Report for FFY2012 83Submitted February 3, 2014
Massachusetts
Part B State Annual Performance Report (APR) for FFY2012Overview of the Annual Performance Report Development:
Monitoring Priority: Effective General Supervision Part B / General Supervision
Indicator 20: State reported data (618 and State Performance Plan and Annual Performance Report) are timely and accurate.
Indictor #20: State Reported Data(20 U.S.C. 1416(a)(3)(B))
Measurement:
State reported data, including 618 data, State Performance Plan, and Annual Performance Reports, are:
a. Submitted on or before due dates (first Wednesday in February for child count, including race and ethnicity; and educational environments; first Wednesday in November for exiting, discipline, personnel and dispute resolution; December 15 for assessment; May 1 for Maintenance of Effort & Coordinated Early Intervening Services; and February 1 for Annual Performance Reports).
b. Accurate, including covering the correct year and following the correct measurement.
States are required to use the “Indicator 20 Scoring Rubric” for reporting data for this indicator.
FFY Measurable and Rigorous Target
2012 (2012-2013) 100%
Actual Target Data for FFY2012 (2012-2013):
Pursuant to OSEP’s instruction, MASSDE is not required to report data for Indicator 20 for the initial FFY2012 APR submission. OSEP will use the Indicator 20 Rubric to calculate Massachusetts’ data for this indicator, and MASSDE will have an opportunity to review and respond to OSEP’s calculation of Massachusetts’ data on this indicator.
Discussion of Improvement Activities and Explanation of Slippage, if the State did not meet its target, that occurred for FFY2012 (2012-2013):After the OSEP calculation has been reviewed and if appropriate, MASSDE will provide additional information for Indicator 20 during the clarification period.
Improvement Activities
Consistent with instructions from OSERS, MASSDE is reporting one set of improvement activities in Appendix A of this report. Each activity references the relevant indicators, and is also listed in the MA SPP for those indicators.
Massachusetts Part B Annual Performance Report for FFY2012 84Submitted February 3, 2014
Massachusetts
Revisions, with Justification, to Proposed Targets / Improvement Activities / Timelines / Resources for FFY2012 (2012-2013):There are no changes to the SPP for Indicator 20; proposed targets, improvement activities, timelines, and resources in the MA SPP remain appropriate.
Massachusetts Part B Annual Performance Report for FFY2012 85Submitted February 3, 2014
This bullying prevention and intervention law (Chapter 92 of the Acts of 2010) enacted on May 3, 2010, required all Massachusetts districts and schools to develop and adopt bullying prevention plans by December 31, 2010. In response to this new requirement, MASSDE created the Model Bullying Prevention and Intervention Plan, which schools and districts were encouraged to use as they developed their own plans.
The law included special provisions focused on students with disabilities who the Individualized Education Program (IEP) Team determined to be at risk for bullying on the basis of the students’ disability. MASSDSE provided best practice guidance to school districts on the requirement to incorporate social and emotional learning as part of the general curriculum of every school, and the significant effect that these whole-school initiatives have in creating positive school climates and giving all students – including students with disabilities – the skills and abilities to prevent and respond to bullying behaviors. Schools were required to have social and emotional learning curricula in place for school year 2011-2012.
The Model Bullying Prevention and Intervention Plan, Guidelines for the Implementation of Social and Emotional Learning Curricula K-12, and other technical assistance documents, are available at http://www.doe.mass.edu/bullying/. This information is updated regularly.
In 2009-2010, year two of the American Recovery and Reinvestment Act (ARRA), Massachusetts school districts allocated funds to a variety of activities designed to improve outcomes for students with disabilities. Many of the districts’ initiatives were continuation activities from the first year of ARRA. Examples included:
developing new and/or expanded programs designed for special populations such as students on the Autism Spectrum, dropout prevention and recovery, reading disabilities, transition to school and career, etc.;
integrating a pilot program from the first year of ARRA into a sustainable district program; integrating technology purchased for students with IEPs with consultation and technical assistance to
instruction across all settings and curricula, progress monitoring, and reporting data; analyzing the results of program/district needs assessments and developing activities to address
identified priorities, including professional development for teachers, administrators, paraprofessional/assistant teachers, related service providers, and other personnel relevant to the education of students with disabilities and their families;
creating and sustaining positive learning environments; collaborating with other districts to develop and implement new programs, especially for high school
students, to provide transitional services including career and college preparation; hiring support staff including guidance counselors, school social workers, school adjustment
counselors, etc., with particular therapeutic and counseling skills for this population; and other innovative initiatives specific to characteristics and needs of the districts.
Massachusetts Part B Annual Performance Report for FFY2012 86Submitted February 3, 2014
ARRA Title II-D Technology Competitive Grants Program
Indicators 1, 2, 4, 14 – FFY2008-2011
The purpose of this initiative was to support projects to work collaboratively with MASSDE to create, implement, and evaluate online courses/modules for underserved high school students in alternative education, credit recovery, or credit acceleration programs.
The grantees included a variety of educational settings: alternative programs and schools, vocational-technical high schools, comprehensive high schools, and education collaboratives. Grantees specifically targeted students that are most at-risk for not graduating. Courses/modules were developed to align with the Massachusetts Curriculum Frameworks and the Massachusetts High School Program of Studies (MassCore). Grantees were required to spend at least 25% of the funds on professional development. Professional development strategies reflected a wide range of approaches in terms of the amount of training provided, topics covered, methodology, and provider expertise.
Central Massachusetts Communities of Care Positive Behavioral Interventions (PBIS) Grant
Indicators 1, 2, 4, 5, 13, 14 – FFY2007-2010
This grant program was designed to support the partnership of select school districts in Worcester County with the Central Massachusetts Communities of Care Project (CMCC) to develop and implement Positive Behavioral Intervention Systems (PBIS), a tiered system for improving school climate by supporting positive behaviors throughout the school. Participating schools received PBIS training, associated technical assistance, and other resources from the CMCC. CMCC is a provider of care management services for youth with serious emotional disturbance, with community-based family centers in Worcester County.
The priorities of the grant program were to: 1. increase the capacity of school districts in Worcester County to foster positive school climates, support positive behaviors throughout participating schools, and to reduce disruptive behaviors; and 2. increase participating schools' ability to identify students, grades 4-8, in need of mental health services, and respond to the need for intensive support through internal capacity and community-based mental health providers.
By identifying at-risk students in need of mental health services and providing them with such service, partnerships worked to reduce and/or prevent court involvement among students with emotional impairments. Participating districts receive professional development and onsite assistance in developing and implementing the principles of PBIS. The training also focused on ensuring sustainable implementation and long-term success of this initiative in the participating schools. More information on the FFY2010 grant program is available at http://finance1.doe.mass.edu/grants/grants11/rfp/250.html.
Closing the Achievement Gap Legislation
Indicators 1, 2, 3, 4, 5, 14 – FFY2009-2012
On January 18, 2010, Massachusetts enacted An Act Relative to the Achievement Gap, Chapter 12 of the Acts of 2012, comprehensive education reform legislation, which, among other things, required MASSDE to intervene in underperforming (Level 4) schools. The schools identified are targeted for aggressive interventions by MASSDE and its partners that are focused on a plan developed in collaboration with the superintendent, the school committee, the local teachers’ union, administrators, teachers, community representatives, and parents. A copy of the Act is available at http://www.malegislature.gov/Laws/SessionLaws/Acts/2010/Chapter12. For more information about accountability, partnership, and assistance initiatives, see http://www.doe.mass.edu/apa/general/.
Massachusetts Part B Annual Performance Report for FFY2012 87Submitted February 3, 2014
Closing the Early Literacy Gap for Students with Disabilities (Fund Code 297)
Indicators 6, 7, 8, 12 – FFY2009-2010
The purpose of this competitive grant opportunity was to support the development of strategic literacy action plans to enhance and align educational systems, curriculum, and instructional practices across public preschool and/or kindergarten programs, Head Start, and community-based early childhood education programs. The strategic action plans help to ensure that all programs serving students with disabilities, ages 3-5, are effective, engaging, developmentally appropriate, and designed to create seamless transitions across environments and into the next phase of the students’ education. District study teams assess current language and literacy strategies and practices, literacy intervention and differentiated strategies, and ways to use information from students’ IEPs to support language and literacy across the curriculum and in the school environment. The study teams design and implement community-based activities to support early literacy development.
Collaboration between MASSDE’s Curriculum and Instruction Math Office and Special Education Planning and Policy Development Office (SEPP)
Indicators 3, 5 – FFY2008-2012
Through a three-year collaboration between urban mathematics and special educators from across the state, a set of leadership team protocols were developed that focus on students with disabilities when planning mathematics instruction. These protocols guide leadership teams, consisting of district and school administrators and teacher-leaders, building collaboration, promoting an understanding of both mathematics and the variability of learners, and modeling rigorous core instruction in mathematics (Tier 1) using multiple accessibility strategies. The five protocols explore the following topics: 1. Shared Beliefs about Mathematics Instruction for Students with Disabilities; 2. Essential Understandings About Students with Disabilities; 3. Essential Understandings About Rigorous Mathematics Instruction; 4. Aligning Barriers and Strategies; and 5. Using an Accessibility Framework to Support a Group of Students. These protocols were presented to the field at MASSDE’s FFY2011 Curriculum and Instruction Summit. In addition, MASSDE supported the piloting a Universal Design for Learning Mathematics course associated with Massachusetts FOCUS Academy in the spring 2011 to available to MFA applicants in September 2011.
Massachusetts Part B Annual Performance Report for FFY2012 88Submitted February 3, 2014
Massachusetts
Collaboration with the Federation for Children with Special Needs
MASSDE has a long-standing collaboration with the Federation for Children with Special Needs (FCSN) (http://fcsn.org/index.php), the federally-funded Parent Training and Information Center. This year’s jointly sponsored workshops for parents included sessions on Basic Rights in Special Education, Celebrate Yourself! Self-Determination and Successful Students, Creating a Vision; Effective Communication and the IEP; An IEP for My Child; MCAS – Access and Achievement for Students with Disabilities; Suspension & Discipline in Special Education; Transition 101 – High School to Adulthood; Turning Three Essentials; Understanding My Child’s Learning Style; and 504 Plans. In addition, the APPLE (Advancing Parent-Professional Leadership in Education) Institute provides leadership training for district teams of PAC members and special education administrators. FCSN provides individualized practical information related to education law, advocacy, workshops, community resources, school programs, disability information, and other areas of concern as well as a variety of workshops in local communities on educational rights and issues, advocacy and collaboration. A comprehensive advocacy training program is available for those who wish to assist parents with special education issues. All resources are provided in Spanish or Portuguese and are free.
FCSN is a key partner of MASSDE in writing and implementing the State Personnel Development Grants. Responsibilities of FCSN include the developing and providing instruction for 3-credit graduate level courses for Massachusetts educators on ways to work with parents. Additional responsibilities include the creating self-guided modules for parents and families on successful transition for middle and high school students, and developing alternate version of these modules for special populations such as Spanish speakers. Also, FCSN participates in the state stakeholder input opportunities, assists in developing MASSDE technical assistance documents, and has included MASSDE staff as presenters in the annual Visions of Community conference.
MassPAC at FCSN is the statewide organization providing information, training, and networking opportunities to Massachusetts special education parent advisory councils (PACs) and the professionals who collaborate with them. After almost eleven years as a private non-profit, MassPAC became part of FCSN in July 2009.
Collaboration with Stakeholders
All Indicators – FFY2005-2012
Special Education Advisory Council (SAC) – The SAC is a group of parents and professionals charged under federal and state special education laws to provide policy guidance to MASSDE on issues affecting special education and related services for students with disabilities within the Commonwealth. Responsibilities of this council include: advising MASSDE on unmet needs within the state in the education of students with disabilities; providing public comment on proposed rules and regulations for special education; advising MASSDE on developing evaluations and corrective action plans; and assisting in coordinating services to students with disabilities. Information about the SAC is available at: http://www.doe.mass.edu/boe/sac/sped/default.html.
Statewide Special Education Steering Committee – Stakeholders from across disciplines, including parent, educators, administrators, advocates, and agency representatives, meet annually as members of the Steering Committee to: review baseline and current data (618 data and monitoring data); provide input about state established targets for SPP indicators; identify areas in need of attention; and provide input on improvement activities.
Massachusetts Part B Annual Performance Report for FFY2012 89Submitted February 3, 2014
Community/Residential Education Project – Massachusetts Department of Developmental Services (MDDS)
Indicators 5, 13, 14 – FFY2008-2012
The goal of the Community/ Residential Education Project, which developed through an interagency agreement between MASSDE and the Massachusetts Department of Developmental Services (MDDS), is to facilitate effective transitions from school life to more independent life within the community of students receiving publicly funded special education services who also meet the MDDS eligibility criteria for services. This goal is accomplished by supporting less restrictive, more cost effective residential options, special education services, and community based supports.
The project provides greater flexibility in service delivery based on individual support needs. Supports are provided to participants and their families to increase the families’ capacity to care for their eligible children in the home, and/or increase the participants’ and families’ capacity for effective interactions within the home and with the community. Students participating in this project may return home from residential education placements, or utilize the project to obtain a diverse array of supports in their home communities as an alternative to a residential special education school placement.
Comprehensive System of Personnel Development (CSPD) Training Project
Indicators 3, 5, 11, 13, 14 – FFY2005-2012
The CSPD Training Project was developed as a response to requirements of the Individuals with Disabilities Education (IDEA) 97 that required states to develop a multifaceted approach to personnel development under regulations for CSPD. To fulfill this obligation, MASSDE’s Special Education Planning and Policy Development Office (SEPP) instituted a series of training activities to supplement ongoing personnel preparation activities that are provided within school districts and other agencies.
The CSPD Training Project continues to provide training opportunities to districts through:
Training modules: SEPP offers training units to assist school districts and other agencies in providing high quality professional development on special education related topics. The units consist of annotated PowerPoint Presentations, and in some cases, supplemental handouts. Topics include: The Massachusetts IEP Process; A Principal's Role and Special Education in Massachusetts; Is Special Education the Right Service?; Transition From Adolescence Into Adulthood in Massachusetts; The Massachusetts Transition Planning Chart and Effective Transition Planning; and Specific Learning Disabilities: Eligibility Determination under IDEA 2004.
CSPD trainers: SEPP has contracted with a limited number of trainers who receive ongoing training on the CSPD Training Modules. CSPD Trainers work with groups of 50+ individuals in public schools, and approved special education schools. Requests for training for groups larger than 50 people serving multiple districts and/or agencies are given priority.
CSPD districts: The 40 largest districts in Massachusetts may send the districts’ professional development provider to training sessions on the modules. It is an opportunity for participants to affect MASSDE work (including the development of new modules) and network with colleagues.
During FFY2011, the CSPD training module The Transition Planning Process Massachusetts was amended to include revised tools and related activities to reflect current best practices in secondary transition. More information about the CSPD Training Project is available at http://www.doe.mass.edu/boe/sac/sped/default.html.
Massachusetts Part B Annual Performance Report for FFY2012 90Submitted February 3, 2014
MASSDE holds an annual Curriculum and Instruction Summit to: share MASSDE resources for strengthening curriculum, instruction, and assessment; identify needs for future development of curriculum resources and technical assistance; and build capacity of the MASSDE, districts, and schools through regional partnerships.
A major focus of the Summit held in November 2012 was on implementing the Massachusetts Curriculum Frameworks across disciplines. Attendees previewed model curriculum units (MCUs) currently in piloting and development. Race To The Top (RTTT) districts have begun piloting 32 model units; another 60 are currently in development. In our initial RTTT application, ESE committed to creating 100 units, aligned to the. Ultimately, all model units aligned with the frameworks in English language arts, mathematics, history and social sciences, and science will be available to every district across the Commonwealth beginning in 2014. Four prototype units are available for review and use at http://www.doe.mass.edu/candi/commoncore/.
Data Collection and Analysis Activities – Review and Revision
All Indicators – FFY2005-2012
Since the beginning of the SPP period, MASSDE has annually in reviewed and revised, as appropriate, its data collection tools, and created technical assistance tools and resources for use by school districts participating in annual data collection activities. Information relevant to data collection and analysis activities for specific indicators is described in the APRs.
District and School Assistance Centers (DSACs) – MASSDE Center for School & District Accountability
Indicators 1, 2, 3, 4, 5, 13 – FFY2009-2012
In FFY2009, MASSDE opened six regionally based District and School Accountability Centers (DSACs) to help identified districts and their schools use professional development and targeted assistance to improve instruction and raise achievement for all students. DSACs, which are part of MASSDE’s State System of Support, use a regional approach that leverages the knowledge, skills, and expertise of local educators to address shared needs through an emphasis on expanding district and school capacity for sustained improvement. Focused professional development offerings are directed at building essential knowledge and skills of educational leaders and teachers in major content areas and for key student groups.
More information about the DSAC Teams and the districts they serve is available at http://www.doe.mass.edu/apa/sss/support/teams.html.
Dropout Prevention and Recovery Workgroup – MASSDE Urban & Commissioner’s Districts Unit and Secondary Support Services Unit
Indicators 1, 2, 4, 13, 14 – FFY2008-2012
The Dropout Prevention and Recovery Workgroup, supported by both the Urban and Commissioner’s Districts unit and the Secondary Support Services unit of MASSDE, is made up of 18 urban districts whose combined number of student dropouts represents almost half of the total number of students in the Commonwealth who drop out of school. The Workgroup focuses on facilitating the sharing of promising practices among districts, and supporting districts’ team activities through face-to-face meetings and webinars. Participating school districts host the meetings, which usually include a short, formal presentation of the host district’s initiatives and opportunities to observe the activities described, brainstorm ideas and resources, and provide support and technical assistance to each other. The awarding of the High School Graduation Initiative in 2010 (see description below) allowed MASSDE the opportunity to expand the Workgroup to include the 133 targeted high schools. The variety and frequency of opportunities for networking and sharing of promising practices increased and included the addition of a monthly e-newsletter. More information about the Workgroup’s activities is available at http://www.doe.mass.edu/ccr/massgrad/workgroup.html.
Massachusetts Part B Annual Performance Report for FFY2012 91Submitted February 3, 2014
Dropout Prevention, Intervention, and Recovery Website – MASSDE Student Support and Secondary School Services Unit
Indicators 1, 2, 4, 13, 14 – FFY2008-2012
In the fall of 2011, MASSDE created the College and Career Readiness Unit which now houses all Dropout Prevention, Intervention and Recovery activities along with other high school graduation initiatives. Information specific to Dropout Prevention, Intervention and Recovery can be found at the website, http://www.doe.mass.edu/ccr/. An extensive collection of dropout reduction related articles/reports, dropout data overview information, and descriptions of the myriad state activities related to reducing dropout rates and improving graduation rates can be found at this website. New promising practices are added as they are developed and evaluated.
Early Childhood Interagency Memorandum of Understanding: Early Childhood Special Education Transition
Indicators 6, 7, 8, 12 – FFY2012
In FFY2012, MASSDE, the Massachusetts Department of Early Education and Care (EEC), the Massachusetts Executive Office of Health and Human Services (EOHHS), the Massachusetts Department of Public Health (DPH), and the U.S. Department of Health and Human Services, Administration for Children and Families, Office of Head Start, Region 1 and XII (ACF) entered into a memorandum of understanding (MOU) to promote coordination and collaboration in the provision of services to eligible infants, toddlers, and preschool children with disabilities and their families, as applicable, through Early Intervention and early education and care programs including Head Start, Early Head Start, Migrant and Seasonal Head Start, and public school preschools for children with disabilities in the Commonwealth. The MOU: recognizes the multiple facets of transition activities and opportunities for families and children of all abilities; provides a framework for state-level coordination, developing regional and local agreements, and for strengthening relationships among agencies and programs involved with young children, with and without disabilities, and their families; meets the requirements of Parts B and C of IDEA for documentation of service coordination among lead agencies and Office of Head Start requirements for interagency agreements between individual programs and their local LEAs and/or Early Intervention programs; and guides local collaboration activities for cross-systems coordination of child-find; intake, screening, referral, assessment/evaluation, development and implementation of individual child and family plans, training, and technical assistance. The MOU was distributed to key early childhood stakeholders in FFY2012, including public preschool programs.
Massachusetts Part B Annual Performance Report for FFY2012 92Submitted February 3, 2014
Early Childhood Special Education Professional Development
Indicators 6, 7, 8, 12 – FFY2009-2012
In FFY2012, MASSDE, in partnership with MEEC, provided the following professional development opportunities for public preschool and kindergarten staff and other early childhood professionals working in programs that serve young students with disabilities:
STEM 2-Day Summer Institute - The training engaged participants in understanding the core concepts in STEM education (science, technology, engineering, and mathematics). The training focused on how to make these concepts accessible to students with and without disabilities using universal design for learning (UDL).
Communities of Practice: “Engaging families through social emotional development resources: Using the CSEFEL family tools and materials”- Four meetings throughout the state to support cross-systems collaboration on inclusive learning environments and early childhood transitions. This two and a half-hour presentation focused on the family tools and parent materials created by the Center on the Social Emotional Foundations of Early Learning (CSEFEL). There were a total of 216 participants statewide.
Early Childhood Special Education Transition Professional Development - Four one-day trainings were held across Massachusetts for 120 participants from early intervention programs and public school districts. The trainings included an overview of the state performance plan and annual performance report, the new IDEA Part C regulations, and provided participants opportunity to discuss coordination of local transition practices and protocols to support timely implementation of transition planning activities. These trainings will be offered again in FFY2013.
Social Emotional Management: Supporting Children with Challenging Behaviors - Six two-day trainings on social/emotional management scheduled were held in the winter and spring of FFY2012 in three regions of the state. These trainings focused on strategies for embedding the three Indicator7 early childhood outcomes into practice.
The Early Educators Fellowship Initiative (EEFI) - A series of three learning experiences during the 2012-2013 academic year for principals and community-based providers to form a professional learning community and develop a sense of shared purpose, identity, and responsibility.
Communities of Practice “Helping All Parents Be Successful in Early Childhood Transitions” - This two and a half-hour presentation served as a capacity building opportunity to help increase educators awareness and use of strategies to effectively supporting families in their child’s successful early education transitions.
“It’s Not Just the Numbers: Making the Child Outcomes Summary (COS) Process a Meaningful Part of Your Practice & Program” - Trainers from the Early Childhood Outcomes Center hosted two one-day trainings in June 2013 on the Child Outcomes Summary Process. Special Education Directors, Early Childhood Coordinators, and teachers participating in the Child Outcomes Summary Process (Indicator 7) were invited to attend.
Communities of Practice: “Understanding Services & Benefits for Children & Youth with Special Health Care Needs” - The five sessions held in May 2013 provided an opportunity for 163 participants to learn from the Department of Public Health (DPH) and Regional Consultation Program Coordinators (RCPS) about state and local resources and benefits available to support children and youth with special health care needs.
Public Preschool Site Visits - From January through June 2013, EEC Family Community Quality Specialists and Department of Public Health (DPH) Regional Consultation Program Specialists visited the early childhood special education programs in 150 public school districts. On these visits, staff members provided guidance on technical assistance opportunities that are available to LEAs for the implementation of activities related to Indicators 6, 7, and 12.
Massachusetts Part B Annual Performance Report for FFY2012 93Submitted February 3, 2014
Massachusetts
Early Childhood Special Education Program Improvement Grant (Fund Code 298)
Indicators 6, 7, 8, 12 – FFY2012
The purpose of this federal grant program was to support school district activities to ensure that eligible children with disabilities, ages 3-5, receive a free and appropriate public education that includes special education and related services designed to meet their individual needs, and is provided in natural/least restrictive environments. Applicants were asked to submit proposals focused on one or more of following activities to improve school district processes and support performance of children with IEPs in early childhood settings:
Policies, practices and procedures to support systemic use of data analysis and progress monitoring to support instruction and continuous improvement to improve early childhood outcomes.
Targeted training and technical assistance for staff as it relates to effective program planning for Early Childhood Special Education.
Systematic practices to promote family engagement in Early Childhood Special Education, with specific attention to support cultural and linguistic diversity.
Systematic support for collaboration among Early Childhood Special Education professionals across all domains to develop individualized IEPs based on assessments and effective practices (collaborative teaming, progress monitoring, effective interventions that are culturally and linguistically appropriate).
Improvement of data collection processes and supports for improved data quality in order to analyze district, school, and classroom trends.
In FFY2012, MASSDE approved grant applications from 224 districts and charter schools. While districts’ use of the funds varied greatly, there were several common themes in how LEAs decided to use the funds. Some of the most frequently referenced programmatic activities and goals included alignment of existing curriculum with the Massachusetts Curriculum Frameworks (Common Core), using iPads and other assistive technology in the classroom, aligning pre-K assessments with kindergarten assessments, and purchasing new assessment materials.
Early Warning Indicator Index (EWII) and Early Warning Indicator System (EWIS)
Indicators 1, 2, 3, 4, 13, 14 – FFY2009-2012
Using a statistical regression model, in 2008 MASSDE developed the Early Warning Indicator Index (EWII), a predictive tool designed to identify students at risk for not graduating in four years or less of high school. Originally based on middle school data (grade 7 and 8), ninth graders from several urban districts were grouped according to five at-risk categories designated by degrees of risk: 1. spring 2010 grade 8 MCAS Mathematics scores; 2. spring 2010 grade 8 English language arts (ELA) scores; 3. 2009-2010 attendance rate; 4. number of 2009-2010 grade 8 in-school or out-of –school suspensions; and 5. age as of September 1, 2010. The findings were then distributed to the appropriate districts to allow them to develop and implement targeted, student-centered interventions.
In October of 2012 MASSDE presented The Early Warning Indicator System (EWIS) to replace the EWII. This is a comprehensive, data-driven system designed to identify students kindergarten through high school that are potentially "off-track" for grade-level or developmental age, including those students that are off-track for high school graduation (potential dropouts). This project is funded through the federal Longitudinal Data System Grant Program (LDS) and is part of a larger effort to develop an integrated suite of tools for Massachusetts educators. Future iterations of the model hope to expand its scope and include children from birth through college. The American Institutes for Research (AIR) is the contracted research group developing and validating the EWIS statistical model for the Commonwealth. Information about EWIS is available at http://www.doe.mass.edu/edwin/analytics/ewis.html.
Massachusetts Part B Annual Performance Report for FFY2012 94Submitted February 3, 2014
Educational Proficiency Plans (EPPs) – MASSDE Student Support and Secondary School Services Unit
Indicators 1, 2, 3, 4, 13, 14 – FFY2008-2012
An Educational Proficiency Plan (EPP) is an educational planning tool to be developed for the subject area(s) in which a student does not score at least 240 or above on the grade 10 English Language Arts (ELA) and Mathematics Massachusetts Comprehensive Assessment System (MCAS). An EPP includes: a review of the student's strengths and weaknesses based on MCAS and other assessment results, coursework, grades, and teacher input; the courses the student will be required to take and successfully complete in grades 11 and 12 in the relevant content area(s); and a description of the assessments the school will administer to the student annually to determine whether s/he is making progress toward proficiency.
The EPP requirement is intended to increase the likelihood that students graduating from high school have the requisite skills needed for postsecondary success. Students are encouraged to and supported in taking challenging courses that will better prepare them for postsecondary educational or career opportunities. For students with disabilities, MASSDE recommends that students’ IEPs are used to assist in identifying their strengths and weaknesses in the learning environment as the EPP is developed. More information about EPPs is available at http://www.doe.mass.edu/ccr/epp/.
Emergent Literacy Grant
Indicators 3, 5, 6 – FFY2005-2006
In order to increase districts’ capacity to support all learners in emergent literacy, the Center for Applied Special Technology (CAST) provided training to educators and parents in the use of research-based, universally-designed technology for developing literacy skills in early learners, especially those with cognitive disabilities, in an inclusive environment. During the three years of the project (2004-2006), seventeen school districts that were involved in the Massachusetts Comprehensive System of Personnel Development participated in the "Universally-Designed Technology for Literacy" project. For more information, see http://madoe.cast.org/.
Federal School Turnaround Grants
Indicators 1, 2, 3, 4, 5, 8, 14 – FFY2008-2012
These U.S. Department of Education competitive grants are for states to use to assist the lowest performing schools. Districts with one or more Level 4 (underperforming) schools are eligible to apply. MASSDE awards grants based on the plans districts develop under the Closing the Achievement Gap legislation. Districts applying for the grants are required to choose one of four prescribed intervention models and demonstrate capacity to implement that model effectively over three years. The four models for reform are: 1. Turnaround; 2. Transformation; 3. Close/Consolidate; and 4. Restart. More information about these school turnaround grants is available at http://www.doe.mass.edu/apa/sss/turnaround/grants/default.html.
Graduation and Dropout Prevention and Recovery Commission – MASSDE Student Support and Secondary School Services Unit
Indicators 1, 2, 14 – FFY2008-2010
In August 2008, the Massachusetts State Legislature passed An Act to Improve Dropout Prevention and Reporting of Graduation Rates, which established a Commission to make recommendations in 10 topic areas. The Massachusetts Executive Office of Education (MEOE) released the final Commission report, Making the Connection, in October 2009. The report includes findings and recommendations in four main areas: 1) new statewide expectations; 2) early identification; 3) effective prevention, interventions, and recovery; and 4) responsive reforms and budget priorities. A copy of this report is available at http://www.mass.gov/edu/dropout-report.html.
Massachusetts Part B Annual Performance Report for FFY2012 95Submitted February 3, 2014
Inclusive Concurrent Enrollment Partnership Programs for Students with Disabilities
Indicators 5, 13, 14 – FFY2005-2012
This state-funded grant program is designed to build and expand partnerships between high schools in public school districts and state public institutions of higher education to offer inclusive concurrent enrollment opportunities for students with severe disabilities between the ages of 18 and 22, in credit and non-credit courses that include non-disabled students. These partnerships will result in improved systems that better serve students with severe disabilities and support their college and career success.
Inclusive Concurrent Enrollment programs are designed to promote and enhance students’ self-determination and self-advocacy skills; offer students opportunities to participate in the student life of the college community, as well as in career planning, vocational skill-building activities, and community-based competitive employment opportunities; and to improve students’ academic, social, functional, and other transition-related skills.
As part of the improvement and expansion of these programs, partnerships continue to develop their programs to include individualized, community-based, competitive employment opportunities that align with students’ career goals and course selection. A summary of 2012-2013 activities related to this grant program is available at http://www.doe.mass.edu/research/reports/2013-05ConcurrentEnrollment.pdf.
Integration of College and Career Readiness (ICCR) Task Force
Indicators 1, 2, 13, 14 – FFY2012
In January 2012, MASSDE convened a task force to study the integration of college and career readiness in K-12 education.) In June 2012 the Board of Elementary and Secondary Education (“the Board”) voted to adopt the recommendations of the Task Force, identified in the ICCR T as k F o r c e R epo r t , and charged MASSDE with the task of implementing the following recommendations:
I. Incorporate Career Readiness into Massachusetts Recommended Course of StudyII. Strengthen School, Employer, Higher Education, and Community PartnershipsIII. Improve the Utilization of School Counselors in Deployment of Career Readiness EducationIV. Incentivize Schools to Create and Demonstrate Comprehensive Career Readiness StrategiesV. Promote the Importance of College and Career Readiness for All StudentsVI. Explicitly Identify Personnel Responsible for Effectively Executing the Task Force Recommendations
The work of the Task Force and of MASSDE brings a renewed focus on career readiness and the need for both college and career readiness as essential components of preparation for postsecondary success for all students. Career readiness has been defined to mean “an individual has the requisite knowledge, skills and experiences in the academic, workplace readiness and personal/social domains to successfully navigate to completion an economically viable career pathway in a 21st century economy.” MASSDE created subcommittees to begin the work of implementing the recommendations.
In March of 2013, the Board and the Massachusetts Board of Higher Education (BHE) agreed on a common definition of College and Career Readiness which says, in part: “Massachusetts students who are college and career ready will demonstrate the knowledge, skills and abilities that are necessary to successfully complete entry-level, credit-bearing college courses, participate in certificate or workplace training programs, and enter economically viable career pathways. In order to meet this goal, the Commonwealth has defined a set of learning competencies, intellectual capacities and experiences essential for all students to become lifelong learners; positive contributors to their families, workplaces and communities; and successfully engaged citizens of a global 21st century.”
Massachusetts Part B Annual Performance Report for FFY2012 96Submitted February 3, 2014
Massachusetts 21st Century Community Learning Centers (CCLC) – Enhanced Programs for Students with Disabilities
Indicators 1, 2, 4, 13, 14 – FFY2008-2012
Funded under Title IVB of the 2001 No Child Left Behind Act (NCLB), 21st Century Community Learning Center (CCLC) grants are designed to establish or expand community learning centers that operate during out-of-school hours and provide students with academic enrichment opportunities that complement the students' regular school day. Over the past nine years, MASSDE has funded more than 180 sites in more than 50 communities across the Commonwealth.
During the 2009-2010 school year, ESE developed the Pilot SPED Enhancement Grants to increase the capacity of existing CCLC sites to include students with more severe disabilities into an array of activities that advanced student achievement and provided opportunities for socializing and participating with peers without disabilities. Funds are used to stipend specially trained instructional staff, stipend health care, instructional assistants and/or other support staff, support additional planning time, and provide professional development, technical assistance and/or consultation services(e.g. proper use of adaptive equipment, language of instruction for students with disabilities, creating an inclusive environment, etc.).
Thirteen sites offered pilot programs in 2010-2011. Based on their success, the SPED Enhancement Grant opportunity continues to be offered to CCLC sites. Current information about this grant program is available at http://www.doe.mass.edu/21cclc/.
MFA builds upon the previous successes of Project FOCUS and Project FOCUS Academy (PFA). The grant program provides online professional development opportunities and leadership institutes to educators, families, and other stakeholders on a variety of topics related to instructing students with disabilities. The courses are research-based, have rigor and expectations of three or four credit graduate level courses, and target areas that increase educator effectiveness and student outcomes. More information about current MFA offerings is available at http://www.doe.mass.edu/mtss/ta/mfa/.
Massachusetts Part B Annual Performance Report for FFY2012 97Submitted February 3, 2014
Massachusetts High School Graduation Initiative (MassGrad)
Indicators 1, 2, 13, 14 – FFY2010-2012
In fall 2010, the U.S. Department of Education selected Massachusetts as just one of two states and one of 29 projects out of 184 total applicants to receive funding through federal High School Graduation Initiative award. The purpose of the award is to support statewide and local efforts for high school dropout prevention, intervention, and recovery. The focus is on the high schools (MassGrad cohort) that exceeded the statewide annual dropout rate of 2.9% in school year 2008-2009.
This award identifies 133 targeted high schools with dropout rates higher than the state average. MASSDE provides technical assistance, training, and opportunities for schools to exchange promising practices through face-to-face gatherings as well as webinars and an e-newsletter. The following are the key activities for this grant:
Creation of a state high school graduation coalition: MASSDE will create an inter-agency, cross-sector coalition to facilitate statewide sharing of promising programs and practices.
Expansion of the Dropout Prevention and Recovery Workgroup: MASSDE will considerably expand the existing Workgroup to increase the number of participating schools and districts and broaden the variety and frequency of opportunities for networking and sharing promising approaches among the 133 schools in the HSGI cohort.
Implementation of Research-based Practices in HSGI Cohort: through a competitive grant process, MASSDE will help support targeted schools in implementing a select menu of research and evidence-based practices and strategies through technical assistance, state guidance, and learning exchanges.
Establishment of Three New Gateway to College Sites: MASSDE will create a new partnership with the Gateway to College National Network to establish the Gateway to College program – an early college model to support at-risk students.
The project has also established a Leadership Council that will support and inform the key activities as well as connect the project services with new and ongoing efforts across the state. A broad range of state agencies and community, statewide, and national organizations are represented on this council. More information about MassGrad activities is available at http://www.doe.mass.edu/ccr/massgrad/.
Increasing the number of licensed educators teaching students with moderate disabilities grades PreK-12 and students who are English language learners is aligned with MASSDE’s goals of having qualified educators for every public school classroom as a means of improving student outcomes and reducing the achievement gaps. The Massachusetts Licensure Academy (MLA) was created to meet the significant shortage of educators who are qualified to teach these student populations. MLA courses are delivered through the Massachusetts Online Network for Education (MassONE) and have at least one face-to-face session. Begun in the spring of 2009, the MLA, when completed, will include five , three-credit, graduate level courses that will provide: content to address the seven special education competencies required for the moderate special education license, including the new competency of information regarding Assistive and Augmentative Communication and Other Assistive Technologies (2 courses); content information included on the ESL/MTEL (4 courses); the knowledge and skills required for ELA and math instruction and covered in the Foundations of Reading and General Curriculum MTELs (2 courses); and evidence-based strategies for creating and maintaining positive learning environments for all students (1 course).
The first courses, taught in FFY2011 were: Federal and State Laws, Educational Terminology and the Role of Other Agencies Pertaining to the Education of Students with IEPs; and Assessment for Determination of Education Needs, Curriculum, Services and Programs, Including Augmentative and Alternative Communication and Other Assistive Technologies. Additional courses are presently being developed in the content areas, the first of which is Mathematics for Special Educators – Content and Pedagogy. More information about current MLA offerings is available at http://www.doe.mass.edu/sped/mla/.
Massachusetts Task Force on Behavioral Health and Public Schools
Massachusetts Part B Annual Performance Report for FFY2012 98Submitted February 3, 2014
The Behavioral Health and Public Schools (BHPS) Framework and Assessment Tool was created by the BHPS Task Force and Department between 2009-2011. Both resources are designed to provide guidance as well as help schools assess and set goals regarding activities and strategies that staff and programs engage in to create supportive school environments. The Final BHPS Task Force Report, available at http://www.doe.mass.edu/research/reports/0811behavioralhealth.pdf, outlines recommendations to state policy makers related to this work.
MASSDE/SEPP is developing an online Resource Library to highlight OSEP Funded Technical Assistance and Dissemination Resources and other online resources. This resource is designed to provide evidence-based practices in professional development. The library will include information on the IRIS Center; Access Center: Improving Outcomes for Students K-8; Center for Positive Behavioral Interventions and Supports (PBIS); National Center on Response to Intervention; and the NASDSE Professional Development Series. Topics will include, but are not limited to: Co-Teaching Model; Differentiated Instruction; Transition Planning; Positive Behavioral Interventions and Supports; Response to Intervention; Accommodations; Role of the Paraprofessional; Supervising the Paraprofessional; and Disproportionality in Special Education.
Massachusetts Tiered System of Support (MTSS) Conference
MASSDE hosted a conference on the Massachusetts Tiered System of Support in March 2012 for teams of District and School leaders throughout the Commonwealth. Topics included: Tiered System of Support: Linking Academic and Behavior Supports; The new learning sciences: How variability in learning informs teaching in the 21st century; School-wide Positive Behavior Supports: Tiered System of Support-Non-academic; Working memory: From concept to classroom; Tiered instruction with Mathematics, K- Algebra; and Challenging every learner: Approaches to mediating difficult text during Tier 1 Instruction, K-8. Districts with teams of educators attending the MTSS conference were eligible to apply for an MTSS grant to support the development of their action plans focused on establishing, enhancing, and aligning an academic and non-academic tiered system of support.
Massachusetts Tiered System of Support (MTSS) Grants
Massachusetts has developed a blueprint outlining a single system of supports that is responsive to the academic and non-academic needs of all students. This blueprint, the Massachusetts Tiered System of Support (MTSS), provides a framework for school improvement that focuses on system level change across the classroom, school, and district to meet the academic and non-academic needs of all students, including students with disabilities, English language learners, and students who are academically advanced. It guides both the provision of high-quality core educational experiences in a safe and supportive learning environment for all students and academic and/or non-academic targeted interventions/supports for students who experience difficulties and for students who have already demonstrated mastery of the concept and skills being taught. The purpose of the MTSS grants is to support the development of district and school strategic action plans focused on establishing, enhancing, and aligning an academic and non-academic tiered system of support.
Massachusetts Part B Annual Performance Report for FFY2012 99Submitted February 3, 2014
Massachusetts Work-Based Learning Plan (WBLP) – MASSDE Student Support, Career & Education Services
Indicators 1, 2, 4, 13, 14 – FFY2008-2012
The Massachusetts Work-Based Learning Plan (WBLP) is a diagnostic, goal-setting and assessment tool designed within the school-to-career system to drive student learning and productivity on the job. It was developed by the MASSDE through an interagency collaboration of employers, educators, and workforce development professionals. Through work-based learning experiences, students have an opportunity to learn about various career areas and try different work styles, find out what type of work they enjoy, find out how they learn best in a workplace setting, and find out what natural supports are available. Students learn and practice basic foundation skills and begin to develop life-long career skills. More information is available at http://www.skillslibrary.com/wbl.htm.
Beginning in March 2009, SEPP collaborated with the MASSDE Connecting Activities Office (see http://www.doe.mass.edu/connect/) to develop a guidance document called Using the Massachusetts Work-Based Learning Plan in Transition Planning Activities for Students with Disabilities (available at http://www.skillslibrary.com/wbl/wblp_transition.pdf ) and to enhance the WBLP Scoring Rubric (see http://www.skillslibrary.com/wbl/WBLP_Rubric_Summer2009.pdf). The document is intended to: encourage the inclusion of students with disabilities in WBLP programs; be used as an option for individual student transition planning; and support educators, employers, Connecting Activities field staff, Workforce Investment Boards, One Stop Career Centers, and Local School-to-Career Partnerships in the implementation of quality work-based learning for students with disabilities.
Through this collaboration, MASSDE also created the Work Experience and Transition Activities resource webpages, available at http://resources21.org/transitionworkexp/index.asp. This resource lists resources, including websites, articles, and program materials, to assist in planning the work experiences and developing WBLPs for students with disabilities.
National Association of State Directors of Special Education (NASDSE) Professional Development Series
MASSDE provides the districts and all educators in the Commonwealth with the National Association of State Directors of Special Education (NASDSE) Professional Development Series. NASDSE facilitates this series with support from the Pennsylvania Department of Education and the Pennsylvania Training and Technical Assistance Network (PaTTAN). These conferences bring nationally recognized experts to the states using technology, providing an affordable and accessible means of quality personnel development for a variety of stakeholders. Experts provide important information on high-interest topics to audiences that include state directors of special education, state agency staff, local administrators, teachers, related service providers, higher education faculty, families, and other stakeholders.
Conference topics that are made available via satellite, streaming video, and/or DVD, have included: Online Learning for Students with Disabilities: What We Know and What We Need to Know; Educating Students With Hearing and Vision Challenges- Innovations for Success; Autism Today: Evidence-Based Practices and Tools for Implementing Successful Programs; and Improving Social Emotional Health In Schools: Evidence-Based Intervention Strategies for Young Children. The most current information about this series is available at http://www.doe.mass.edu/sped/2012/nasdse.html.
Massachusetts Part B Annual Performance Report for FFY2012 100Submitted February 3, 2014
Preschool to Grade 3 Curriculum, Instruction, and Assessment Alignment Project (Fund Code 264A & 264B)
Indicators 3, 5, 6, 7, 8, 12 – FFY2007-2010
The purpose of this three-year grant program was to identify and support strategies and resources to increase districts’ capacity to improve the quality of education and inclusion of children with disabilities by aligning and coordinating curriculum, instruction, and assessment from Preschool to Grade 3.
Planning grantees (264A) researched, discussed, and documented their strategies, training, and progress within and/or across the age span, with a focus on how students with disabilities access the general curriculum. The teams brought together early childhood educators, elementary school staff, special education professionals, administrators, and parents to explore the alignment of curriculum, instruction, and assessment in inclusive classrooms; identify best practices to support all students along the pre-K to grade 3 continuum; and prioritize areas of strength and needed improvement.
Teams in the continuation year (264B) implemented two to three strategies that were identified during the planning year as a means of strengthening inclusion practices and building a continuum in the early elementary grades. FFY2010 was the final year of funding for Fund Code 264B; best practices and outcomes will be reported and disseminated statewide. Forty-seven districts participated in the program.
Procedures for Timely Verification of Correction of Noncompliance
Using updated guidance from the Office of Special Education Programs (OSEP) and other technical assistance sources, MASSDE is engaged in continuous review and revision of its procedures for verifying correction of noncompliance for the above-referenced indicators in accordance with OSEP Memorandum 09-02 from October 17, 2008. Verification activities have included:
(1) if needed, changing, or requiring each district to change, policies, procedures and/or practices that contributed to or resulted in noncompliance based on root cause analyses;
(2) for noncompliance concerning a child-specific requirement, requiring each district to submit updated data demonstrating that each district has corrected each individual case of noncompliance or completed the required action, although late, unless the child is no longer within the jurisdiction of the district; and
(3) requiring each district to submit updated data for review to demonstrate that each district is correctly implementing the specific regulatory requirements (i.e., achieved 100% compliance); and
(4) engaging in continuous improvement of state and local data collection systems, definitions, and technical assistance sources to ensure correct implementation of relevant regulatory requirements.
When data reflects that each instance of child-specific noncompliance has been remedied, and that the district is 100% compliant with the specific regulatory requirements, MASSDE notifies the district in writing that it has verified correction of identified noncompliance.
In the fall of 2004, MASSDE was awarded a three-year U.S. Department of Education funded State Improvement Grant (SIG) - Project FOCUS Academy (PFA). Project FOCUS Academy was designed to develop professional development programs to help students with disabilities build sound career goals and learn skills to ensure successful postsecondary outcomes. As part of the SIG, MASSDE worked with educators from selected high schools. The project’s design required study groups from high schools to participate in face-to-face and distance-learning professional development opportunities in the areas of: Transition/Postsecondary Outcomes; School-wide Positive Behavioral Interventions and Supports; Universal Design for Learning; and Family Participation. The distance-learning model was offered through MASSDE's Massachusetts Online Network for Education (MassONE).
Massachusetts Part B Annual Performance Report for FFY2012 101Submitted February 3, 2014
Massachusetts
Race to the Top Early Learning Challenge Fund Award
Indicators 6, 7, 12 – FFY2011-2012
In FFY2011, Massachusetts applied for and received a Race to the Top Early Learning Challenge Fund award of $50 million for its proposal: From Birth to School Readiness: Massachusetts Early Learning Plan, 2012-1015. This initiative, coordinated by the Massachusetts Department of Early Education and Care (MEEC), will advance goal of ensuring that all children, particularly high-needs children, have access to quality pre-K education.
Key strategies of the plan include: aligning early education and grades K-3 to promote healthy child development; implementing standards for early learning and development, including English language development standards for children from birth to age 5; creation of the Massachusetts Early Learning and Development Assessment System (MELD) for birth to grade three, including expanding screening for children and the development of a common tool for kindergarten entry assessment; providing targeted technical assistance and professional development opportunities to early educators to enhance their effectiveness; and increased engagement with parents, families, and community members that is culturally and linguistically appropriate. A copy of Massachusetts’ successful application is available at http://www.eec.state.ma.us/docs1/board_materials/20111017-rttt-elc.pdf.
Revision of “Is Special Education the Right Service?” (ISERS)
Indicators 3, 5, 6, 9, 10 – FFY2008-2009
The ISERS document offers guidance for practitioners and parents on how to: identify students with disabilities; be knowledgeable of updated regulations and characteristics of disabilities; define appropriate services and interventions; and ensure a responsive general education environment for all students. Revision began in March, 2009 with the convening of Disability Workgroups composed of experts in each of the areas of disability to review the current document for accuracy and relevance in light of new research and current practices.
Revision of “Ten Step Guide for Comprehensive Educational Assessment of Students with Visual Impairments”
Indicators 3, 5, 6, 7, 11, 13 – FFY2008-2012
The Guide was revised by a comprehensive group of stakeholders and reissued in July 2012 as The Guidelines for the Specialized Assessment of Students with Visual Impairments (http://www.doe.mass.edu/sped/vision-guidelines/). Members of the Vision Impairment Disability Workgroup, working with other experts in the fields of diagnosis, treatment, education, and training of students with visual impairments, collaborated on the revisions to reflect updated regulatory information and include best practices. The Guidelines include a new section describing the “hidden” characteristics of a vision loss that affect academic and social factors, detailed job descriptions for the various professionals that provide specialized services for students with visual impairments, and recommendations on gathering information from all team members to enhance decision-making.
The Guidelines introduce the Expanded Core Curriculum (ECC), the body of knowledge and skills needed by students with visual impairments due to their unique disability-specific needs. The ECC should be used as a framework for assessing students, planning individual goals, and providing instruction. Understanding these characteristics will enable non-vision specialists to facilitate meaningful inclusion and participation of students with visual impairments throughout the school day. Among other things, the Guidelines: review types of assessments and provide sample assessment forms for an initial evaluation or three-year reevaluation to support the eligibility determination of special education services for students with visual impairments; help ensure a common understanding of the purpose and complexity of conducting specialized assessments of students with visual impairments; and assist Teams in designing instruction and supports for students with visual impairments to ensure access to the general curriculum and life of the school; and provide resources to help general and special educators and related service providers meet the unique needs of students with visual impairments and prepare them for further education, employment, and independent living.
Massachusetts Part B Annual Performance Report for FFY2012 102Submitted February 3, 2014
The Massachusetts Middle and High School Reading Initiative project began in 2002 with the development of the Massachusetts Secondary Literacy Framework. This framework included three key components: reading instruction for all students, additional intervention programs for struggling readers, and a comprehensive reading assessment system. The model's school-wide approach was based on eight fundamental principles: 1. involvement of all staff in literacy instruction; 2. a focus on reading across the content areas; 3. multiple interventions for struggling readers; 4. professional development for all staff; 5. adequate time for reading and writing in the school schedule; 6. flexible grouping patterns; 7. assessment that drives instruction; and 8. leadership support and guidance.
Recipient schools received small planning grants to form reading leadership teams and to develop a school profile of current practices and a related school action plan. For three succeeding years, schools then received small grants to implement one or more elements of their action plans. In addition to receiving a small grant, schools came together in network meetings three times a year to discuss current research on adolescent literacy and share their efforts to improve adolescent literacy achievement. Members of the Reading Leadership Team at each school (which consists of a cross-section of staff, including representatives from all content areas and special programs) attended these meetings.
Topics discussed included: Creating a School-wide Approach to Improving Reading; Assessing Literacy Needs; Vocabulary Development; Improving Comprehension; Motivation; Helping the Struggling Adolescent Reader; Content Area Literacy; and Effective Writing Instruction. Participants have had an opportunity to hear from a number of national literacy experts, including Cathy Collins Block, Dorothy Strickland, Tim Shanahan, Donald Deshler, Steve Graham, Donald Leu, and John Guthrie. Staff from project schools and other Massachusetts schools led breakout sessions at each network meeting. These breakout sessions provided an opportunity for other project schools to learn about the promising practices that are being tried by other schools. At each meeting, school teams had a chance to meet with each other to reflect on the day's learning and to discuss implications for their schools.
Massachusetts Part B Annual Performance Report for FFY2012 103Submitted February 3, 2014
Massachusetts
Secondary Transition Strategic Planning
Indicators 1, 2, 13, 14 – FFY2011-2012
In May 2012, staff from MASSDE’s special education and college/career readiness units attended NSTTAC’s Capacity Building Institute in Charlotte, NC, along with Massachusetts stakeholders from districts, higher education, the Parent Training and Information Center, and the advocacy community, for the purpose of developing a statewide strategic plan. As a result of this meeting, staff from MASSDE’s special education, college/career readiness, and career/vocational technical education offices continue to meet regularly with a widening group of stakeholders around secondary transition.
Several other activities have been especially focused on supporting state and local efforts to achieve 100% compliance with Indicator 13. MASSDE continues to provide districts with high quality technical assistance and professional development that is both broad-based and individualized to areas of need identified through data collection and analysis. In September 2012, MASSDE issued a new technical assistance advisory, Postsecondary Goals and Annual IEP Goals in the Transition Planning Process, which is now widely used across the state to inform educator training in secondary transition.
Additionally, in consultation with a broad cross-section of stakeholders and with graphics expertise donated by the Institute for Community Inclusion at UMass Boston, MASSDE created the Massachusetts Student-Driven Secondary Transition Model to visually represent the movement from school to post-school life for students with IEPs aged 14-22. This visual model was unveiled at the April 2013 Massachusetts Secondary Transition Capacity-Building Conference, an event which drew 120 four-person teams of educators from districts, special education collaboratives, vocational-technical schools, and approved special education private schools. During the course of the day, these educators heard from noted speakers such as Dr. Michael Wehmeyer, from the University of Kansas; Dr. Thomas Hehir, from Harvard University; and Dr. Joseph Madaus, from the University of Connecticut. Attendees also heard from self advocates and from their colleagues across the state who are exemplars of best practice. This conference was held with a twofold purpose: 1. to provide district leadership teams with essential knowledge about the transition planning process, both as a cohesive, integrated system and from the perspective of evidence-based practices in Self Determination; Transition Assessment; Career Development; Postsecondary Education and Training; and Family Engagement and Community Collaboration, and 2. to engage district leadership teams in a data-based planning process designed to improve postsecondary outcomes for all students with disabilities. In order to attend the conference, all teams were required to complete the new Massachusetts District/School Secondary Transition Needs Assessment and to engage in planning during the conference itself, using the new District/School Strategic Planning Tool. To extend strategic planning begun at the conference, MASSDE has subsequently offered a targeted grant opportunity in the areas of transition assessment and student self determination to conference attendees.
Secondary Transition – Transition Works: Innovative Strategies for Transitioning Youth with Disabilities from School to Work – Massachusetts Rehabilitation Commission (MRC) 5 Year Federal Grant
Indicators 1, 2, 4, 13, 14 – FFY2008-2011
Transition Works: Innovative Strategies for Transitioning Youth with Disabilities from School to Work, was a five-year grant from USED awarded to MRC to support transitioning youth with disabilities from school to work. The program focused on aligning existing services and developing innovative practices. As part of this initiative, vocational rehabilitation counselors partnered with local school districts to support youth with disabilities in their transitions from school to work, postsecondary education, and independent living. In addition, MRC and the Federation for Children with Special Needs wrote a parent guide to transition, and the Institute for Community Inclusion developed a new transition website, Youth on the Move, www.youth-move.org. MASSDE, the Federation for Children with Special Needs, Urban Pride, Commonwealth Corporation, and the Institute for Community Inclusion partnered with MRC to implement grant activities. Additional information about this partnership is available at http://www.mass.gov/eohhs/consumer/family-services/youth-services/youth-with-disabilities/transition-works-grant.html.
Massachusetts Part B Annual Performance Report for FFY2012 104Submitted February 3, 2014
Self-Assessment Disproportionality Tool for Districts
Indicators 9, 10 – FFY2008-2009
Incorporated into technical assistance for flagged districts with disproportionate representation in special education, this self-assessment tool encouraged districts to examine their own policies and procedures regarding special education eligibility and disability definitions.
Review of Special Education in the Commonwealth of Massachusetts
All Indicators – FFY2011-2012
Dr. Thomas Hehir and Associates was retained by MASSDE to conduct comprehensive reviews of special education in the Commonwealth using available data and resources. The research focused on issues of identification, placement, and performance of students with disabilities in Massachusetts, and yielded interesting and useful results. The work was informed by conversations with key stakeholders. Each report identified ways to promote stronger outcomes for students with disabilities. The reports and recommendations are informing MASSDE’s work with districts, families, and other partners, on behalf of students with disabilities.
Copies of the reports are available at http://www.doe.mass.edu/sped/hehir/
Review of Special Education in the Commonwealth of Massachusetts (April 2012) Students with Disabilities in Massachusetts Career and Technical Education Programs (July 2013) Use of Out-of-District Programs by Massachusetts Students with Disabilities (October 2013)
Sign Language Web-Based Resource Library
Indicators 3, 5 – FFY2008-2012
The Sign Language Video Resource Library project is to develop STEM (science, technology, engineering, and mathematics) vocabulary reference tools that educational interpreters and teachers of students who are deaf or hard-of-hearing may incorporate into instruction. Available technical assistance will include written guides and a web based library, searchable by ASL and English. The design of the tool will be user-friendly, and promote ready access for end users. In addition, under this project, MASSDE provides a cost-free institute for educational interpreters to improve participants’ sign vocabulary in the STEM framework.
SPecial EDition Online Newsletter
All Indicators – FFY2007-2008
The purpose of this newsletter was to provide school districts with ongoing technical assistance and to prompt dialogue within, among, and between districts and MASSDE, organized around the SPP indicators.
Massachusetts Part B Annual Performance Report for FFY2012 105Submitted February 3, 2014
Special Education Leadership Academies and Seminars
Indicators 3, 5, 6, 7, 8, 11 – FFY2005-2012
Beginning in FFY2005, as part of the Special Education Summer Institutes, MASSDE has annually provided two Special Education Leadership Academies. The academies provide school district special education administrators opportunities to improve current skills and develop new leadership skills. Academy I is open to administrators who have less than five years of experience; Academy II is for administrators with more than five years of experience. Both Academies provide professional development to administrators in the following areas: effective leadership in the areas of state and federal laws and regulations; fiscal administration; data collection and analysis; staff recruitment and retention; instructional program design and improvement; and access to the general curriculum based on the Massachusetts Curriculum Frameworks.
MASSDE also sponsors ongoing leadership seminars for former participants of the Leadership Academies for participants to reconnect and network with their Academy colleagues and share effective practices, policies, strategies, and products.
In FFY2010 MASSDE designed, developed and implemented a team-based Special Education Leadership Academy for the District and School Assistance Centers (DSACs) that included, in addition to the Special Education Administrator, school and district leaders such as Principals/Vice Principals, Curriculum Directors, and Guidance Directors. in collaboration with the MASSDE/Career/Vocational Technical Education unit, designed and developed a Special Education Leadership Academy in FFY2011 that followed the design of the DSAC team-based leadership academy. Information about the 2012-2013 offerings is available at http://www.doe.mass.edu/sped/leadership-academies/2012/default.html.
Special Education Professional Development Summer Institutes
The Special Education Summer Institutes are statewide professional development opportunities provided without cost to special education professionals. Sponsored by MASSDE in partnership with school districts, educational collaboratives, institutions of higher education, and professional associations, the Institutes are designed to support efforts by approved private special education schools, educational collaboratives, and local school districts to increase the quality of programs and services provided to students with disabilities. Additionally, SEPP collaborates with the MASSDE Office of Curriculum and Instruction to provide professional development institutes in specific curriculum content areas such as Mathematics, Science, and Literacy. Special Education Institutes offered in the Summer of 2012 included:
Accessing Communication & Curriculum through Technology Assessing English Language Learners (ELL) With Disabilities Collaborative Evaluation Led By Local Educators Current Issues in School-Based Occupational Therapy & Physical Therapy Effective Evaluation of Special Education Programs Improving Spoken and Written Language: From Research to Practice Literacy for Students who are Deaf or Hard-of-Hearing Making Assistive Technology Happen: Assistive Technology for Teaching and Learning Managing Behavior in an Inclusive Classroom Meeting the Academic and Non-Academic Needs of Students with Asperger Syndrome Occupational Therapy & Physical Therapy in Educational Settings Paraprofessionals in Inclusive Settings Strategies for Students with Sensory Processing Disorders in Inclusive School Settings Emerging Technology for Students with Low Vision
Additional information about the Institutes listed above is available at http://www.doe.mass.edu/candi/institutes/12/sped.html.
Special Education Program Improvement Grants (Fund Code 274)
Massachusetts Part B Annual Performance Report for FFY2012 106Submitted February 3, 2014
The purpose of this grant program is to fund professional development activities that will advance the knowledge, skills, and capacity of educators to meet the diverse needs of students with disabilities and to promote inclusive practices across all settings through high-quality, job-embedded, and sustained professional development activities. Grant priorities for FFY2012 were aligned with the Indicators identified by the federal Office of Special Education Programs (OSEP) in the State Performance Plan (SPP) and Annual Performance Report (APR).
Fund Code 274 was available to all public school districts, public charter schools and educational collaboratives. Almost every school district in the state utilizes these funds. Additional information about current grant priorities is available at http://www.doe.mass.edu/grants/grants14/rfp/274.html .
Special Education Program Improvement Grants (Fund Code 249)
The purpose of this grant program is to fund professional development activities that will help to improve the skills and capacity of educators to meet the diverse needs of students with disabilities. Its priorities are to enhance program-based induction, mentoring, and retention programs and to advance the skills of educators through professional development activities. Fund Code 249 is available to all approved private special education schools. All funded programs must be effective, sustained, and intensive in order to have a positive and lasting positive influence on classroom instruction and outcomes for students with disabilities.
Priorities for FFY2006 and FFY2007 were: Induction/Mentoring; and Curriculum Development, Instruction, and Classroom Assessment. FFY2008 and FFY2009 priorities were: Educator Quality and Effectiveness: Induction, Mentoring, and Retention; Supporting Schools and Students: Curriculum Development, Instructional Practices, and Classroom Assessment; and College and Career Readiness: Secondary Transition Planning. Priorities for FFY2011 were: Educator Effectiveness, Content Skill Development, Non-Academic Supports, and Secondary Transition. Priorities for FFY 2012 were: Strengthening Curriculum Instruction, Non-Academic Supports, Early Childhood Inclusive Practices for Students with Disabilities and Secondary Transition.
Special Education Website
All Indicators – FFY2005-2012
The Special Education section of MASSDE’s website provides a variety of tools, news items, and resources to districts, parents, and other stakeholders: http://www.doe.mass.edu/sped/. Some of the most visited sections of the website are:
Headlines: http://www.doe.mass.edu/sped/ Contact Us – Opportunity for external customers to request information/ask questions:
[email protected] Grants: http://www.doe.mass.edu/sped/grants.html Training: http://www.doe.mass.edu/sped/training.html Forms and Notices: http://www.doe.mass.edu/sped/iep/ Special Education Program Plan: http://www.doe.mass.edu/sped/programplan/ Special Education Data: http://profiles.doe.mass.edu/state_report/special_ed.aspx Massachusetts Tiered Systems of Support (MTSS): http://www.doe.mass.edu/sped/mtss.html and
http://www.doe.mass.edu/mtss/default.html
Massachusetts Part B Annual Performance Report for FFY2012 107Submitted February 3, 2014
Trauma Sensitive Schools Initiative – MASSDE Student Support Services Unit
Indicators 1, 2, 4 – FFY2008-2012
This MASSDE initiative focuses on the needs of students who have experienced or witnessed trauma by assisting with reducing the barriers that may affect academic performance, classroom behavior, and relationships that result from trauma. MASSDE is working to bring “trauma sensitive” practices to schools across the state through annual trainings and technical assistance that incorporate best practices and strategies for creating a safe supportive school environment where all students can learn, and where students are held to high expectations. Information about these activities is available at http://www.doe.mass.edu/tss/.
In the fall of 2012, MASSDE was awarded $5.5 over 5 years million under the federal State Personnel Development Grant (SPDG) program. MASSDE’s Office of Tiered Systems of Support (OTSS) is the managing office for this iteration of the SPDG, The Partnership Project (TPP). The goal of TPP is to expand the statewide system of professional development by creating model sites in each of the Commonwealth’s six regions to demonstrate the implementation of evidence-based practices within a tiered system of supports. These model sites will provide opportunities for educators and families from around the Commonwealth to observe the different stages of implementing a tiered system of supports in each region. To support the model sites, MASSDE is partnering with the Department of Public Health/Early Intervention (DPH/EI), EEC, the Federation for Children with Special Needs (FCSN), MRC, and the Massachusetts Readiness Centers with their affiliated Institutes of Higher Education (IHEs).
The TPP districts were chosen through a competitive grant program, and represent a diverse group of high-needs districts that demonstrated a high level of interest and readiness for implementing and sustaining the components of a tiered system of supports. These districts will benefit from grant activities that include developing and delivering new evidence-based face-to-face and online training and technical assistance, products, web-based tools, services, and activities, and creating opportunities for educators to apply newly acquired skills and knowledge with fidelity to classrooms, schools and districts. The content areas for the newly developed professional development will include Universal Design for Learning (UDL), Positive Behavioral Interventions and Supports (PBIS), developing district-level structures and supports, academic content areas including literacy and mathematics, secondary transition and post secondary planning, family engagement, and evidence-based professional development methods, including instructional rounds, coaching and mentoring, and professional learning communities (PLCs).
Transition Endorsement
Indicators 1, 2, 13, 14 – FFY2011-2012
With the passage of Chapter 51 of the Acts of 2012, An Act to Promote the Successful Transition of Students with Disabilities to Post-Secondary Education, Employment and Independent Living in March 2012, a specialist teacher endorsement in transition services has been created to facilitate provision of a coordinated set of activities to adequately prepare students with disabilities to achieve successful transition to post-school activities. The Massachusetts Board of Elementary and Secondary Education adopted new regulations regarding this endorsement in Fall 2012. See 603 CMR 7.14. As a follow-up to this state legislation, MASSDE developed the new Guidelines for the Transition Specialist Endorsement to inform the development of university educator preparation programs.
Massachusetts Part B Annual Performance Report for FFY2012 108Submitted February 3, 2014
MASSDE collaborated with CAST to offer, in the 20120-2013 school year, year-long professional development and technical assistance to 15 high-needs districts, chosen through a competitive RFP process, through The Universal Design for Learning (UDL) Academy. The Academy supported the chosen districts' efforts to plan for and implement UDL as part of a tiered system of support. The goal of Academy was to establish a team of school and district leaders to ensure that their schools’ learning environments addressed the variability of all learners, including students with disabilities, English language learners, and students who have already demonstrated mastery of the concepts and skills being taught. The work of the Academy was designed to move districts who participated in MASSDE sponsored professional development around UDL in the summer of 2012 into the implementation phase.
Over the course of the Academy, leadership teams gained the knowledge, skills and resources necessary to apply UDL at the classroom, school, and district levels. Academy activities included a series of one and two-day workshops that 1) deepened teams’ understanding of the UDL framework, 2) facilitated the application of UDL principles to lesson plans and resource maps, and 3) supported the development of action plans for teams to bring UDL back to the staff in their schools and districts. Additional information about the FFY2012 UDL Academy is available at http://www.doe.mass.edu/grants/grants13/rfp/324.html. MASSDE plans to offer a another UDL Academy in the spring of 2014 that will have a similar structure and range of content but incorporate two additional elements: the training of school-based UDL coaches and job-embedded technical assistance for participating educators.
Universal Design for Learning Summer Training Series
In the summer of 2012, in collaboration with CAST, MASSDE offered two 2-day institutes for teams of Massachusetts educators entitled, Universal Design for Learning (UDL): Addressing the Variability of All Learners. Thirty-five district teams were chosen through a competitive process to attend one of the summer institutes. During these institutes, educator teams tackled challenging questions, including: how to minimize learning barriers and maximize learning opportunities for all students, how to design lessons and curriculum units to address the wide range of learners in today’s classrooms, and what steps needed to be taken to integrate UDL into their schools and districts.
As part of the UDL Summer Training Series, MASSDE also sponsored a team of 40 Massachusetts educators and ESE personnel to attend the Harvard Graduate School of Education’s professional development institute, Universal Design for Learning: Reaching All Learners. This week-long training provided participants with a deep understanding of the UDL approach, which “considers the needs of the greatest number and range of possible learners and offers educational methods and materials that eliminate costly, cumbersome and after-the-fact adaptations.” The institute also fostered collaboration between experts in teaching, educational administration, policymaking, and technology, and provided “a blueprint for creating flexible goals, methods, materials and assessments that enable all students to succeed in the classroom.”
Massachusetts Part B Annual Performance Report for FFY2012 109Submitted February 3, 2014
In completing the worksheet, the number recorded in column (b) cannot exceed the number recordedin column (a). If the number in column (b) exceeds column (a) the column (b) cell will turn red.
This worksheet calculates the percent of noncompliance corrected within one year of identification. The self-calculating cells are highlighted in gray. Be careful not to enter data into these cells becausethe calculations will not work properly.
Indicator/Indicator ClustersGeneral Supervision System Components
# of LEAs Issued Findings in FFY 2011 (7/1/11 to 6/30/12)
(a) # of Findings of noncompliance identified in FFY 2011 (7/1/11 to 6/30/12)
(b) # of Findings of noncompliance from (a) for which correction was verified no later than one year from identification
1. Percent of youth with IEPs graduating from high school with a regular diploma.
Monitoring Activities: Self-Assessment/ Local APR, Data Review, Desk Audit, On-Site Visits, or Other
2. Percent of youth with IEPs dropping out of high school.
14. Percent of youth who had IEPs, are no longer in secondary school and who have been competitively employed, enrolled in some type of postsecondary school or training program, or both, within one year of leaving high school.
Dispute Resolution: Complaints, Hearings
3. Participation and performance of children with disabilities on statewide assessments.
Monitoring Activities: Self-Assessment/ Local APR, Data Review, Desk Audit, On-Site Visits, or Other
6 6 6
7. Percent of preschool children with IEPs who demonstrated improved outcomes.
Massachusetts Part B Annual Performance Report for FFY2012 110Submitted February 3, 2014
Massachusetts
Dispute Resolution: Complaints, Hearings
4A. Percent of districts identified as having a significant discrepancy in the rates of suspensions and expulsions of children with disabilities for greater than 10 days in a school year.
Monitoring Activities: Self-Assessment/ Local APR, Data Review, Desk Audit, On-Site Visits, or Other
4B. Percent of districts that have: (a) a significant discrepancy, by race or ethnicity, in the rate of suspensions and expulsions of greater than 10 days in a school year for children with IEPs; and (b) policies, procedures or practices that contribute to the significant discrepancy and do not comply with requirements relating to the development and implementation of IEPs, the use of positive behavioral interventions and supports, and procedural safeguards.
Dispute Resolution: Complaints, Hearings
1 1 0
5. Percent of children with IEPs aged 6 through 21 -educational placements.
Monitoring Activities: Self-Assessment/ Local APR, Data Review, Desk Audit, On-Site Visits, or Other
38 46 466. Percent of preschool children aged 3 through 5 – early childhood placement.
Dispute Resolution: Complaints, Hearings
Massachusetts Part B Annual Performance Report for FFY2012 111Submitted February 3, 2014
Massachusetts
8. Percent of parents with a child receiving special education services who report that schools facilitated parent involvement as a means of improving services and results for children with disabilities.
Monitoring Activities: Self-Assessment/ Local APR, Data Review, Desk Audit, On-Site Visits, or Other
Dispute Resolution: Complaints, Hearings
9. Percent of districts with disproportionate representation of racial and ethnic groups in special education that is the result of inappropriate identification.
Monitoring Activities: Self-Assessment/ Local APR, Data Review, Desk Audit, On-Site Visits, or Other
10. Percent of districts with disproportionate representation of racial and ethnic groups in specific disability categories that is the result of inappropriate identification.
Dispute Resolution: Complaints, Hearings
11. Percent of children who were evaluated within 60 days of receiving parental consent for initial evaluation or, if the State establishes a timeframe within which the evaluation must be conducted, within that timeframe.
Monitoring Activities: Self-Assessment/ Local APR, Data Review, Desk Audit, On-Site Visits, or Other
26 26 24
Dispute Resolution: Complaints, Hearings 8 10 10
Massachusetts Part B Annual Performance Report for FFY2012 112Submitted February 3, 2014
Massachusetts
12. Percent of children referred by Part C prior to age 3, who are found eligible for Part B, and who have an IEP developed and implemented by their third birthdays.
Monitoring Activities: Self-Assessment/ Local APR, Data Review, Desk Audit, On-Site Visits, or Other
6 6 5
Dispute Resolution: Complaints, Hearings
13. Percent of youth aged 16 and above with IEP that includes appropriate measurable postsecondary goals that are annually updated and based upon an age appropriate transition assessment, transition services, including courses of study, that will reasonably enable the student to meet those postsecondary goals, and annual IEP goals related to the student’s transition service needs.
Monitoring Activities: Self-Assessment/ Local APR, Data Review, Desk Audit, On-Site Visits, or Other
11 11 11
Dispute Resolution: Complaints, Hearings 1 1 1
Other areas of noncompliance: Faculty, staff and administration
Monitoring Activities: Self-Assessment/ Local APR, Data Review, Desk Audit, On-Site Visits, or Other
10 10 8
Dispute Resolution: Complaints, Hearings 1 1 1
Massachusetts Part B Annual Performance Report for FFY2012 113Submitted February 3, 2014
Massachusetts
Other areas of noncompliance: Discipline
Monitoring Activities: Self-Assessment/ Local APR, Data Review, Desk Audit, On-Site Visits, or Other
24 36 36
Dispute Resolution: Complaints, Hearings
Other areas of noncompliance: IEP implementation (partial or non-implementation) and evaluation; appropriateness of the IEP or of the placement (BSEA)
93 214 214
Dispute Resolution: Complaints, Hearings
99 116 116
Other areas of noncompliance: Parent/guardian communications
Monitoring Activities: Self-Assessment/ Local APR, Data Review, Desk Audit, On-Site Visits, or Other
95 231 231
Dispute Resolution: Complaints, Hearings
Sum the numbers down Column a and Column b 715 709
Percent of noncompliance corrected within one year of identification =
(b) / (a) X 100 = 99.16%
(column (b) sum divided by column (a) sum) times 100.
Appendix C: IDEA Part B - Dispute ResolutionSchool Year: 2012-13
Massachusetts Part B Annual Performance Report for FFY2012 114Submitted February 3, 2014
Massachusetts
Section A: Written, Signed Complaints
1. Total number of written signed complaints filed. 2581.1 Complaints with reports issued. 1821.1.a Reports with findings of noncompliance. 1511.1.b Reports within timelines. 1801.1.c Reports within extended timelines. 21.2 Complaints pending. 111.2.a Complaints pending a due process hearing. 111.3 Complaints withdrawn or dismissed. 65
Section B: Mediation Requests
2. Total number of mediation requests received through all dispute resolution processes. 1138
2.1 Mediations held. 6922.1.a Mediations held related to due process complaints. 252.1.a.i Mediation agreements related to due process complaints. 222.1.b Mediations held not related to due process complaints. 667
2.1.b.i Mediation agreements not related to due process complaints. 575
2.2 Mediations pending. 1652.3 Mediations withdrawn or not held. 281
Massachusetts Part B Annual Performance Report for FFY2012 115Submitted February 3, 2014
Massachusetts
Section C: Due Process Complaints
3. Total number of due process complaints filed. 5523.1 Resolution meetings. 23
3.1.a Written settlement agreements reached through resolution meetings. 11
3.2 Hearings fully adjudicated. 183.2.a Decisions within timeline (include expedited). 13.2.b Decisions within extended timeline. 163.3 Due process complaints pending. 218
3.4 Due process complaints withdrawn or dismissed (including resolved without a hearing). 316
Section D: Expedited Due Process Complaints (Related to Disciplinary Decision)
4. Total number of expedited due process complaints filed. 8
4.1 Expedited resolution meetings. 04.1.a Expedited written settlement agreements. 04.2 Expedited hearings fully adjudicated. 04.2.a Change of placement ordered. 04.3 Expedited due process complaints pending. 2
4.4 Expedited due process complaints withdrawn or dismissed. 6
This report shows the most recent data that was entered by Massachusetts. These data were generated on 10/21/2013.
EDFacts OMB Number: 1875 - 0240
EDFacts Form Expires: 02/29/2016
Massachusetts Part B Annual Performance Report for FFY2012 116Submitted February 3, 2014