Page 1
1
UNIVERSITY OF WITWATERSRAND
FACULTY OF ENGINEERING AND THE BUILT ENVIRONMENT
MASTER OF SCIENCE IN ENGINEERING
By Advanced Coursework and a Project
EVALUATION OF TWO DIFFERENT MECHANIZED EARTH MOVING
TECHNOLOGIES- TRUCK AND SHOVEL AND IPCC FOR HANDLING MATERIAL
FROM A LARGE OPEN PIT MINE USING REQUESITE DESIGN AND
OPERATIONAL CONDITIONS, EFFICIENCY, COST, SKILLS AND SAFETY AS
CRITERIA USING SISHEN IRON ORE MINE AS A CASE STUDY.
Submitted in partial fulfilment of the requirements of MSc. Engineering
(Mining)
November 2015
NAME OF STUDENT: NELSON BANDA
STUDENT NUMBER: 392438
SUPERVISOR: PROF Z. BOROWITSH
Page 2
2
DECLARATION: “I declare that I am familiar with the school of Mining
Engineering’s policy on plagiarism, that the work contained in this project is my own
unaided work, that it is written in my own words, and that all sources of material
contained within this report have been suitably acknowledged.”
Signed : __________________________________ Date: 13 November 2015
Page 3
3
Acknowledgements
I would like to acknowledge Prof Zvi Borowitsh, my supervisor for his guidance, Mr
Phil Morriss for his insights during the IPCC workshop at Anglo American and fellow
employees at Kumba Iron Ore and Sishen mine in particular for their various
contributions to the topic discussion.
Page 4
4
Contents List of Tables ....................................................................................................................................... 5
List of Figures ...................................................................................................................................... 6
Appendices .......................................................................................................................................... 7
Chapter 1: Abstract ................................................................................................................................. 8
1.1 General .......................................................................................................................................... 8
1.2 Sishen Case Study ...................................................................................................................... 10
1.3 General Approach ....................................................................................................................... 12
Chapter 2: Literature Review ................................................................................................................ 13
Chapter 3: Systems Design .................................................................................................................. 17
3.1 Truck and Shovel System............................................................................................................ 17
Truck & Shovel System Description .............................................................................................. 17
Shovel Selection ............................................................................................................................ 18
Electric Rope Shovels .................................................................................................................... 18
Hydraulic Shovels or Excavators – (Diesel or Electric) ................................................................. 19
Front End Loaders (Diesel) ............................................................................................................ 19
Truck Matching .............................................................................................................................. 19
Maximum Shovel Productivity Calculation ..................................................................................... 19
Shovel Fleet Determination ........................................................................................................... 20
Truck Selection and Fleet Sizing ................................................................................................... 22
Sishen Fleet ................................................................................................................................... 27
Trolley Assist System ..................................................................................................................... 30
Planned Performance .................................................................................................................... 30
Fleet Management System ............................................................................................................ 30
Mining Support Equipment ............................................................................................................ 30
Operational and Maintenance Personnel ...................................................................................... 31
Owning and Operating Cost .......................................................................................................... 31
3.2 In-pit Crushing and Conveying .................................................................................................... 34
Fully Mobile IPCC System ............................................................................................................. 34
Semi Mobile IPCC System ............................................................................................................ 36
Sishen Proposed IPCC System ..................................................................................................... 37
Chapter 4: Analysis and Benchmarking ................................................................................................ 52
4.1 Truck and Shovel System............................................................................................................ 52
Safety and Health .......................................................................................................................... 57
Costs .............................................................................................................................................. 58
Flexibility ........................................................................................................................................ 59
4.2 In-pit Crushing and Conveying .................................................................................................... 60
Planning and Design ...................................................................................................................... 60
Skills ............................................................................................................................................... 60
Page 5
5
Efficiency ........................................................................................................................................ 61
Safety ............................................................................................................................................. 62
Costs .............................................................................................................................................. 63
Flexibility ........................................................................................................................................ 63
Chapter 5: Score Card .......................................................................................................................... 64
Cost ................................................................................................................................................ 64
Pit Layout ....................................................................................................................................... 65
Material Types ............................................................................................................................... 65
Occupational Health and Safety .................................................................................................... 66
Chapter 6: Conclusion and Recommendation ...................................................................................... 66
References ............................................................................................................................................ 70
Appendix ............................................................................................................................................... 72
List of Tables
Table 1: Sishen Truck Probability Factor and Potential Productivity……………………………………24
Table 2: Probability of Truck Breakdown at Same Time………………………………………………….26
Table 3: Sishen Truck and Shovel Talpac Simulation Run………………………………………………28
Table 4: Sishen Study Area Haul Road Profile………………………………………………………….....28
Table 5: Sishen Talpac Truck Optimisation………………………………………………………………..29
Table 6: Sishen Study Area Simulated Annual Production Potential …….…………………………….29
Table 7: Sishen Study Area Truck and Shovel Fleet……………………………………………..……….30
Table 8: Truck and Shovel Option Manning Level……………….………………………………………..31
Table 9: Truck and Shovel Capital Cost……………….……………………………………………………32
Table 10: Truck Annual Capital Cost…………………………………………………………………….….32
Table 11: Loading and Support Equipment Owning Cost………………………..………………………33
Table 12: Truck and Shovel Operating Cost ….………….………………………………………………..33
Table 13: Truck and Shovel Labour Cost ..……………………..………………………………….………33
Table 14: Proposed Sishen FMIPCC Equipment List…..……………………………………………….. 37
Table 15: Proposed Sishen FMIPCC Loading Fleet…………………………………………………….. 37
Table 16: Proposed Sishen SMIPCC Equipment List ..…………………………………………………..38
Table 17: SMIPCC Loading Fleet…………………………………………………………………………..39
Table 18: Proposed Sishen Ancillary Equipment List…………………………………………………... 39
Table 19: FMIPCC Manning Level……………………………………………………………………….. 40
Page 6
6
Table 20: SMIPCC Manning Level………………………………………………………………………..40
Table 21: FMIPCC Time Usage Model…………………………………………………………………..42
Table 22: FMIPCC Owning Cost..………………………………………………………………………..43
Table 23: FMIPCC Loading Fleet Owning Cost…………………….…………………………………..43
Table 24: FMIPCC Electrical Power Cost..……………………………………………………….……..43
Table 25: FMIPCC Ancillary Equipment Fuel Cost..…………………………………………….……..44
Table 26: FMIPCC System Maintenance Cost..………………………………………………………..44
Table 27: FMIPCC Ancillary Equipment Maintenance Cost…………………………………………..44
Table 28: FMIPCC Loading System Operating Cost…………………………………………………..45
Table 29: FMIPCC System Labour Cost………………………………………………………….…….46
Table 30: FMIPCC Loading System Labour Cost….…………………………………………………..46
Table 31: SMIPCC Time Usage Model…………………………………………………………………..48
Table 32: SMIPCC Owning Cost..………………………………………………………………………..49
Table 33: SMIPCC Loading Fleet Owning Cost…………………….…………………………………..49
Table 34: SMIPCC Electrical Power Cost..…………………………………….………………….……..49
Table 35: SMIPCC Ancillary Equipment Fuel Cost..………………………….………………….……..50
Table 36: SMIPCC System Maintenance Cost..………………………….……………………………..50
Table 37: SMIPCC Ancillary Equipment Maintenance Cost………………………….………………..50
Table 38: SMIPCC Loading and Hauling System Operating Cost……………………………………..51
Table 39: SMIPCC System Labour Cost………………………………………………………………….51
Table 40: SMIPCC Loading and Hauling System Labour Cost….……………………………………..52
Table 41: 4100XPC Benchmarks, Targets, and Actual Performance..………………….……………..55
Table 42: FMIPCC Typical Capacities…………..…………………………………………………………62
Table 43: SMIPCC Typical Capacities……………………………………………………………………..62
Table 44: Cost Summaries…………………………………………………………………………………..63
Table 45: Evaluation Criteria………………………………………………………………………………..67
Table 46: Cost Comparisons………………………………………………………………………………..68
List of Figures
Figure 1: Sishen Mining Cost Breakdown …………………………………………………………………..9
Figure 2: Sishen pit …………………………….……………………………………………………………..10
Page 7
7
Figure 3: Sishen Semi Mobile crusher movement……..………………………………………….……17
Figure 4: Typical Truck and Shovel Operation…….……………………………………………………18
Figure 5: Anglo American Availability model…………………………………………………………….21
Figure 6: Sishen Shovel Operating Hours…………….…….…………………..………………………21
Figure 7: Probability of truck availability for loading……………………………………….…………...25
Figure 8: FMIPCC system…………………………………………………………………………...…….35
Figure 9: Spreaders……………………………………………………….……………………….………35
Figure 10: SMIPCC system………………………………………………………………...…..…………36
Figure 11: Sishen North pit………………………………………………………………………..………53
Figure 12: Sishen pit cross section………………………………………………….………..………….53
Figure 12: Sishen Truck High Potential Truck Incidents………………………………..…………...…57
Appendices
Appendix 1: Talpac Simulation Results………………………………………………………………… 73
Page 8
8
Chapter 1: Abstract
1.1 General
For mining operations, both underground and open cast, there are generally
accepted criteria used to arrive at the optimum mining method with which to exploit
the ore body economically. Having selected the optimum mining method, mining
companies should then make the decision to also select the optimum technology to
apply given the various options that are now available.
In the case of a shallow massive ore body where open-pit mining has been selected
as the optimum mining method, the use of conventional trucks and shovels has been
the popular choice but over the years, as pit become deeper, and stripping ratios
increase, growing interest and adoption of in-pit crushing and conveying for both ore
and waste has been gaining ground with several mining sites currently now
operating, testing the systems or conducting studies at various stages for In-pit
Crushing and Conveying (IPCC) in its different configurations (Chadwick, 2010).
Open pit mining general involves the movement of pre-blasted or loose waste ahead
of underlying ore out of the pit or to a previously mined part of the pit. This is then
followed by the drilling and blasting or loosening of the ore and transportation to the
processing plant or stockpiles.
The conventional Truck and Shovel open pit operation involves the use of shovels –
electric rope shovels, diesel or electric hydraulic shovels or excavators or front-end
loaders to load the blasted, or loose waste and ore material in the pit onto mining
trucks which haul the material to crushers or stockpiles if it is ore or to waste dumps
in the case of waste.
In a Fully Mobile IPCC (FMIPCC) system, the broken or loose material in the pit is
loaded into a crusher or sizer by a shovel, continuous miner or dozer, crushed to a
manageable size and transported by conveyor belts to the waste dump where it is
deposited in place using spreaders if it is waste or onto stockpiles if it is ore.
A combination of the two systems is where trucks dump material loaded at the face
into a semi mobile crusher or sizer located in the pit close to the loading points
before conveying to destination thereby reducing truck haulage distance. In the
semi-mobile configuration, the crusher is relocated closer to the loading points to
minimise the hauling distance. Other various configurations are also employed
Page 9
9
depending on the various considerations. Although the Truck and Shovel system is
considered as the convention in open pit mining, the IPCC system is not a new
concept and has been operational on a number of mines worldwide for quite a
number of years (Szalanski, 2010). Loading and hauling receive great attention
especially in a high volume open pit mines due to the high cost contribution to the
overall operation and therefore, if optimised, good cost savings can be realised
(Lamb, 2010).
Figure 1: Sishen Mining Cost Breakdown
In the case of Sishen Loading and Hauling costs constituted 67% of the mining costs
including labour mining support services in 2013 (Kumba Iron Ore, 2013). This
picture remains unchanged to a large extent. In some cases the hauling cost alone
can make up as much as 60% of the mining operating cost (Meredith May, 2012)
Selection of a materials handling system between Truck and Shovel (T/S) and In-pit
Crushing and Conveying (IPCC) has proven to be difficult due to limited
understanding of the IPCC system especially its advantages and disadvantages
relative to the Truck and Shovel system. The aim of this research was to unpack
these two systems in terms of their applicability using studies conducted at Sishen
Mine as well as develop some scorecard that could be used to select one over the
other one.
6,5%8,8%
29,1%
22,7%
9,7%0,6%
1,3%
0,4% 7,0%4,2%
3,7% 5,9%
Sishen Mining Cost 2013
Blasting Drilling Hauling
L&H Contractors Loading Maintenance Other
Mining Manangement Mining Engineering Mining Other
Resource Management SHEQ Mining Support
Page 10
1.2 Sishen Case Study
Sishen Mine is an iron ore open pit mine
South Africa and is part of Kumba Iron Ore Company which is majority owned by
Anglo American PLC. The mine
life of mine going up to 203
mine ore at a life of mine strip ratio of 4
the north part of the mine known as the GR80 and GR50 areas. Mining in these
areas will require pre-stripping of
290Mt of clay material over the life of mine
volume phases.
Figure2: Sishen Pit –Sishen Mine 201
Sishen mine is constantly evaluating various technologies in its mining operations
aimed at improving its bottom line by way of increasing productivity and efficiency,
reducing costs and improving safety,
evaluating a technology that significantly could have resulted in a totally different
operational philosophy was i
contracted to institute a study
55 Mt of the calcrete/clay material
GR80/GR50 area of the mine from 2009 till 2030.
Prefeasibility study in early 2008 in which they evaluated
Shovel operation as well as
10
is an iron ore open pit mine located in the Northern Cape province of
South Africa and is part of Kumba Iron Ore Company which is majority owned by
Anglo American PLC. The mine has been in operation since 1953 with the
2030. It produces 44Mt tonnes of product from a 56Mt
ore at a life of mine strip ratio of 4. One of the planned expansion areas is in
the north part of the mine known as the GR80 and GR50 areas. Mining in these
stripping of a minimum of 437Mt of calcrete and the underlying
over the life of mine to expose the ore in pre-
Sishen Mine 2014.
mine is constantly evaluating various technologies in its mining operations
aimed at improving its bottom line by way of increasing productivity and efficiency,
reducing costs and improving safety, however, the last time that the mine considered
g a technology that significantly could have resulted in a totally different
operational philosophy was in 2007 when Snowden Mining Consultants
a study to evaluate technology options for mining and moving
material per year from the waste pushback
mine from 2009 till 2030. Snowden completed the
Prefeasibility study in early 2008 in which they evaluated a conventional Truck and
hovel operation as well as IPCC. Economic viability of both systems
located in the Northern Cape province of
South Africa and is part of Kumba Iron Ore Company which is majority owned by
with the current
It produces 44Mt tonnes of product from a 56Mt run-of-
One of the planned expansion areas is in
the north part of the mine known as the GR80 and GR50 areas. Mining in these
calcrete and the underlying
-planned time and
mine is constantly evaluating various technologies in its mining operations
aimed at improving its bottom line by way of increasing productivity and efficiency,
the last time that the mine considered
g a technology that significantly could have resulted in a totally different
Mining Consultants were
to evaluate technology options for mining and moving
waste pushback area in the
Snowden completed the
conventional Truck and
viability of both systems in various
Page 11
11
configurations was demonstrated with the use of larger trucks and shovels ranked as
the most economic option in terms of Net Present Cost (NPC), unit owning and
operating cost per mined tonne and, to a less extent, in terms of risk and other
considerations. In this case, the Truck and Shovel option was more economic than
both IPCC configurations. However the small difference in the cost figures gave rise
to interest in further evaluations.
Following the Snowden study, Sishen engaged Sandvik Mining and Construction in
2008, to review the work done by Snowden and provide more detail and practical
input to the IPCC system at scoping level. In the review, the IPCC system was
shown to be the economic approach for the waste removal from the target area in
terms of owning and operating cost. Practicality was also demonstrated and the case
for the consideration of the IPCC system was put forward to Sishen.
A further consultant, Sinclair Knight Merz (SKM) of Australia, was engaged, in the
later part of 2008, to further evaluate and optimise the IPCC option to further
demonstrate practically in detail at a feasible study level and strengthen its case by
mitigating perceived risk. This included equipment specifications, mine and
equipment layout per period per bench and risk assessment on the IPCC options.
The mine, however, implemented the conventional truck and shovel option using
larger equipment. The final decision was to stick with the current set up of Truck and
Shovel system and gradually replace the current fleet of 730E Komatsu (190 tonne
payload) trucks with the 930E or equivalent ( 320 tonne payload) and the current
XPB 2300 P& H electric rope shovels and CAT 994/Komatsu WA1200 front end
loaders with XPC 4100 P&H electric rope shovels, Komatsu PC8000/Liebherr 996
diesel hydraulic shovels and LeTournea L-2350 front end loaders to reduce the
number of equipment and manage the operational cost.
This decision was based on issues around initial capital investment, flexibility of the
system to suit changing mining plans, ability of current personnel to run the system
and general low risk appetite for change. The adopted option has its own challenges
such as supporting infrastructure requirements, labour intensity and associated low
productivity and high cost, fleet management challenges to achieve required
productivity constantly, supplies such as fuel and tyres and safety issues due to
traffic density.
Page 12
12
A high level recalculation of the costs using current information was done as part of
this research. For simplicity, no escalations or discounting were applied on future
expenditure. The estimated unit owning and operating costs in 2014 terms for the
study area were as follows:-
Fully Mobile IPCC (FMIPCC) option ZAR 10.38/t,
Semi Mobile IPCC (SMIPCC) option ZAR 13.12/t,
Truck and Shovel option ZAR 15.80/t.
The objective of this research is to use lessons from the Sishen case as well as
other operations and gather expert views with the aim of establishing criteria that
could be applied in a preliminary evaluation that would determine the suitability of
either of the materials handling options.
1.3 General Approach
The costs were recalculated using as much current information as possible. Other
considerations including advantages and disadvantages of either of the systems
were examined in more detail, with real life examples examined where possible. This
resulted in the establishment of generalized criteria for the selection of mining and
transport technology for a large open pit mine with focus on conventional Truck and
Shovel systems on one hand and IPCC systems, in their various formats, on the
other. These criteria which identify conditions necessary for the successful adoption
and implementation of either of the systems could then be used as input into the
decision to carry out any further detailed studies of the options. The previous study
reports on the Sishen mine case were examined, input parameters to the
calculations checked and the general approached analyzed for practicality. The
relative costs were also viewed for comparative purposes.
Literature on these two main systems was reviewed including that from conferences.
Other large operations running either one or both systems were looked at to gain
further insight. Original Equipment suppliers’ views on these systems were also
looked at through many articles in the public domain. Sishen mine has previously
had the IPCC system running in the same part of the mine in a semi mobile
configuration, crushing and conveying waste. It was then changed to become a
supplementary system for the ore handling system and the in pit crusher has never
been relocated. The Truck and Shovel system took over the movement of all the
Page 13
13
waste and most of the ore at the mine. Lessons from these experiences were
incorporated in this study.
Chapter 2: Literature Review
There are a number of papers and presentations that discuss various aspects of the
truck and shovel as well as the in-pit crushing and conveying technical system as it
applies to large open pit mines as well as experiences from across the world.
A presentation at an Anglo American IPCC workshop in 2013 highlighted the
following (Morriss, 2013):-
The Truck and Shovel set up still remains the default or baseline for large
open pit mines that are considering a system to move ore or waste from the
face to the ore crushers or waste dump.
Long truck cycle distances, cycle times, difficult dump locations, increasing pit
depth, remote mine site locations, increasing labour and camp costs, fuel
price volatility compared to electrical energy, safety and environmental
concerns are driving mining companies to look at alternatives to the Truck and
Shovel system and IPCC is one such viable option.
The IPCC system requires a different approach to mine planning, design and
operational philosophy than the conventional Truck and Shovel system.
Material properties, including variability, have a bearing on crusher selection,
throughput, maintenance and cost. This is more critical when the IPCC
system is applied on waste.
The perception of risk, unfamiliarity and the failure of some of the earlier IPCC
systems have led to decision makers requiring more detailed studies on IPCC
systems than the proven truck and shovel system.
The viability of the IPCC system has been demonstrated in a number studies
carried out, ranging from desktop to feasibility level.
There are a number of IPCC systems currently operational in various
configurations around the world.
In the paper by David Tutton and Willibald Streck titled ‘The Application of In-pit
crushing and conveying in large, hard rock open pit mines’ (2009), the
Page 14
14
significance of hauling costs at above 48% of the operating costs in large open pit
mines, is highlighted together with the fact that almost half of this cost is incurred on
the in-pit ramps. The suitability of IPCC in high tonnage deep mines is discussed
including having to deal with other necessary mining activities such as pit wall
control, drilling and blasting and the development of pit accesses. The concept of
phase value was also brought up as one of the disadvantages of the IPCC system.
The conclusion was that it may be worthwhile to consider a hybrid of the truck and
shovel and IPCC systems to address most of the concerns raised.
In another paper titled ‘The use of in-pit crushing and conveying methods to
significantly reduce transportation costs by truck’ by Detlev L. Schroder, Coal
Trans -June 2003, the author elevates the compressive strength of the material to be
moved as the key determinant factor in selecting a mining system and cost efficiency
in the case of a transportation system.
The configuration of the mining faces as well as the presence/absence of geological
structures determines whether to go fully mobile or semi mobile.
Long straight mining faces, few geological structures – fully mobile
Deep and wide in all directions, many geological structures – semi mobile.
In this paper, careful analysis is advised before deciding on a system. A hybrid
option is recommended in some cases rather than an ‘either or’ approach.
Philip Morriss, in his paper ‘Key Production Drivers in In-pit Crushing and
Conveying Studies’ highlights the following challenges when considering IPCC
systems such as:
Mine planning/ scheduling e.g. high vertical rate of advance and pit geometry
that do not support the operation of IPCC systems
Achievable operating hours and instantaneous production rates due to
linkages of the system components in series.
Risk perceptions
A completely different planning approach to that of Truck and Shovel operating is
required when considering IPCC system (Turnbull, 2013). Engaging expertise in the
design if IPCC systems in critical (Armesy, 2010).
Page 15
15
In the article appearing in the International Mining magazine in May 2012 titled ‘The
Road to IPCC’ Paul Moore discusses a number of IPCC systems in various mining
sites around the world including the following:
Hawson iron ore project, Australia, realized a 14% cost improvement with
IPCC compared to truck/shovel option.
Penasquito mine, Mexico, used hybrid truck/shovel and IPCC system to solve
their distant waste dump problem.
Hancock Coal, Australia, use dozers to push down the top 12 metres of a 30
metre bench to enable the shovels to feed sizer for the IPCC system.
Pumpkin Hollow, Nevada copper, switchback design in the mine ramps to
minimize haul road/ conveyor interaction along the pit walls.
He raises the issue of the cyclic nature of the mineral markets with respect to the
length of a payback period, low risk, short term flexibility, early payback truck and
shovel system compared to a longer term, optimised, investment in a low cost IPCC
operation to ride the cycles.
Rio Tinto Coal Australia installed an IPCC system at Clermont mine in 2009 which
enabled mining of areas where the ore is deeper with high stripping ratios. These
areas would have been uneconomic to mine using a conventional truck and shovel
approach (Chadwick, 2010)
The Truck and Shovel option still remains the preferred option. To improve the safety
and efficiency of the system, developments are directed at to simulations and
optimisation, dispatch systems and automation. Ercelebi and Bascetin in their paper
titled ‘Optimisation of shovel-truck system for surface mine’ (2009),
demonstrated that efficient truck allocation and dispatching can be achieved using
queuing theory and linear programming in a truck and shovel operation.
Sishen mine instituted studies in 2007 and 2008 to evaluate the potential of applying
In-pit crushing and conveying as an alternative to the conventional truck and shovel
operation for accelerated movement of overburden from a particular part of the mine
known as the GR80/GR50. The scope of work for this study, conducted by Snowden
reviewed by Sandvik and Sinclair Knight and Merz, included a practical
implementation or operational plan, complete with designs, equipment lists and
budget quotes and supporting infrastructure such as energy, risk assessment and
Page 16
16
mitigation as well as cost. The study confirmed the practical viability of implementing
the IPCC system at Sishen mine but there were conflicting estimates on the cost with
the Truck and Shovel being shown to be more economically more viable than IPCC
in one study and the opposite being indicated in the other report. The costs were
however within 30% percent of each other with the accuracy of the studies being
cited at ±25%.
Some of the sites mentioned in the studies as running IPCC systems in various
configurations and combinations include:
Goonyella Riverside mine- Australia
Suncor Voyager mine- Canada
Yimin mine- China
Escondida mine- Chile
Clermont mine- Australia
Sishen mine uses a computerised truck dispatch system provided by Modular
Mining systems to allocate and dispatch its huge fleet of trucks quite efficiently. The
dispatch system is also critical in ensuring that the required blend, from multiple ore
loading faces, is achieved. The truck and shovel system also makes short term
planning much easier due to its flexibility and adaptability to changes in economic
and operating conditions. Furthermore some of the longer ramps are equipped with
trolley lines upon which the diesel-electric trucks can engage on the upward haul
when loaded thereby utilising electric power. Higher speeds can be achieved thus
improving truck productivity with low diesel consumption. This trolley system is being
considered in the area under study and as one option that could strengthen the case
for a Truck and Shovel system.
Sishen mine once operated a Semi mobile In-pit Crushing and Conveying system to
handle waste from the same area. This was later converted to an ore handling
system with the crusher fixed in one position in the pit. Reasons quoted from Sishen
personnel are that it was converted once it was felt that there was sufficient ore
exposed and additional waste stripping could be handled adequately by trucks and
shovels. Others say dump relocations was a problem as they could not locate one
dump large enough to prevent frequent relocations of the spreaders and associated
conveyors. Whatever the case, it would appear that the system was not operated
Page 17
17
efficiently enough and questions were raised on the economics of crushing waste.
The gyratory crusher was never relocated from its original installed position.
Figure 3: Sishen Semi mobile crusher being moved to a position (Morriss, 2013)
From the papers above, the workshop, as well as discussions with various
knowledgeable colleagues, it can be concluded that the decision to select between a
conventional truck and shovel and in-pit crushing and conveying for moving material
from inside an open pit, is not an easy one. In some cases, a hybrid of the two
systems may be the answer. General criteria to evaluate the potential of each of the
system as the optimum solution for a given project would go a long way in assisting
on whether to take the studies from a preliminary assessment stage to conceptual or
pre-feasibility level. This is the objective of this research project.
Chapter 3: Systems Design
3.1 Truck and Shovel System
The truck and shovel system is whereby shovels loaders or excavators are used to
load broken or loose ore or waste from a bench in the pit onto trucks which then
transport the material out of the pit to the crusher or stockpile if it is ore or to the
waste dump in the case of waste or overburden.
Truck & Shovel System Description
The system design process follows the pit optimisation, pit design and scheduling
processes (mine planning) which define the material to be mined, the layout of the pit
Page 18
18
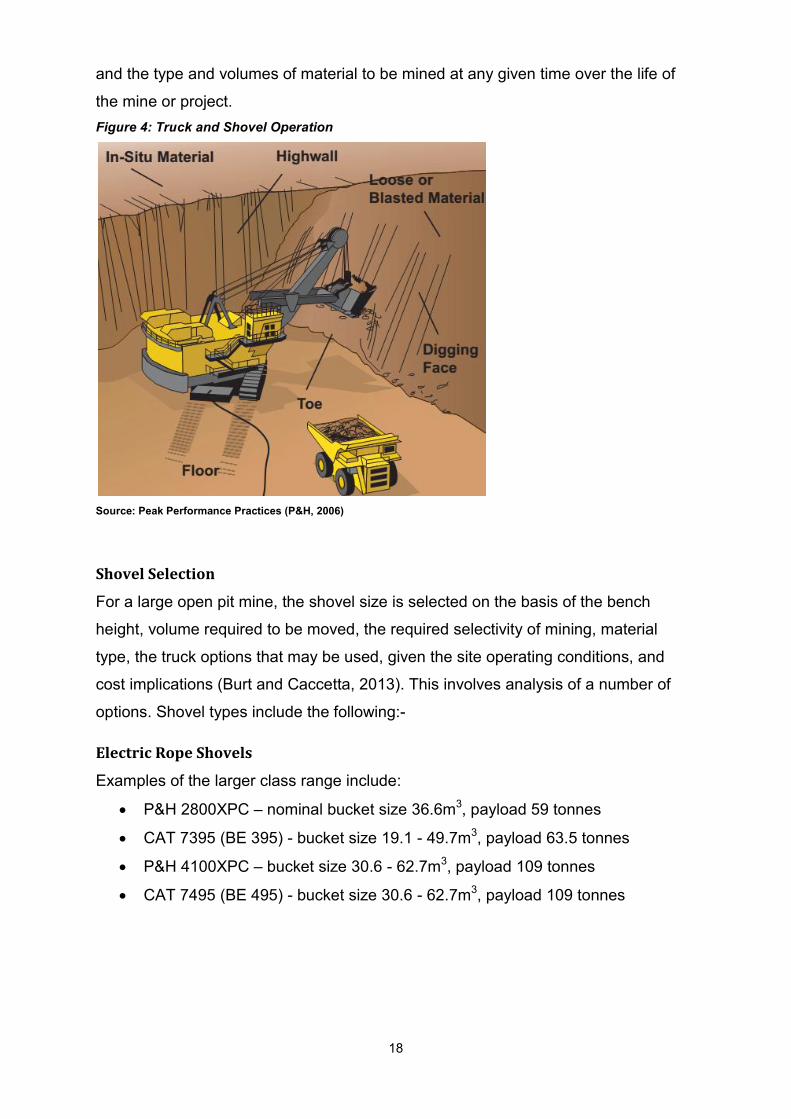
and the type and volumes of material to be mined at any given time over the life of
the mine or project.
Figure 4: Truck and Shovel Operation
Source: Peak Performance Practices (P&H, 2006)
Shovel Selection
For a large open pit mine, the shovel size is selected on the basis of the bench
height, volume required to be moved, the required selectivity of mining, material
type, the truck options that may be used, given the site operating conditions, and
cost implications (Burt and Caccetta, 2013). This involves analysis of a number of
options. Shovel types include the following:-
Electric Rope Shovels
Examples of the larger class range include:
P&H 2800XPC – nominal bucket size 36.6m3, payload 59 tonnes
CAT 7395 (BE 395) - bucket size 19.1 - 49.7m3, payload 63.5 tonnes
P&H 4100XPC – bucket size 30.6 - 62.7m3, payload 109 tonnes
CAT 7495 (BE 495) - bucket size 30.6 - 62.7m3, payload 109 tonnes
Page 19
19
Hydraulic Shovels or Excavators – (Diesel or Electric)
Examples of the large Hydraulic shovels with backhoe or face shovel configurations
are:-
Liebherr R996 - bucket size 29 - 34m3 –payload 61 tonnes
Terex RH 340 - nominal bucket size 34m3 –payload 61 tonnes
Liebherr R9800 - nominal bucket size 42m3 –payload 76 tonnes
Komatsu PC8000 - bucket size 45m3 –payload 80 tonnes
Terex RH 400 – nominal bucket size 47.2m3 –payload 85 tonnes
CAT 6090 - bucket size 37 - 52m3 –payload 90 tonnes
Front End Loaders (Diesel)
Examples of the larger machines include:-
Komatsu WA1200 – payload 36 tonnes
CAT 994 – payload 34.5 tonne
LeTourneau L-2350 – payload 72 tonnes
Truck Matching
Having settled on the shovel, a suitably sized truck must then be selected to match
the shovel. As a rule of thumb, the truck size has to be such that it can be fully
loaded with 3-4 passes by the shovel factoring in the bucket fill factor.
Maximum Shovel Productivity Calculation
The maximum production rate of the shovel depends on the following loading factors
Truck spotting time –Ts (minutes)
Time for first pass – Tp1
Time for each of subsequent passes - Tave
Number of loading passes- Np
Bucket volume –-Bv (m3)
Bucket fill factor -Bf (%)
Material density – Dm (t/m3)
Average effective working time per hour – Te (minutes/hour)
The bucket is sized taking the material density into consideration such that the rated
payload of the shovel is not exceeded.
Page 20
20
Using typical numbers from Sishen mine
Shovel type - P&H 4100 XPC – installed bucket size: 45m3
Truck type - Komatsu 960E – Rated payload (Pl): 327 tonnes
Ts = 1 minute
Tp1 = 1 minute
Tave = 0.7 minute
Np = 3
Bv = 45 m3
Bf = 88 %
Dm = 2.62 t/m3
Te = 50 mins/hour
Total Loading Time per Truck (Tl) = Ts + Tp1 + Tave (Np -1)
= 1 +1+ 0.7(3-1)
= 3.4minutes
Potential Number of Truck Loads per Hour (Nl) = Te / Tl
= 55/3.4
= 16.2
Truck Payload (Pl) = Bv x Bf x Dm x Np
= 45m3 x 88% x 2.62 t/m3 x 3
= 311 tonnes
Potential Shovel Productivity (Pts) = Nl x Pl
= 16.2 x 311 tonnes
= 5 030 tonnes per hour
Shovel Fleet Determination
The size of the shovel fleet can be determined by considering the tonnes scheduled
for that type of shovel, the spatial distribution of those tonnes per given period and
the achievable direct operating times of the shovels per period under consideration.
The tonnage information is provided by the mining schedule and the direct operating
hours can be calculated using the mine’s time usage model. Other factors such as
Page 21
21
operator skill can also be applied. A typical time usage model, as applied by Anglo
American, is shown below:
Figure 5: Anglo American Availability Model
The potential production for each shovel is calculated by multiplying the potential
productivity by the direct operating time for the period. The baseline number of
shovels required can then be calculated by dividing the scheduled tonnes for the
period by the potential production per shovel. Spatial distribution and blending
requirements are also considered so as to minimize shovel moves.
Figure 6: Shovel Operating Hours- Sishen Mine
8760 80626862
5439 5339
360 338 240720
240 120 1001203
100
3000
4000
5000
6000
7000
8000
9000
10000
Ho
urs
Page 22
22
From the Sishen time usage model shown above the direct operating hours (DOH)
for the shovel are 5339 hours per annum. The potential maximum shovel production
per annum, Ps, is given by:-
Ps = Pts x DOH
= 5 030 tph x 5 339 hrs
= 26.9 Mt per annum
Truck Selection and Fleet Sizing
The selection of the truck size is based on the requirement to limit the number of
shovel passes to fill the truck to three or four so at to minimise the loading time while
loading the truck to as close to its rated payload as possible. The other consideration
is that the TKPH rating of the truck tyres should not be exceeded. The operational
conditions may be such that for certain size of trucks, the tyres that would meet the
TKPH rating are not available in the market. The truck type should also be able to
provide enough rim pull at acceptable speeds given the grade and rolling resistances
encountered at the operation.
The size of the truck fleet can then be determined by considering each shovel
location and defining the profile of the route from the shovel to the dump location
either at the crusher or ore stockpile or to the waste dump. Each segment of the
route is defined in terms of its length, grade and rolling resistance as these will
determine that time it will take for a truck to traverse the segment based on
achievable speeds. The popular simulation packages take gear changes into
consideration to model the truck speeds on flat and inclined segments of the route.
The total time taken by a truck to travel from and back to the shovel loading point is
then determined and this becomes the total cycle time (Tt) if combined with the
loading and dumping times. Number of loads (Nt) that a truck can potentially make
per hour can be calculated dividing the average working time per hour (Te) by the
total truck cycle time
i.e. Nt = Te / Tt
Typical Sishen numbers in the area of study are:-
Te = 55 minutes
Tt = 44 minutes
Page 23
23
Nt = 55/44 = 1.25 Loads
Truck payload (Komatsu 960E) Pl = 311 tonnes
Productivity per truck Ptt = Nt x Pl = 1.25 x 311 tonnes
= 389 tph
Again applying the time usage model will indicate the potential direct operating hours
for the truck. If these operating hours for the truck are greater than those calculated
for the shovel then the shovel hours are then applied, if less, then the truck direct
operating hours will be applied. The truck production (Pa) for the period is then
determined by multiplying the truck productivity (Pt) by the direct operating hours
(DOH).
In the case of Sishen the truck shovel system direct operating hours are budgeted at
5 339 hours per annum.
Pa = Ptt x DOH
= 389 tph x 5 339 hrs
= 2.08 Mt per annum (for each truck)
To determine the number of trucks (Ntt) required per shovel, the tonnes scheduled
for the shovel (Vbt) in the period are divided by the potential tonnes that a truck can
achieve in that system.
In the case of Sishen, the budgeted tonnes (Vbt) for the P&H 4100 XPC are 26
million tonnes per annum in the overburden. The calculated number of trucks
required to achieve the production would be the following:
Ntt = Vbt / Pa
= 26.9 Mtpa / 2.08 Mtpa
= 12.9 trucks
The truck and shovel system productivity (Pst) can thus be estimated by multiplying
the number of trucks (Ntt) by the truck productivity (Ptt)
Pst = Ntt x Ptt
= 12.9 trucks x 389 tph per truck
= 5 057 tph
Page 24
24
This is used as a guide; the actual production that can be achieved by the system
can be modelled taking into consideration queuing theory principles. Since the trucks
move independently in the cycle, their arrival at the shovel and at the dumping area
depicts some random behaviour and the probability that a truck will always be
present at the shovel to be loaded approximates a Poisson distribution. This is the
approach taken by the more popular simulation packages currently in the market
such as Talpac and FPC.
Probability Model Example
Given the following:-
Loading & Truck transfer Time = L&T
Haul, Dump and Return Time = HDR
Then Cycle Ratio R = L&T /HDR
Taking the Sishen case for one loading point and applying probability distribution
tables
L&T = 3.4 minutes
HDR = 40.6 minutes
R = 3.4 /40.6 = 0.08 ~0.1
From the probability tables for R = 0.1, the probability factors are given in the table
below for the given number of trucks in the system and multiplied by the potential
system productivity to obtain the possible productivity. The potential system
productivity for the Sishen case is 5 057 tph.
Table 1: Truck probability factors and potential productivity
Number of Trucks Probability Factor Productivity (tph)
4 0.353 1 785
6 0.515 2 604
8 0.662 3 348
10 0.785 3 970
12 0.880 4 450
13 0.915 4 627
14 0.930 4 703
Page 25
25
As can be seen from the table, the system struggles to achieve productivity close to
the required rate. This is due to the long haul, dump and return time relative to the
loading and truck spotting time.
The probability distribution for this scenario is shown in the graph below.
Figure 7: Probability that trucks will be available at the shovel for loading
To determine what the system can deliver in a given period, the time usage model is
applied to derive the direct operating hours of the system. The direct operating hours
of the truck fleet linked to a shovel cannot exceed that of the shovel. It is highly
unlikely that the unplanned downtimes on the shovel and the trucks will coincide.
The number of trucks in the system will fluctuate due to the unplanned truck
downtimes. During periods of low truck availability, the system will deliver less
production than the potential capacity. It is therefore necessary to set the target
which is less than what the system can deliver on average so that, at other times, it
is delivering more than the target to compensate for the times when it would be
under performing. The level of unplanned down times can be used to set the catch-
0,000
0,100
0,200
0,300
0,400
0,500
0,600
0,700
0,800
0,900
1,000
0 2 4 6 8 10 12 14
Pro
bab
ility
Number of Trucks
Probability Plot Linear (Probability Plot)
Page 26
26
up capacity, factoring in the diminishing returns of adding more trucks, or de-rate the
system production.
Taking the Sishen example:-
Direct operating hours for both the shovel and trucks = 5 335 hours per annum.
System Productivity Potential = 5 057 tph
System Production Potential = 26.8 Mtpa
Number of trucks in the system = 12.9 ~13
Assuming the unplanned truck breakdowns to be random and that this constitutes
4% of the scheduled hours, the probability that a truck will experience an unplanned
breakdown at any given moment can be modelled using a binomial distribution.
Binomial Probability Distribution Function = X ~ B(n,p)
Probability for k successes = P(X=k) = n! pk (1-p)n-k
k!(n-k)!
Table below shows the probability values various n and k value where k is the
number of trucks on unplanned maintenance, n is the total number of trucks in the
system and 0.04 (4%) is the probability of success where “success” in this case is
having a truck on unplanned downtime.
Table 2: Probability that the given number of trucks will be on breakdown at the same time
As can be seen, the probability that there will be one or more trucks on unplanned
breakdown increases with the number of trucks in the system. For the Sishen system
with 13 trucks, the table value indicate that during 32% of the time they will be one
n
1 2 3 4 5 6 7 8 9 10 11 12 13
5 17% 1% 0% 0% 0% - - - - - - - -
6 20% 2% 0% 0% 0% 0% - - - - - - -
7 22% 3% 0% 0% 0% 0% 0% - - - - - -
8 24% 4% 0% 0% 0% 0% 0% 0% - - - - -
9 26% 4% 0% 0% 0% 0% 0% 0% 0% - - - -
10 28% 5% 1% 0% 0% 0% 0% 0% 0% 0% - - -
11 29% 6% 1% 0% 0% 0% 0% 0% 0% 0% 0% - -
12 31% 7% 1% 0% 0% 0% 0% 0% 0% 0% 0% 0% -
13 32% 8% 1% 0% 0% 0% 0% 0% 0% 0% 0% 0% 0%
14 33% 9% 1% 0% 0% 0% 0% 0% 0% 0% 0% 0% 0%
15 34% 10% 2% 0% 0% 0% 0% 0% 0% 0% 0% 0% 0%
16 35% 11% 2% 0% 0% 0% 0% 0% 0% 0% 0% 0% 0%
17 35% 12% 2% 0% 0% 0% 0% 0% 0% 0% 0% 0% 0%
18 36% 13% 3% 0% 0% 0% 0% 0% 0% 0% 0% 0% 0%
19 36% 14% 3% 1% 0% 0% 0% 0% 0% 0% 0% 0% 0%
20 37% 15% 4% 1% 0% 0% 0% 0% 0% 0% 0% 0% 0%
k
Page 27
27
truck on unplanned downtime, two trucks down 8% of the time and three trucks down
1% of the time over and above the planned maintenance. The time usage model can
therefore be adjusted accordingly.
Haulage Simulation
Sishen Fleet
The proposed fleet for the area of study at Sishen consists of the following:-
Electric Rope Shovel for the calcrete
P&H 4100XPC
Hydraulic Shovel for the clay
Komatsu PC 8000
Truck Fleet
Komatsu 960E
A simulation was run for the target area, material and designed haulage profiles for
the GR80 area of Sishen mine for the years 2014 till 2027 using Talpac software.
The mine profile does not change much from 2014 to 2016 and from 2027 to 2030.
The results for 2016 are shown in table 3 to table 5 below. The rest of the results are
contained in Appendix 1
Page 28
28
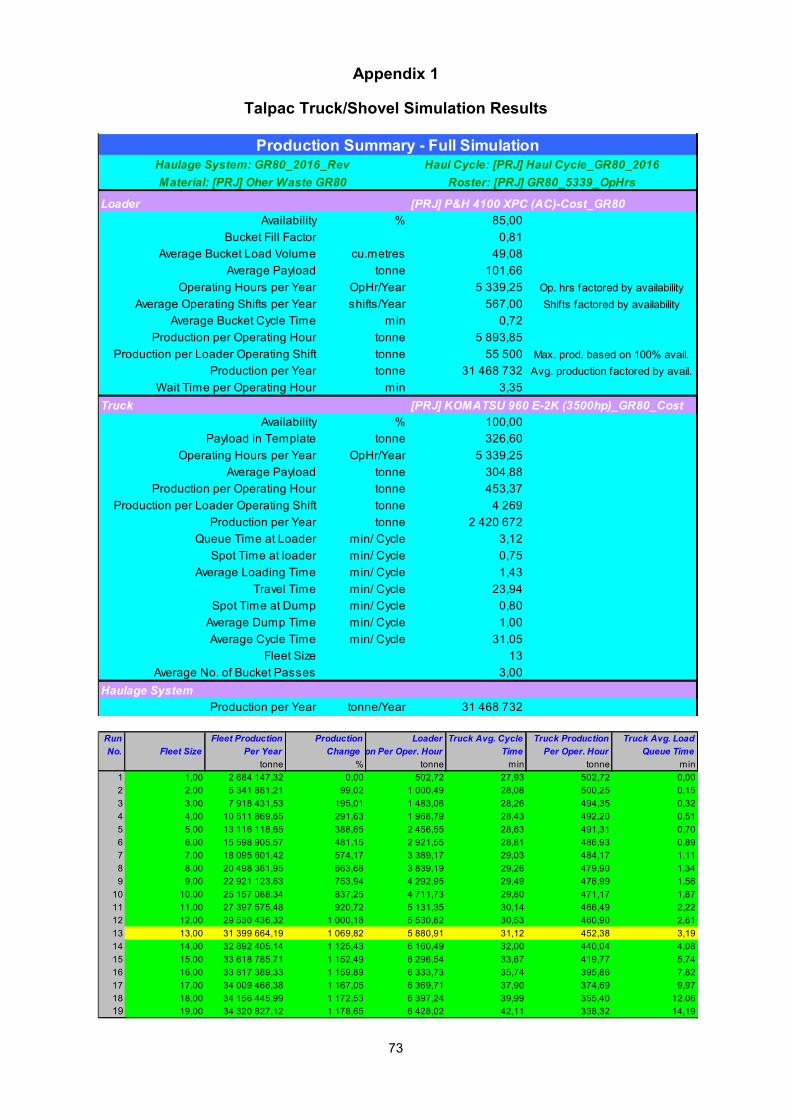
Table 3: Sishen Truck and Shovel Talpac Simulation Run
Table 4: Sishen Haul Road Profile
Production Summary - Full SimulationHaulage System: GR80_2016_Rev Haul Cycle: [PRJ] Haul Cycle_GR80_2016
Material: [PRJ] Oher Waste GR80 Roster: [PRJ] GR80_5339_OpHrs
Loader [PRJ] P&H 4100 XPC (AC)-Cost_GR80
Availability % 85,00
Bucket Fill Factor 0,81
Average Bucket Load Volume cu.metres 49,08
Average Payload tonne 101,66
Operating Hours per Year OpHr/Year 5 339,25 Op. hrs factored by availability
Average Operating Shifts per Year shifts/Year 567,00 Shifts factored by availability
Average Bucket Cycle Time min 0,72
Production per Operating Hour tonne 5 893,85
Production per Loader Operating Shift tonne 55 500 Max. prod. based on 100% avail.
Production per Year tonne 31 468 732 Avg. production factored by avail.
Wait Time per Operating Hour min 3,35
Truck [PRJ] KOMATSU 960 E-2K (3500hp)_GR80_Cost
Availability % 100,00
Payload in Template tonne 326,60
Operating Hours per Year OpHr/Year 5 339,25
Average Payload tonne 304,88
Production per Operating Hour tonne 453,37
Production per Loader Operating Shift tonne 4 269
Production per Year tonne 2 420 672
Queue Time at Loader min/ Cycle 3,12
Spot Time at loader min/ Cycle 0,75
Average Loading Time min/ Cycle 1,43
Travel Time min/ Cycle 23,94
Spot Time at Dump min/ Cycle 0,80
Average Dump Time min/ Cycle 1,00
Average Cycle Time min/ Cycle 31,05
Fleet Size 13
Average No. of Bucket Passes 3,00
Haulage System
Production per Year tonne/Year 31 468 732
Full Simulation ResultsMaterial: [PRJ] Oher Waste GR80 Haulage System: GR80_2016_Rev
Roster: [PRJ] GR80_5339_OpHrs Haul Cycle: [PRJ] Haul Cycle_GR80_2016
Rolling Curve Segment Cycle Max Final Velocity Average Elevation Fuel % Duty
Type Segment Title Distance Grade Resist. Angle Load Time Time Vel. Vel. Limit. Velocity Change Usage Cycle
metres % % degrees % min % km/h km/h km/h metres litre/OpHr %
[PRJ] KOMATSU 960 E-2K (3500hp)_GR80_Cost
Queue Queue at Loader Auto Mins 3,12 10,06 12,5
Spot Spot at Loader 1 Mins 0,75 2,42 12,5
Load Loading Auto Mins 1,43 4,61 12,5
1 Haul Segment 2859 0,0 3,0 0,0 Full 4,54 14,63 46,4 0,0 Final Sp. 37,8 0,0 103,7 80,9
2 Haul Segment 2439 8,0 3,0 0,0 Full 11,72 37,74 12,7 0,0 Final Sp. 12,5 195,1 123,6 97,9
Spot Spot Time at Dump 1 Mins 0,80 2,58 12,5
Dump Dumping 1 Mins 1,00 3,22 12,5
3 Haul Segment (rev.) 2439 -8,0 3,0 0,0 Empty 3,58 11,53 48,0 0,0 Final Sp. 40,9 -195,1 12,5 0,3
4 Haul Segment (rev.) 2859 0,0 3,0 0,0 Empty 4,10 13,22 48,0 0,0 Final Sp. 41,8 0,0 59,4 42,0
Total 10 596 31,05 100,00 20,5 0
Page 29
29
Table 5: Sishen Talpac Optimisation Run
The truck production rate per hour in table 5 shows diminishing returns in terms of
productivity as more trucks are added to the system. The area was divided into two
loading areas with each area being serviced by either the hydraulic shovel or the
electric rope shovel. Each area has an independent haulage route to the dumping
area to minimise traffic. The results for each route showing the optimum fleet and the
related optimum production as well as the installed fleet and the actual production
are given in the table below.
Table 6: Sishen Simulated Annual Productivity
Run Fleet Production Production Loader Truck Avg. Cycle Truck Production Truck Avg. Load
No. Fleet Size Per Year Change Production Per Oper. Hour Time Per Oper. Hour Queue Time
tonne % tonne min tonne min
1 1,00 2 684 147,32 0,00 502,72 27,93 502,72 0,00
2 2,00 5 341 881,21 99,02 1 000,49 28,08 500,25 0,15
3 3,00 7 918 431,53 195,01 1 483,06 28,26 494,35 0,32
4 4,00 10 511 869,65 291,63 1 968,79 28,43 492,20 0,51
5 5,00 13 116 118,65 388,65 2 456,55 28,63 491,31 0,70
6 6,00 15 598 905,57 481,15 2 921,55 28,81 486,93 0,89
7 7,00 18 095 601,42 574,17 3 389,17 29,03 484,17 1,11
8 8,00 20 498 381,95 663,68 3 839,19 29,26 479,90 1,34
9 9,00 22 921 123,63 753,94 4 292,95 29,49 476,99 1,56
10 10,00 25 157 088,34 837,25 4 711,73 29,80 471,17 1,87
11 11,00 27 397 575,48 920,72 5 131,35 30,14 466,49 2,22
12 12,00 29 530 436,32 1 000,18 5 530,82 30,53 460,90 2,61
13 13,00 31 399 664,19 1 069,82 5 880,91 31,12 452,38 3,19
14 14,00 32 892 405,14 1 125,43 6 160,49 32,00 440,04 4,08
15 15,00 33 618 785,71 1 152,49 6 296,54 33,67 419,77 5,74
16 16,00 33 817 389,33 1 159,89 6 333,73 35,74 395,86 7,82
17 17,00 34 009 466,38 1 167,05 6 369,71 37,90 374,69 9,97
18 18,00 34 156 445,99 1 172,53 6 397,24 39,99 355,40 12,06
19 19,00 34 320 827,12 1 178,65 6 428,02 42,11 338,32 14,19
Year Optimum Fleet Installed Fleet Opt Production Act Production
Mtpa Mtpa
2014 13 13 31.5 31.5
2015 13 13 31.5 31.5
2016 13 13 31.5 31.5
2017 14 14 32.2 32.3
2018 13 14 30.8 32,4
2019 15 15 31.8 31.8
2020 17 17 31.7 31.7
2021 16 17 30.5 31,9
2022 17 17 31.1 31.1
2023 17 17 31.7 31.7
2024 19 19 31.5 31.5
2025 18 18 30.7 30.7
2026 20 20 30.6 30.6
2027 21 21 30.6 30.6
2028 21 21 30.6 30.6
2029 21 21 30.6 30.6
2030 21 21 30.6 30.6
Average 17,1 32,15
Page 30
30
Trolley Assist System
At Sishen there are some ramps that have trolley lines installed on them and are
currently used by the ore truck fleet of Komatsu 730E trucks. Using the external
electrical power enables the trucks to increase speed on the ramps from 10kph up to
22 kph thereby reducing truck cycle times. The other added benefit is on reduced
fuel consumption from 258 litres per hour on the ramp to 25 litres per hour.
Maintenance costs are also reduced as a consequence.
The truck manufacturer is being engaged to consider making the ultra-class trucks
also trolley assist compatible.
Planned Performance
The current schedule is to move 55Mt of clay and calcrete material per annum from
the GR80/50 area of Sishen mine until the end of the life of mine in 2030. The
simulation indicates a potential to achieve 64Mt per annum on average from the two
loading points.
Fleet Management System
Sishen runs a truck dispatch system provided by Modular Mining Services. This
system automatically dispatches trucks to shovels using linear and dynamic
algorithms so as to minimise queuing at the shovels and, for ore, to satisfy the
continuous blending requirements of the mine. It also captures all the loading and
hauling events which can be used for drawing reports. There are other fleet
management systems in the market that can also serve the same purpose such as
the Caterpillar’s MineStar system.
Mining Support Equipment
The fleet would need to be supported by secondary equipment to be effective. The
following are allocated based on the site philosophy:-
Two loading point track dozers for floor maintenance and toe ripping
One dumping point track dozers for dumping area and tipping berm maintenance
One additional track dozer for road construction and maintenance
Two rubber wheel dozers for road maintenance
Two water trucks for dust suppression on the haul roads
One diesel bowser for refuelling hydraulic shovel and secondary equipment
Page 31
31
Two road graders for road maintenance
Operational and Maintenance Personnel
Sishen has permanently employed truck and shovel operators as well as the
maintenance crew. It is a 24 hour operation with two 12 hour shifts per day and
seven days per week. The operational crew is organised into four shift crews each
working a total of 96 shifts per year including one training shift per month. To cater
for absenteeism, illness and leave, a staff over-complement factor of 1.2 or 20% is
also applied. Applying some mine standard maintenance ratios, the required number
of maintenance personnel can also be calculated. The average fleet size and
manning level are shown below in the tables 7 and 8 respectively.
Table 7: Truck and Shovel Fleet
Equipment Fleet Size
Eletric Rope Shovel (P&H 4100 XPC class) 1
Hydraulic Shovel (Komatsu PC8000 class) 1
Ultra class Truck (Komatsu 960E class) 34
Grader (CAT 16M class) 2
Wheel Dozer (Komatsu WD600 class) 2
Diesel Bowser (CAT 740 ADT class) 1
Water Truck (Komatsu HD785 class) 2
Cable Handler (Komatsu WA600 class) 1
Track Dozer (CAT D10 class) 4
Table 8: Truck and Shovel Manning Level
Personnel Ratios Manning Level
Operation Supervisors 2,0 4
Operators Primary Equip 4,8 173
Operators Support Equip 4,8 58
Maintenance Supervisors 2,0 2
Maintenance Operators 1,0 48
Artisans- Primary Equipment 2,0 72
Artisans- Support Equipment 1,0 12
Total
368
Owning and Operating Cost
In the cost calculations inputs were derived from internal company models compiled
using information from equipment suppliers as well as from the company’s
experience. The costs are first expressed per annum and the unit cost determined by
Page 32
32
dividing by the annual production. The costs are stated in 2014 terms with no
escalation or discounting on future costs applied.
Table 9: Truck and Shovel System Capital Cost
2014
Equipment Foreign Content Local Content Total
ZAR ZAR ZAR m
Electric Rope Shovel (P&H 4100 XPC class) 291 858 950 36 286 349 328,15
Hydraulic Shovel (Komatsu PC8000 class) 185 763 139 6 003 485 191,77
Ultra class Trucks (Komatsu 960E class) 69 633 664 6 757 472 76,39
Grader (CAT 16M class) 8 920 838 3 305 183 12,23
Wheel Dozer (Komatsu WD600 class) 8 499 839 1 006 476 9,51
Diesel Bowser (CAT 740 ADT class) 5 806 181 5 051 431 10,86
Water Truck (Komatsu HD785 class) 12 871 323 4 555 546 17,43
Cable Handler (Komatsu WA600 class) 6 907 211 1 901 038 8,81
Track Dozer (CAT D10 class) 12 066 505 3 832 940 15,90
Truck Owning Cost
Service Life 60 000 Hours
Annual Hours 5 335 Hours/ year
Service Life in years 11years
Annual Production 64.3 Mtpa
Table 10: Truck Annual Capital Cost
Year Optimum Fleet Installed Fleet Opt Production Act Production Capex Annual Capex
Mtpa Mtpa ZAR m ZAR m/year
2014 13 13 31.5 31.5 993,08 88,30
2015 13 13 31.5 31.5 993,08 88,30
2016 13 13 31.5 31.5 993,08 88,30
2017 14 14 32.2 32.3 1 069,48 95,09
2018 13 14 30.8 32,4 1 069,48 95,09
2019 15 15 31.8 31.8 1 145,87 101,89
2020 17 17 31.7 31.7 1 298,65 115,47
2021 16 17 30.5 31,9 1 298,65 115,47
2022 17 17 31.1 31.1 1 298,65 115,47
2023 17 17 31.7 31.7 1 298,65 115,47
2024 19 19 31.5 31.5 1 451,43 129,06
2025 18 18 30.7 30.7 1 375,04 122,26
2026 20 20 30.6 30.6 1 527,82 135,85
2027 21 21 30.6 30.6 1 604,21 142,64
2028 21 21 30.6 30.6 1 604,21 142,64
2029 21 21 30.6 30.6 1 604,21 142,64
2030 21 21 30.6 30.6 1 604,21 142,64
Average 17,1 32,15 116,27
Total Cost ZARm/yr 232,54
Production Mtpa 64,30
Unit Owning Cost ZAR/t 3,62
Page 33
33
Table 11: Loading and Support Equipment Owning Cost
Total Owning Cost is therefore ZAR 4.39/t.
Table 12: Operating Cost Excluding Labour
The labour cost based on the manning level as well cost of employment to company
is shown below.
Table 13: Truck and Shovel Labour Cost
This brings to the unit Owning and Operating cost of the Truck and Shovel option to
ZAR 15.80/t.
Equipment Fleet Size Service Life Operating Hours Service Life Capex Annual Capex
Hours Hrs/yr Years ZAR m ZAR m/year
Eletric Rope Shovel (P&H 4100 XPC class) 1 100 000 5 339 18,7 328,15 17,52
Hydraulic Shovel (Komatsu PC8000 class) 1 60 000 5 339 11,2 191,77 17,06
Grader (CAT 16M class) 2 50 000 4 000 12,5 24,45 1,96
Wheel Dozer (Komatsu WD600 class) 2 50 000 4 000 12,5 19,01 1,52
Diesel Bowser (CAT 740 ADT class) 1 35 000 4 000 8,8 10,86 1,24
Water Truck (Komatsu HD785 class) 2 45 000 4 000 11,3 34,85 3,10
Cable Handler (Komatsu WA600 class) 1 50 000 2 000 25,0 8,81 0,35
Track Dozer (CAT D10 class) 4 35 000 4 000 8,8 63,60 7,27
Total Cost ZARm/yr 50,02
Production Mtpa 64,30
Unit Owning Cost ZAR/t 0,78
Equipment Fleet Size Unit Op Cost Op Hours Op Cost
ZAR/hr Hrs/yr ZAR m/yr
Eletric Rope Shovel (P&H 4100 XPC class) 1 3 546 5 339 18,93
Hydraulic Shovel (Komatsu PC8000 class) 1 4 005 5 339 21,38
Komatsu 960E 34 2 972 5 339 539,46
Grader (CAT 16M class) 2 591 4 000 4,73
Wheel Dozer (Komatsu WD600 class) 2 735 4 000 5,88
Diesel Bowser (CAT 740 ADT class) 1 535 4 000 2,14
Water Truck (Komatsu HD785 class) 2 751 4 000 6,01
Cable Handler (Komatsu WA600 class) 1 556 2 000 1,11
Track Dozer (CAT D10 class) 4 1 230 4 000 19,69
Total Cost ZARm/yr 619,32
Production Mtpa 64,30
Unit Operating Cost ZAR/t 9,63
Support Equipment 12
Primary Equipment 36
Personnel Ratios Manning Level CTC Total CTC
ZAR/ Annum ZAR m/ Annum
Operation Supervisors 2,0 4 491 448 1,97
Operators Primary Equip 4,8 173 280 201 48,42
Operators Support Equip 4,8 58 222 352 12,81
Maintenance Supervisors 2,0 2 491 448 0,98
Maintenance Operators 1,0 48 222 352 10,67
Artisans- Primary Equipment 2,0 72 470 564 33,88
Artisans- Support Equipment 1,0 12 470 564 5,65
Total Cost ZARm/yr 368 114,38
Production Mtpa 64,30
Unit Labour Cost ZAR/t 1,78
Page 34
34
3.2 In-pit Crushing and Conveying
In-pit crushing and conveying is whereby broken material is fed through a fully
mobile or semi mobile crusher located within the pit and the crushed material is then
transported by conveyors from the crusher to its destination which could be the plant,
stockpile or waste dump. For a stockpile, a stacker is then used to place the material
for subsequent reclamation. For a waste dump, spreaders are normally used to
place the material according to the dump design.
Conveyor capacities depend on belt width and speed. The material has to be
crushed down to a size less than 25% of the belt width for efficient conveying.
The choice between a fully mobile and a semi mobile system is influenced by the
properties of the material being mined as well as pit design constraints. Currently the
available crushers that can be configured into a fully mobile system are the sizers,
double roll crusher which can crush material with strength of up to 100MPa. There is
a newer crusher, the Hybrid double Roll crusher which can handle up to 200MPa
currently on trial. The material has to be consistent in terms of strength and
fragmentation as well to achieve design throughput of up to 12 000 tph depending on
the rock strength. For rock strength higher than 200MPa, gyratory crushers become
the crusher of choice as they can handle material up to 250 MPa. Gyratory crushers
have, however big height, up to 8 m making it currently impossible to install them in a
fully mobile configuration. They are the crusher of choice in the semi mobile
configuration with throughputs up to 12 000 tph.
The other consideration is the pit layout. The fully mobile system can be prone to
blasting damage if the pit deployment is such that it would be difficult to keep the
components out of the way during blasting such as in smaller conical pits.
Fully Mobile IPCC System
In a fully mobile configuration the material is dumped directly into a mobile crusher
by the shovel at the loading face. From the crusher, the material is then transported
by a mobile transfer conveyor onto a series of mobile or track shift able conveyors
across the pit and on the ramps via belt wagons, and out of the pit on to the stacker
or spreader and then dump or stockpile. The conveyors have either crawler systems
which make them self- propelled or they would be on tracks and can be easily shifted
Page 35
35
by specially equipped dozers. Bridge conveyor sections provide access points on
haul roads through which other mine vehicles can pass.
Figure 8: Fully mobile IPCC system (Morriss, 2013)
Figure 9: Spreaders on the waste dump (Morriss, 2013)
Page 36
36
A smaller truck fleet is usually required to establish the initial benches as well as
handle the overflow from the IPCC system.
Semi Mobile IPCC System
For a semi mobile configuration, the material is loaded onto trucks which transport
and dump it into the semi mobile crusher within the pit. A series of conveyors then
transport the material out of the pit. The crusher is moved to different positions within
the pit based on the pit deployment. The position of the crusher location is carefully
chosen so as to limit the frequency of the relocations while keeping it as close as
possible to the loading areas to minimise truck cycle times. Relocations are usually
done once or twice a year. Another variation, called semi fixed, is whereby the
crusher stays longer in the same position for up to three to five years and the
installation is therefore more solid.
Figure 10: Semi mobile IPCC system (Morriss, 2013)
The access route to the crusher can be either through temporary ramps such as in
figure 5 or through the existing ramps. The crusher may have a surge bin before or
after crusher feeding.
In both cases the out of pit conveyors can be on dedicated conveyor ramps or
tunnels which can be made steeper or the truck haulage ramps. The proposed layout
for the Sishen case is to have the out of pit conveyors on dedicated ramps with
separate routes for each sizer with the two systems tying in at the waste dump
incline conveyor.
Availability of electrical power supply, including the necessary reticulation facilities, is
a main consideration when looking at the viability of IPCC systems.
Page 37
37
Another consideration and challenge is the ability to achieve direct operating hours
for the system due to the fact that the system is directly coupled and a problem with
one component affects the whole system from the crusher to the spreader.
Relocations have to be managed properly as well as a lot of time may be lost in the
process. Both the fully mobile and semi mobile IPCC options were considered for
Sishen.
The proposed IPCC equipment has been determined using the final operating
position at the last level of the over burden at a depth of 200m and using a grade of
10% for the inclines.
Sishen Proposed IPCC System
Table14: Proposed Sishen IPCC Equipment List for Fully Mobile System
Component Quantity Throughput per unit (tph)
Sizer 2 6 000
Belt Wagon 2 6 000
Link Conveyor 2 6 000
1200m Face Conveyor –Track shift able 2 6 000
Bench Link Conveyor – Track shift able 2 6 000
Bridge Conveyors 2 6 000
2000m Bench Incline Conveyor - re-locatable 2 6 000
2000m Overland Conveyors 2 6 000
1000m Waste Dump Incline Conveyor - Fixed 1 12 000
2000m Waste Dump Flat – Track shift able 1 12 000
Spreader 2 12 000
The equipment to load the fully mobile sizers including the support equipment is as
listed in the table 15 below.
Table 15: FMIPCC Loading Fleet
Equipment Type Fleet Size Operating Hours
Hrs/yr
P&H 4100 XPC 1 5560
Komatsu PC8000 1 5560
Grader 16M 1 2000
Komatsu WD600 Wheel Dozer 1 2000
CAT 740 ADT Diesel Bowser 1 2000
Komatsu HD785 Water Truck 1 2000
CAT D10 Dozer 2 2000
Page 38
38
Table 16: Proposed Sishen IPCC Equipment List for Semi Mobile System
Component Quantity Throughput per each (tph)
Sizer 2 6 000
1200m Face Conveyor –Track shift able 2 6 000
Bench Link Conveyor – Track shift able 2 6 000
Bridge Conveyors 2 6 000
2000m Bench Incline Conveyor - re-locatable 2 6 000
2000m Overland Conveyors 2 6 000
1000m Waste Dump Incline Conveyor - Fixed 1 12 000
2000m Waste Dump Flat – Track shift able 1 12 000
Spreader including spare 2 12 000
The equipment to load the semi mobile sizers is determined below.
Truck Payload (tonnes) 327
Truck Average Speed (kph) 15,00
Truck Loading Time (Hrs) 0,08
Truck Dumping Time (Hrs) 0,05
Truck Travel Distance (km) 1,00
Truck Travel Time (Hrs) 0,13
Total Cycle Time (Hrs) 0,27
Shovel Capacity (cubic metres) 45
Bucket Fill Factor 88%
Number of Passes 3
Material Density (tonnes per cubic metre) 2,62
Average Truck Payload (tonne) 311
Truck Loads per Hour 3,75
Truck Capacity (tph) 1 167
Required Capacity (tph) 5 030
Required Truck Fleet per shovel 4,31
Shovel Number 2
Total Truck Fleet Size 9
The semi mobile sizer loading fleet is as listed in table 17 below.
Page 39
39
Table 17: SMIPCC Loading Fleet
Equipment Type Fleet Size Operating Hours
Hrs/yr
P&H 4100 XPC 1 5335
Komatsu PC8000 1 5335
Komatsu 960E Trucks 9 5335
Grader 16M 1 4000
Komatsu WD600 Wheel Dozer 1 4000
CAT 740 ADT Diesel Bowser 1 4000
Komatsu HD785 Water Truck 1 4000
CAT D10 Dozer 2 4000
Both the FMIPCC and the SMIPCC require additional support equipment to assist in
the relocations and preparation of areas during installations. The proposed list is
shown in table 18 below.
Table18: Proposed Sishen Ancillary Equipment
Equipment Type Quantity
Transporter 1
Crane 120t/150t 1
Excavator 2 Tonne 1
Bobcat 1
IT Loader 1
Maintenance Truck 2
Conveyor Side Lifting Truck 1
Rock Breaker 1
Track Dozer (D10 Class) 3
Truck & Lowbed 1
Pipe Layer Dozer 1
Belt realer 1
Cable realer 1
The IPCC operations would also be a 24 hour operation with two 12 hour shifts. Four
crews would be required to allow for off days with an additional 20% staff over
compliment on the operators allowed for leave, sickness and absenteeism. The
manning levels for the two IPCC configurations are shown in tables 19 and 20 below.
Page 40
40
Table 19: FMIPCC Manning Level
FMIPCC Component Manning Level
IPCC System
Supervisor 4,0
Control Room Operator 4,8
Crusher Station Attendant 4,8
Spreader Attendant 4,8
Belt Attendant 4,8
Mechanical Artisan 4,0
Electrical Artisan 4,0
Assistants 4,8
Ancillary Equipment Operators
Transporter -
Crane 120t/150t 4,0
Excavator 2 Tonne 4,0
Bobcat 4,0
IT Loader -
Maintenance Truck 4,0
Conveyor Side Lifting Truck 4,0
Rock Breaker -
Track Dozer (D10 Class) 12,0
Truck & Lowbed -
Pipe Layer Dozer -
Belt realer 4,0
Cable realer -
Loading System
Operators Primary Equip 9,6
Operators Support Equip 28,8
Maintenance Operators 8,0
Artisans- Primary Equipment 4,0
Artisans- Support Equipment 6,0
Total 128
Table 20: SMIPCC Manning Level
SMIPCC Component Manning Levels
IPCC System
Supervisor 4,0
Control Room Operator 4,8
Crusher Station Attendant 4,8
Spreader Attendant 4,8
Belt Attendant 4,8
Leave Relief 4,8
Mechanical Artisan 4,0
Electrical Artisan 4,0
Assistants 4,8
Sub Total
Page 41
41
Ancillary Equipment Operators
Transporter -
Crane 120t/150t 4,0
Excavator 2 Tonne 4,0
Bobcat 4,0
IT Loader -
Maintenance Truck 4,0
Conveyor Side Lifting Truck 4,0
Rock Breaker -
Track Dozer (D10 Class) 12,0
Truck & Lowbed -
Pipe Layer Dozer -
Belt realer 4,0
Cable realer -
Loading System
Operators Primary Equip 53
Operators Support Equip 29
Maintenance Operators 17
Artisans- Primary Equipment 22
Artisans- Support Equipment 6
Total 203
IPCC System Cost
The build up of the cost for the IPCC systems follows the same principle as the
Truck and Shovel option. First the production rate is estimated using efficiency
factors and the operating hours determined using the time usage model. The capital
cost is derived from information from suppliers and reduced to an annual cost based
on the life of the equipment and then to a unit cost based on the estimated annual
production. The maintenance cost of each component is determined using available
industry norms and also reduced to a unit cost per tonne. The labour cost is then
included using the manning level for the system and the cost of labour to company.
Page 42
42
FMIPCC System Cost
Table 21: FMIPCC Time Usage Model
Adopted from Morriss, 2013
The effective operating hours are 5 560 hours per year.The nominal capacity of the
system with the two sizers is 12 000 tph and at 85% efficiency the expected
FMIPCC
Design Operating Hours Shovel
FM
Crusher
Belt
Wagon
Link
Conveyor
Face
Conveyor
Bench
Link
Conveyor
Bridge
Conveyor
Bench
Incline
Conveyor
Overland
Conveyor
Waste
Dump
Incline
Waste
Dump Flat
Conveyor
50/50
Radial
Spreader
Spreader
Spare
IPCC
SYSTEM
Calendar Hours 8 760 8 760 8 760 8 760 8 760 8 760 8 760 8 760 8 760 8 760 8 760 8 760 8 760 8 760
Weather losses 120 120 120 120 120 120 120 120 120 120 120 120 120 120
FM Crusher Relocation 0 0
In pit Conveyor Relocations 72 72 72 72 72 72 72 72
Dump Conveyor Relocations 72 72 72
Spreader Relocations 0
Relocation new level 72 72 72 72 72 72 72 72
Scheduled Hours 8 640 8 640 8 496 8 496 8 496 8 496 8 496 8 496 8 496 8 568 8 568 8 640 8 640 8 424
Daily Service 361 180 180 180 180 180 180 180 180 180 180 0 180 361
Weekly Maintenance 411 617 309 309 309 309 309 309 309 309 309 0 617 617
Other Maintenance Shutdown 120 240 240 0 0 0 0 0 0 0 0 0 0 240
Scheduled Maintenance 801 1 037 729 489 489 489 489 489 489 489 489 0 797 1 218
Available Hours
Scheduled Availability 90,7% 88,0% 91,4% 94,2% 94,2% 94,2% 94,2% 94,2% 94,2% 94,3% 94,3% 100,0% 90,8% 85,5%
Breakdowns as % of Scheduled Hrs 6,0% 3,0% 2,0% 2,0% 2,0% 2,0% 2,0% 2,0% 2,0% 2,0% 2,0% 0,0% 2,0% 8,6%
Breakdowns 518 259 170 170 170 170 170 170 170 171 171 0 173 622
BUDGET Overall Availability 84,7% 85,0% 89,4% 92,2% 92,2% 92,2% 92,2% 92,2% 92,2% 92,3% 92,3% 100,0% 88,8% 78,2%
Available Hours 7321 7344 7597 7837 7837 7837 7837 7837 7837 7908 7908 8640 7670 6584
Design Operating Hours Shovel
FM
Crusher
Belt
Wagon
Link
Conveyor
Face
Conveyor
Bench
Link
Conveyor
Bridge
Conveyor
Bench
Incline
Conveyor
Overland
Conveyor
Waste
Dump
Incline
Waste
Dump Flat
Conveyor
50/50
Radial
Spreader
Spreader
Spare
IPCC
SYSTEM
Utilization
Shift Duration (hrs) 12,00 12,00 12,00 12,00 12,00 12,00 12,00 12,00 12,00 12,00 12,00 12,00 12,00 12,00
Shift duration (mins) 720 720 720 720 720 720 720 720 720 720 720 720 720 720
No of shifts/day 2 2 2 2 2 2 2 2 2 2 2 2 2 2
Shift startup + meeting 10 10 10 10 10 10 10 10 10 10 10 10 10 10
Travel to /from pit 5 5 5 5 5 5 5 5 5 5 5 5 5 5
Travel from pit 0 0 0 0 0 0 0 0 0 0 0 0 0 0
Operator changeout 0 0 0 0 0 0 0 0 0 0 0 0 0 0
Equipment Inspection 10 10 10 10 10 10 10 10 10 10 10 10 10 10
Meal break 40 40 40 40 40 40 40 40 40 40 40 40 40 40
Blasting delays 20,0 20,0 20,0 20,0 20,0 20,0 20,0 20,0 20,0 20,0 20,0 20,0 20,0 20
Fuel/Lubrication 15 15 15 15 15 15 15 15 15 15 15 15 15 15
Manoeuvre 0,0% 0,0% 0,0% 0,0% 0,0% 0,0% 0,0% 0,0% 0,0% 0,0% 0,0% 0,0% 0,0% 0,0%
Manoeuvre 0 0 0 0 0 0 0 0 0 0 0 0 0 0
Fatigue + Safety Meeting Delays 10 10 10 10 10 10 10 10 10 10 10 10 10 10
Not required 0 0 0 0 0 0 0 0 0 0 0 0 0 0
Effective Operation/Shift 608,0 608,0 608,0 608,0 608,0 608,0 608,0 608,0 608,0 608,0 608,0 608,0 608,0 608
Equipment Utilization 84,4% 84,4% 84,4% 84,4% 84,4% 84,4% 84,4% 84,4% 84,4% 84,4% 84,4% 84,4% 84,4% 84,4%
0,0% 0,0% 0,0% 0,0% 0,0% 0,0% 0,0% 0,0% 0,0% 0,0% 0,0% 0,0% 0,0% 0,0%
Shift startup + meeting 0 0 0 0 0 0 0 0 0 0 0 0 0 1
Travel to /from pit 0 0 0 0 0 0 1 0 0 1 0 1 1 1
Travel from pit 0 0 0 0 0 0 1 0 0 1 0 1 1 1
Operator changeout 0 0 0 0 0 0 0 0 0 0 0 0 0 0
Equipment Inspection 0 0 0 0 0 0 0 0 0 0 0 0 0 0
Meal break 1 1 1 1 1 1 1 1 1 1 1 1 1 1
Blasting delays 1 1 1 1 1 1 1 1 1 1 1 1 1 1
Fuel/Lubrication 0 0 0 0 0 0 0 0 0 0 0 0 0 0
Manoeuvre
Manoeuvre 0 0 0 0 0 0 0 0 0 0 0 0 0 0
Fatigue + Safety Meeting Delays 0 0 0 0 0 0 0 0 0 0 0 0 0 0
Not required 1 1 1 1 1 1 1 1 1 1 1 1 1 1
SMU Factors (Engine to OpHrs)
Shift startup + meeting ON ON ON ON ON ON ON ON ON ON ON ON ON OFF
Travel to /from pit ON ON ON ON ON ON OFF ON ON OFF ON OFF OFF OFF
Travel from pit ON ON ON ON ON ON OFF ON ON OFF ON OFF OFF OFF
Operator changeout ON ON ON ON ON ON ON ON ON ON ON ON ON ON
Equipment Inspection ON ON ON ON ON ON ON ON ON ON ON ON ON ON
Meal break OFF OFF OFF OFF OFF OFF OFF OFF OFF OFF OFF OFF OFF OFF
Blasting delays OFF OFF OFF OFF OFF OFF OFF OFF OFF OFF OFF OFF OFF OFF
Fuel/Lubrication ON ON ON ON ON ON ON ON ON ON ON ON ON ON
Manoeuvre ON ON ON ON ON ON ON ON ON ON ON ON ON ON
Manoeuvre ON ON ON ON ON ON ON ON ON ON ON ON ON ON
Fatigue + Safety Meeting Delays ON ON ON ON ON ON ON ON ON ON ON ON ON ON
Not required OFF OFF OFF OFF OFF OFF OFF OFF OFF OFF OFF OFF OFF OFF
SMU Factor 1,09 1,09 1,09 1,09 1,09 1,09 1,08 1,09 1,09 1,08 1,09 1,08 1,08 1,06
Effective Operating Hours Shovel
FM
Crusher
Belt
Wagon
Link
Conveyor
Face
Conveyor
Bench
Link
Conveyor
Bridge
Conveyor
Bench
Incline
Conveyor
Overland
Conveyor
Waste
Dump
Incline
Waste
Dump Flat
Conveyor
Spreader
50/50
Radial
Spreader
Spreader
Spare
IPCC
SYSTEM
Annual Hours 8 640 8 640 8 496 8 496 8 496 8 496 8 496 8 496 8 496 8 568 8 568 8 640 8 640 8 424
Equipment Availability 84,7% 85,0% 89,4% 92,2% 92,2% 92,2% 92,2% 92,2% 92,2% 92,3% 92,3% 100,0% 88,8% 78,2%
Possible Mine Operating Hours 100,0% 100,0% 100,0% 100,0% 100,0% 100,0% 100,0% 100,0% 100,0% 100,0% 100,0% 100,0% 100,0% 100,0%
Equipment Utilization 84,4% 84,4% 84,4% 84,4% 84,4% 84,4% 84,4% 84,4% 84,4% 84,4% 84,4% 84,4% 84,4% 84,4%
Factor for start up years 100% 100% 100% 100% 100% 100% 100% 100% 100% 100% 100% 100% 100% 100%
Effective Operating Hours 6 182 6 201 6 415 6 618 6 618 6 618 6 618 6 618 6 618 6 678 6 678 7 296 6 477 5 560
SMU (Engine) Hrs / year 6 711 6 732 6 964 7 184 7 184 7 184 7 130 7 184 7 184 7 194 7 249 7 860 6 978 5 898
Average
Page 43
43
production rate is 10 200 tph. The annual capacity of the system is thus determined
at 10 200 tph x 5560 hrs giving an estimated annual capacity of 56.71 Mtpa.
Table 22: FMIPCC Owning Cost
Table 23: FMIPCC Loading Fleet Owning Cost
Table 24: FMIPCC Electrical Power Cost
Equipment Replacement Schedule Qty Life Hrs Op Hrs Service Life Capital Cost Annual Capital
Hrs Hrs/yr Yrs ZAR m ZAR m/yr
Sizer 2 100000 5560 18 394,53 21,94
Belt Wagon 2 100000 5560 18 244,72 13,61
Link Conveyor 2 100000 5560 18 61,95 3,44
1200m Face conveyor 2 100000 5560 18 122,50 6,81
Bench Link Conveyor 2 100000 5560 18 61,39 3,41
Bridge Conveyors 2 100000 5560 18 61,67 3,43
Bench Incline Conveyor 500m 2 100000 5560 18 25,63 1,42
Overland Conveyor 1000m 2 100000 5560 18 129,82 7,22
Waste Dump Incline Conveyor 1 100000 5560 18 23,09 1,28
Waste Dump Flat Conveyor 1200m 1 100000 5560 18 82,09 4,56
Spreader 2 100000 5560 18 260,20 14,47
Transporter 1 50000 1000 50 49,76 1,00
Crane 120t/150t 1 25000 1000 25 14,54 0,58
Excavator 2 Tonne 1 10000 2000 5 0,50 0,10
Bobcat 1 10000 2000 5 0,44 0,09
IT Loader 1 20000 2000 10 4,42 0,44
Maintenance Truck 2 15000 2400 6 3,66 0,59
Conveyor Side Lifting Truck 1 15000 2000 8 3,11 0,41
Rock Breaker 1 24000 4000 6 3,55 0,59
Track Dozer (D10 Class) 3 35000 4000 9 43,50 4,97
Truck & Lowbed 1 50000 2000 25 35,00 1,40
Pipe Layer Dozer 1 30000 2000 15 12,50 0,83
Belt reeler 1 20000 2000 10 4,43 0,44
Cable reeler 1 20000 4000 5 3,05 0,61
Total 1 646,06 93,66
Production Mtpa 56,71
Unit Owning Cost ZAR/t 1,65
Equipment Type Fleet Size Service Life Operating Hours Service Life Capital Cost Annual Capital
Hrs Hrs/yr Yrs ZAR m ZAR m/yr
Eletric Rope Shovel (P&H 4100 XPC class) 1 100000 5560 18 328,15 18,24
Hydraulic Shovel (Komatsu PC8000 class) 1 60000 5560 11 191,77 17,77
Grader 16M 1 50000 2000 25 12,23 0,49
Komatsu WD600 Wheel Dozer 1 50000 4000 13 9,51 0,76
CAT 740 ADT Diesel Bowser 1 35000 4000 9 10,86 1,24
Komatsu HD785 Water Truck 1 45000 2000 23 17,43 0,77
CAT D10 Dozer 2 35000 4000 9 31,80 3,63
Total Cost ZARm/yr 42,91
Production Mtpa 56,71
Unit Owning Cost ZAR/t 0,76
Electricity Price ZAR/ KwHr 0,96
Equipment Type Quantity Operating Power Operating Hours Power Consumption Cost
Kw Hrs/yr MwHr/yr ZAR m/yr
Sizer 2 1 800 5 560 20 016 19,22
Belt Wagon 2 490 5 560 5 449 5,23
Link Conveyor 2 460 5 560 5 115 4,91
1200m Face conveyor 2 922 5 560 10 253 9,84
Bench Link Conveyor 2 280 5 560 3 114 2,99
Bridge Conveyors 2 480 5 560 5 338 5,12
Bench Incline Conveyor 500m 2 1 125 5 560 12 510 12,01
Overland Conveyor 1000m 2 578 5 560 6 427 6,17
Waste Dump Incline Conveyor 1 578 5 560 3 214 3,09
Waste Dump Flat Conveyor 1200m 1 578 5 560 3 214 3,09
Spreader 2 600 5 560 3 336 3,20
Total 7 891 77 985 74,87
56,71
1,32
Production Mtpa
Unit Cost ZAR/t
Page 44
44
Table 25: Ancillary Equipment Fuel Cost
Table 26: FMIPCC System Maintenance Cost
Table 27: Ancillary Equipment Maintenance Cost
Fuel Price ZAR/Ltr 12,76
Equipment Type Quantity Operating Hours Fuel Consumption Cost
Hrs/year Ltr/Hr ZAR m/year
Transporter 1 1000 100 1,28
Crane 120t/150t 1 1000 30 0,38
Excavator 2 Tonne 1 2000 15 0,38
Bobcat 1 2000 10 0,26
IT Loader 1 2000 18 0,46
Maintenance Truck 2 2400 18 1,10
Conveyor Side Lifting Truck 1 2000 18 0,46
Rock Breaker 1 4000 25 1,28
Track Dozer (D10 Class) 3 4000 35 5,36
Truck & Lowbed 1 2000 15 0,38
Pipe Layer Dozer 1 2000 34 0,87
Belt reeler 1 2000 25 0,64
Cable reeler 1 4000 25 1,28
14,12
56,71
0,25Fuel Cost ZAR/t
Total
Production Mtpa
Equipment Type Quantity Mtce Cost Machine Hours Mtce Cost
ZAR/Hr Hrs/yr ZAR m/yr
Sizer 2 6177 5560 68,68
Belt Wagon 2 965 5560 10,73
Link Conveyor 2 1544 5560 17,17
1200m Face conveyor 2 1544 5560 17,17
Bench Link Conveyor 2 1544 5560 17,17
Bridge Conveyors 2 1544 5560 17,17
Bench Incline Conveyor 500m 2 1930 5560 21,46
Overland Conveyor 1000m 2 1544 5560 17,17
Waste Dump Incline Conveyor 1 3860 5560 21,46
Waste Dump Flat Conveyor 1200m 1 3860 5560 21,46
Spreader 2 1930 5560 21,46
251,13
56,71
4,43
Total
Production Mtpa
Unit Mtce Cost ZAR/t
Equipment Type Quantity Mtce Engine Hours Mtce Cost
ZAR/Hr Hrs/yr ZAR m/yr
Transporter 1 1955 1000 1,96
Crane 120t/150t 1 782 1000 0,78
Excavator 2 Tonne 1 391 2000 0,78
Bobcat 1 335 2000 0,67
IT Loader 1 425 2000 0,85
Maintenance Truck 2 425 2400 1,02
Conveyor Side Lifting Truck 1 425 2000 0,85
Rock Breaker 1 670 4000 2,68
Track Dozer (D10 Class) 3 1331 4000 5,32
Truck & Lowbed 1 1761 2000 3,52
Pipe Layer Dozer 1 1034 2000 2,07
Belt reeler 1 559 2000 1,12
Cable reeler 1 559 4000 2,23
23,85
56,71
0,42
Total
Production Mtpa
Unit Mtce Cost ZAR/t
Page 45
45
FMIPCC Loading System Operating Cost
The operating cost for the loading system including energy and maintenance are
given in the table below. The hourly rates are derived from the company’s models
where the costs were built up from expected component change out, energy and
fluid consumption but exclude the labour component.
Table 28: FMIPCC Loading System Operating Cost
The labour cost for the FMIPCC system as well as the loading system is build up as
in the tables below.
Equipment Fleet Size Unit Op Cost Op Hours Op Cost
ZAR/hr Hrs/yr ZAR m/yr
P&H 4100 XPC 1 3546 5560 19,72
Komatsu PC8000 1 4005 5560 22,27
Grader 16M 1 591 2000 1,18
Komatsu WD600 Wheel Dozer 1 735 2000 1,47
CAT 740 ADT Diesel Bowser 1 535 2000 1,07
Komatsu HD785 Water Truck 1 751 2000 1,50
CAT D10 Dozer 2 1230 2000 4,92
Total Cost ZARm/yr 52,13
Production Mtpa 56,71
Unit Operating Cost ZAR/t 0,92
Page 46
46
Table 29: FMIPCC System Labour Cost
Table 30: FMIPCC Loading System Labour Cost
IPCC Component Manning Level CTC CTC
ZAR/yr ZAR m/yr
Supervisor 4,0 491 448 1,97
Control Room Operator 4,8 280 201 1,34
Crusher Station Attendant 4,8 280 201 1,34
Spreader Attendant 4,8 280 201 1,34
Belt Attendant 4,8 280 201 1,34
Mechanical Artisan 4,0 470 564 1,88
Electrical Artisan 4,0 470 564 1,88
Assistants 4,8 222 352 1,07
Sub Total 12,18
Ancillary Equipment Operators
Transporter - 222 352 -
Crane 120t/150t 4,0 222 352 0,89
Excavator 2 Tonne 4,0 222 352 0,89
Bobcat 4,0 222 352 0,89
IT Loader - 222 352 -
Maintenance Truck 4,0 222 352 0,89
Conveyor Side Lifting Truck 4,0 222 352 0,89
Rock Breaker - 222 352 -
Track Dozer (D10 Class) 12,0 222 352 2,67
Truck & Lowbed - 222 352 -
Pipe Layer Dozer - 222 352 -
Belt reeler 4,0 222 352 0,89
Cable reeler - 222 352 -
Sub Total 8,00
Total 72,0 20,18
Production Mtpa 56,71
Unit Cost ZAR/t 0,36
Equipment Ratios Manning Level CTC Total CTC
ZAR/yr ZAR m/yr
Operators Primary Equip 4,8 10 280201 2,69
Operators Support Equip 4,8 29 222352 6,40
Maintenance Operators 1,0 8 222352 1,78
Artisans- Primary Equipment 2,0 4 470564 1,88
Artisans- Support Equipment 1,0 6 470564 2,82
Total Cost ZARm/yr 56 15,58
Production Mtpa 56,71
Unit Cost ZAR/t 0,27
Page 47
47
The Owning and Operating Cost of the Fully Mobile IPCC system is therefore made
up of the following sub categories
IPCC System Owning Cost ZAR 1.65/t
IPCC System Maintenance Cost ZAR 4.85/t
IPCC System Energy Cost ZAR 1.57/t
IPCC System Labour Cost ZAR 0.36/t
Loading System Owning Cost ZAR 0.76/t
Loading System Operating Cost ZAR 0.92/t
Loading System Labour Cost ZAR 0.27/t
The Owning and Operating Cost for the operation is thus estimated at ZAR 10.38/t in
2014 terms.
Page 48
48
SMIPCC System
Table 31: SMIPCC Time Usage Model
SMIPCC
Design Operating Hours Shovel
SM
Crusher
Bench
Link
Conveyor
Bridge
Conveyor
Bench
Incline
Conveyor
Overland
Conveyor
Waste
Dump
Incline
Waste
Dump Flat
Conveyor
50/50
Radial
Spreader
Spreader
Spare
IPCC
SYSTEM
Calendar Hours 8 760 8 760 8 760 8 760 8 760 8 760 8 760 8 760 8 760 8 760 8 760
Weather losses 120 120 120 120 120 120 120 120 120 120 120
SM Crusher Relocation 286 286
In pit Conveyor Relocations 72 72 72 72
Dump Conveyor Relocations 72 72 72
Spreader Relocations 0
Scheduled Hours 8 640 8 354 8 568 8 568 8 568 8 640 8 568 8 568 8 640 8 640 8 210
Daily Service 361 180 180 180 180 180 180 180 0 180 361
Weekly Maintenance 411 617 309 309 309 309 309 309 0 617 617
Other Maintenance Shutdown 120 240 0 0 0 0 0 0 0 0 240
Scheduled Maintenance 801 1 037 489 489 489 489 489 489 0 797 1 218
Available Hours
Scheduled Availability 90,7% 87,6% 94,3% 94,3% 94,3% 94,3% 94,3% 94,3% 100,0% 90,8% 85,2%
Breakdowns as % of Scheduled Hrs 6,0% 3,0% 2,0% 2,0% 2,0% 2,0% 2,0% 2,0% 0,0% 2,0% 8,9%
Breakdowns 518 251 171 171 171 173 171 171 0 173 622
BUDGET Overall Availability 84,7% 84,6% 92,3% 92,3% 92,3% 92,3% 92,3% 92,3% 100,0% 88,8% 77,6%
Available Hours 7321 7066 7908 7908 7908 7978 7908 7908 8640 7670 6370
Design Operating Hours Shovel
SM
Crusher
Bench
Link
Conveyor
Bridge
Conveyor
Bench
Incline
Conveyor
Overland
Conveyor
Waste
Dump
Incline
Waste
Dump Flat
Conveyor
50/50
Radial
Spreader
Spreader
Spare
IPCC
SYSTEM
Utilization
Shift Duration (hrs) 12,00 12,00 12,00 12,00 12,00 12,00 12,00 12,00 12,00 12,00 12,00
Shift duration (mins) 720 720 720 720 720 720 720 720 720 720 720
No of shifts/day 2 2 2 2 2 2 2 2 2 2 2
Shift startup + meeting 10 10 10 10 10 10 10 10 10 10 10
Travel to /from pit 5 5 5 5 5 5 5 5 5 5 5
Travel from pit 0 0 0 0 0 0 0 0 0 0 0
Operator changeout 0 0 0 0 0 0 0 0 0 0 0
Equipment Inspection 10 15 10 10 10 10 10 10 10 10 15
Meal break 40 40 40 40 40 40 40 40 40 40 40
Blasting delays 20,0 20,0 20,0 20,0 20,0 20,0 20,0 20,0 20,0 20,0 20
Fuel/Lubrication 15 15 15 15 15 15 15 15 15 15 15
Manoeuvre 0,0% 0,0% 0,0% 0,0% 0,0% 0,0% 0,0% 0,0% 0,0% 0,0% 0,0%
Manoeuvre 0 0 0 0 0 0 0 0 0 0 0
Fatigue + Safety Meeting Delays 10 10 10 10 10 10 10 10 10 10 10
Not required 0 0 0 0 0 0 0 0 0 0 0
Effective Operation/Shift 608,0 603,0 608,0 608,0 608,0 608,0 608,0 608,0 608,0 608,0 603
Equipment Utilization 84,4% 83,8% 84,4% 84,4% 84,4% 84,4% 84,4% 84,4% 84,4% 84,4% 83,8%
0,0% 0,0% 0,0% 0,0% 0,0% 0,0% 0,0% 0,0% 0,0% 0,0% 0,0%
Shift startup + meeting 0 0 0 0 0 0 0 0 0 0 1
Travel to /from pit 0 0 0 1 0 0 1 0 1 1 1
Travel from pit 0 0 0 1 0 0 1 0 1 1 1
Operator changeout 0 0 0 0 0 0 0 0 0 0 0
Equipment Inspection 0 0 0 0 0 0 0 0 0 0 0
Meal break 1 1 1 1 1 1 1 1 1 1 1
Blasting delays 1 1 1 1 1 1 1 1 1 1 1
Fuel/Lubrication 0 0 0 0 0 0 0 0 0 0 0
Manoeuvre
Manoeuvre 0 0 0 0 0 0 0 0 0 0 0
Fatigue + Safety Meeting Delays 0 0 0 0 0 0 0 0 0 0 0
Not required 1 1 1 1 1 1 1 1 1 1 1
SMU Factors (Engine to OpHrs)
Shift startup + meeting ON ON ON ON ON ON ON ON ON ON OFF
Travel to /from pit ON ON ON OFF ON ON OFF ON OFF OFF OFF
Travel from pit ON ON ON OFF ON ON OFF ON OFF OFF OFF
Operator changeout ON ON ON ON ON ON ON ON ON ON ON
Equipment Inspection ON ON ON ON ON ON ON ON ON ON ON
Meal break OFF OFF OFF OFF OFF OFF OFF OFF OFF OFF OFF
Blasting delays OFF OFF OFF OFF OFF OFF OFF OFF OFF OFF OFF
Fuel/Lubrication ON ON ON ON ON ON ON ON ON ON ON
Manoeuvre ON ON ON ON ON ON ON ON ON ON ON
Manoeuvre ON ON ON ON ON ON ON ON ON ON ON
Fatigue + Safety Meeting Delays ON ON ON ON ON ON ON ON ON ON ON
Not required OFF OFF OFF OFF OFF OFF OFF OFF OFF OFF OFF
SMU Factor 1,09 1,09 1,09 1,08 1,09 1,09 1,08 1,09 1,08 1,08 1,07
Effective Operating Hours Shovel
SM
Crusher
Bench
Link
Conveyor
Bridge
Conveyor
Bench
Incline
Conveyor
Overland
Conveyor
Waste
Dump
Incline
Waste
Dump Flat
Conveyor
Spreader
50/50
Radial
Spreader
Spreader
Spare
IPCC
SYSTEM
Annual Hours 8 640 8 354 8 568 8 568 8 568 8 640 8 568 8 568 8 640 8 640 8 210
Equipment Availability 84,7% 84,6% 92,3% 92,3% 92,3% 92,3% 92,3% 92,3% 100,0% 88,8% 77,6%
Possible Mine Operating Hours 100,0% 100,0% 100,0% 100,0% 100,0% 100,0% 100,0% 100,0% 100,0% 100,0% 100,0%
Equipment Utilization 84,4% 83,8% 84,4% 84,4% 84,4% 84,4% 84,4% 84,4% 84,4% 84,4% 83,8%
Factor for start up years 100% 100% 100% 100% 100% 100% 100% 100% 100% 100% 100%
Effective Operating Hours 6 182 5 918 6 678 6 678 6 678 6 737 6 678 6 678 7 296 6 477 5 335
SMU (Engine) Hrs / year 6 711 6 478 7 249 7 194 7 249 7 313 7 194 7 249 7 860 6 978 5 706
Average
Page 49
49
The effective operating hours are 5 335 hours per year. The nominal capacity of the
system with the two sizers is 12 000 tph and at 85% efficiency the expected
production rate is 10 200 tph. The annual capacity of the system is thus determined
at 10 200 tph x 5335 hrs giving an estimated annual capacity of 54.42 Mtpa.
Table 32: SMIPCC Owning Cost
Table 33: SMIPCC Loading Fleet Owning Cost
Table 34: SMIPCC Electrical Power Cost
Equipment Replacement Schedule Qty Life Hrs Op Hrs Service Life Capital Cost Annual Capital
Hrs Hrs/yr Yrs ZAR m ZAR m/yr
Sizer 2 100000 5335 19 394,53 21,05
Bench Link Conveyor 2 100000 5335 19 61,39 3,28
Bridge Conveyors 2 100000 5335 19 61,67 3,29
Bench Incline Conveyor 500m 2 100000 5335 19 25,63 1,37
Overland Conveyor 1000m 2 100000 5335 19 129,82 6,93
Waste Dump Incline Conveyor 1 100000 5335 19 23,09 1,23
Waste Dump Flat Conveyor 1200m 1 100000 5335 19 82,09 4,38
Spreader 2 100000 5335 19 260,20 13,88
Transporter 1 50000 1000 50 49,76 1,00
Crane 120t/150t 1 25000 1000 25 14,54 0,58
Excavator 2 Tonne 1 10000 2000 5 0,50 0,10
Bobcat 1 10000 2000 5 0,44 0,09
IT Loader 1 20000 2000 10 4,42 0,44
Maintenance Truck 2 15000 2400 6 3,66 0,59
Conveyor Side Lifting Truck 1 15000 2000 8 3,11 0,41
Rock Breaker 1 24000 4000 6 3,55 0,59
Track Dozer (D10 Class) 3 35000 4000 9 43,50 4,97
Truck & Lowbed 1 50000 2000 25 35,00 1,40
Pipe Layer Dozer 1 30000 2000 15 12,50 0,83
Belt reeler 1 20000 2000 10 4,43 0,44
Cable reeler 1 20000 4000 5 3,05 0,61
1 216,90 67,46
54,42
1,24
Total
Production Mtpa
Unit Owning Cost ZAR/t
Equipment Type Fleet Size Service Life Operating Hours Service Life Capital Cost Annual Capital
Hrs Hrs/yr Yrs ZAR m ZAR m/yr
P&H 4100 XPC 1 100 000 5 335 18,7 328,15 17,51
Komatsu PC8000 1 60 000 5 335 11,2 191,77 17,05
Komatsu 960E Trucks 9 60 000 5 335 11,2 658,40 58,54
Grader 16M 1 50 000 4 000 12,5 12,23 0,98
Komatsu WD600 Wheel Dozer 1 50 000 4 000 12,5 9,51 0,76
CAT 740 ADT Diesel Bowser 1 35 000 4 000 8,8 10,86 1,24
Komatsu HD785 Water Truck 1 45 000 4 000 11,3 17,43 1,55
CAT D10 Dozer 2 35 000 4 000 8,8 31,80 3,63
101,26
54,42
1,86
Total Cost ZARm/yr
Production Mtpa
Unit Owning Cost ZAR/t
Equipment Type Quantity Operating Power Operating Hours Power Consumption Cost
Kw Hrs/yr MwHr/yr ZAR m/yr
Sizer 2 1 800 5 335 19 206 18,44
Bench Link Conveyor 2 280 5 335 2 988 2,87
Bridge Conveyors 2 480 5 335 5 122 4,92
Bench Incline Conveyor 500m 2 1 125 5 335 12 004 11,52
Overland Conveyor 1000m 2 578 5 335 6 167 5,92
Waste Dump Incline Conveyor 1 578 5 335 3 084 2,96
Waste Dump Flat Conveyor 1200m 1 578 5 335 3 084 2,96
Spreader 2 600 5 335 3 201 3,07
6 019 54 854 52,66
54,42
0,97
Total
Production Mtpa
Unit Cost ZAR/t
Page 50
50
Table 35: Ancillary Equipment Fuel Cost
Table 36: SMIPCC System Maintenance Cost
Table 37: Ancillary Fleet Maintenance Cost
Equipment Type Quantity Operating Hours Fuel Consumption Cost
Hrs/year Ltr/Hr ZAR m/year
Transporter 1 1000 100 1,28
Crane 120t/150t 1 1000 30 0,38
Excavator 2 Tonne 1 2000 15 0,38
Bobcat 1 2000 10 0,26
IT Loader 1 2000 18 0,46
Maintenance Truck 2 2400 18 1,10
Conveyor Side Lifting Truck 1 2000 18 0,46
Rock Breaker 1 4000 25 1,28
Track Dozer (D10 Class) 3 4000 35 5,36
Truck & Lowbed 1 2000 15 0,38
Pipe Layer Dozer 1 2000 34 0,87
Belt reeler 1 2000 25 0,64
Cable reeler 1 4000 25 1,28
14,12
54,42
0,26
Total
Production Mtpa
Fuel Cost ZAR/t
Equipment Type Quantity Mtce Cost Machine Hours Mtce Cost
ZAR/Hr Hrs/yr ZAR m/yr
Sizer 2 6177 5335 65,90
Bench Link Conveyor 2 1544 5335 16,48
Bridge Conveyors 2 1544 5335 16,48
Bench Incline Conveyor 500m 2 1930 5335 20,60
Overland Conveyor 1000m 2 1544 5335 16,48
Waste Dump Incline Conveyor 1 3860 5335 20,60
Waste Dump Flat Conveyor 1200m 1 3860 5335 20,60
Spreader 2 1930 5335 20,60
197,71
54,42
3,63
Total
Unit Cost ZAR/t
Production Mtpa
Equipment Type Quantity Mtce Cost Machine Hours Mtce Cost
ZAR/Hr Hrs/yr ZAR m/yr
Transporter 1 1955 1000 1,96
Crane 120t/150t 1 782 1000 0,78
Excavator 2 Tonne 1 391 2000 0,78
Bobcat 1 335 2000 0,67
IT Loader 1 425 2000 0,85
Maintenance Truck 2 425 2400 1,02
Conveyor Side Lifting Truck 1 425 2000 0,85
Rock Breaker 1 670 4000 2,68
Track Dozer (D10 Class) 3 1331 4000 5,32
Truck & Lowbed 1 1761 2000 3,52
Pipe Layer Dozer 1 1034 2000 2,07
Belt reeler 1 559 2000 1,12
Cable reeler 1 559 4000 2,23
18,82
54,42
0,35
Total
Production Mtpa
Unit Cost ZAR/t
Page 51
51
Table 38: SMIPCC Loading and Hauling System Operating Cost
Table 39: SMIPCC System Labour Cost
Equipment Fleet Size Unit Op Cost Op Hours Op Cost
ZAR/hr Hrs/yr ZAR m/yr
P&H 4100 XPC 1 3 546 5 335 18,92
Komatsu PC8000 1 4 005 5 335 21,37
Komatsu 960E 9 2 972 5 335 142,69
Grader 16M 1 591 4 000 2,36
Komatsu WD600 Wheel Dozer 1 735 4 000 2,94
CAT 740 ADT Diesel Bowser 1 535 4 000 2,14
Komatsu HD785 Water Truck 1 751 4 000 3,00
CAT D10 Dozer 2 1 230 4 000 9,84
203,26
54,42
3,74
Total Cost ZARm/yr
Production Mtpa
Unit Cost ZAR/t
IPCC Component Manning Level CTC CTC
ZAR/yr ZAR m/yr
Supervisor 4,0 491 448 1,97
Control Room Operator 4,8 280 201 1,34
Crusher Station Attendant 4,8 280 201 1,34
Spreader Attendant 4,8 280 201 1,34
Belt Attendant 4,8 280 201 1,34
Mechanical Artisan 4,0 470 564 1,88
Electrical Artisan 4,0 470 564 1,88
Assistants 4,8 222 352 1,07
Sub Total 12,18
Ancillary Equipment Operators
Transporter - 222 352 -
Crane 120t/150t 4,0 222 352 0,89
Excavator 2 Tonne 4,0 222 352 0,89
Bobcat 4,0 222 352 0,89
IT Loader - 222 352 -
Maintenance Truck 4,0 222 352 0,89
Conveyor Side Lifting Truck 4,0 222 352 0,89
Rock Breaker - 222 352 -
Track Dozer (D10 Class) 12,0 222 352 2,67
Truck & Lowbed - 222 352 -
Pipe Layer Dozer - 222 352 -
Belt reeler 4,0 222 352 0,89
Cable reeler - 222 352 -
8,00
Total 72 20,18
54,42
0,37
Sub Total
Production Mtpa
Unit Cost ZAR/t
Page 52
52
Table 40: SMIPCC Loading and Hauling System Labour Cost
The Owning and Operating Cost of the Semi Mobile IPCC system is therefore made
up of the following sub categories
IPCC System Owning Cost ZAR 1.24/t
IPCC System Maintenance Cost ZAR 3.98/t
IPCC System Energy Cost ZAR 1.23/t
IPCC System Labour Cost ZAR 0.37/t
Loading and Hauling System Owning Cost ZAR 1.86/t
Loading and Hauling System Operating Cost ZAR 3.74/t
Loading and Hauling System Labour Cost ZAR 0.70/t
The Owning and Operating Cost for the operation is thus estimated at ZAR 13.12/t in
2014 terms.
Chapter 4: Analysis and Benchmarking
4.1 Truck and Shovel System
Planning and Design
Experience at Sishen mine has shown that there is a well developed planning
approach for the Truck and Shovel system. High productivity can be achieved by
ensuring that the haul roads and ramp systems are properly designed and
maintained. Simulations are also important in determining the equipment
Equipment Ratios Manning Level CTC Total CTC
ZAR/yr ZAR m/yr
Operators Primary Equip 4,8 53 280201 14,79
Operators Support Equip 4,8 29 222352 6,40
Maintenance Operators 1,0 17 222352 3,78
Artisans- Primary Equipment 2,0 22 470564 10,35
Artisans- Support Equipment 1,0 6 470564 2,82
127 38,15
54,42
0,70
Total Cost ZARm/yr
Production Mtpa
Unit Cost ZAR/t
Page 53
53
requirements and system capabilities taking into account the impact of increasing pit
depth as well as traffic density on the haul roads and ramps. The haul roads and
ramp systems are dependent on the pit layout. High productivity is also influenced by
the shovel dig rates which depend largely on the fragmentation of the material.
Pit Layout
Figure 11: Sishen North Pit (GR80/GR50 Area) – Sishen 2013
Figure 12: Sishen Pit Cross Section – Sishen 2013
North
Page 54
54
The pit layout shown above in figure 10 and 11 indicates that the pit deployment is
based on targeting the ore areas through a system of permanent and temporary
ramps to the bench faces with multi levels and faces being mined at the same time.
This is done after the overlying waste has been stripped. The waste stripping is done
in phases called pushbacks which last about three years. Mining in the upper levels
has been easier with a lot of flexibility in terms of areas to open up for ore. However,
currently and going forward, to access the dipping ore in the deeper part, that
flexibility is diminished. There is one possible schedule or mining sequence that has
to be followed to access the next easy ore while ensuring life of mine sustainability.
This involves mining high tonnages from a confined area, a few loading faces with a
high rate of vertical advance so as to quickly get to the deep lying ore. This prompted
the mine to change to bigger high capacity equipment, such as the following:-
P&H 2300 rope shovels being replaced by P&H 2800 and 4100 rope shovels.
Demag 285 hydraulic shovels replaced by Komatsu PC8000, Liebherr 996 and
9800 hydraulic shovels.
CAT994 /Komatsu WA1200 front-end loaders replaced by Le Tourneau L2350
front-end loaders.
Komatsu 730E trucks replaced by Komatsu 960E trucks.
Although the larger equipment provides high capacity and a smaller fleet, they
require larger operating space, and wider haul roads and ramps.
Skills
The truck and shovel fleet for the designated area requires an average of 231
operators, including a 20% over compliment, over the life of the project to sustain a
24 hour operation.
Operator training includes theoretical as well as simulator training on the particular
equipment before any field training begins. The field training requires a minimum of
580 hours including 130 hours observing an experienced operator in the field and
450 hours of operating under supervision by an experienced operator. Operating a
truck is not a complicated skill and this in-house training programme mentioned
above has proved to be adequate.
Page 55
55
The challenges currently being experienced are related to staff retention and the
sheer numbers of trainee operators that have to be taken through the programme in
the ramp up phase. The average age of the truck operator is getting younger and the
minimum requirement is for them to have at least a high school qualification. These
are ambitious young people who are hoping to have a career on the mine and
advance within a short time, and thus are impatient and always looking for
alternative career opportunities if they do not progress on the mine.
Automating the truck and shovel system is currently receiving a lot of focus, but the
business case is proving to be a challenge to develop since the automated trucking
technology is not cheap relative to manning the trucks in the developing world of
which South Africa is part of. However, once the technology has been well proven
and costs come down, this would create an opportunity for more efficient and safer
truck and shovel operations.
Maintenance of the equipment requires 84 qualified artisans. Skilled artisans are
scarce in the country currently and training takes time.
Setting up a Truck and Shovel operation does not require as much supplier support
as the IPCC system would due to experience that has been acquired over the years.
Efficiency
Productivity is influenced by direct operating hours, the effective hours when the
equipment is performing the intended duty and operational efficiency which depend
on the operator skill and prevailing conditions such as haul roads or working areas.
There has been challenges with achieving the planned productivity with the truck and
shovel system at the mine. Details are shown in table 10 below.
Table 41: Ultra-class Electric Rope Shovel- P&H 4100XPC Benchmarks, Targets and Actual
performance per annum
GBI 95th Percentile LOM Target 2014 YTD
Direct Operating Hours 6357 6357 4964
Production Dig Rate (tph) 7683 6221 3127
Annual Production (tonnes) 48.8Mt 36.6Mt 18Mt
GBI – GBI Mining Intelligence.
Page 56
56
LOM – Life of Mine
YTD – Year- to-date (annualised)
The results above indicate that although the truck and shovel system appears to be
simple, it is not always easy to set up to achieve maximum benefits. The main issues
identified were that the direct operating hours were difficult to achieve due to
frequent stoppages due to blasting in an increasingly confined pit relative to the
equipment size. Bucket fill factors were also not optimum due to blasting
fragmentation issues leading to lower dig rates. Simulation results demonstrate
diminishing returns in terms of system productivity as more trucks are added to the
system. This is due to truck queuing and bunching as numbers increase. Operational
set up requires modification to suit the ultra-class equipment and the operational
philosophy should be one that treats the shovel and truck fleet as a unit including the
mining support equipment such as graders, dozers and water trucks. Big blasts need
to be adopted and operating space increased. Dedicated routes separated from the
rest of the traffic would also be imperative. These are conditions that an IPCC
system would also require.
Material Type
Productivity is also affected by the shovel dig rate which in turn is influenced by
fragmentation from blasting. Blasting design is largely influenced by rock
characteristics and therefore by material type.
The objective of blasting waste material is to reduce the material to a particle size
that can be loadable by the equipment applied. Poor fragmentation results in poor
dig rates and therefore lower productivity. Although big boulders would also make it
difficult to build properly laid out waste dumps, however, no further processing of the
material would be required unlike in the case of the IPCC system.
Page 57
57
Safety and Health
Figure 13: Sishen High Potential Truck Incidents- 2013
At the time of writing this report, there has not been a fatal accident at Sishen mine
in 2013. However there were thirty nine high potential incidents at the mine so far in
2013 which could have resulted in a fatality. Twenty five of these incidents involved
truck haulage.
The captions above depict some of the high potential incidents involving trucks at
Sishen mine from January 2013 to end of November 2013. These include:-
truck colliding with truck in front (dove tailing),
trucks veering off the haul road due to operator fatigue,
head on collisions at intersection,
truck losing control and overturning,
truck catching fire while travelling,
collision at park up area,
Page 58
58
truck driving over lighter vehicle,
truck driving over spillage on the haul road,
Run-away truck due to brake failure on the ramp.
Historically, there has been a fatal accident on the mine every year on average in the
past ten years and 90% of those have been from truck incidents.
There is a huge continuous focus on safety and health which demands a lot of
management effort and resources. Interventions include:-
Supervision (dealing with many individual components e.g. each truck).
Fatigue management.
Health monitoring (e.g. hypertension, diabetes, alcohol and drug testing).
Technological enhancements (e.g. collision awareness devices, blind spot
cameras on trucks, fatigue monitors inside truck cabs).
Training (continuous, task observations).
Dust suppression
Given these challenges and the required interventions, Health and Safety becomes
critical in comparing the two systems. The other issue of the environment that may
become critical in the future is the carbon footprint. South African electrical power
supply is from largely from coal fired stations and the mobile equipment on the other
hand also uses a lot of diesel.
Costs
The cost of the Truck and Shovel system is estimated ZAR 4.39/t owning cost and
ZAR 11.41/t operating cost.
A new state of the art workshop including a tyre handling facility and a bucket and
bowel section has since been constructed at a cost of ZAR 1400M to cater for a fleet
that will move 298 Mtpa at peak. On a pro-rata basis therefore, for 55Mtpa fleet,
infrastructure cost would be ZAR 258M in 2014 terms. On the other hand the IPCC
system would require a power reticulation system to be installed at a cost as well.
The cost of housing was not included in the economic evaluations but the mine is
currently constructing housing for its employees as part of the requirements of the
Mining Charter (South Africa Legislation). The manning requirement for the Truck
and Shovel option including operators, supervisors and maintenance personnel is
Page 59
59
368. The Fully Mobile IPCC system would require 128 people and the Semi Mobile
IPCC would have a labour compliment of 203 employees.
It currently cost above ZAR 1M to provide housing for an operator and therefore
additional housing cost of the truck and shovel option would be at least ZAR 165M
above the IPCC options.
Cost therefore would be a one of the key distinguishing feature between the two
systems
Flexibility
The truck and shovel system is generally more flexible than the IPCC system in that
smaller sub units can be created in the form of several loading faces at the same
time and even multiple routes and dump points. The units consisting of mainly a
shovel and support equipment and trucks allocated to it can also be easily moved
from one area of the mine to another.
The unit can also carry on operating though sub-optimally if one of the components,
other than the shovel, is down such as a truck or a piece of support equipment.
In the event of down scaling operations, smaller sub-units can be decommissioned
at a time and even sold as single units such as trucks thus enabling some of the
capital to be salvaged. A wholesale disposal of a whole unit of an integrated system
would be a challenge especially since these integrated systems are usually custom
designed for a particular operation.
The truck and shovel system enables pre-stripping to be maintained just ahead of
ore extraction thus limiting the impact of economic down turns by limiting
commitment of capital.
In the case of Sishen, however, this flexibility has become quite limited in that as the
pit is getting deeper and more constrained, there is not much room to change the
mining sequence without negatively affecting the business plan. This negates the
advantage that the Truck and Shovel system would have over the IPCC in terms of
flexibility on projects such as Sishen.
Page 60
60
4.2 In-pit Crushing and Conveying
Planning and Design
Complete planning and design was done by the three consultants engaged by
Sishen mine, Snowden, Sandvik and SKM. Technical viability was demonstrated. A
different approach to opening up the mine would need to be taken. Bigger push
backs, straighter and longer pit walls would assist in making the IPCC system more
efficient by limiting the crusher and conveyor moves. This would entail more pre-
stripping for future ore and thus upfront commitment of capital. The layout of the pit
can therefore make or break the project.
Skills
Sishen mine once operated a semi mobile in-pit crushing and conveying for waste.
This was however a long time ago and the crusher and conveyor belts were never
moved from their initial position since installation. This system was later converted to
an ore crushing and conveying system with the crusher still maintaining its initial
position in the pit which is now quite high up relative to the final pit bottom.
The skills required to operate the IPCC system do exist on Sishen mine from the
processing plant where crushers and multitudes of conveyors are used to handle the
ore from the pit and spreaders used to dump the discard after processing the ore.
These skills would need to be transferred to the mining personnel.
Skills that would need to be developed would be for planning and design as well as
for the conveyor and crusher moves. Sourcing of these skills could be a challenge
since there are not that many such systems currently operating in the region.
The manning levels for the IPCC systems are less than those of a truck and shovel
operation thereby reducing the burden of training of operators. The proposed
FMIPCC system requires 94 operators and 18 artisans and the SMIPCC would
require 137 operators and 36 artisans. The equivalent Truck and Shovel system
would require 231 operators and 84 artisans by comparison. The required level of
skill of the IPCC operators is also not as high as that of shovel or truck operator and
therefore the training is quicker and easier.
The whole IPCC system can be more easily automated and centrally controlled
using PLC and SCADA technology thereby limiting the dependency on operator
interventions.
Page 61
61
Maintenance of an IPCC would be easier to manage through real time diagnostics
due to advances in control systems for such plants.
Setting up an IPCC operation would require expert support from the supplier due to
limited experience on such systems in the region. The supplier may need to move
the necessary skills from other parts of the world to assist in the installation and start
up.
Although there may be challenges in the acquisition of skills, this does not appear to
be insurmountable.
Efficiency
One of the biggest challenges that have been highlighted in terms of operational
efficiency of the IPCC systems is that of achieving the required direct operating
hours. This is due to the fact that the system from the crusher to the spreaders is
integrated and therefore if one component is down then the whole system is down.
Major equipment moves which are necessary from time to time, such as crusher and
conveyor relocations, tend to take a lot of time thus reducing the annual operating
hours of the system.
As in the case of the Truck and Shovel operation, fragmentation of the material and
therefore material type also affects productivity.
Material Type
The availability of a suitable crusher in a fully or semi mobile configuration for the
type of material concerned is critical in the consideration of evaluating the IPCC
system
The tables below show typical industry targets. Rock strength determines the
crusher type that can be used and the throughput that can be achieved.
Page 62
62
Table 42: FMIPCC Capacities- Morriss 2013
Table 43: SMIPCC Capacities– Morriss 2013
Safety
IPCC systems are relatively much safer than the truck and shovel set up. At Sishen
mine, there has not been a single fatal accident involving crushing, conveying and
stacking in the ore processing based on the accident records dating back to more
than ten years ago. Less than 10% of the high potential incidents have occurred in
the crushing, conveying and stacking systems of the processing plant compared to
the more than 90% involving trucks and shovels in the pit. Transport and Machinery
has been identified by the South African mining industry as one of the main hazard
areas in the mining industry. Issue of health and fatigue are also more manageable
in the IPCC system due to the fact that operators are not on board the moving
Page 63
63
equipment such as conveyors unlike in the Truck and Shovel system where
operators have to be on board the trucks.
Costs
The cost estimates are as shown in table 45 below.
Table 44: Cost Summary
Cost Truck and Shovel FMIPCC SMIPCC Initial Capital ZAR m 1675 2248 2477 Owning Cost ZAR/t 4.39 2.41 3.10 Operating Cost ZAR/t 11.41 7.97 10.02 Total ZAR/t 15.80 10.38 13.12
Both the Owning and Operating cost for the IPCC options are lower over the life of
the project than the Truck and Shovel option in this case. The initial capital for the
Truck and Shovel system is lower due to the fact that the truck fleet starts lower at
13 trucks and ramps up gradually to 21 by the end of the project as the pit deepens.
There are truck and support equipment replacements in the course of the project. In
the case of the IPCC system, the most of the equipment is purchased at the start of
the project but lasts till the end of the project with only support equipment being
replaced during the life of the project.
The cost estimates indicate that the IPCC system is more cost effective over the life
of the project for a high volume long life project such as the Sishen case. The initial
capital expenditure is higher than the Truck and Shovel option. Cost is therefore a
major consideration due to the different cost profile that each system has.
Flexibility
IPCC systems are generally less flexible than the truck and shovel system because
the following:
Require more operational space which takes time to establish.
Relocations need to be kept at a minimum because they consume operating
time.
They not suited to handling varying material types because the equipment
selection is very much linked to the material being handled e.g. crusher type.
The system components are not sub-divisible such as in the case of trucks
which can be moved around and re-allocated to other shovels.
Page 64
64
This inflexibility is not significant in the case of a deep pit that is confined and from
which huge volumes have to be moved at a time. Options are limited and even in the
case of a truck and shovel operation, loading areas are limited and both systems
operate in a similar fashion the IPCC system having any advantage in terms of
steady throughput.
Chapter 5: Score Card
Evaluation of either the Truck and Shovel system or the IPCC system requires time
and money. A preliminary evaluation method that eliminates one system in favour of
the other even before a lot of work is put into a study would be useful. This may not
always be easy if both systems are both suitable given that there are always
advantages and disadvantages in each system in any given situation.
The approach taken in this research was to evaluate quantitatively and qualitatively
the Truck and Shovel system as well as the IPCC system using some general
criteria commonly applied to mining method evaluations namely:
Planning and Design
Skills
Efficiency
Safety
Costs
Flexibility
The analysis of these factors has highlighted four major areas which can be
focussed on to arrive at some informed decision on which system to take further for
detailed evaluation. These areas are cost, pit layout, material types and
occupational health and safety.
Cost
For a mining project to be viable, costs should be kept a low as possible. This is due
to the fact that mining companies are usually price takers and mineral commodity
prices are cyclic. For any mining project, it is therefore critical to be located on the
lower end of the producer cost curve relative to competitors so that in times of
commodity price recession, the project can remain viable. Technologies that support
Page 65
65
a low cost operation over a long period are therefore more favourable. Investing in
technology requires capital and capital investments require long project life to realise
the full economic benefit. Economies of scale also do apply and therefore high
volume systems tend to be more economic. For example, the Ulan Coal (Australia)
Fully Mobile IPCC unit was discontinued due to the fact that it was handling low
volumes of 2300 tonnes per hour, was maintenance intensive and required frequent
relocations. It therefore became uneconomic to run. A typical IPCC system handles
around 10 000 tonnes per hour.
Other cost drivers include energy and labour costs, hauling distances, operational
efficiencies including skills, as well as supporting infrastructure such as workshops.
Pit Layout
The way the pit is deployed is dependent on the nature of the ore body and the pit
optimisation process. For the Truck and Shovel system, ramp and dump locations
need to be established and have a direct impact on productivity. The volume to be
mined from a specific area at a particular time determines the type and number of
equipment that can be applied. In confined pit conditions, high capacity machines
and less equipment numbers would be suitable to avoid congestion and achieve the
required productivity. In shallow and wide pits with many loading area options, a
more flexible system that can be quickly relocated would be ideal.
Material Types
The number and type of material to be handled, be it over burden, general waste or
ore, is critical in determining a suitable materials handling system. Crushing waste or
overburden for conveying is usually a concern since it is an additional cost that is
avoided in a truck and shovel set up. Conveying is, however, more efficient and
cheaper when distances are long and the pit depths are significant.
Crushers are selected on the basis of the material to be crushed. The capabilities
and throughput of the crusher depends on material properties such as strength,
abrasiveness, moisture content, etc. It is therefore desirable to have limited material
types for the IPCC system because the crusher selection is dependent on the
properties of the material. Truck and shovel systems usually accommodate material
type variations.
Page 66
66
Occupational Health and Safety
Employee safety and health has become very prominent and critical in mining
projects and have to be considered in the planning stage. Environmental issues are
also catching up with sustainable mining having become a catch phrase. In deciding
what system of handling material from the pit to apply, these factors have to be taken
into consideration as they can threaten the licence to operate. In the South African
context, there has been increased focus on eliminating fatalities on the mines with
transport and machinery having been identified as one of the main contributors to
mine accidents. For a large operation where high volumes are moved, this can
potentially be a challenge to sustainable mining especially where equipment fleets
are likely to be huge in the case of a truck and shovel system.
Chapter 6: Conclusion and Recommendation
Results from this research indicate that they are cases in which either the Truck and
Shovel system or the IPCC system can be applied to move material from a pit
although with different cost profiles and safety and health risks. The cost profiles
would depend on the required production rate, the distance from the loading to the
dumping points and the life of the project. The costs would have to be determined
including the initial capital for a comparison to be made. There are also cases where
the IPCC system would not be viable due to practical considerations which include
material type with respect to the availability of crushing systems that would achieve
the required throughput or a pit layout that would render it impossible to fit in an
IPCC system.
The table below summarises the four criteria that can be used for evaluating the two
systems including typical characteristics of each system.
Page 67
67
Table 45: Evaluation Criteria
Criteria Drivers Characteristics
Truck & Shovel IPCC
Material type Material variations
Material type volumes
-Accommodates
material variations
- Requires less material
variations.
-Requires high volumes
of target material type
Pit Layout Pit extent
Permanent ramps
Dump locations
-Several Loading points
-Nearby dumping
-Easier ramp
development
-Concentrated mining.
-Far dumping locations.
-Less ramp relocations
Occupational
Health and
Safety
Equipment interactions
Dust and fumes
-Has more equipment
interactions
-More dependent on
human action.
-Fatigue challenges
-Safety supervision
challenges
-More control
-Less human
interference
Cost Mine life
Volumes
Hauling distance
Access to Capital
Energy cost
Labour cost
Efficiencies
Skills
Supporting infrastructure
-Medium to long life.
-Any volume
-More labour
-Lower efficiency with
increasing volume.
-Phased capital
-Long life
-High volumes
-Lower operating cost
-High initial capital cost
-Distant dump points
-Less flexible
The criteria would be applied to the Sishen case as follows:-
Material Type
There were only two targeted waste material types which are clay and calcrete in
sufficient high volumes per area per period. The target was 55 Mtpa. Both the Truck
and Shovel and the IPCC system could be considered in this regard.
Pit Layout
Practical pit layout designs done showed that both systems could be accommodated
over the life of the project. Both systems are faced with similar challenges as the pit
goes deeper and the operating space becomes minimum significantly reducing
flexibility in terms of loading areas. No one system had an advantage over the other
over the life of the project in this aspect.
Page 68
68
Occupational Health and Safety
The IPCC system has an advantage over the Truck and Shovel system in this
regard. There has been safety challenges posed by the truck and shovel system due
to the large fleet size and increased interactions in a confined pit. However, through
the various mine interventions such as the fatigue management system, the safety
and health risk posed by the Truck and Shovel option has been minimised.
Cost
Given that neither of the two systems can be eliminated on the basis of the three
criteria above, a cost evaluation of both systems would therefore be necessary. The
average Owning and Operating Costs over the life of the project till 2030,
disregarding salvage value, escalation and discounting, were estimated as follows:-
Table 46: Cost Comparisons
Cost Truck and Shovel FMIPCC SMIPCC Production Potential Mt 1029 907 870 Initial Capital ZAR m 1675 2248 2477 Total Capex ZAR m 4516 2186 2698 Owning Cost ZAR/t 4.39 2.41 3.10 Operating Cost ZAR/t 11.41 7.97 10.02 Total ZAR/t 15.80 10.38 13.12
The IPCC options in this case are more economically viable than the Truck and
Shovel option. The availability and cost of capital might still make the Truck and
Shovel option more favourable due to its lower initial capital with the first equipment
replacements coming in after eight years of operation. In an environment where
capital is available at low cost then the IPCC system would be the preferred option.
Given the above observations, it would be recommended to take the following
approach in evaluating a system to handle broken material from the pit to the
dumping locations.
The first step would be to examine the characteristics of the project to see if both the
IPCC system configurations can readily be eliminated on the basis of material types
and pit layout using the characteristics listed in table 46. If viable then make a high
level evaluation of both Truck and Shovel and the IPCC systems to compare them
on the basis of cost. Occupational Safety and Health issues would then need to be
taken into consideration. This process would then enable the decision on whether
Page 69
69
both systems or only the Truck and Shovel option can be taken forward for a more
detailed study at the appropriate level of accuracy depending on the project study
phase. This approach assumes that the Truck and Shovel option would always be
part of the evaluation as the base case. However there are cases when this option is
not possible such as when the operation is located in difficult terrain with dumps
located across steep gorges or when the mine is located in environmentally sensitive
areas that restrict haul roads.
Page 70
70
References
1. Borowitsh, Z. Prof, Mechanized Earthmoving - Equipment, Technology and
Management, University of Witwatersrand course, 2011.
2. Burt, C, Caccetta, L, Hill, S and Welgama, P. Models of Mining Equipment
Selection,2005.
3. Burt, C and Caccetta, L. Equipment Selection for Surface Mines: A Review,
2014. http://www.optimization-online.org/DB_FILE/2013/04/3831.pdf.
4. Caterpillar Inc. Performance Metrics for Mobile Mining Equipment, 2005
5. Caterpillar Inc. Evaluating a Mining Operation, 2002.
6. International Mining. In-Pit Crushing & Conveying – Insights from IPCC 2012.
http://im-mining.com/2013/01/02/in-pit-crushing-conveying-insights-from-ipcc-
2012/.
7. Hustrulid, W and Kutcha, M. Open Pit Mine Planning & Design (2nd Edition):
Pp95-158.
8. May, M.A. Application of Queuing Theory for Open-Pit Truck/Shovel Haulage
Systems, 2012.
http://vtechworks.lib.vt.edu/bitstream/handle/10919/19218/May_MA_T_2013.p
df?sequence=1
9. Morris, P. Key Production Drivers in In-Pit Crushing and Conveying Studies.
Surface Mining 2008.
http://www.saimm.co.za/Conferences/SurfaceMining2008/023-
034_Morriss.pdf.
10. In-Pit Crushing and Conveying Projects. IM International, 2013. http://im-
mining.com/2013/07/01/in-pit-crushing-conveying-projects/
11. Snowden Mining Consultant, Can in pit crushing and conveying systems
improve your open pit mining operation?
http://www.snowdengroup.com/technical-articles/2015/04/20/can-in-pit-
crushing-and-conveying-systems-improve-your-open-pit-mining-operation.
12. G.H. Spriggs, In Pit crushing considerations for conveying and materials
handling systems. http://www.beltcon.org.za/docs/b1313.pdf.
13. Chadwick, J. New IPCC Ideas
http://www.infomine.com/library/publications/docs/InternationalMining/Chadwi
ck2010w.pdf.
Page 71
71
14. In Pit Crushing and Conveying- IPCC Systems
http://www.goldorecrusher.com/malaysia-manufacturers/malaysia-mobile-
ipcc-systems/.
15. RWE Technology International. In Pit Crushing and Conveying,
http://www.rwe.com/web/cms/en/1630930/rwe-technology-
international/mining-services/ipcc/.
16. Fotakis, D. and Broomfield, J. Sishen North Mine (GR80/GR50) Waste
Pushback Planning PFS, Snowden, 2008.
17. Morriss, P. Turnbull, D. and Hill, J. Sishen Mine IPCC Review Scoping Study-
In-pit Waste Crushing and Conveying, 2008
18. Sinclair Knight Merz, Sishen Mine –GR50, GR80 Pushback Pre-feasibility
Study, 2008.
19. Ercelebi, S.G. and Bascetin, A. Optimisation of shovel-truck system for
surface mine, 2009.
20. Moore, P. The Road to IPCC, International Mining magazine, May 2012.
21. Schroder, Detlev L. The use of in-pit crushing and conveying methods to
significantly reduce transportation costs by truck, Coal Trans -June 2003.
22. Tutton, D. and Streck, W. The Application of In-pit crushing and conveying in
large, hard rock open pit mines, October 2009.
23. Atchison, T. and Morrison, D. In-pit Crushing and Conveying Bench
Operations, Iron Ore Conference, July 2011.
24. Ta, C.H., Ingolfsson, A., Doucette, J. Haul Truck Allocation via Queuing
Theory, October 2010.
25. Anglo American Group. IPCC Workshop - Johannesburg, March 2013.
26. Kumba Iron Ore Company. HME Capex Source Workbook, 2013.
27. Kumba Iron Ore Company. HME LCC Source Workbook, 2013.
28. Kumba Iron Ore Company. Macro Economic Indicators, 2014.
29. U.S Bureau of Labor Statics. PPI Detailed Report, 2011.
30. U.S Bureau of Labor Statics. PPI Detailed Report, 2012.
31. U.S Bureau of Labor Statics. PPI Detailed Report, 2013.
32. Komatsu. Specifications & Application Handbook, Edition 31, 2013. Pp 661-
720; 373-398.
33. P&H. 4100XPC Electric Mining Shovel Operating Specification, 2011.
Page 73
73
Appendix 1
Talpac Truck/Shovel Simulation Results
Production Summary - Full SimulationHaulage System: GR80_2016_Rev Haul Cycle: [PRJ] Haul Cycle_GR80_2016
Material: [PRJ] Oher Waste GR80 Roster: [PRJ] GR80_5339_OpHrs
Loader [PRJ] P&H 4100 XPC (AC)-Cost_GR80
Availability % 85,00
Bucket Fill Factor 0,81
Average Bucket Load Volume cu.metres 49,08
Average Payload tonne 101,66
Operating Hours per Year OpHr/Year 5 339,25 Op. hrs factored by availability
Average Operating Shifts per Year shifts/Year 567,00 Shifts factored by availability
Average Bucket Cycle Time min 0,72
Production per Operating Hour tonne 5 893,85
Production per Loader Operating Shift tonne 55 500 Max. prod. based on 100% avail.
Production per Year tonne 31 468 732 Avg. production factored by avail.
Wait Time per Operating Hour min 3,35
Truck [PRJ] KOMATSU 960 E-2K (3500hp)_GR80_Cost
Availability % 100,00
Payload in Template tonne 326,60
Operating Hours per Year OpHr/Year 5 339,25
Average Payload tonne 304,88
Production per Operating Hour tonne 453,37
Production per Loader Operating Shift tonne 4 269
Production per Year tonne 2 420 672
Queue Time at Loader min/ Cycle 3,12
Spot Time at loader min/ Cycle 0,75
Average Loading Time min/ Cycle 1,43
Travel Time min/ Cycle 23,94
Spot Time at Dump min/ Cycle 0,80
Average Dump Time min/ Cycle 1,00
Average Cycle Time min/ Cycle 31,05
Fleet Size 13
Average No. of Bucket Passes 3,00
Haulage System
Production per Year tonne/Year 31 468 732
Run Fleet Production Production Loader Truck Avg. Cycle Truck Production Truck Avg. Load
No. Fleet Size Per Year Change Production Per Oper. Hour Time Per Oper. Hour Queue Time
tonne % tonne min tonne min
1 1,00 2 684 147,32 0,00 502,72 27,93 502,72 0,00
2 2,00 5 341 881,21 99,02 1 000,49 28,08 500,25 0,15
3 3,00 7 918 431,53 195,01 1 483,06 28,26 494,35 0,32
4 4,00 10 511 869,65 291,63 1 968,79 28,43 492,20 0,51
5 5,00 13 116 118,65 388,65 2 456,55 28,63 491,31 0,70
6 6,00 15 598 905,57 481,15 2 921,55 28,81 486,93 0,89
7 7,00 18 095 601,42 574,17 3 389,17 29,03 484,17 1,11
8 8,00 20 498 381,95 663,68 3 839,19 29,26 479,90 1,34
9 9,00 22 921 123,63 753,94 4 292,95 29,49 476,99 1,56
10 10,00 25 157 088,34 837,25 4 711,73 29,80 471,17 1,87
11 11,00 27 397 575,48 920,72 5 131,35 30,14 466,49 2,22
12 12,00 29 530 436,32 1 000,18 5 530,82 30,53 460,90 2,61
13 13,00 31 399 664,19 1 069,82 5 880,91 31,12 452,38 3,19
14 14,00 32 892 405,14 1 125,43 6 160,49 32,00 440,04 4,08
15 15,00 33 618 785,71 1 152,49 6 296,54 33,67 419,77 5,74
16 16,00 33 817 389,33 1 159,89 6 333,73 35,74 395,86 7,82
17 17,00 34 009 466,38 1 167,05 6 369,71 37,90 374,69 9,97
18 18,00 34 156 445,99 1 172,53 6 397,24 39,99 355,40 12,06
19 19,00 34 320 827,12 1 178,65 6 428,02 42,11 338,32 14,19
Page 74
74
Production Summary - Full SimulationHaulage System: GR80_2017_Rev Haul Cycle: [PRJ] Haul Cycle_GR80_2017
Material: [PRJ] Oher Waste GR80 Roster: [PRJ] GR80_5339_OpHrs
Loader [PRJ] P&H 4100 XPC (AC)-Cost_GR80
Availability % 85,00
Bucket Fill Factor 0,81
Average Bucket Load Volume cu.metres 49,09
Average Payload tonne 101,67
Operating Hours per Year OpHr/Year 5 339,25 Op. hrs factored by availability
Average Operating Shifts per Year shifts/Year 567,00 Shifts factored by availability
Average Bucket Cycle Time min 0,72
Production per Operating Hour tonne 6 031,29
Production per Loader Operating Shift tonne 56 795 Max. prod. based on 100% avail.
Production per Year tonne 32 202 551 Avg. production factored by avail.
Wait Time per Operating Hour min 2,30
Truck [PRJ] KOMATSU 960 E-2K (3500hp)_GR80_Cost
Availability % 100,00
Payload in Template tonne 326,60
Operating Hours per Year OpHr/Year 5 339,25
Average Payload tonne 304,96
Production per Operating Hour tonne 430,81
Production per Loader Operating Shift tonne 4 057
Production per Year tonne 2 300 182
Queue Time at Loader min/ Cycle 3,69
Spot Time at loader min/ Cycle 0,75
Average Loading Time min/ Cycle 1,43
Travel Time min/ Cycle 24,98
Spot Time at Dump min/ Cycle 0,80
Average Dump Time min/ Cycle 1,00
Average Cycle Time min/ Cycle 32,66
Fleet Size 14
Average No. of Bucket Passes 3,00
Haulage System
Production per Year tonne/Year 32 202 551
Run Fleet Production Production Loader Truck Avg. Cycle Truck Production Truck Avg. Load
No. Fleet Size Per Year Change Production Per Oper. Hour Time Per Oper. Hour Queue Time
tonne % tonne min tonne min
1 2,00 5 141 326,46 0,00 962,93 29,13 481,47 0,16
2 3,00 7 666 397,63 49,11 1 435,86 29,29 478,62 0,33
3 4,00 10 142 915,12 97,28 1 899,69 29,48 474,92 0,51
4 5,00 12 616 728,25 145,40 2 363,02 29,64 472,60 0,68
5 6,00 15 050 060,14 192,73 2 818,76 29,85 469,79 0,89
6 7,00 17 426 917,48 238,96 3 263,93 30,06 466,28 1,10
7 8,00 19 743 261,04 284,01 3 697,76 30,28 462,22 1,32
8 9,00 22 083 451,49 329,53 4 136,06 30,53 459,56 1,57
9 10,00 24 302 125,97 372,68 4 551,60 30,84 455,16 1,87
10 11,00 26 516 741,66 415,76 4 966,38 31,10 451,49 2,14
11 12,00 28 528 317,80 454,88 5 343,13 31,49 445,26 2,53
12 13,00 30 564 586,91 494,49 5 724,51 31,94 440,35 2,97
13 14,00 32 196 693,90 526,23 6 030,19 32,64 430,73 3,68
14 15,00 33 322 556,99 548,13 6 241,06 33,90 416,07 4,93
15 16,00 33 653 183,64 554,56 6 302,98 35,84 393,94 6,88
16 17,00 33 841 539,33 558,23 6 338,26 38,00 372,84 9,04
17 18,00 34 026 556,50 561,82 6 372,91 40,10 354,05 11,14
18 19,00 34 174 345,09 564,70 6 400,59 42,21 336,87 13,25
19 20,00 34 343 300,78 567,99 6 432,23 44,31 321,61 15,34
Page 75
75
Production Summary - Full SimulationHaulage System: GR80_2018_Rev Haul Cycle: [PRJ] Haul Cycle_GR80_2018
Material: [PRJ] Oher Waste GR80 Roster: [PRJ] GR80_5339_OpHrs
Loader [PRJ] P&H 4100 XPC (AC)-Cost_GR80
Availability % 85,00
Bucket Fill Factor 0,81
Average Bucket Load Volume cu.metres 49,09
Average Payload tonne 101,67
Operating Hours per Year OpHr/Year 5 339,25 Op. hrs factored by availability
Average Operating Shifts per Year shifts/Year 567,00 Shifts factored by availability
Average Bucket Cycle Time min 0,72
Production per Operating Hour tonne 5 761,21
Production per Loader Operating Shift tonne 54 251 Max. prod. based on 100% avail.
Production per Year tonne 30 760 542 Avg. production factored by avail.
Wait Time per Operating Hour min 4,15
Truck [PRJ] KOMATSU 960 E-2K (3500hp)_GR80_Cost
Availability % 100,00
Payload in Template tonne 326,60
Operating Hours per Year OpHr/Year 5 339,25
Average Payload tonne 304,90
Production per Operating Hour tonne 443,17
Production per Loader Operating Shift tonne 4 173
Production per Year tonne 2 366 196
Queue Time at Loader min/ Cycle 3,03
Spot Time at loader min/ Cycle 0,75
Average Loading Time min/ Cycle 1,43
Travel Time min/ Cycle 24,70
Spot Time at Dump min/ Cycle 0,80
Average Dump Time min/ Cycle 1,00
Average Cycle Time min/ Cycle 31,71
Fleet Size 13
Average No. of Bucket Passes 3,00
Haulage System
Production per Year tonne/Year 30 760 542
Run Fleet Production Production Loader Truck Avg. Cycle Truck Production Truck Avg. Load
No. Fleet Size Per Year Change Production Per Oper. Hour Time Per Oper. Hour Queue Time
tonne % tonne min tonne min
1 13,00 30 760 542,24 0,00 5 761,21 31,71 443,17 3,03
2 1,00 2 603 753,02 0,00 487,66 28,68 487,66 0,00
3 2,00 5 186 395,97 99,19 971,37 28,83 485,69 0,15
4 3,00 7 743 587,02 197,40 1 450,31 29,02 483,44 0,34
5 4,00 10 255 829,87 293,89 1 920,84 29,18 480,21 0,51
6 5,00 12 706 986,86 388,03 2 379,92 29,39 475,98 0,72
7 6,00 15 202 267,86 483,86 2 847,27 29,57 474,54 0,89
8 7,00 17 583 633,69 575,32 3 293,28 29,76 470,47 1,08
9 8,00 20 015 540,13 668,72 3 748,75 29,99 468,59 1,30
10 9,00 22 332 399,75 757,70 4 182,68 30,24 464,74 1,57
11 10,00 24 543 770,17 842,63 4 596,86 30,53 459,69 1,85
12 11,00 26 733 896,90 926,74 5 007,05 30,83 455,19 2,15
13 12,00 28 808 075,80 1 006,41 5 395,53 31,25 449,63 2,57
14 13,00 30 727 612,27 1 080,13 5 755,04 31,71 442,70 3,03
15 14,00 32 387 111,40 1 143,86 6 065,85 32,45 433,28 3,78
16 15,00 33 364 726,23 1 181,41 6 248,95 33,81 416,60 5,14
17 16,00 33 713 247,09 1 194,79 6 314,23 35,81 394,64 7,13
18 17,00 33 867 658,68 1 200,72 6 343,15 37,95 373,13 9,27
19 18,00 34 075 286,03 1 208,70 6 382,04 40,07 354,56 11,39
20 19,00 34 243 143,01 1 215,15 6 413,47 42,20 337,55 13,52
Page 76
76
Production Summary - Full SimulationHaulage System: GR80_2019_Rev Haul Cycle: [PRJ] Haul Cycle_GR80_2019
Material: [PRJ] Oher Waste GR80 Roster: [PRJ] GR80_5339_OpHrs
Loader [PRJ] P&H 4100 XPC (AC)-Cost_GR80
Availability % 85,00
Bucket Fill Factor 0,81
Average Bucket Load Volume cu.metres 49,08
Average Payload tonne 101,66
Operating Hours per Year OpHr/Year 5 339,25 Op. hrs factored by availability
Average Operating Shifts per Year shifts/Year 567,00 Shifts factored by availability
Average Bucket Cycle Time min 0,72
Production per Operating Hour tonne 5 957,69
Production per Loader Operating Shift tonne 56 102 Max. prod. based on 100% avail.
Production per Year tonne 31 809 606 Avg. production factored by avail.
Wait Time per Operating Hour min 2,58
Truck [PRJ] KOMATSU 960 E-2K (3500hp)_GR80_Cost
Availability % 100,00
Payload in Template tonne 326,60
Operating Hours per Year OpHr/Year 5 339,25
Average Payload tonne 304,88
Production per Operating Hour tonne 397,18
Production per Loader Operating Shift tonne 3 740
Production per Year tonne 2 120 640
Queue Time at Loader min/ Cycle 3,88
Spot Time at loader min/ Cycle 0,75
Average Loading Time min/ Cycle 1,43
Travel Time min/ Cycle 27,45
Spot Time at Dump min/ Cycle 0,80
Average Dump Time min/ Cycle 1,00
Average Cycle Time min/ Cycle 35,31
Fleet Size 15
Average No. of Bucket Passes 3,00
Haulage System
Production per Year tonne/Year 31 809 606
Run Fleet Production Production Loader Truck Avg. Cycle Truck Production Truck Avg. Load
No. Fleet Size Per Year Change Production Per Oper. Hour Time Per Oper. Hour Queue Time
tonne % tonne min tonne min
1 15,00 31 809 605,81 0,00 5 957,69 35,31 397,18 3,88
2 1,00 2 372 154,98 0,00 444,29 31,45 444,29 0,00
3 2,00 4 717 971,42 98,89 883,64 31,60 441,82 0,17
4 3,00 7 052 399,85 197,30 1 320,86 31,77 440,29 0,33
5 4,00 9 335 541,95 293,55 1 748,47 31,94 437,12 0,51
6 5,00 11 619 322,57 389,82 2 176,21 32,11 435,24 0,68
7 6,00 13 844 629,75 483,63 2 592,99 32,33 432,17 0,90
8 7,00 16 034 522,48 575,95 3 003,14 32,53 429,02 1,10
9 8,00 18 209 045,57 667,62 3 410,41 32,75 426,30 1,32
10 9,00 20 378 237,91 759,06 3 816,69 32,99 424,08 1,56
11 10,00 22 457 057,06 846,69 4 206,03 33,25 420,60 1,81
12 11,00 24 492 407,82 932,50 4 587,24 33,51 417,02 2,08
13 12,00 26 478 036,45 1 016,20 4 959,13 33,82 413,26 2,39
14 13,00 28 410 018,00 1 097,65 5 320,98 34,21 409,31 2,78
15 14,00 30 218 087,59 1 173,87 5 659,61 34,69 404,26 3,25
16 15,00 31 753 766,09 1 238,60 5 947,23 35,33 396,48 3,89
17 16,00 32 916 370,27 1 287,61 6 164,98 36,42 385,31 4,98
18 17,00 33 371 631,26 1 306,81 6 250,25 38,24 367,66 6,81
19 18,00 33 608 416,89 1 316,79 6 294,60 40,33 349,70 8,89
20 19,00 33 796 101,52 1 324,70 6 329,75 42,45 333,14 11,01
21 20,00 33 947 750,15 1 331,09 6 358,15 44,58 317,91 13,15
22 21,00 34 131 149,84 1 338,82 6 392,50 46,72 304,40 15,29
Page 77
77
Production Summary - Full SimulationHaulage System: GR80_2020_Rev Haul Cycle: [PRJ] Haul Cycle_GR80_2020
Material: [PRJ] Oher Waste GR80 Roster: [PRJ] GR80_5339_OpHrs
Loader [PRJ] P&H 4100 XPC (AC)-Cost_GR80
Availability % 85,00
Bucket Fill Factor 0,81
Average Bucket Load Volume cu.metres 49,10
Average Payload tonne 101,69
Operating Hours per Year OpHr/Year 5 339,25 Op. hrs factored by availability
Average Operating Shifts per Year shifts/Year 567,00 Shifts factored by availability
Average Bucket Cycle Time min 0,72
Production per Operating Hour tonne 5 942,56
Production per Loader Operating Shift tonne 55 959 Max. prod. based on 100% avail.
Production per Year tonne 31 728 816 Avg. production factored by avail.
Wait Time per Operating Hour min 2,30
Truck [PRJ] KOMATSU 960 E-2K (3500hp)_GR80_Cost
Availability % 100,00
Payload in Template tonne 326,60
Operating Hours per Year OpHr/Year 5 339,25
Average Payload tonne 304,97
Production per Operating Hour tonne 349,56
Production per Loader Operating Shift tonne 3 292
Production per Year tonne 1 866 401
Queue Time at Loader min/ Cycle 4,53
Spot Time at loader min/ Cycle 0,75
Average Loading Time min/ Cycle 1,43
Travel Time min/ Cycle 31,41
Spot Time at Dump min/ Cycle 0,80
Average Dump Time min/ Cycle 1,00
Average Cycle Time min/ Cycle 39,92
Fleet Size 17
Average No. of Bucket Passes 3,00
Haulage System
Production per Year tonne/Year 31 728 816
Run Fleet Production Production Loader Truck Avg. Cycle Truck Production Truck Avg. Load
No. Fleet Size Per Year Change Production Per Oper. Hour Time Per Oper. Hour Queue Time
tonne % tonne min tonne min
1 17,00 31 728 815,76 0,00 5 942,56 39,92 349,56 4,53
2 3,00 6 215 311,29 0,00 1 164,08 35,71 388,03 0,33
3 4,00 8 255 852,55 32,83 1 546,26 35,89 386,56 0,51
4 5,00 10 290 596,83 65,57 1 927,35 36,09 385,47 0,70
5 6,00 12 294 651,52 97,81 2 302,69 36,28 383,78 0,89
6 7,00 14 245 873,86 129,21 2 668,14 36,48 381,16 1,09
7 8,00 16 173 591,72 160,22 3 029,19 36,71 378,65 1,33
8 9,00 18 101 746,91 191,24 3 390,32 36,91 376,70 1,52
9 10,00 20 039 954,13 222,43 3 753,33 37,17 375,33 1,77
10 11,00 21 827 857,39 251,19 4 088,19 37,42 371,65 2,04
11 12,00 23 702 340,98 281,35 4 439,26 37,66 369,94 2,28
12 13,00 25 433 603,25 309,21 4 763,52 37,97 366,42 2,58
13 14,00 27 168 137,86 337,12 5 088,38 38,35 363,46 2,96
14 15,00 28 850 324,15 364,18 5 403,44 38,70 360,23 3,31
15 16,00 30 389 600,93 388,95 5 691,74 39,22 355,73 3,83
16 17,00 31 717 438,58 410,31 5 940,43 39,95 349,44 4,57
17 18,00 32 702 256,23 426,16 6 124,88 41,12 340,27 5,73
18 19,00 33 142 641,29 433,24 6 207,36 42,93 326,70 7,54
19 20,00 33 291 944,12 435,64 6 235,32 45,01 311,77 9,62
20 21,00 33 490 423,04 438,84 6 272,50 47,11 298,69 11,72
21 22,00 33 666 953,03 441,68 6 305,56 49,23 286,62 13,84
22 23,00 33 847 895,67 444,59 6 339,45 51,39 275,63 16,00
Page 78
78
Production Summary - Full SimulationHaulage System: GR80_2021_Rev Haul Cycle: [PRJ] Haul Cycle_GR80_2021
Material: [PRJ] Oher Waste GR80 Roster: [PRJ] GR80_5339_OpHrs
Loader [PRJ] P&H 4100 XPC (AC)-Cost_GR80
Availability % 85,00
Bucket Fill Factor 0,81
Average Bucket Load Volume cu.metres 49,07
Average Payload tonne 101,63
Operating Hours per Year OpHr/Year 5 339,25 Op. hrs factored by availability
Average Operating Shifts per Year shifts/Year 567,00 Shifts factored by availability
Average Bucket Cycle Time min 0,72
Production per Operating Hour tonne 5 711,07
Production per Loader Operating Shift tonne 53 779 Max. prod. based on 100% avail.
Production per Year tonne 30 492 806 Avg. production factored by avail.
Wait Time per Operating Hour min 3,85
Truck [PRJ] KOMATSU 960 E-2K (3500hp)_GR80_Cost
Availability % 100,00
Payload in Template tonne 326,60
Operating Hours per Year OpHr/Year 5 339,25
Average Payload tonne 304,80
Production per Operating Hour tonne 356,94
Production per Loader Operating Shift tonne 3 361
Production per Year tonne 1 905 800
Queue Time at Loader min/ Cycle 3,89
Spot Time at loader min/ Cycle 0,75
Average Loading Time min/ Cycle 1,43
Travel Time min/ Cycle 31,21
Spot Time at Dump min/ Cycle 0,80
Average Dump Time min/ Cycle 1,00
Average Cycle Time min/ Cycle 39,09
Fleet Size 16
Average No. of Bucket Passes 3,00
Haulage System
Production per Year tonne/Year 30 492 806
Run Fleet Production Production Loader Truck Avg. Cycle Truck Production Truck Avg. Load
No. Fleet Size Per Year Change Production Per Oper. Hour Time Per Oper. Hour Queue Time
tonne % tonne min tonne min
1 16,00 30 492 806,29 0,00 5 711,07 39,09 356,94 3,89
2 1,00 2 110 162,69 0,00 395,22 35,21 395,22 0,00
3 2,00 4 197 345,78 98,91 786,13 35,36 393,07 0,16
4 3,00 6 271 172,13 197,19 1 174,54 35,53 391,51 0,33
5 4,00 8 324 571,52 294,50 1 559,13 35,71 389,78 0,51
6 5,00 10 324 515,51 389,28 1 933,70 35,91 386,74 0,72
7 6,00 12 356 574,73 485,57 2 314,29 36,09 385,72 0,90
8 7,00 14 360 124,58 580,52 2 689,54 36,29 384,22 1,09
9 8,00 16 320 913,76 673,44 3 056,78 36,50 382,10 1,31
10 9,00 18 162 426,34 760,71 3 401,68 36,76 377,96 1,55
11 10,00 20 104 952,69 852,77 3 765,50 36,98 376,55 1,78
12 11,00 21 984 168,64 941,82 4 117,46 37,23 374,31 2,04
13 12,00 23 804 493,06 1 028,09 4 458,40 37,50 371,53 2,30
14 13,00 25 594 372,66 1 112,91 4 793,63 37,82 368,74 2,63
15 14,00 27 334 874,78 1 195,39 5 119,61 38,13 365,69 2,94
16 15,00 28 920 757,46 1 270,55 5 416,63 38,58 361,11 3,39
17 16,00 30 514 720,51 1 346,08 5 715,17 39,04 357,20 3,85
18 17,00 31 864 109,90 1 410,03 5 967,90 39,79 351,05 4,59
19 18,00 32 747 947,60 1 451,92 6 133,44 41,02 340,75 5,83
20 19,00 33 156 596,76 1 471,28 6 209,97 42,90 326,84 7,70
21 20,00 33 372 627,41 1 481,52 6 250,43 45,05 312,52 9,85
22 21,00 33 547 695,46 1 489,82 6 283,22 47,13 299,20 11,94
23 22,00 33 668 919,52 1 495,56 6 305,93 49,23 286,63 14,04
Page 79
79
Production Summary - Full SimulationHaulage System: GR80_2022_Rev Haul Cycle: [PRJ] Haul Cycle_GR80_2022
Material: [PRJ] Oher Waste GR80 Roster: [PRJ] GR80_5339_OpHrs
Loader [PRJ] P&H 4100 XPC (AC)-Cost_GR80
Availability % 85,00
Bucket Fill Factor 0,81
Average Bucket Load Volume cu.metres 49,07
Average Payload tonne 101,63
Operating Hours per Year OpHr/Year 5 339,25 Op. hrs factored by availability
Average Operating Shifts per Year shifts/Year 567,00 Shifts factored by availability
Average Bucket Cycle Time min 0,72
Production per Operating Hour tonne 5 818,45
Production per Loader Operating Shift tonne 54 790 Max. prod. based on 100% avail.
Production per Year tonne 31 066 143 Avg. production factored by avail.
Wait Time per Operating Hour min 2,99
Truck [PRJ] KOMATSU 960 E-2K (3500hp)_GR80_Cost
Availability % 100,00
Payload in Template tonne 326,60
Operating Hours per Year OpHr/Year 5 339,25
Average Payload tonne 304,82
Production per Operating Hour tonne 342,26
Production per Loader Operating Shift tonne 3 223
Production per Year tonne 1 827 420
Queue Time at Loader min/ Cycle 4,33
Spot Time at loader min/ Cycle 0,75
Average Loading Time min/ Cycle 1,43
Travel Time min/ Cycle 32,39
Spot Time at Dump min/ Cycle 0,80
Average Dump Time min/ Cycle 1,00
Average Cycle Time min/ Cycle 40,70
Fleet Size 17
Average No. of Bucket Passes 3,00
Haulage System
Production per Year tonne/Year 31 066 143
Run Fleet Production Production Loader Truck Avg. Cycle Truck Production Truck Avg. Load
No. Fleet Size Per Year Change Production Per Oper. Hour Time Per Oper. Hour Queue Time
tonne % tonne min tonne min
1 17,00 31 066 143,31 0,00 5 818,45 40,70 342,26 4,33
2 2,00 4 073 682,36 0,00 762,97 36,54 381,48 0,18
3 3,00 6 083 257,36 49,33 1 139,35 36,71 379,78 0,34
4 4,00 8 050 426,86 97,62 1 507,78 36,87 376,95 0,50
5 5,00 9 997 967,61 145,43 1 872,54 37,06 374,51 0,69
6 6,00 11 963 354,20 193,67 2 240,64 37,29 373,44 0,92
7 7,00 13 861 054,25 240,26 2 596,07 37,46 370,87 1,09
8 8,00 15 769 636,15 287,11 2 953,53 37,68 369,19 1,31
9 9,00 17 588 791,31 331,77 3 294,24 37,90 366,03 1,53
10 10,00 19 479 030,47 378,17 3 648,27 38,12 364,83 1,74
11 11,00 21 325 335,12 423,49 3 994,07 38,38 363,10 2,01
12 12,00 23 063 979,76 466,17 4 319,70 38,61 359,98 2,24
13 13,00 24 740 599,32 507,33 4 633,72 38,94 356,44 2,58
14 14,00 26 525 956,86 551,15 4 968,11 39,26 354,86 2,88
15 15,00 28 180 850,90 591,78 5 278,05 39,66 351,87 3,29
16 16,00 29 645 615,07 627,74 5 552,39 40,10 347,02 3,73
17 17,00 31 061 908,59 662,50 5 817,65 40,71 342,21 4,34
18 18,00 32 251 675,90 691,71 6 040,49 41,63 335,58 5,25
19 19,00 32 931 187,01 708,39 6 167,76 43,13 324,62 6,76
20 20,00 33 154 372,34 713,87 6 209,56 45,13 310,48 8,76
21 21,00 33 326 295,95 718,09 6 241,76 47,26 297,23 10,90
22 22,00 33 492 780,72 722,17 6 272,94 49,34 285,13 12,97
23 23,00 33 685 498,31 726,91 6 309,03 51,50 274,31 15,13
Page 80
80
Production Summary - Full SimulationHaulage System: GR80_2023_Rev Haul Cycle: [PRJ] Haul Cycle_GR80_2023
Material: [PRJ] Oher Waste GR80 Roster: [PRJ] GR80_5339_OpHrs
Loader [PRJ] P&H 4100 XPC (AC)-Cost_GR80
Availability % 85,00
Bucket Fill Factor 0,81
Average Bucket Load Volume cu.metres 49,10
Average Payload tonne 101,69
Operating Hours per Year OpHr/Year 5 339,25 Op. hrs factored by availability
Average Operating Shifts per Year shifts/Year 567,00 Shifts factored by availability
Average Bucket Cycle Time min 0,72
Production per Operating Hour tonne 5 927,97
Production per Loader Operating Shift tonne 55 822 Max. prod. based on 100% avail.
Production per Year tonne 31 650 918 Avg. production factored by avail.
Wait Time per Operating Hour min 2,39
Truck [PRJ] KOMATSU 960 E-2K (3500hp)_GR80_Cost
Availability % 100,00
Payload in Template tonne 326,60
Operating Hours per Year OpHr/Year 5 339,25
Average Payload tonne 305,00
Production per Operating Hour tonne 348,70
Production per Loader Operating Shift tonne 3 284
Production per Year tonne 1 861 819
Queue Time at Loader min/ Cycle 4,49
Spot Time at loader min/ Cycle 0,75
Average Loading Time min/ Cycle 1,43
Travel Time min/ Cycle 31,61
Spot Time at Dump min/ Cycle 0,80
Average Dump Time min/ Cycle 1,00
Average Cycle Time min/ Cycle 40,09
Fleet Size 17
Average No. of Bucket Passes 3,00
Haulage System
Production per Year tonne/Year 31 650 918
Run Fleet Production Production Loader Truck Avg. Cycle Truck Production Truck Avg. Load
No. Fleet Size Per Year Change Production Per Oper. Hour Time Per Oper. Hour Queue Time
tonne % tonne min tonne min
1 17,00 31 650 918,30 0,00 5 927,97 40,09 348,70 4,49
2 5,00 10 222 134,96 0,00 1 914,53 36,31 382,91 0,71
3 6,00 12 229 245,82 19,63 2 290,44 36,51 381,74 0,92
4 7,00 14 193 562,15 38,85 2 658,34 36,69 379,76 1,10
5 8,00 16 146 319,09 57,95 3 024,08 36,89 378,01 1,30
6 9,00 18 024 911,47 76,33 3 375,93 37,11 375,10 1,52
7 10,00 19 900 779,54 94,68 3 727,26 37,36 372,73 1,76
8 11,00 21 734 236,24 112,62 4 070,65 37,59 370,06 2,01
9 12,00 23 535 518,16 130,24 4 408,02 37,87 367,33 2,28
10 13,00 25 371 759,41 148,20 4 751,93 38,15 365,53 2,56
11 14,00 26 992 875,76 164,06 5 055,56 38,50 361,11 2,92
12 15,00 28 669 669,14 180,47 5 369,61 38,89 357,97 3,30
13 16,00 30 251 964,03 195,95 5 665,96 39,43 354,12 3,84
14 17,00 31 589 975,69 209,04 5 916,56 40,09 348,03 4,50
15 18,00 32 548 900,83 218,42 6 096,16 41,18 338,68 5,60
16 19,00 33 106 918,27 223,87 6 200,67 42,95 326,35 7,36
17 20,00 33 300 125,81 225,76 6 236,85 45,01 311,84 9,42
18 21,00 33 470 750,36 227,43 6 268,81 47,14 298,51 11,54
19 22,00 33 622 026,76 228,91 6 297,14 49,24 286,23 13,66
20 23,00 33 769 675,83 230,36 6 324,80 51,36 274,99 15,78
21 24,00 33 980 883,02 232,42 6 364,36 53,49 265,18 17,91
22 25,00 34 144 995,52 234,03 6 395,09 55,53 255,80 19,94
23 26,00 34 317 235,24 235,71 6 427,35 57,63 247,21 22,04
24 27,00 34 483 543,20 237,34 6 458,50 59,74 239,20 24,15
Page 81
81
Production Summary - Full SimulationHaulage System: GR80_2024_Rev Haul Cycle: [PRJ] Haul Cycle_GR80_2024
Material: [PRJ] Oher Waste GR80 Roster: [PRJ] GR80_5339_OpHrs
Loader [PRJ] P&H 4100 XPC (AC)-Cost_GR80
Availability % 85,00
Bucket Fill Factor 0,81
Average Bucket Load Volume cu.metres 49,06
Average Payload tonne 101,61
Operating Hours per Year OpHr/Year 5 339,25 Op. hrs factored by availability
Average Operating Shifts per Year shifts/Year 567,00 Shifts factored by availability
Average Bucket Cycle Time min 0,72
Production per Operating Hour tonne 5 892,52
Production per Loader Operating Shift tonne 55 488 Max. prod. based on 100% avail.
Production per Year tonne 31 461 629 Avg. production factored by avail.
Wait Time per Operating Hour min 2,17
Truck [PRJ] KOMATSU 960 E-2K (3500hp)_GR80_Cost
Availability % 100,00
Payload in Template tonne 326,60
Operating Hours per Year OpHr/Year 5 339,25
Average Payload tonne 304,72
Production per Operating Hour tonne 310,13
Production per Loader Operating Shift tonne 2 920
Production per Year tonne 1 655 875
Queue Time at Loader min/ Cycle 5,19
Spot Time at loader min/ Cycle 0,75
Average Loading Time min/ Cycle 1,43
Travel Time min/ Cycle 35,61
Spot Time at Dump min/ Cycle 0,80
Average Dump Time min/ Cycle 1,00
Average Cycle Time min/ Cycle 44,78
Fleet Size 19
Average No. of Bucket Passes 3,00
Haulage System
Production per Year tonne/Year 31 461 629
Run Fleet Production Production Loader Truck Avg. Cycle Truck Production Truck Avg. Load
No. Fleet Size Per Year Change Production Per Oper. Hour Time Per Oper. Hour Queue Time
tonne % tonne min tonne min
1 19,00 31 461 629,45 0,00 5 892,52 44,78 310,13 5,19
2 7,00 12 696 934,23 0,00 2 378,04 40,70 339,72 1,11
3 8,00 14 436 122,17 13,70 2 703,77 40,95 337,97 1,35
4 9,00 16 135 830,33 27,08 3 022,12 41,13 335,79 1,53
5 10,00 17 856 169,75 40,63 3 344,32 41,37 334,43 1,77
6 11,00 19 535 071,33 53,86 3 658,77 41,62 332,62 2,03
7 12,00 21 182 659,75 66,83 3 967,35 41,86 330,61 2,27
8 13,00 22 809 937,73 79,65 4 272,12 42,09 328,62 2,50
9 14,00 24 428 819,05 92,40 4 575,33 42,42 326,81 2,82
10 15,00 25 948 679,66 104,37 4 859,99 42,80 324,00 3,20
11 16,00 27 515 519,10 116,71 5 153,44 43,11 322,09 3,51
12 17,00 28 916 049,34 127,74 5 415,75 43,54 318,57 3,94
13 18,00 30 260 247,32 138,33 5 667,51 44,06 314,86 4,46
14 19,00 31 492 299,94 148,03 5 898,26 44,78 310,43 5,18
15 20,00 32 373 312,34 154,97 6 063,27 45,94 303,16 6,35
16 21,00 32 770 316,95 158,10 6 137,63 47,65 292,27 8,05
17 22,00 33 008 359,98 159,97 6 182,21 49,79 281,01 10,19
18 23,00 33 129 629,92 160,93 6 204,92 51,90 269,78 12,31
19 24,00 33 329 506,20 162,50 6 242,36 53,97 260,10 14,38
20 25,00 33 516 462,52 163,97 6 277,37 56,09 251,09 16,49
21 26,00 33 684 485,28 165,30 6 308,84 58,18 242,65 18,58
22 27,00 33 827 714,48 166,42 6 335,67 60,28 234,65 20,69
23 28,00 33 988 252,32 167,69 6 365,74 62,32 227,35 22,72
24 29,00 34 202 415,84 169,38 6 405,85 64,39 220,89 24,79
Page 82
82
Production Summary - Full SimulationHaulage System: GR80_2025_Rev Haul Cycle: [PRJ] Haul Cycle_GR80_2025
Material: [PRJ] Oher Waste GR80 Roster: [PRJ] GR80_5339_OpHrs
Loader [PRJ] P&H 4100 XPC (AC)-Cost_GR80
Availability % 85,00
Bucket Fill Factor 0,81
Average Bucket Load Volume cu.metres 49,07
Average Payload tonne 101,63
Operating Hours per Year OpHr/Year 5 339,25 Op. hrs factored by availability
Average Operating Shifts per Year shifts/Year 567,00 Shifts factored by availability
Average Bucket Cycle Time min 0,72
Production per Operating Hour tonne 5 744,51
Production per Loader Operating Shift tonne 54 094 Max. prod. based on 100% avail.
Production per Year tonne 30 671 361 Avg. production factored by avail.
Wait Time per Operating Hour min 3,21
Truck [PRJ] KOMATSU 960 E-2K (3500hp)_GR80_Cost
Availability % 100,00
Payload in Template tonne 326,60
Operating Hours per Year OpHr/Year 5 339,25
Average Payload tonne 304,81
Production per Operating Hour tonne 319,14
Production per Loader Operating Shift tonne 3 005
Production per Year tonne 1 703 964
Queue Time at Loader min/ Cycle 4,57
Spot Time at loader min/ Cycle 0,75
Average Loading Time min/ Cycle 1,43
Travel Time min/ Cycle 35,00
Spot Time at Dump min/ Cycle 0,80
Average Dump Time min/ Cycle 1,00
Average Cycle Time min/ Cycle 43,55
Fleet Size 18
Average No. of Bucket Passes 3,00
Haulage System
Production per Year tonne/Year 30 671 361
Run Fleet Production Production Loader Truck Avg. Cycle Truck Production Truck Avg. Load
No. Fleet Size Per Year Change Production Per Oper. Hour Time Per Oper. Hour Queue Time
tonne % tonne min tonne min
1 18,00 30 671 360,70 0,00 5 744,51 43,55 319,14 4,57
2 6,00 11 123 233,64 0,00 2 083,30 39,88 347,22 0,90
3 7,00 12 930 665,76 16,25 2 421,81 40,11 345,97 1,12
4 8,00 14 676 638,11 31,95 2 748,82 40,32 343,60 1,33
5 9,00 16 375 525,94 47,22 3 067,01 40,53 340,78 1,56
6 10,00 18 147 343,60 63,15 3 398,86 40,75 339,89 1,77
7 11,00 19 852 752,54 78,48 3 718,27 40,98 338,02 2,00
8 12,00 21 494 766,33 93,24 4 025,80 41,24 335,48 2,27
9 13,00 23 136 766,71 108,00 4 333,34 41,50 333,33 2,53
10 14,00 24 820 959,07 123,15 4 648,77 41,80 332,06 2,82
11 15,00 26 335 727,58 136,76 4 932,48 42,17 328,83 3,20
12 16,00 27 885 594,34 150,70 5 222,75 42,53 326,42 3,55
13 17,00 29 342 578,86 163,80 5 495,64 42,93 323,27 3,96
14 18,00 30 695 326,51 175,96 5 749,00 43,55 319,39 4,57
15 19,00 31 811 697,73 185,99 5 958,08 44,35 313,58 5,37
16 20,00 32 559 142,04 192,71 6 098,07 45,65 304,90 6,68
17 21,00 32 947 367,87 196,20 6 170,79 47,51 293,85 8,53
18 22,00 33 077 744,70 197,38 6 195,20 49,68 281,60 10,70
19 23,00 33 240 133,62 198,84 6 225,62 51,77 270,68 12,79
20 24,00 33 419 602,87 200,45 6 259,23 53,89 260,80 14,92
21 25,00 33 613 409,35 202,19 6 295,53 55,96 251,82 16,98
22 26,00 33 798 757,13 203,86 6 330,24 58,12 243,47 19,13
23 27,00 33 961 565,12 205,32 6 360,74 60,16 235,58 21,18
24 28,00 34 142 400,23 206,95 6 394,61 62,22 228,38 23,24
Page 83
83
Production Summary - Full SimulationHaulage System: GR80_2026_Rev Haul Cycle: [PRJ] Haul Cycle_GR80_2026
Material: [PRJ] Oher Waste GR80 Roster: [PRJ] GR80_5339_OpHrs
Loader [PRJ] P&H 4100 XPC (AC)-Cost_GR80
Availability % 85,00
Bucket Fill Factor 0,81
Average Bucket Load Volume cu.metres 49,07
Average Payload tonne 101,62
Operating Hours per Year OpHr/Year 5 339,25 Op. hrs factored by availability
Average Operating Shifts per Year shifts/Year 567,00 Shifts factored by availability
Average Bucket Cycle Time min 0,72
Production per Operating Hour tonne 5 739,99
Production per Loader Operating Shift tonne 54 052 Max. prod. based on 100% avail.
Production per Year tonne 30 647 263 Avg. production factored by avail.
Wait Time per Operating Hour min 2,87
Truck [PRJ] KOMATSU 960 E-2K (3500hp)_GR80_Cost
Availability % 100,00
Payload in Template tonne 326,60
Operating Hours per Year OpHr/Year 5 339,25
Average Payload tonne 304,79
Production per Operating Hour tonne 287,00
Production per Loader Operating Shift tonne 2 703
Production per Year tonne 1 532 363
Queue Time at Loader min/ Cycle 5,25
Spot Time at loader min/ Cycle 0,75
Average Loading Time min/ Cycle 1,43
Travel Time min/ Cycle 39,00
Spot Time at Dump min/ Cycle 0,80
Average Dump Time min/ Cycle 1,00
Average Cycle Time min/ Cycle 48,23
Fleet Size 20
Average No. of Bucket Passes 3,00
Haulage System
Production per Year tonne/Year 30 647 263
Run Fleet Production Production Loader Truck Avg. Cycle Truck Production Truck Avg. Load
No. Fleet Size Per Year Change Production Per Oper. Hour Time Per Oper. Hour Queue Time
tonne % tonne min tonne min
1 20,00 30 647 262,73 0,00 5 739,99 48,23 287,00 5,25
2 8,00 13 281 504,20 0,00 2 487,52 44,32 310,94 1,33
3 9,00 14 856 345,39 11,86 2 782,48 44,55 309,16 1,57
4 10,00 16 386 537,54 23,38 3 069,07 44,78 306,91 1,80
5 11,00 17 973 131,81 35,32 3 366,23 45,01 306,02 2,02
6 12,00 19 534 594,51 47,08 3 658,68 45,27 304,89 2,27
7 13,00 21 036 388,31 58,39 3 939,95 45,50 303,07 2,50
8 14,00 22 538 550,93 69,70 4 221,30 45,77 301,52 2,78
9 15,00 23 993 745,14 80,66 4 493,84 46,04 299,59 3,05
10 16,00 25 475 923,61 91,82 4 771,44 46,37 298,22 3,38
11 17,00 26 820 376,65 101,94 5 023,25 46,73 295,49 3,75
12 18,00 28 122 913,31 111,74 5 267,20 47,17 292,62 4,18
13 19,00 29 405 689,36 121,40 5 507,46 47,61 289,87 4,63
14 20,00 30 681 646,04 131,01 5 746,43 48,21 287,32 5,22
15 21,00 31 651 843,71 138,32 5 928,14 49,06 282,29 6,07
16 22,00 32 311 067,69 143,28 6 051,61 50,45 275,07 7,46
17 23,00 32 577 509,07 145,28 6 101,51 52,28 265,28 9,29
18 24,00 32 786 023,58 146,85 6 140,57 54,47 255,86 11,48
19 25,00 32 978 368,89 148,30 6 176,59 56,55 247,06 13,56
20 26,00 33 109 698,61 149,29 6 201,19 58,69 238,51 15,71
21 27,00 33 332 651,18 150,97 6 242,95 60,70 231,22 17,70
22 28,00 33 512 555,57 152,33 6 276,64 62,84 224,17 19,85
23 29,00 33 673 003,80 153,53 6 306,69 64,92 217,47 21,93
24 30,00 33 863 333,80 154,97 6 342,34 66,91 211,41 23,92
Page 84
84
Production Summary - Full SimulationHaulage System: GR80_2027_Rev Haul Cycle: [PRJ] Haul Cycle_GR80_2027
Material: [PRJ] Oher Waste GR80 Roster: [PRJ] GR80_5339_OpHrs
Loader [PRJ] P&H 4100 XPC (AC)-Cost_GR80
Availability % 85,00
Bucket Fill Factor 0,81
Average Bucket Load Volume cu.metres 49,07
Average Payload tonne 101,63
Operating Hours per Year OpHr/Year 5 339,25 Op. hrs factored by availability
Average Operating Shifts per Year shifts/Year 567,00 Shifts factored by availability
Average Bucket Cycle Time min 0,72
Production per Operating Hour tonne 5 725,87
Production per Loader Operating Shift tonne 53 919 Max. prod. based on 100% avail.
Production per Year tonne 30 571 850 Avg. production factored by avail.
Wait Time per Operating Hour min 2,77
Truck [PRJ] KOMATSU 960 E-2K (3500hp)_GR80_Cost
Availability % 100,00
Payload in Template tonne 326,60
Operating Hours per Year OpHr/Year 5 339,25
Average Payload tonne 304,80
Production per Operating Hour tonne 272,66
Production per Loader Operating Shift tonne 2 568
Production per Year tonne 1 455 802
Queue Time at Loader min/ Cycle 5,57
Spot Time at loader min/ Cycle 0,75
Average Loading Time min/ Cycle 1,43
Travel Time min/ Cycle 41,10
Spot Time at Dump min/ Cycle 0,80
Average Dump Time min/ Cycle 1,00
Average Cycle Time min/ Cycle 50,65
Fleet Size 21
Average No. of Bucket Passes 3,00
Haulage System
Production per Year tonne/Year 30 571 850
Run Fleet Production Production Loader Truck Avg. Cycle Truck Production Truck Avg. Load
No. Fleet Size Per Year Change Production Per Oper. Hour Time Per Oper. Hour Queue Time
tonne % tonne min tonne min
1 21,00 30 571 849,93 0,00 5 725,87 50,65 272,66 5,57
2 9,00 14 164 187,94 0,00 2 652,84 46,67 294,76 1,57
3 10,00 15 629 203,08 10,34 2 927,23 46,89 292,72 1,80
4 11,00 17 156 003,22 21,12 3 213,19 47,11 292,11 2,03
5 12,00 18 578 352,87 31,16 3 479,58 47,37 289,97 2,28
6 13,00 20 040 675,79 41,49 3 753,46 47,61 288,73 2,53
7 14,00 21 508 184,83 51,85 4 028,32 47,86 287,74 2,77
8 15,00 22 884 911,82 61,57 4 286,17 48,13 285,74 3,04
9 16,00 24 264 199,45 71,31 4 544,50 48,46 284,03 3,38
10 17,00 25 649 019,20 81,08 4 803,86 48,79 282,58 3,71
11 18,00 26 947 317,24 90,25 5 047,02 49,11 280,39 4,03
12 19,00 28 179 099,87 98,95 5 277,73 49,62 277,78 4,54
13 20,00 29 394 449,38 107,53 5 505,35 50,07 275,27 4,98
14 21,00 30 529 521,41 115,54 5 717,94 50,66 272,28 5,58
15 22,00 31 508 580,30 122,45 5 901,31 51,48 268,24 6,40
16 23,00 32 113 011,77 126,72 6 014,52 52,90 261,50 7,82
17 24,00 32 422 570,13 128,91 6 072,50 54,80 253,02 9,71
18 25,00 32 632 584,07 130,39 6 111,83 56,82 244,47 11,73
19 26,00 32 821 436,05 131,72 6 147,20 59,00 236,43 13,91
20 27,00 32 960 274,42 132,70 6 173,20 61,10 228,64 16,02
21 28,00 33 117 790,03 133,81 6 202,70 63,18 221,53 18,10
22 29,00 33 326 470,51 135,29 6 241,79 65,25 215,23 20,17
23 30,00 33 501 728,30 136,52 6 274,61 67,21 209,15 22,13
24 31,00 33 649 240,64 137,57 6 302,24 69,29 203,30 24,21