01 September 2008 ANZ Regional and Rural Quarterly September quarter 2008 Our Vision: For ANZ Economics & Markets Research to be the most respected, sought-after and commercially valued source of economics and markets research and information on Australia, New Zealand, the Pacific and Asia. Authors: Tony Pearson Deputy Chief Economist and Head of Industry and Strategic Research +61 3 9273 5083 [email protected]Mark Rodrigues Senior Economist, Industry and Strategic Research +61 3 9273 6286 [email protected]Julie Toth Senior Economist, Industry and Strategic Research +61 3 9273 6252 [email protected]Peter Jacobs Senior Manager, Agribusiness +61 3 8635 5920 [email protected]Paul Deane Economist, Industry and Strategic Research +61 3 9273 6295 [email protected]Welcome How quickly things can change. The sudden turnaround in the value of the Australian dollar is a welcome relief for agricultural producers who have been battling increased input costs associated with fuel and fertilisers. Unfortunately, not all news is good for regional and rural communities. Water security remains a big issue, particularly in the Murray Darling Basin where irrigators are facing the grimmest conditions in living memory. We have also seen a general slowdown in the broader economy, which is manifesting itself in declining retail sales in regional towns as people put the brakes on spending. Even the resources boom is starting to lose some of its shine, as evidenced by recent job losses in Broken Hill due to falling metal prices. Counterbalancing this is the record profit announced by BHP Billiton, which continues to benefit from strong global demand for commodities. All of this highlights the uncertainty of the times. There are parts of the country that are doing exceptionally well, while others are contending with challenges. It is reassuring to know at times like this that ANZ has the people with the expertise to assist you with your financial services needs. This edition of the ANZ Regional and Rural Quarterly examines the factors driving economic performance throughout Australia’s regional areas. It offers both an overview and a local-level snapshot of what is happening. See inside for our region-by-region snapshot on factors such as population growth, employment, taxable income and the value of rural landholdings. Rob Goudswaard Managing Director, Regional, Rural and Small Business Banking If you would like to comment on any information featured in this edition, please contact me at [email protected] or your local ANZ Regional Executive. Inside The big picture At last financial cost pressures begin to ease Page 2 In focus – Australia’s emissions trading scheme Scheme to begin in 2010 and will cover 70% of Australia’s emissions Page 3 Agriculture this quarter Falling A$ a positive but production risks remain Page 5 Around the regions Find out how your region is performing Page 6 ANZ regional and rural services ANZ offers a comprehensive range of services in regional and rural Australia. To find out how we can assist you, contact your regional executive: NSW/Qld: Hamish Davidson 03 9273 5616 [email protected]Vic/Tas: Michael Flower 03 9273 0861 [email protected]WA/SA/NT: Frank Fragnito 08 8218 8753 [email protected]This publication was finalised on 26 th August 2008
Transcript
01 September 2008
ANZ Regional and Rural Quarterly
September quarter 2008
Our Vision:
For ANZ Economics & Markets Research to be the most respected, sought-after and commercially valued source of economics and markets research and information on Australia, New Zealand, the Pacific and Asia.
Authors:
Tony Pearson Deputy Chief Economist and Head of Industry and Strategic Research +61 3 9273 5083 [email protected]
Mark Rodrigues Senior Economist, Industry and Strategic Research +61 3 9273 6286 [email protected]
Julie Toth Senior Economist, Industry and Strategic Research +61 3 9273 6252 [email protected]
Paul Deane Economist, Industry and Strategic Research +61 3 9273 6295 [email protected]
Welcome How quickly things can change. The sudden turnaround in the value of the Australian dollar is a welcome relief for agricultural producers who have been battling increased input costs associated with fuel and fertilisers.
Unfortunately, not all news is good for regional and rural communities. Water security remains a big issue, particularly in the Murray Darling Basin where irrigators are facing the grimmest conditions in living memory. We have also seen a general slowdown in the broader economy, which is manifesting itself in declining retail sales in regional towns as people put the brakes on spending.
Even the resources boom is starting to lose some of its shine, as evidenced by recent job losses in Broken Hill due to falling metal prices. Counterbalancing this is the record profit announced by BHP Billiton, which continues to benefit from strong global demand for commodities.
All of this highlights the uncertainty of the times. There are parts of the country that are doing exceptionally well, while others are contending with challenges. It is reassuring to know at times like this that ANZ has the people with the expertise to assist you with your financial services needs.
This edition of the ANZ Regional and Rural Quarterly examines the factors driving economic performance throughout Australia’s regional areas. It offers both an overview and a local-level snapshot of what is happening.
See inside for our region-by-region snapshot on factors such as population growth, employment, taxable income and the value of rural landholdings.
Rob Goudswaard Managing Director, Regional, Rural and Small Business Banking
If you would like to comment on any information featured in this edition, please contact me at [email protected] or your local ANZ Regional Executive.
Inside The big picture
At last financial cost pressures begin to ease Page 2
In focus – Australia’s emissions trading scheme
Scheme to begin in 2010 and will cover 70% of Australia’s emissions Page 3
Agriculture this quarter
Falling A$ a positive but production risks remain Page 5
Around the regions
Find out how your region is performing Page 6
ANZ regional and rural services ANZ offers a comprehensive range of services in regional and rural Australia. To find out how we can assist you, contact your regional executive:
This publication was finalised on 26th August 2008
ANZ Regional and Rural Quarterly – 01 September 2008
Page 2
The Big Picture – Financial cost pressures begin to ease After six years of rising interest rates, a rising Australian dollar and rising fuel costs, Australian businesses could be forgiven for thinking the financial squeeze would never cease. Well the good news is that since late July there has been significant relief on all three fronts.
On Tuesday 5 August the Reserve Bank of Australia surprised the markets with the statement that “scope to move towards a less restrictive stance of monetary policy in the period ahead is increasing”. This was its way of signalling that the time to begin to lower interest rates was close at hand. We now expect that the process of cutting interest rates will begin at the Board meeting in the first week of September, and that interest rate reductions of at least a half of one percent will be effected by year end, with more to follow next year. What has prompted the Reserve Bank are the signs that domestic economic activity has slowed sharply over recent months. This has persuaded the Bank that rampant inflationary pressures will begin to cool later this year, and that inflation will return to the comfort zone by mid 2010.
The Australian dollar fell sharply in response to the change in interest rate sentiment. At time of writing the A$ was trading at US$0.87, a full 11USc lower than the recent peak above US$0.98 in mid July. This illustrates one of the characteristics of the A$ - it tends to grind higher slowly when it is rising, but can fall very rapidly when circumstances are against it. In the markets it is said that the A$ climbs up the stairs but falls down the elevator. From an exporter’s viewpoint the sharply lower currency comes as welcome relief, although it is worth observing that the movement against currencies other than the US$ has been much less spectacular.
The third piece of good news has been the correction in the price of oil. In mid July oil was trading over US$145bbl; a month later it had fallen by around 20% to US$115bbl. The decline reflected market concerns that global growth was cooling more than expected, with weakness spreading across developed countries from the USA to the UK, Europe and Japan, and with emerging economies also cooling. This induced speculators to substantially unwind long positions in oil and some other commodities. We need to be cautious in assuming Australian fuel prices will decline to the same extent as global oil prices, as the impact will be blunted by the depreciation of the A$. Nevertheless, some fuel price relief can be expected for Australian businesses and households.
Amidst this good news we need to remember that Australian economic activity has slowed sharply in recent months. The volume of retail spending fell in the March and June quarters; consumer and business confidence are both very low; and the demand for credit has substantially cooled. By the end of 2008 economic growth is expected to be running at less than half the pace of late 2007, and is likely to remain subdued until late in 2009. While it is unlikely that the economy will fall into recession, such a marked and prolonged slowdown in activity will present challenges to many businesses.
And the cooling in global economic activity is now impacting negatively on a range of commodity prices, not just oil, but also energy more broadly, and base and precious metals. It now looks likely that bulk coking coal and iron ore prices will be lower next year, although there still appears to be some upside for thermal coal. Overall, in aggregate it is likely that prices for Australian commodities have now peaked after a half decade of strong gains.
Tony Pearson Deputy Chief Economist
Australian interest rates have peaked with the next move by the RBA expected to be down
The A$ has declined rapidly against the US$ providing relief to exporters in regional Australia
Oil prices are also in retreat but the falling A$ will blunt some of the expected relief in fuel prices
Domestic demand has cooled in recent quarters and is expected to remain subdued through much of 2009
A range of global commodities have fallen in price more recently
ANZ Regional and Rural Quarterly – 01 September 2008
Page 3
In Focus – the emissions trading scheme The Federal Government is committed to introducing a carbon emissions trading scheme in 2010, as the centrepiece of its policy response to climate change and the Kyoto Protocol. Details of the scheme will be finalised by the end of 2008. The scheme will directly affect only around 1,000 of Australia’s largest companies in energy, mining, fuel wholesaling and heavy industry.
The Carbon Pollution Reduction Scheme: what do we know so far?
The Garnaut Review Draft Report and the Government’s Green Paper have set out options for a Carbon Pollution Reduction Scheme (CPRS) for Australia, as part of the Government’s response to climate change. Release of Treasury’s modelling of the likely costs and benefits of the CPRS has been delayed until October. The enabling legislation and all the key policy details are due to be finalised by the Government by the end of 2008.
Annual emissions targets for the CPRS have not yet been finalised, but they will be set so as to meet Australia’s long-range target of 60% of 2000 emissions levels by 2050. Beyond that long-range target, the Government needs to set:
the number of permits to be sold each year (the ‘annual emissions cap’ and the ‘trajectory’ of the reduction)
a starting price for the permits
the maximum price for the permits (the ‘price cap’)
the likely size of fines and penalties if companies emit more CO2-e than their permits allow.
On the other hand, the coverage of the scheme has been largely settled. The CPRS is designed to cover around 70% of Australia’s CO2-e emissions (comprised of the six greenhouse gasses identified in the Kyoto Protocol) — a far better coverage rate than the EU’s established emissions trading scheme.
The CPRS will achieve this by requiring annual permits to be purchased for all emissions from electricity generation (38% of national CO2-e emissions in 2006), transport (14%), manufacturing and heavy industry (13%), fugitive emissions from mines and other sources (6%) and waste (3%).
Of the major sources of Australian emissions, only agriculture (16%) and land use change (7%) have been omitted from the first stage of the CPRS. Agriculture may be brought into the scheme from 2015, pending review. Even then, it is possible that some or all of the CO2-e permits for agriculture will be ‘administratively allocated’ at no charge (i.e. for free). Forestry companies will be allowed to participate on a voluntary basis when the scheme commences.
For all of the relevant industries, only very large emitters (over 25kt CO2-e per year) will need to participate directly in the CPRS. The ‘point of obligation’ (that is, which company in the supply chain will be required to buy permits) varies across the covered industries, but generally falls at the point of production of emissions. For transport fuels, CPRS permits will be bought by the wholesalers who currently pay the fuel excise. This narrow band of eligibility will help to keep CPRS participation (and hopefully total transaction and administration costs) to a minimum, given the level of coverage.
The Government estimates that only around 1,000 large companies will participate directly in the CPRS in its first years of operation. They will be required to buy permits to cover their annual emissions, either directly from the Government or from secondary markets. The potential cost for the permits will be large. Even a relatively modest starting price of $20/t would have implied an annual bill of up to $8.9bn for example, if all the relevant industries had paid for all of their emissions in 2006. The actual amount due each year will depend on the number and price of permits to be sold and the number to be allocated for free. The Green Paper suggests up to 20% of permits will initially be issued free of charge to emission-intensive, trade-exposed (EITE) companies.
Julie Toth Senior Economist
Carbon emissions trading will commence in 2010
The scheme will cover 70% of Australia’s emissions, including emissions from: - electricity generation, - transport, and - heavy industry
Around 1,000 large energy, fuel and industrial companies will be required to buy permits to cover their CO2-e emissions each year
Agriculture will not be included in the CPRS until at least 2015
ANZ Regional and Rural Quarterly – 01 September 2008
Page 4
Likely effect of the CPRS for households and smaller businesses
Outside the 1,000 corporations directly involved in the CPRS, the effects of the scheme will be felt by all other businesses (and households) through input price rises, especially for electricity and energy fuels.
Based on the limited data currently available, the initial price effect will be strong enough to raise inflation by at least 0.9% when trading begins in 2010, mainly through higher prices for electricity (up 16%) and gas (up 9%). These will be one-off price increases. Any further price rises will depend on the subsequent market price that emerges for CO2-e emissions permits. This price effect is deliberate. It is intended to change our CO2-e emissions behaviour. Businesses and households should respond by cutting their energy consumption.
To put these potential price rises for energy into perspective, they are of a similar magnitude to the retail energy price rises seen over the past few years due to drought and sharply escalating energy commodity prices. By March 2008, national average retail electricity prices were 10% higher than a year earlier, and 16.7% higher than three years earlier. Retail gas prices increased by 14.4% over the same period. For the 2008 calendar year, we anticipate electricity prices will rise by 9%, gas by 7% and water and sewerage by 10.7%. The CPRS will add a similar margin again to these retail energy prices in 2010. But this time, the Government will compensate low to medium income households for this cost increase, so the net effect for many households will be neutral. This should help to minimise the effect on consumer spending for small businesses.
The CPRS will also apply to transport fuel, but the Government has pledged to reduce the fuel excise on petrol (for at least 3 years) and diesel (for at least 1 year) by an equivalent amount, so as to negate the impact on households and small businesses. Diesel rebates for farmers and fishing businesses will also be adjusted for at least three years and will then be reviewed. These adjustments will help ease the fuel cost burden, but they will also reduce the impact and effectiveness of the CPRS in reducing our CO2-e from transport, because price signals are central to the scheme’s operation. Given that Australia has some of the lowest-priced petrol in the OECD, their necessity is arguably questionable.
Like other taxes and excises, the CPRS revenue will not be a dead loss. All of it will be redistributed through assistance and compensation to businesses and households. Many new business opportunities will also emerge, as further details of the system are bedded down. In practice, the CPRS will mean reducing carbon-intensive goods and services in favour of less intensive ones and/or reducing their carbon-intensity, as far as technology allows. Initially, the main focus will be on electricity generation, but demand (and Government support) is growing for research, development and implementation of new, low-carbon technologies across the board. The business opportunities this will create include the obvious and not-so obvious. Major benefits will be possible for many regions.
For further information on this topic, see our other publications on our website:
ANZ Industry Update: Potential Costs of Emissions Trading, August 2008.
Business and the Carbon Pollution Reduction Scheme: 10 things you need to know, July 2008.
ANZ Industry Update: Emissions Trading, July 2008.
ANZ Industry Update: Emissions Trading, April 2008.
“Update on Australian Climate Change Policy”, ANZ Economic Outlook, March 2008, pp. 21-24.
“The Road to an Emissions Trading System”, ANZ Australian Economics Weekly, 8 June 2007.
ANZ Industry Report: Emissions Trading, June 2007.
“Sources of Carbon” ANZ Australian Economics Weekly, 23 March 2007.
“Carbon Trading”, ANZ Economic Outlook, March 2007, pp. 21-24.
The CPRS is designed to increase the relative price of goods and services that have a high CO2-e footprint
This will be achieved primarilythrough higher prices forelectricity, gas and eventuallypetrol and diesel
Transport fuel will be included inthe CPRS, but the fuel excise willbe cut to match it
The retail price of petrol will not change as a result of the CPRSfor at least 3 years
The CPRS will encourage awealth of new businessopportunities and will potentiallybenefit many regions
ANZ Regional and Rural Quarterly – 01 September 2008
Page 5
Agriculture this quarter
Recent falls in the Australian dollar have improved the outlook for farm gate prices and helped to counter the effects of slowing world growth.
The weakening dollar is good news for exporters of grain, beef, wool and dairy products. It is also likely to reduce the impetus for imports of fruit, vegetables and pork.
In production terms, seasonal conditions remain generally favourable for what promises to be a larger winter grain and oilseeds crop than recent years. Wheat production in the 2006/07 and 2007/08 seasons was just 11 million and 13 million tonnes respectively. Finishing rains in spring will determine the size and quality of this harvest.
The Australian grain market has become slightly more skittish in recent weeks, with rainfall through to late August in NSW below average. ASX Milling Wheat futures for January 2009 delivery rose to a high of A$390 per tonne last week, up 20% in less than a month. Wheat futures (US$ terms) on the Chicago Board of Trade have risen by around 10% over the same period.
Livestock industries are benefiting from more favourable seasonal conditions in some areas. Surface stock water supplies have been replenished and meat prices remain generally firm. However, some regions in the southern half of Australia will require considerable restocking activity when widespread ‘average’ rainfall does finally fall over a season.
Latest reports indicate the national sheep flock has fallen below 80 million, the lowest it has been in 80 years. While the cattle herd has not fallen to the same extent as sheep numbers in southern Australia, cattle numbers have been reduced across southern NSW, northern and central Victoria and agricultural South Australia.
The latest demand outlook from Meat and Livestock Australia is positive for Australian beef in the medium term. The potential emergence of Russia as a fifth major market is an exciting prospect, given Australian beef currently relies on just four key markets - domestic, USA, Korea and Japan.
Irrigators in the Murray Darling Basin are facing dire conditions, with very low to nil water allocations. The Federal Government has announced a basin wide tender in 2008-09 to purchase water rights. There is also a Federal and State initiative to co-fund the purchase of properties holding large water entitlements, particularly in the northern basin.
Global dairy prices have risen rapidly over the last 18 months, and at their peak had risen by 120% in a year. Global dairy prices have eased in 2008 (but still remain high by historical standards), with USDA Oceania Skim Milk Powder and Whole Milk Powder categories falling by around 30% and 15% respectively from their peaks. As is the case in the grain market, the extent of the supply side response is a risk to future prices, especially if supply is coming on-line at a time when demand is weakening (through slowing global growth).
Overall though the outlook for the Australian dairy industry is very positive, given that most coastal production regions have had excellent winter rainfall and farm gate prices throughout Australia remain high. These factors, combined with a favourable mid-term outlook for global demand, are driving significant new investment in the sector. This is resulting in rapidly rising land and dairy cow prices in Australia.
Other sectors are also enjoying strong investment interest and consequent rises in land values. This particularly applies to the cattle industry in the Northern Territory. The timber industry is also helping to drive demand for land. The total area under plantation increased by 85,000 hectares in 2007. This lifted the nation’s total plantation area to 1.82 million hectares, in line with the industry’s target of 3 million hectares by 2020.
Peter Jacobs Senior Manager, Agribusiness
Paul Deane Economist
Australian wheat prices havejumped strongly over the lastmonth
Livestock numbers in southeastern Australia have fallen due to the prolonged dry period
Boom times continue for much ofthe Australian dairy industry
Strong investment and highprofitability in some sectors isflowing through into higherasset prices
Beef demand is expected toremain strong medium term
ANZ Regional and Rural Quarterly – 01 September 2008
Page 6
Around the regions Like the rest of the Australian economy, regional Australia has had to contend with the headwinds of high interest rates, higher input costs and a strong local currency in recent times. For the resource and rural sectors, higher commodity prices have helped to offset some of this pain. However for those regions not directly exposed to the resources sector or that have not received average rainfall in the last 12 months, times have been particularly challenging.
While the outlook is increasing positive for regional Australia as some of these headwinds subside, economic prospects will continue to wax and wane across the regions, especially from events in world markets given the reliance on exporting.
One of the most significant events in world markets since the last ANZ Regional and Rural Quarterly has been the sharp reversal in the crude oil market. This change in sentiment has spilled over into other commodities (as was the case on the upside). Base metal prices such as nickel, zinc, lead and tin have all fallen by between 25% and 30% in the last three months. Some precious metals have fallen by over 30% since May 2008.
This has already had repercussions within regional Australia, with some higher cost mining operations closing to focus on higher grade ore bodies. Reports of retrenchments in recent months include 450 workers at Broken Hill, 220 workers at Cobar in NSW and around 350 people at several mines in WA.
Within rural Australia, water remains the key issue. For much of this decade, parts of eastern Australia have been characterised by consistent below average rainfall. The current length of dry conditions is now similar to that of the ‘Federation Drought’, so named as it ran from the mid-1890s to 1902. During this drought, livestock production was decimated with both sheep and cattle numbers falling by 40%. In this latest dry period farm production has been more resilient, helping much of regional Australia to continue to grow. For this season, cautious optimism exists for Australia’s winter crop. Forecasters are tipping a closer-to-average production year for wheat of around 24 million tonnes.
From this period of prolonged dry, inflows into the Murray Darling basin have reached record lows. The opening of the irrigation season at 0% allocations in many instances along the Murray and Goulburn Rivers highlights the importance of the debate on future water policy. However as economist John Quiggin recently put it, for those facing another season of low water allocation, “the best water policy in the world is useless when there is no water”.
While the economic consequence to irrigation farming in areas without water is increasingly dire, the environmental costs are also becoming apparent. Lake Alexandrina, where the River Murray comes out to the sea, is over half a metre below sea level. As the freshwater lake is drying up it exposes the heavily acid soils, which react to air by producing sulphuric acid. It is increasingly likely that the lake will be flooded with seawater to prevent the lake bed from further exposure.
For regional tourism, prospects have improved recently with the falling $A and fuel prices. Over the last month, the Australian Trade Weighted Index has fallen by 7% against a basket of our major trading partners. However the effect on inbound tourism to Australia will be muted initially, given around half the visitors to Australia book a holiday between one and six months in advance.
Overall, most regional economies are performing well, but for those less prosperous regions unemployment is starting to rise. Highlighting the confidence in regional Australia moving forward, business investment through commercial property developments in most regions is very strong.
Paul Deane Economist
Lower commodity prices haveled to minor job losses in theAustralia mining industry
Farm output has remainedresilient despite below averagerainfall in eastern Australia
Regions not exposed toresources or that have not received average rainfall havefaced more difficult times
Record low inflows into thelower Murray Darling is havingmajor economic andenvironmental consequences
The outlook for regional tourismshould improve
ANZ Regional and Rural Quarterly - 01 September 2008
Page 7
NSW North Coast
The NSW North Coast region
Regional house prices have clearly outperformed
0
4
8
12
16
20
Sydney
NS
WC
ountr
y
Byro
nB
ay
Casi
no
Coff
sH
arb
our
Gra
fton
Lism
ore
Capital Growth (%)
Annual house price growth - ending 30th June 2008
Source: Residex
Conditions on the north coast of NSW have tightened significantly over the past year, reflecting the ‘triple whammy’ of high interest rates, petrol prices and the exchange rate on the region’s tourism-reliant services industries.
The clearest expression of the turn in the region’s fortunes can be found in the local labour market, where employment growth is now down over 7% in the past year. As a result, the unemployment rate has gradually crept up to 8.1%, close to double the national average.
The region’s agricultural industry isn’t faring much better either, with heavy rains likely to result in reduced yields for cane, banana and other crops. Beef and dairy farmers have benefited from the wet weather with plenty of pasture throughout winter, but the industry more broadly is confronting rising input costs, particularly for feed and fertiliser.
The one bright spot in the region, somewhat surprisingly, is residential construction, with building approvals up over 13% in the past year and house price growth ranging from 8% in Casino to almost 20% in Byron Bay, well above the virtually stagnant growth in the Sydney market.
The region’s housing market is being underpinned by strong population growth and demand for permanent holiday accommodation, but a question mark now hangs over the extent to which the local market can continue to buck broader economic trends.
ANZ Regional Managers: Fiona Preston (NSW Far North Coast) 0401 567 882 [email protected]
Average rural land holding, $mn 1.28 1.23 1.29 1.74 1.80 2.14 2.57 2.89 Sources: ABS, ABARE, ATO, ANZ Economics and Markets Research.
ANZ Regional and Rural Quarterly - 01 September 2008
Page 8
NSW North West
The NSW North West region
Non-residential construction activity is rising
0
100
200
300
400
500
02 03 04 05 06 07 08
Residential
Non-residential
$mn, trend
Building approvals - NSW North West
Source: ABS and ANZ Economics and Markets Research
General economic conditions in the North West of NSW have held up relatively well considering the broader economic environment, with prospects for the agriculture sector in particular looking up.
Commercial and industrial activity is remaining bouyant, bolstered by a couple of significant recent events. AgQuip, the largest rural field day in the Southern Hemisphere was held at Gunnedah in August, with more than 100,000 site visitations over 3 days, providing a significant boost to the local economy. The recently completed $30mn Australian Equine & Livestock Events Centre in Tamworth is likely to deliver similar benefits to the region. It will play host to the 2008 National Cutting Horse Association Futurity between 27 September and 5 October. On the construction front, non-residential approvals were up almost 30% in the year to June 2008.
Prospects have also improved for the region’s farmers, with good rainfall over the past couple of months raising the prospect of above average yields this season. To the extent that these hopes are realised, farmers will be able to take advantage of current high soft commodity prices pointing to a significant lift in agricultural incomes in the region.
The improvement in farm confidence has continued to support the rural property market with recent auction sales showing an increase in the value of good cropping land.
On a softer note, town businesses are reporting slowing trade as consumer confidence continues to wane. The residential construction industry is beginning to feel the pinch of higher interest rates, with building approvals falling over the past year. Overall, employment growth is slowing and the unemployment rate looks to have bottomed for the time being, at 5.1%.
Your ANZ Regional Manager is: John Stavert (02) 6768 3646 [email protected]
Average rural land holding, $mn 1.58 1.56 1.82 1.80 2.38 2.25 2.82 3.64 Sources: ABS, ABARE, ATO and ANZ Economics and Markets Research; Note: the table includes data on Newcastle.
ANZ Regional and Rural Quarterly - 01 September 2008
Page 9
NSW Southern
The NSW Southern region
Unemployment is on the rise in the region
2
3
4
5
6
7
8
02 03 04 05 06 07 08
NSW Southern
Australia
%Unemployment rate
Source: ABS and ANZ Economics and Markets Research
Economic conditions in the NSW Southern region have begun to ease, consistent with trends evident in other regions where tourism is an important driver.
High fuel prices, in particular, appear to have reduced traffic flow through the region, while tighter financial conditions have clearly had a detrimental effect on discretionary spending. A notable exception to this has been in the alpine areas, where good snowfalls have seen strong tourist numbers through Cooma and the snowfields.
As in other parts of the country, the region’s real estate market has been hit by rising interest rates, with agents reporting softening activity across the region. On the construction front, residential building approvals are down 13% over the past year.
The non-residential construction sector is faring somewhat better, with building approvals up almost 60% in the past year.
Still strong commercial and industrial activity probably explains why the region’s labour market has held up relatively well in the face of deteriorating conditions in the household sector. Employment growth has actually accelerated over the past six months to be 6.4% at July 2008.
That said, the pick up in labour demand has been more than offset by an increase in supply, with the labour force participation rate increasing to an historic high of 60.3%. As a result, the unemployment rate has stepped up to 6.3%, to be around 2ppts above the national average.
Your ANZ Regional Manager is: Mark Nightingale (02) 4234 3967 [email protected]
Average rural land holding, $mn 0.98 0.87 0.91 0.99 0.99 1.17 1.65 1.97 Sources: ABS, ABARE, ATO, ANZ Economics and Markets Research.
ANZ Regional and Rural Quarterly - 01 September 2008
Page 10
NSW South West
The NSW South West region
Rainfall has picked up in recent months
0
10
20
30
40
50
60
70
80
90
1 2 3 4 5 6 7 8 9 10 11 12
2007
2008
(mm)
calendar month
Drought yrs
Monthly Rainfall - Eastern Riverina
long term avg
Sources: BOM and ANZ Economics and Markets Research
Economic conditions remain solid in the south west of NSW, though fragility in some sectors of the economy is beginning to flow through to the labour market.
Optimism still surrounds the region’s agricultural sector. Improved (though still below average) rainfall in the past few months has buoyed the hopes of cereal farmers that sowed crops. The Bureau of Meteorology’s outlook for average rainfall over coming months, if realised, should set the scene for a good broadacre harvest this year. That said, the situation remains critical for irrigators with inflows into the southern half of the River Murray System still at historically low levels.
Elsewhere, anecdotal reports suggest that activity in the housing market is slowing in response to higher interest rates, though residential building approvals remain some 12% higher over the year.
Non-residential building activity in the region has been more severely affected, with building approvals down almost 40% over the year.
Such pockets of weakness in the regional economy underpin the dramatic turnaround in the region’s labour market performance this year. Employment fell by 6% over the year to July 2008, down from growth of 7% at the start of the year. At the same time, the supply of labour has fallen dramatically, with the labour force participation rate falling by over 7ppts since January.
The net effect of these two developments has seen the unemployment rate begin to trend up, though not dramatically so, and at 4.2%, the labour market remains tight in a historical context.
Your ANZ Regional Manager is: Tony Williams (02) 6926 9925 [email protected]
Average rural land holding, $mn 1.53 1.43 1.44 1.81 2.67 2.42 2.14 2.41 Sources: ABS, ABARE, ATO, ANZ Economics and Markets Research.
ANZ Regional and Rural Quarterly - 01 September 2008
Page 11
NSW Central West
The NSW Central West region
Late 2007 rainfall has helped winter crop prospects
0
20
40
60
80
100
120
1 2 3 4 5 6 7 8 9 10 11 12
2007
2008
(mm)
long term avg
Monthly Rainfall - Central Western Plains (South)
Source: BOM and ANZ Economics and Markets Research
Agricultural conditions remain strained in the NSW Central West due to the ongoing lack of water security, though broader economic data suggest the region is riding through the current drought relatively well.
Below average rainfall over recent months has continued to place strains on the region’s farmers. That said, there was sufficient subsoil moisture to sow crops, so dryland farmers may well yet benefit from timely winter and spring rainfall. The Bureau of Meteorology’s latest rainfall outlook holds out that possibility, with the prospect of average rainfall over most of the region between August and October.
Urban water supplies remain critically low in the region – particularly in Orange – and could start to impact local industry.
Despite issues around water security, to date, the region has done relatively well to prosper at a time when other areas are struggling to cope with high interest rates and petrol prices.
On the construction front, residential building approvals have increased over 7% in the past year, while non-residential building approvals are up a staggering 65%!
The strength of the region’s construction industry points to a level of demand and confidence in the local economy, that to date, has not been unduly dampened by headwinds emanating from elsewhere. This resilience is confirmed in the region’s labour market, with employment growth remaining solid at 2.2%, the labour force participation rate hovering at historic highs of 65.3% and the unemployment rate at generational lows of around 5%.
Your ANZ Regional Manager is: Clark Thompson (02) 6362 1007 [email protected]
Average rural land holding, $mn 1.62 1.82 1.27 1.52 1.64 1.87 1.92 2.49 Sources: ABS, ABARE, ATO, ANZ Economics and Markets Research.
ANZ Regional and Rural Quarterly - 01 September 2008
Page 12
North West Victoria
The North West Victoria region
Rainfall in 2008 is tracking a drought year
0
10
20
30
40
50
60
70
1 2 3 4 5 6 7 8 9 10 11 12
2007
2008
(mm)
calendar month
Drought yrs
Monthly Rainfall - Northern Mallee
long term avg
Source: BOM and ANZ Economics and Markets Research
Consistent with the other Victorian regions north of the divide, unemployment has increased in the first half of 2008. The unemployment rate has risen to over 6% in the region which is well above the national average of 4.3%. Reports in the local press include builders/carpenters moving further north into the mining areas to work.
Water remains a key issue in the region for the current season. While winter crops have emerged, rainfall over the next 2 months will be critical given year-to-date rainfall is well below that of 2007.
For Murray irrigators, maintaining grape and citrus production in 2008/09 will once again prove costly. Irrigators are currently on 0% allocation and this is not likely to change until October.
The prolonged drought and record low inflows into the Murray have highlighted the reliance of the regional economy on agriculture. Local government and the communities are looking at boosting tourism numbers to help sustain commercial businesses in the major regional centre of Mildura.
Residential property prices were subdued in Mildura in the 2007/08 financial year, with house prices increasing by just 3% compared with 12 months ago. House prices in Swan Hill performed better, up by 8.5% year-on-year.
Your ANZ Regional Manager is: Jo Mikleus (03) 5023 9292 [email protected]
Average rural land holding, $mn 0.99 0.91 1.07 1.16 1.38 1.35 1.28 1.75 Sources: ABS, ABARE, ATO, ANZ Economics and Markets Research.
ANZ Regional and Rural Quarterly - 01 September 2008
Page 13
Central Victoria
The Central Victoria region
Irrigation outlook remains uncertain
0%
20%
40%
60%
80%
100%
Murray Goulburn
2007/08 seasonAllocation (%)
High Reliability Water Shares
08/09 (f) based on repeat of 07/08 inflows
Source: Goulburn-Murray Water
Central Victoria’s economy continues to be adversely affected by the underperforming agricultural sector but investment in commercial property remains resilient.
In response to the strong A$ and the drought, SPC Ardmona in the Goulburn Valley is cutting 50-60 jobs as it scales down production of one of its fruit processing plants.
Recent rainfall has improved the seasonal outlook for rural industries in the area, although future high reliability allocations for irrigation water remains a major unknown. The ‘chill factor’ from recent frosts has assisted local horticulturalists by helping the budding process for stone fruit in orchards.
Under a scenario of poor Spring rainfall in 2008 (i.e. a repeat of 2007/08 inflow conditions from this point onwards), forecasts for 2008/09 are a Murray seasonal allocation of 30% of high reliability water shares and a 31% allocation in the Goulburn irrigation system. This scenario compares with the 2007/08 final seasonal allocations of 43% and 57% respectively for the Murray and Goulburn systems.
Residential building approvals appear to have eased slightly from recent highs, while non-residential building approvals have grown modestly in the first half of 2008.
The retail sector has been active in Bendigo, with new commercial property developments including the Rocklea Homemaker Centre and the soon to be completed Bendigo Marketplace Shopping Centre. Aldi is also planning to open stores at EagleHawk and Strathdale.
The unemployment rate has risen over the last 6 months, with the latest data indicating unemployment is back up around 6%.
Your ANZ Regional Manager is: Peter Barclay (03) 5820 4444 [email protected]
Average rural land holding, $mn 0.94 0.98 1.13 1.20 1.38 1.45 1.73 1.87 Sources: ABS, ABARE, ATO, ANZ Economics and Markets Research.
ANZ Regional and Rural Quarterly - 01 September 2008
Page 14
North East Victoria
The North East Victoria region
Commercial sector investing heavily
0
10
20
30
40
50
60
02 03 04 05 06 07 08
Residential
Non-residential
$mn, trend
Building approvals - North East Vic
Source: ABS and ANZ Economics and Markets Research
The performance of North Eastern Victoria is mixed, with the rural sector suffering from low rainfall for much of 2008, rising unemployment but strong investment in the commercial sector.
Employment growth has turned decidedly negative in 2008 in the region, with the unemployment rate approaching 6%.
It was a slow start for the winter alpine tourism season, with the first snow not falling until late June. Good snowfalls occurred immediately after this, with current snow conditions excellent across all the major resorts. Accommodation bookings are up on the same time last year through to the end of July, with tourist/visitor numbers increasing and good bookings for August.
A Coles supermarket development has been approved for Bright, while in the same area, tobacco growers around Myrtleford have received a grant ($118K) to help them diversify into other agribusiness ventures.
Demand for new and existing residential property has been relatively stable, with residential building approvals hovering at $50 million per month. Growth in house prices in the major regional towns (Wangaratta, Benalla, Wodonga) over the last 12 months has been below their 10 year average.
Non-residential building approvals reached around $40 million in June, up by around 65% on levels two years ago.
Rainfall through autumn and early winter was well below average but in the last 6 weeks the outlook for dryland farming has improved. The North East region received above average rainfall in July of 115mm. Given rainfall to mid-August has averaged around 50mm, the North East looks on track to receive average rainfall in August also.
Your ANZ Regional Manager is: Gavin Heathcote 0434 606 389 [email protected]
Average rural land holding, $mn 1.27 1.28 1.35 1.32 1.83 2.08 2.68 2.67 Sources: ABS, ABARE, ATO, ANZ Economics and Markets Research.
ANZ Regional and Rural Quarterly - 01 September 2008
Page 15
South West Victoria
The South West Victoria region
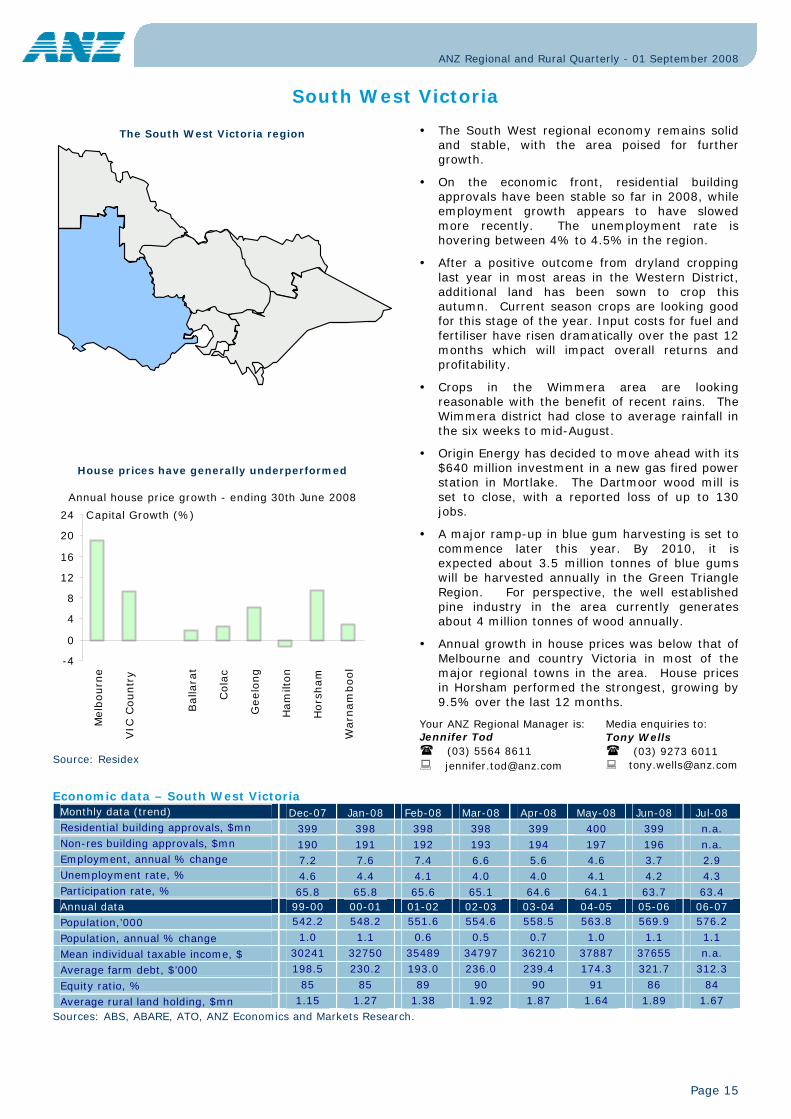
House prices have generally underperformed
-4
0
4
8
12
16
20
24
Melb
ourn
e
VIC
Countr
y
Balla
rat
Cola
c
Geelo
ng
Ham
ilton
Hors
ham
Warn
am
bool
Capital Growth (%)
Annual house price growth - ending 30th June 2008
Source: Residex
The South West regional economy remains solid and stable, with the area poised for further growth.
On the economic front, residential building approvals have been stable so far in 2008, while employment growth appears to have slowed more recently. The unemployment rate is hovering between 4% to 4.5% in the region.
After a positive outcome from dryland cropping last year in most areas in the Western District, additional land has been sown to crop this autumn. Current season crops are looking good for this stage of the year. Input costs for fuel and fertiliser have risen dramatically over the past 12 months which will impact overall returns and profitability.
Crops in the Wimmera area are looking reasonable with the benefit of recent rains. The Wimmera district had close to average rainfall in the six weeks to mid-August.
Origin Energy has decided to move ahead with its $640 million investment in a new gas fired power station in Mortlake. The Dartmoor wood mill is set to close, with a reported loss of up to 130 jobs.
A major ramp-up in blue gum harvesting is set to commence later this year. By 2010, it is expected about 3.5 million tonnes of blue gums will be harvested annually in the Green Triangle Region. For perspective, the well established pine industry in the area currently generates about 4 million tonnes of wood annually.
Annual growth in house prices was below that of Melbourne and country Victoria in most of the major regional towns in the area. House prices in Horsham performed the strongest, growing by 9.5% over the last 12 months.
Your ANZ Regional Manager is: Jennifer Tod (03) 5564 8611 [email protected]
Average rural land holding, $mn 1.15 1.27 1.38 1.92 1.87 1.64 1.89 1.67 Sources: ABS, ABARE, ATO, ANZ Economics and Markets Research.
ANZ Regional and Rural Quarterly - 01 September 2008
Page 16
0
4
8
12
16
20
24
Melb
ourn
e
VIC
Countr
y
Bair
nsd
ale
Moe
Morw
ell
Sale
Tra
ralg
on
Capital Growth (%)
Annual house price growth - ending 30th June 2008
South East Victoria
The South East Victoria region
House prices have increased strongly over the last 12 months
Source: Residex
Most indicators point to buoyant times in Victoria’s South East.
Construction activity has increased strongly in 2008, with residential and non-residential building approvals rising by 10% and 25% respectively over the last 6 months.
The unemployment rate has fallen significantly in the region and is now more in-line with the national average.
Reflecting the strong economic conditions in the region, demand for established houses was strong over the last 12 months. House price growth in the major regional centres outperformed regional Victoria, with growth in Traralgon and Moe approaching that of Melbourne.
While most of the focus on climate change has centred on carbon trading and permits, the Gippsland Coast was recently put on alert with changing attitudes to developments in low lying areas. There have been two cases in Gippsland of climate change (rising sea levels) threatening development. The Honeysuckles is a settlement on Ninety Mile Beach, where the local Council was considering no longer issuing building permits. The Council has since backed down. Further to the west in Toora, building permits were struck out by the Victorian Civil and Adminstrative Tribunal. This decision was in part due to concerns of rising sea levels in the future.
Winter rains have been patchy but good snowfalls will further assist irrigation storage in the Maffra/Sale area. Lake Glenmaggie, which supplies irrigation water to the Macalister Irrigation District, is currently at 87.4% capacity. This is above the long term average and similar to levels at this time last year. The outlook for the dairy industry in the area looks bright.
Your ANZ Regional Manager is: Cliff Simkin (03) 5144 5421 [email protected]
Average rural land holding, $mn 1.27 1.28 1.35 1.32 1.83 2.08 2.68 2.67 Sources: ABS, ABARE, ATO, ANZ Economics and Markets Research.
ANZ Regional and Rural Quarterly - 01 September 2008
Page 17
North Queensland
The North Queensland region
Selected global agricultural commodity prices
50
100
150
200
250
300
Jan03
Jan04
Jan05
Jan06
Jan07
Jan08
Cotton
Sugar
Beef
Index 100 = Jan 03
Source: Thomson Datastream
The North Queensland region has continued to perform strongly despite the negative impacts of the high A$, high interest rates and high fuel prices and rural input costs. Recent and prospective relief in these financial pressures has been welcome and is expected to lift the fortunes of key industry sectors.
Tourism in particular should benefit from improved competitiveness in the international environment as the costs of overseas tourists visiting Australia are reduced by a lower A$ and lower fuel prices. Reductions in domestic fuel prices might also encourage an increase in visits from elsewhere in Australia. Industries with a strong export focus including mining, cattle and sugar have also welcomed the lower A$.
Rural industries are also hopeful that lower global oil prices will ease some of the pressure on fuel and fertiliser input costs. However, the good news on costs has been tempered somewhat by increased uncertainty about the outlook in global prices for key “soft” commodities such as beef and sugar.
Demand for labour remains strong. Employment growth has accelerated through 2008 to a very rapid annual rate of 10%. The unemployment rate has remained stable at 4.5%, slightly above the Queensland and national averages, because of a commensurate increase in the labour force participation rate.
The construction industry has experienced mixed fortunes. Residential building approvals are softening in response to high interest rates, despite continued strong population growth and a buoyant labour market. On the other hand, non residential construction approvals continue to strengthen, reflecting solid business investment, particularly in the mining industry.
Your ANZ Regional Manager is: Ross Matthews (07) 4091 5694 [email protected]
Average rural land holding, $mn 2.73 3.29 3.88 5.04 5.87 6.21 6.51 4.60 Sources: ABS, ABARE, ATO, ANZ Economics and Markets Research.
ANZ Regional and Rural Quarterly - 01 September 2008
Page 18
Central Queensland
The Central Queensland region
House price growth in the major regional centres has largely matched Brisbane
0
4
8
12
16
20
24
28
Bri
sbane
QLD
Countr
y
Bundaberg
Gla
dst
one
Gym
pie
Mary
boro
ugh
Rock
ham
pto
n
Capital Growth (%)
Annual house price growth - ending 30th June 2008
Source: Residex
• Despite pockets of concern in tourism and for some farmers, the regional economy of Central Queensland continues to benefit from strong investment in the mining industry.
• Within the agricultural sector, the prospects for irrigation in the Emerald district are good. The Fairbairn Dam filled for the first time in 17 years earlier in the year. In general seasonal conditions for this time of year would be rated as ‘normal’, after good summer rains. However rainfall in the Central West was patchy and still remains well below long term averages.
• Anecdotal reports on tourism in the area are varied, but the general consensus is tourism in Queensland is suffering from weaker discretionary spending and strong competition from cheaper holidays overseas. Vacancy rates for holiday accommodation at Hervey Bay are at record high levels, with some landlords now seeking long term tenants.
• A major expansion of the Hervey Bay marina at Urangan has been announced. The value of this residential and commercial investment is $800 million.
• Annual growth in house prices in the major regional towns of Bundaberg, Gympie and Maryborough matched that of Brisbane. House prices have jumped sharply in Gladstone over the last 12 months, up by 25%. House price growth in Brisbane averaged 15% for 2007/08.
• Employment growth in the area has slowed in recent months after a very strong period of growth late in 2007 and early 2008.
• Similar to the other regions in Australia being heavily influenced from the resources boom, building approvals are at record high levels. Commercial or non-residential building approvals have doubled in 12 months.
Your ANZ Regional Manager is: Ian Waraker (07) 4931 7772 [email protected]
Average rural land holding, $mn 1.58 2.02 2.71 2.78 3.24 3.80 3.77 4.18 Sources: ABS, ABARE, ATO, ANZ Economics and Markets Research.
ANZ Regional and Rural Quarterly - 01 September 2008
Page 19
South Queensland
The South Queensland region
Residential investment remains high
0
50
100
150
02 03 04 05 06 07 08
Residential
Non-residential
$mn, trend
Building approvals - South Qld
Source: ABS and ANZ Economics and Markets Research
Signs are the regional economy of Southern Queensland is improving with strong demand for labour helping to support demand for both new and established housing.
Coal seam gas has been a hot topic for much of 2008, with the Southern Queensland economy a beneficiary in the short and medium term given the location of the Surat Basin. Several Liquefied Natural Gas (LNG) export facilities or ‘trains’ are being planned by Australian companies with joint venture parties from overseas.
After a record sorghum harvest in Southern Queensland, there was widespread sowing of wheat in early June following rain. Rainfall in the Darling Downs region was above the long term average in July, helping to establish winter crops. However there has been no significant rainfall in August.
Construction phase of the 630MW gas power station continues on the Darling Downs and is expected to employ over 400 people by the time it is commissioned in late 2009.
The value of residential building approvals remains high but below the peak. Non-residential building approvals have contracted sharply since mid 2006, having nearly halved over this period.
The unemployment rate has fallen to levels well below the national average in the first half of 2008.
House prices rose by 8% for the 12 months to June 2008 in both Toowoomba and Warwick, while annual house price gains in Ipswich jumped by 22%, outperforming Brisbane.
Your ANZ Regional Manager is: David Hunt (07) 4639 0542 [email protected]
Average rural land holding, $mn 0.99 1.13 1.31 1.29 1.53 1.68 2.14 3.17 Sources: ABS, ABARE, ATO, ANZ Economics and Markets Research.
ANZ Regional and Rural Quarterly - 01 September 2008
Page 20
Adelaide Hills and South East SA
The Adelaide Hills and South East SA region
Explosion in Blue Gum (Hardwood) Plantations
0 100 200 300 400
Softwood
Hardwood
Total
plantation hectares (thousand)
2000
2007
+85%
+752%
+187%
Green Triangle Region (SA/VIC)
year:
Source: Green Triangle Regional Plantation Committee
All signs point to the Adelaide Hills and South East SA regional economy performing well, with continued strong employment growth, rising building approvals and a jump in the participation rate in the jobs market.
With the commencement of the large ramp-up in blue gum harvesting over the next 12 months (see Victorian South West region), the Lower South East economy should receive a boost from the forestry and transport sectors.
Recent State and Federal Government announcements suggest that the water rescue packages will not be sufficient to save the rapidly deteriorating Lake Alexandrina. This is providing an uncertain outlook for the town of Meningie.
The Adelaide Hills economy continues to perform well, with strong population growth and a number of new sub-divisions opening in and around Mount Barker.
The outlook for crops and grazing in the South East remains good, due to the timing of rainfall and continued good commodity prices. Rainfall in the Murray Lands and Mallee regions has been patchy with the outlook more uncertain. However, good late winter and spring rains could still see average crop yields.
The outlook for the dairy industry in the South East is positive, with strong milk prices outweighing higher grain and fertilizer costs. The dairy industry in the Murray Lands remains uncertain given current water allocations.
Retail sales across the region are reported to have softened with higher interest rates.
Your ANZ Regional Manager is: Barry Clarke (08) 8725 5312 [email protected]
Average rural land holding, $mn 1.38 1.23 1.34 1.80 2.54 2.43 3.19 3.26 Sources: ABS, ABARE, ATO, ANZ Economics and Markets Research.
ANZ Regional and Rural Quarterly - 01 September 2008
Page 21
North East SA and Fleurieu
The North East SA and Fleurieu region
Employment growth is well above the national average
-6
-4
-2
0
2
4
6
8
10
12
02 03 04 05 06 07 08
North East SA and Fleurieu
Australia
% annual ch.Employment
Source: ABS and ANZ Economics and Markets Research
The North East SA and Fleurieu regional economy continues to grow, with concerns about future rainfall and water availability in the Riverland the only major negative.
The majority of the Fleurieu and McLaren Vale districts have so far received slightly above average winter rainfall, with farm dams nearing capacity.
Plans are being finalised to assist more McLaren Vale grape growers to connect to the Willunga Basin Water Company recycled water system. The McLaren Vale Grape Wine and Tourism Association, with funding from the State and Federal Governments will manage the $4 million project.
In the Riverland District, dryland farmers need further rains for crops. For citrus and grape growers the current irrigation season has commenced with a 2% allocation. Projections for water allocations for the 2008/09 SA irrigation season by March 2009 are a 75% chance of a 30% allocation and a 50% chance of a 72% allocation.
Economic conditions remain positive for the region with both residential and commercial building approvals growing strongly over the last 6 months.
Annual employment growth has reached 10% in recent months, drawing some people previously not seeking work into the job market. This is reflected in a rise in the participation rate in the region to around 68%.
Your ANZ Regional Manager is: Tait Jenkin (08) 8218 8135 [email protected]
Average rural land holding, $mn 1.11 1.22 1.45 2.12 2.20 2.24 2.39 2.45 Sources: ABS, ABARE, ATO, ANZ Economics and Markets Research.
ANZ Regional and Rural Quarterly - 01 September 2008
Page 22
North and West SA
The North and West SA region
Investment in the residential sector remains extremely strong
0
10
20
30
40
50
60
70
80
90
100
02 03 04 05 06 07 08
Residential
Non-residential
$mn, trend
Building approvals - North and West SA
Source: ABS and ANZ Economics and Markets Research
The townships of Whyalla, Port Augusta, Ceduna, Port Lincoln and Port Pirie are all reporting buoyant times, with high house prices and strong investment in new housing from mining related activity.
New commercial developments in Port Lincoln include the opening of a McDonald’s restaurant. Just 12 kilometres away from Port Lincoln, a major residential development is underway at the Point Boston Peninsula. Released in stages, it will ultimately boast 1,000 residential dwellings, with total investment reaching $400 million over a 10 year period.
Centrex Metals has secured 100-year rights to a 13 hectare wharf facility at Proper Bay. Centrex intends to develop the port as a bulk export facility from which it hopes to export around one milllion tonnes of iron ore.
For winter cropping on the Eyre Peninsula, crops around Port Lincoln have received reasonable rainfall and there is some optimism. Areas further north and west are quite patchy and many areas are suffering from below-average rainfall. In these areas the outlook for crops to achieve average grain yields is not as promising.
Despite some easing in non-residential building activity, levels still remain dramatically higher than before the resources boom. For example, in 2001 and 2002, the value of non-residential building approvals was static at around $12 million per month. This compares with the peak around the middle of last year, when activity reached nearly $45 million per month. Investment in residential buildings has also risen dramatically over the same period, especially over the last 18 months.
Employment growth continues to slow in the region with the unemployment rate rising to above 6%.
Your ANZ Regional Manager is: Adam Moss (08) 8821 3056 [email protected]
Average rural land holding, $mn 0.87 0.91 1.01 1.74 2.06 2.11 2.27 1.93 Sources: ABS, ABARE, ATO, ANZ Economics and Markets Research.
ANZ Regional and Rural Quarterly - 01 September 2008
Page 23
North WA
The North WA region
Early year rainfall was dramatically above long term averages
0
10
20
30
40
50
60
70
80
90
100
1 2 3 4 5 6 7 8 9 10 11 12
2007
2008
(mm)
calendar month
long term avg
Monthly Rainfall - Western Gascoyne
Source: BOM and ANZ Economics and Markets Research
Northern WA continues to be one of the strongest performing regions across Australia as it benefits from on-going developments in the mining sector.
Rio has announced the commencement of a fly-in fly-out service from Carnarvon to its Tom Price and Paraburdoo operations in the Pilbara.
It has been a reasonable cattle season in the Pilbara, but a slow start to mustering. Karratha continues to develop, with approval for an $80m nine-storey residential building (the tallest building in WA north of Perth). The Pluto Gas project is expected to reach maximum construction activity by December, bringing an additional 3000 workers to Karratha.
BHP is planning to increase iron ore output from Mt Newman from 150Mtons to 330Mtons per annum. Iron ore loading facilities out of Karratha have been ramped up to cater for this increase, while Cape Lambert’s facilities are also expanding.
Demand for commercial and residential buildings remains at unprecedented levels throughout the Pilbara. Weekly rental prices for housing in the town of Newman are approaching $1,500 per week in some instances.
In the Gascoyne region, the tourism industry has grown rapidly in recent years and is now one of the largest contributors to this regional economy. Some operators in the region are reporting cancellations, in-part from higher fuel prices. Elsewhere, Broome retailers are experiencing steady turnover but higher costs are reducing margins.
Higher than average rainfall over the coastal Gascoyne is ensuring ample cattle feed but weaker beef prices are a negative. This has also assured the local horticultural industry in the area, with adequate water supply now for several years.
Your ANZ Regional Manager is: Ian Bethune (08) 9921 6914 [email protected]
Average rural land holding, $mn 1.75 1.84 1.94 2.44 2.60 2.56 2.86 3.43 Sources: ABS, ABARE, ATO, ANZ Economics and Markets Research.
ANZ Regional and Rural Quarterly - 01 September 2008
Page 24
South WA
The South WA region
A wet July has set up the winter crop for above yields in some areas
0
10
20
30
40
50
60
70
80
90
1 2 3 4 5 6 7 8 9 10 11 12
2007
2008
(mm)
calendar month
long term avg
Monthly Rainfall - South Central
Source: BOM and ANZ Economics and Markets Research
Business conditions in the southern WA region are more mixed than in the north but pockets of strength still exist.
The gas crisis in WA was a major event over the last quarter, with 30% of the state’s gas supply lost from the explosion on Varanus Island in June. While around two-thirds of the lost supply has been restored, the remaining one-third is not expected to be re-instated until December.
The gas crisis has had some impact across the southern region by reducing existing demand for labour and increasing costs. Industries and businesses have reduced working hours, with some staff either sent on holidays or had 'permanent' overtime reduced. Prime Laundry, a business catering to more than 80 per cent of the state's hotels in major tourism areas, was forced to pay five times more for gas in July.
With this negative impact on local businesses in the area, plus tighter financial conditions, it is not surprising to see a rise in the unemployment rate (to around 5%).
Residential building approvals in the region have slowed and are well below year earlier levels, down by around 16% year-on-year. Investment in new commercial property remains high but may be at a peak.
Along the coast, property prices have been mixed. Bunbury house prices fell by 3% over the course of the 2007/08 financial year, while prices in Busselton rose by 2%. House prices in Albany jumped sharply (+19% year-on-year), with the median house price $728,500 at 30th June 2008.
The outlook for the WA winter crop remains positive. Rainfall in July has particularly helped crops in the central, eastern and northern wheatbelts given the poor planting conditions in May and June. Yield potential remains above average in areas such as the Great Southern.
Your ANZ Regional Manager is: David Whitby (08) 9323 8228 [email protected]
Average rural land holding, $mn 1.75 1.94 2.23 2.56 3.08 3.37 3.59 3.82 Sources: ABS, ABARE, ATO, ANZ Economics and Markets Research.
ANZ Regional and Rural Quarterly - 01 September 2008
Page 25
Tasmania
Tasmania
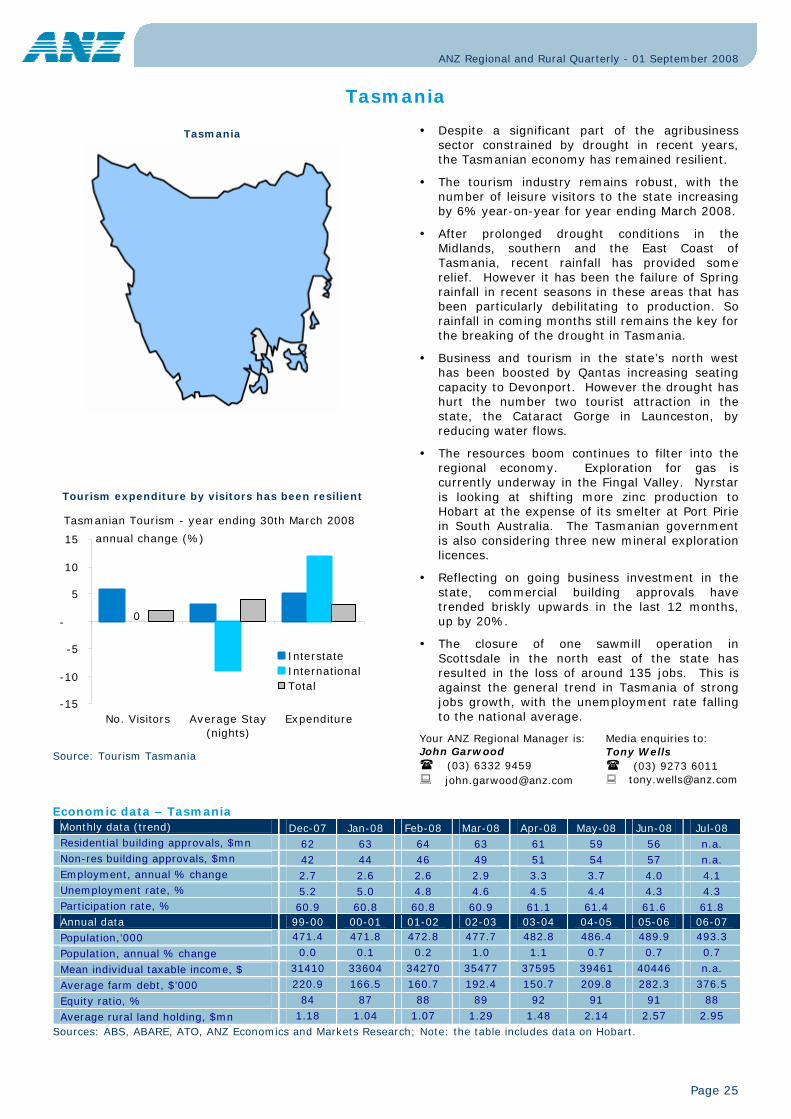
Tourism expenditure by visitors has been resilient
0
-15
-10
-5
-
5
10
15
No. Visitors Average Stay(nights)
Expenditure
InterstateInternationalTotal
Tasmanian Tourism - year ending 30th March 2008
annual change (%)
Source: Tourism Tasmania
Despite a significant part of the agribusiness sector constrained by drought in recent years, the Tasmanian economy has remained resilient.
The tourism industry remains robust, with the number of leisure visitors to the state increasing by 6% year-on-year for year ending March 2008.
After prolonged drought conditions in the Midlands, southern and the East Coast of Tasmania, recent rainfall has provided some relief. However it has been the failure of Spring rainfall in recent seasons in these areas that has been particularly debilitating to production. So rainfall in coming months still remains the key for the breaking of the drought in Tasmania.
Business and tourism in the state’s north west has been boosted by Qantas increasing seating capacity to Devonport. However the drought has hurt the number two tourist attraction in the state, the Cataract Gorge in Launceston, by reducing water flows.
The resources boom continues to filter into the regional economy. Exploration for gas is currently underway in the Fingal Valley. Nyrstar is looking at shifting more zinc production to Hobart at the expense of its smelter at Port Pirie in South Australia. The Tasmanian government is also considering three new mineral exploration licences.
Reflecting on going business investment in the state, commercial building approvals have trended briskly upwards in the last 12 months, up by 20%.
The closure of one sawmill operation in Scottsdale in the north east of the state has resulted in the loss of around 135 jobs. This is against the general trend in Tasmania of strong jobs growth, with the unemployment rate falling to the national average.
Your ANZ Regional Manager is: John Garwood (03) 6332 9459 [email protected]
Average rural land holding, $mn 1.18 1.04 1.07 1.29 1.48 2.14 2.57 2.95 Sources: ABS, ABARE, ATO, ANZ Economics and Markets Research; Note: the table includes data on Hobart.
ANZ Regional and Rural Quarterly - 01 September 2008
Page 26
Northern Territory
Northern Territory
Below average rainfall in the Barkly Tablelands
0
50
100
150
200
250
1 2 3 4 5 6 7 8 9 10 11 12
2007
2008
(mm)
calendar month
long term avg
Monthly Rainfall - Barkly Tablelands
Source: BOM and ANZ Economics and Markets Research
The NT economy presents something of a mixed picture, with a weakening residential sector contrasting with strong business investment.
The boom in house prices appears to be easing. Darwin prices were broadly flat over the first six months of 2008 after rising strongly through most of this decade.
Dwelling construction approvals continue to sag under the weight of high interest rates despite solid population growth, a buoyant labour market and a very low rental vacancy rate. The number of trend monthly approvals in June 2008 was the lowest in five years.
Non dwelling construction approvals also appear to have softened in recent months although this is a volatile and “lumpy” sector. Perhaps a better indicator of business confidence in the NT economy is that expenditure on mineral exploration continues to rise strongly; spending in the March quarter in trend terms was 44% higher than a year earlier. Expenditure on exploration for petroleum also remains at high levels. Total trend business investment increased by 5.5% in the March quarter
Consumer retail spending remains buoyant, although it has cooled somewhat over the first half of 2008.
Another sign of generally strong business activity is the continued fall in the unemployment rate, which in July reached 2.9% in trend terms, the second lowest just behind the ACT. This is in marked contrast to the other “mining heavy” states of WA and Qld, where the unemployment rate is much higher and beginning to edge up.
As elsewhere in Australia, availability of water continues to be an issue. Drought conditions in the Barkly Tablelands has seen a significant movement of cattle into eastern Queensland and higher north within the state.
Your ANZ Regional Manager is: Michael Wake (08) 8982 3504 [email protected]
Average rural land holding, $mn 2.73 3.59 3.72 3.11 3.94 5.31 8.14 11.00 Sources: ABS, ABARE, ATO, ANZ Economics and Markets Research; Note: the table includes data on Darwin.
ANZ Regional and Rural Quarterly - 01 September 2008
Page 27
Contacts ANZ Economics & Markets Research Saul Eslake Fiona Allen Chief Economist Business Manager
ANZ Regional and Rural Quarterly - 01 September 2008
Page 28
Important Notice
Australia and New Zealand Banking Group Limited is represented in:
AUSTRALIA by:
Australia and New Zealand Banking Group Limited ABN 11 005 357 522
14th Floor 100 Queen Street, Melbourne, Victoria, 3000, Australia
Telephone +61 3 9273 6224 Fax +61 3 9273 5711
UNITED KINGDOM by:
Australia and New Zealand Banking Group Limited
ABN 11 005 357 522
40 Bank Street, Canary Wharf, London, E14 5EJ, United Kingdom
Telephone +44 20 3229 2121 Fax +44 20 7378 2378
UNITED STATES OF AMERICA by:
ANZ Securities, Inc. (Member of NASD and SIPC)
6th Floor 1177 Avenue of the Americas
New York, NY 10036, United States of America
Tel: +1 212 801 9160 Fax: +1 212 801 9163
NEW ZEALAND by:
ANZ National Bank Limited
Level 7, 1-9 Victoria Street, Wellington, New Zealand
Telephone +64 4 802 2000 This document (“document”) is distributed to you in Australia and the United Kingdom by Australia and New Zealand Banking Group Limited ABN 11 005 357 522 (“ANZ”) and in New Zealand by ANZ National Bank Limited (“ANZ NZ”). ANZ holds an Australian Financial Services licence no. 234527 and is authorised in the UK by the Financial Services Authority (“FSA”).
This document is being distributed in the United States by ANZ Securities, Inc. (“ANZ S”) (an affiliated company of ANZ), which accepts responsibility for its content. Further information on any securities referred to herein may be obtained from ANZ S upon request. Any US person(s) receiving this document and wishing to effect transactions in any securities referred to herein should contact ANZ S, not its affiliates.
This document is being distributed in the United Kingdom by ANZ for the information of its market counterparties and intermediate customers only. It is not intended for and must not be distributed to private customers. In the UK, ANZ is regulated by the FSA. Nothing here excludes or restricts any duty or liability to a customer which ANZ may have under the UK Financial Services and Markets Act 2000 or under the regulatory system as defined in the Rules of the FSA.
This document is issued on the basis that it is only for the information of the particular person to whom it is provided. This document may not be reproduced, distributed or published by any recipient for any purpose. This document does not take into account your personal needs and financial circumstances. Under no circumstances is this document to be used or considered as an offer to sell, or a solicitation of an offer to buy.
In addition, from time to time ANZ, ANZ NZ, ANZ S, their affiliated companies, or their respective associates and employees may have an interest in any financial products (as defined by the Australian Corporations Act 2001), securities or other investments, directly or indirectly the subject of this document (and may receive commissions or other remuneration in relation to the sale of such financial products, securities or other investments), or may perform services for, or solicit business from, any company the subject of this document. If you have been referred to ANZ, ANZ NZ, ANZ S or their affiliated companies by any person, that person may receive a benefit in respect of any transactions effected on your behalf, details of which will be available upon request.
The information herein has been obtained from, and any opinions herein are based upon, sources believed reliable. The views expressed in this document accurately reflect the author’s personal views, including those about any and all of the securities and issuers referred to herein. The author however makes no representation as to its accuracy or completeness and the information should not be relied upon as such. All opinions and estimates herein reflect the author’s judgement on the date of this document and are subject to change without notice. No part of the author's compensation was, is or will directly or indirectly relate to specific recommendations or views expressed about any securities or issuers in this document. ANZ, ANZ NZ, ANZ S, their affiliated companies, their respective directors, officers, and employees disclaim any responsibility, and shall not be liable, for any loss, damage, claim, liability, proceedings, cost or expense (“Liability”) arising directly or indirectly (and whether in tort (including negligence), contract, equity or otherwise) out of or in connection with the contents of and/or any omissions from this communication except where a Liability is made non-excludable by legislation.
Where the recipient of this publication conducts a business, the provisions of the Consumer Guarantees Act 1993 (NZ) shall not apply.