123
Mastercard Index of Women Entrepreneurs (MIWE) 2018
MastercardIndex of WomenEntrepreneurs(MIWE) 2018
MA
ST
ER
CA
RD
IND
EX
OF
WO
ME
N E
NT
RE
PR
EN
EU
RS
2018
www.newsroom.mastercard.com
1.0Introduction
2.0Overview of Key
Findings
9 18
24
32
39
44
Table ofContents
1.1. Description of Indicator and Sources
2.1. Benchmark: Women Business Owners
2.2. Results of The Mastercard Index of Women Entrepreneurs (MIWE)
2.3. Component A: Women’s Advancement Outcomes
2.4. Component B: Knowledge Assets & Financial Access
2.5. Component C: Supporting Entrepreneurial Conditions
152
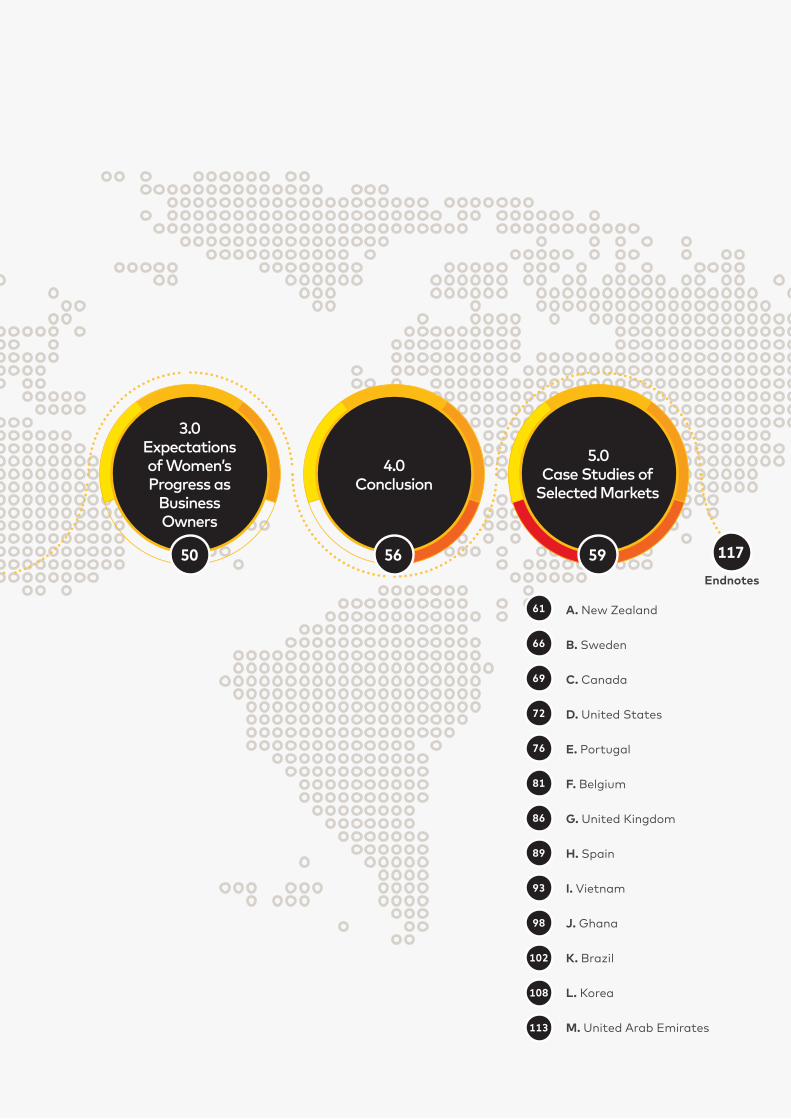
4.0Conclusion
3.0Expectations of Women’sProgress as
Business Owners
5.0Case Studies of
Selected Markets
61
66
69
72
76
81
86
93
89
98
102
108
113
A. New Zealand
B. Sweden
C. Canada
D. United States
E. Portugal
F. Belgium
G. United Kingdom
H. Spain
I. Vietnam
J. Ghana
K. Brazil
L. Korea
M. United Arab Emirates
Endnotes
59 1175650
1.0
miwe 2018 2
Introduction
1.0
3 components
12 indicators
25 sub-indicators
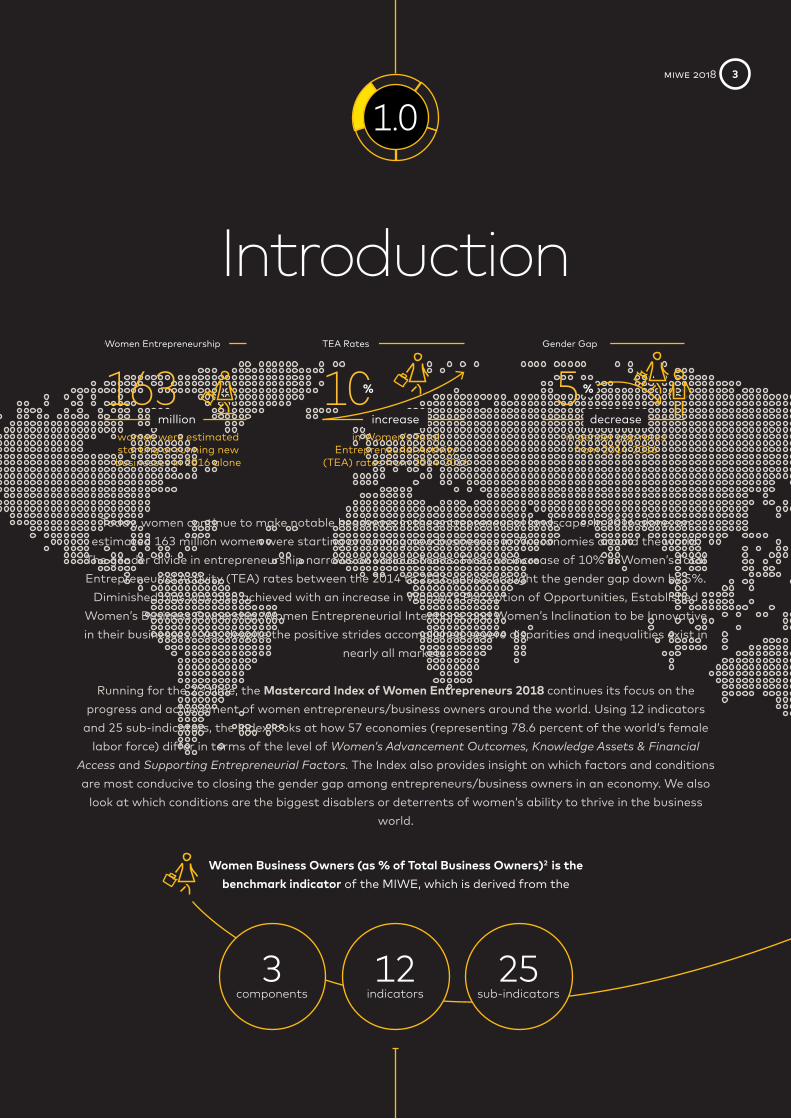
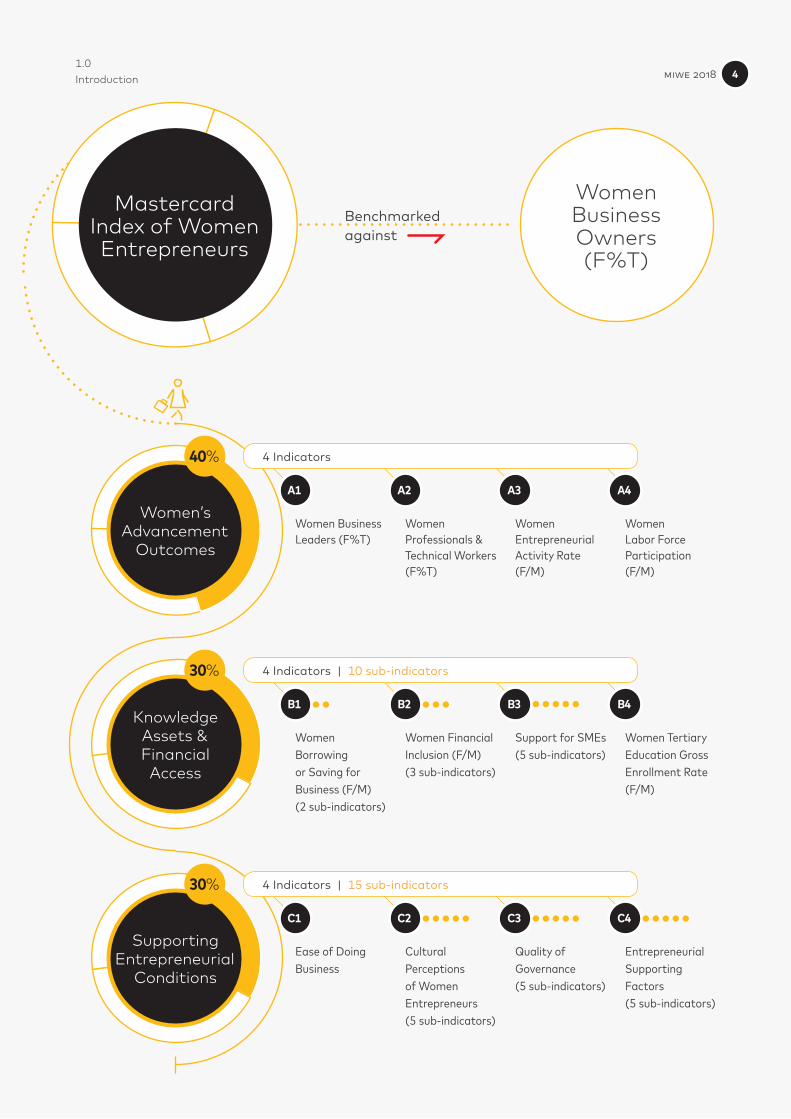
Women Business Owners (as % of Total Business Owners)2 is the benchmark indicator of the MIWE, which is derived from the
Today, women continue to make notable headways in the entrepreneurial landscape. In 2016 alone, an estimated 163 million women were starting or running new businesses in 74 economies around the world.
The gender divide in entrepreneurship narrows on various fronts. First, an increase of 10% in Women’s Total Entrepreneurial Activity (TEA) rates between the 2014 to 2016 period brought the gender gap down by 5%.
Diminished bias was also achieved with an increase in Women’s Perception of Opportunities, Established Women’s Business Ownership, Women Entrepreneurial Intentions, and Women’s Inclination to be Innovative in their businesses.1 Yet, despite the positive strides accomplished, severe disparities and inequalities exist in
nearly all markets.
Running for the 2nd time, the Mastercard Index of Women Entrepreneurs 2018 continues its focus on the progress and achievement of women entrepreneurs/business owners around the world. Using 12 indicators
and 25 sub-indicators, the Index looks at how 57 economies (representing 78.6 percent of the world’s female labor force) differ in terms of the level of Women’s Advancement Outcomes, Knowledge Assets & Financial
Access and Supporting Entrepreneurial Factors. The Index also provides insight on which factors and conditions are most conducive to closing the gender gap among entrepreneurs/business owners in an economy. We also
look at which conditions are the biggest disablers or deterrents of women’s ability to thrive in the business world.
163 10 5million
Women Entrepreneurship TEA Rates Gender Gap
women were estimated starting or running new businesses in 2016 alone
in Women’s Total Entrepreneurial Activity
(TEA) rates from 2014-2016
in gender gap rates from 2014-2016
% %
increase decrease
miwe 2018 3
Women’s Advancement
Outcomes
Knowledge Assets &Financial
Access
Supporting Entrepreneurial
Conditions
WomenBusinessOwners(F%T)
40%
30%
30%
A1
B1
C1
A2
B2
C2
A3
B3
C3
A4
B4
C4
Mastercard Index of Women Entrepreneurs
4 Indicators
4 Indicators | 10 sub-indicators
4 Indicators | 15 sub-indicators
Women Business Leaders (F%T)
Women Borrowing or Saving for Business (F/M)(2 sub-indicators)
Ease of Doing Business
Women Professionals & Technical Workers(F%T)
Women Financial Inclusion (F/M)(3 sub-indicators)
Cultural Perceptions of Women Entrepreneurs (5 sub-indicators)
Women Entrepreneurial Activity Rate (F/M)
Support for SMEs(5 sub-indicators)
Quality of Governance(5 sub-indicators)
Women Labor Force Participation (F/M)
Women Tertiary Education Gross Enrollment Rate (F/M)
Entrepreneurial Supporting Factors(5 sub-indicators)
Benchmarked against
1.0 Introduction miwe 2018 4
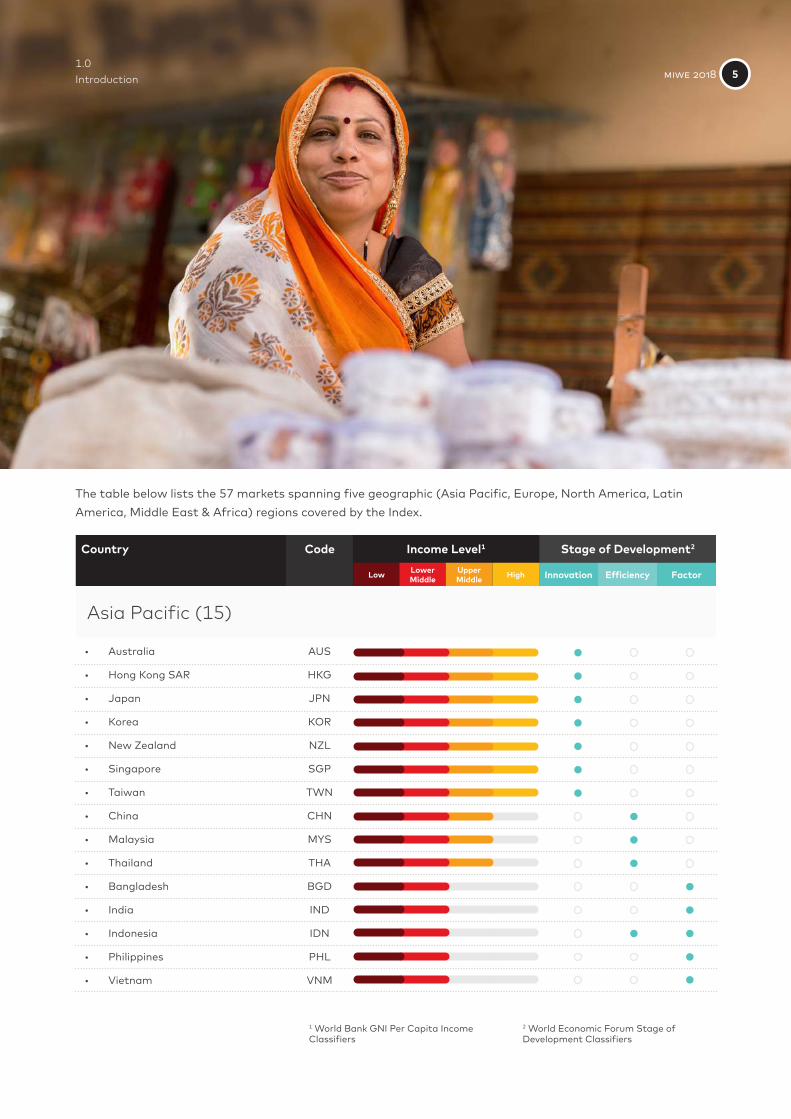
Asia Pacific (15)
The table below lists the 57 markets spanning five geographic (Asia Pacific, Europe, North America, Latin America, Middle East & Africa) regions covered by the Index.
AUS
HKG
JPN
KOR
NZL
SGP
TWN
CHN
MYS
THA
BGD
IND
IDN
PHL
VNM
• Australia
• Hong Kong SAR
• Japan
• Korea
• New Zealand
• Singapore
• Taiwan
• China
• Malaysia
• Thailand
• Bangladesh
• India
• Indonesia
• Philippines
• Vietnam
1 World Bank GNI Per Capita Income Classifiers
2 World Economic Forum Stage of Development Classifiers
Country Stage of Development2Income Level1
Low Lower Middle InnovationUpper
Middle Efficiency High Factor
Code
1.0 Introduction miwe 2018 5
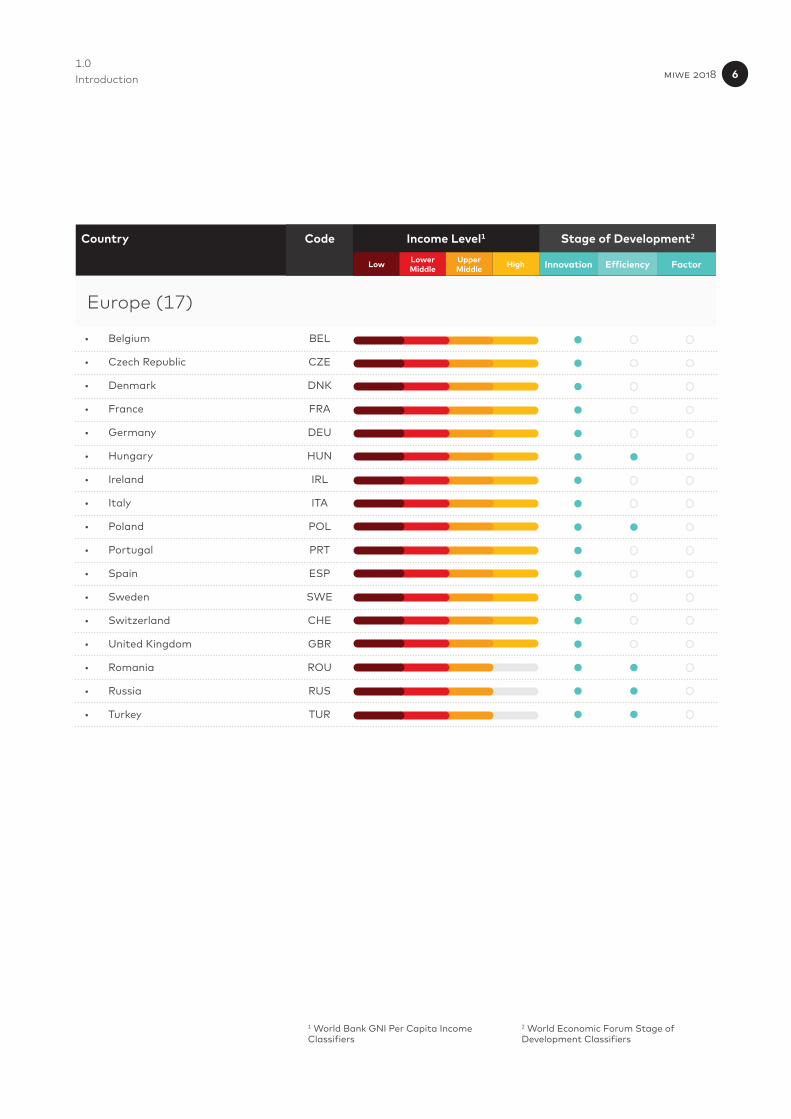
Europe (17)
BEL
CZE
DNK
FRA
DEU
HUN
IRL
ITA
POL
PRT
ESP
SWE
CHE
GBR
ROU
RUS
TUR
• Belgium
• Czech Republic
• Denmark
• France
• Germany
• Hungary
• Ireland
• Italy
• Poland
• Portugal
• Spain
• Sweden
• Switzerland
• United Kingdom
• Romania
• Russia
• Turkey
1 World Bank GNI Per Capita Income Classifiers
2 World Economic Forum Stage of Development Classifiers
Country Stage of Development2Income Level1
Low Lower Middle InnovationUpper
Middle Efficiency High Factor
Code
1.0 Introduction miwe 2018 6
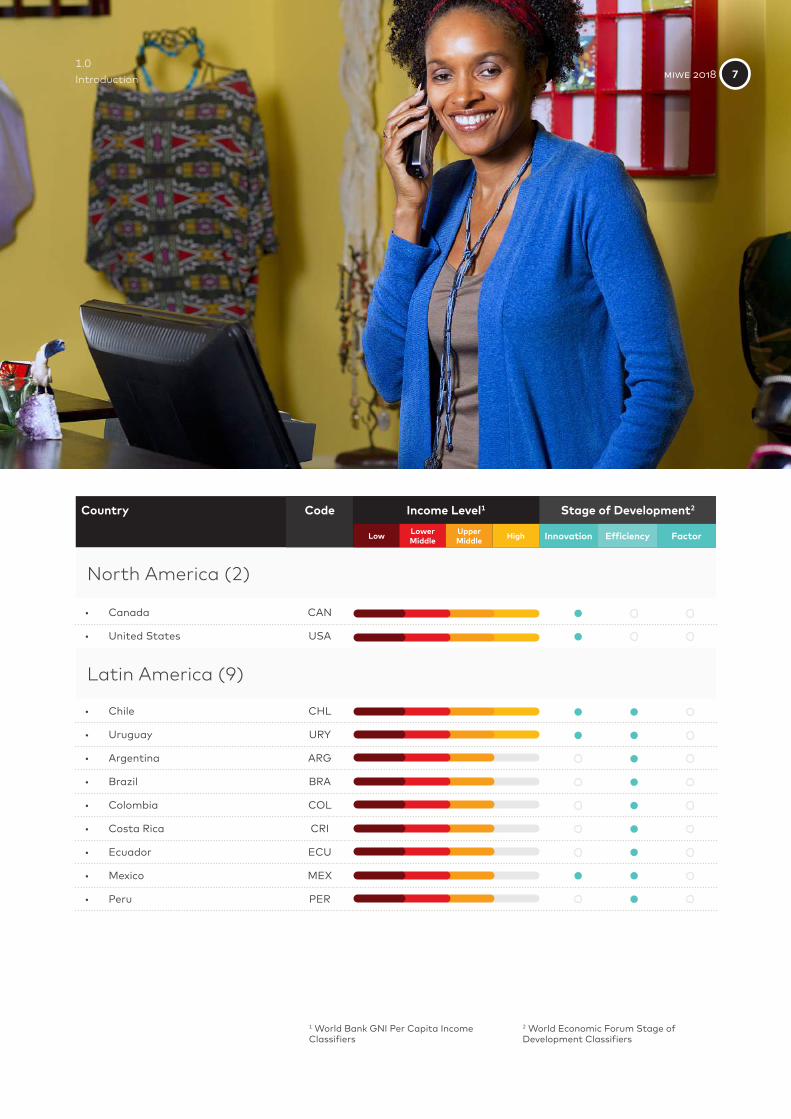
North America (2)
Latin America (9)
CHL
URY
ARG
BRA
COL
CRI
ECU
MEX
PER
CAN
USA
• Chile
• Uruguay
• Argentina
• Brazil
• Colombia
• Costa Rica
• Ecuador
• Mexico
• Peru
• Canada
• United States
1 World Bank GNI Per Capita Income Classifiers
2 World Economic Forum Stage of Development Classifiers
Country Stage of Development2Income Level1
Low Lower Middle InnovationUpper
Middle Efficiency High Factor
Code
1.0 Introduction miwe 2018 7
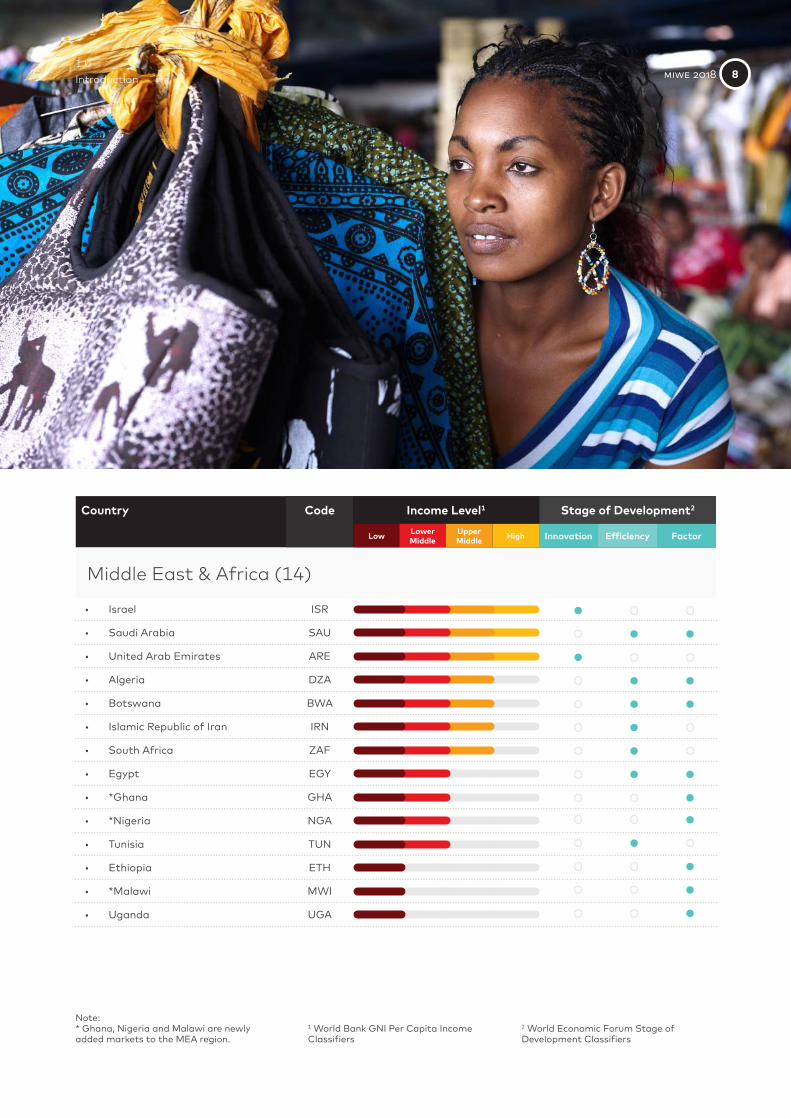
Middle East & Africa (14)
ISR
SAU
ARE
DZA
BWA
IRN
ZAF
EGY
GHA
NGA
TUN
ETH
MWI
UGA
• Israel
• Saudi Arabia
• United Arab Emirates
• Algeria
• Botswana
• Islamic Republic of Iran
• South Africa
• Egypt
• *Ghana
• *Nigeria
• Tunisia
• Ethiopia
• *Malawi
• Uganda
Note: * Ghana, Nigeria and Malawi are newly added markets to the MEA region.
1 World Bank GNI Per Capita Income Classifiers
2 World Economic Forum Stage of Development Classifiers
Country Stage of Development2Income Level1
Low Lower Middle InnovationUpper
Middle Efficiency High Factor
Code
1.0 Introduction miwe 2018 8
Component A:Women’s Advancement Outcomes
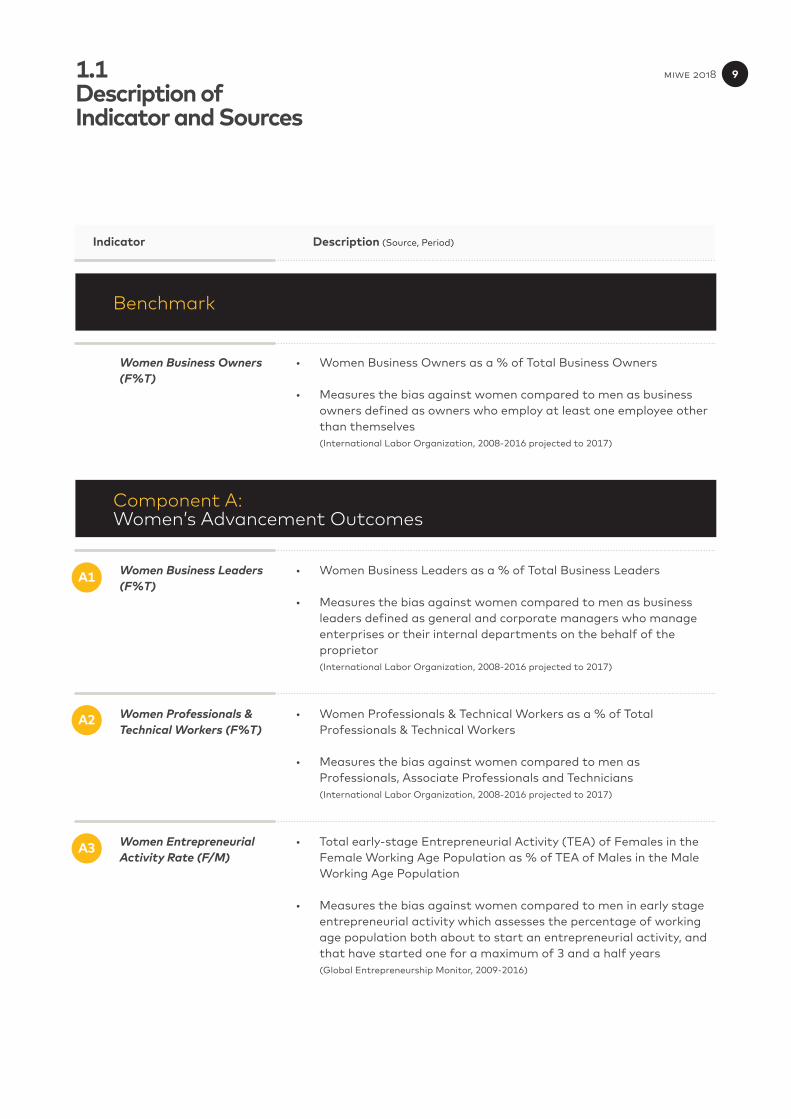
Benchmark
Indicator Description (Source, Period)
A1
A2
A3
Women Business Owners (F%T)
• Women Business Owners as a % of Total Business Owners
• Measures the bias against women compared to men as business owners defined as owners who employ at least one employee other than themselves (International Labor Organization, 2008-2016 projected to 2017)
• Women Business Leaders as a % of Total Business Leaders
• Measures the bias against women compared to men as business leaders defined as general and corporate managers who manage enterprises or their internal departments on the behalf of the proprietor (International Labor Organization, 2008-2016 projected to 2017)
• Women Professionals & Technical Workers as a % of Total Professionals & Technical Workers
• Measures the bias against women compared to men as Professionals, Associate Professionals and Technicians (International Labor Organization, 2008-2016 projected to 2017)
• Total early-stage Entrepreneurial Activity (TEA) of Females in the Female Working Age Population as % of TEA of Males in the Male Working Age Population
• Measures the bias against women compared to men in early stage entrepreneurial activity which assesses the percentage of working age population both about to start an entrepreneurial activity, and that have started one for a maximum of 3 and a half years (Global Entrepreneurship Monitor, 2009-2016)
Women Business Leaders (F%T)
Women Professionals & Technical Workers (F%T)
Women Entrepreneurial Activity Rate (F/M)
1.1 Description of Indicator and Sources
miwe 2018 9
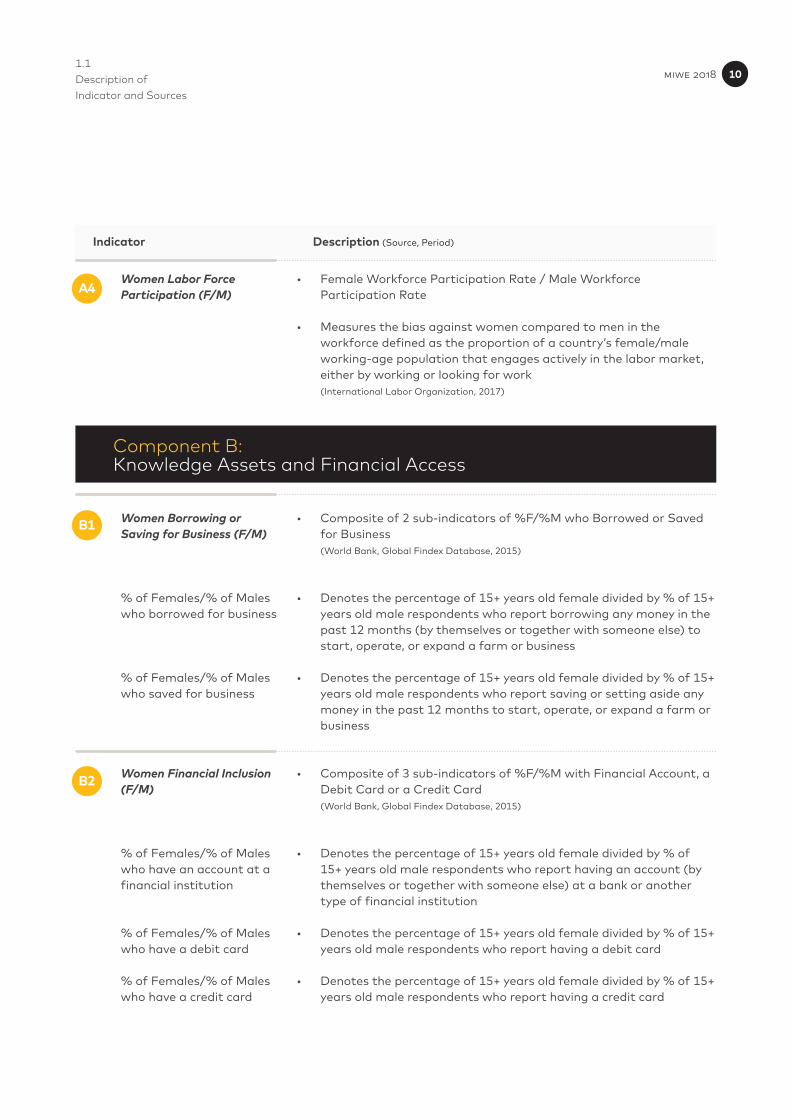
Component B:Knowledge Assets and Financial Access
Indicator Description (Source, Period)
B1
B2
• Composite of 2 sub-indicators of %F/%M who Borrowed or Saved for Business (World Bank, Global Findex Database, 2015)
• Denotes the percentage of 15+ years old female divided by % of 15+ years old male respondents who report borrowing any money in the past 12 months (by themselves or together with someone else) to start, operate, or expand a farm or business
• Denotes the percentage of 15+ years old female divided by % of 15+ years old male respondents who report saving or setting aside any money in the past 12 months to start, operate, or expand a farm or business
• Composite of 3 sub-indicators of %F/%M with Financial Account, a Debit Card or a Credit Card (World Bank, Global Findex Database, 2015)
• Denotes the percentage of 15+ years old female divided by % of 15+ years old male respondents who report having an account (by themselves or together with someone else) at a bank or another type of financial institution
• Denotes the percentage of 15+ years old female divided by % of 15+ years old male respondents who report having a debit card
• Denotes the percentage of 15+ years old female divided by % of 15+ years old male respondents who report having a credit card
Women Borrowing or Saving for Business (F/M) % of Females/% of Males who borrowed for business % of Females/% of Males who saved for business
Women Financial Inclusion (F/M) % of Females/% of Males who have an account at a financial institution % of Females/% of Males who have a debit card % of Females/% of Males who have a credit card
A4• Female Workforce Participation Rate / Male Workforce
Participation Rate
• Measures the bias against women compared to men in the workforce defined as the proportion of a country’s female/male working-age population that engages actively in the labor market, either by working or looking for work (International Labor Organization, 2017)
Women Labor Force Participation (F/M)
1.1 Description of Indicator and Sources
miwe 2018 10
Component C:Entrepreneurial Supporting Conditions
Indicator Description (Source, Period)
C1
B3
B4
• Measures the gap between an economy’s business regulation environment and the best practice (World Bank, Doing Business Database, 2017)
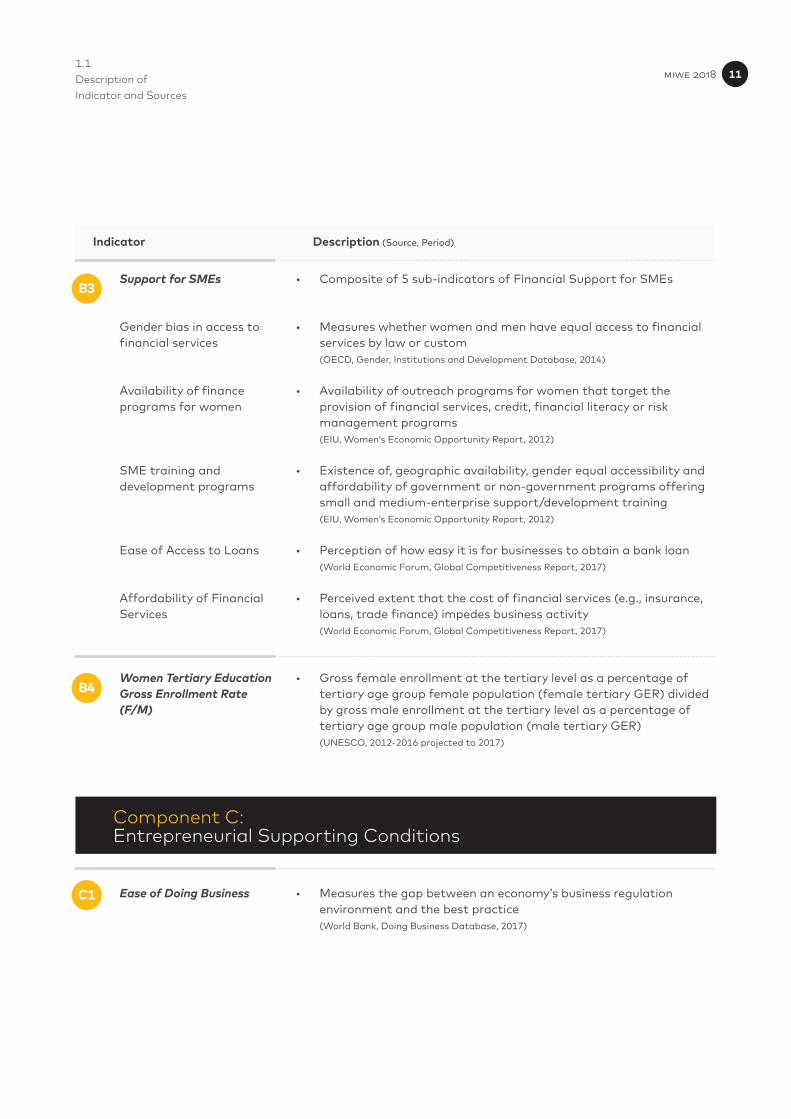
• Composite of 5 sub-indicators of Financial Support for SMEs
• Measures whether women and men have equal access to financial services by law or custom (OECD, Gender, Institutions and Development Database, 2014)
• Availability of outreach programs for women that target the provision of financial services, credit, financial literacy or risk management programs (EIU, Women’s Economic Opportunity Report, 2012)
• Existence of, geographic availability, gender equal accessibility and affordability of government or non-government programs offering small and medium-enterprise support/development training (EIU, Women’s Economic Opportunity Report, 2012)
• Perception of how easy it is for businesses to obtain a bank loan (World Economic Forum, Global Competitiveness Report, 2017)
• Perceived extent that the cost of financial services (e.g., insurance, loans, trade finance) impedes business activity (World Economic Forum, Global Competitiveness Report, 2017)
• Gross female enrollment at the tertiary level as a percentage of tertiary age group female population (female tertiary GER) divided by gross male enrollment at the tertiary level as a percentage of tertiary age group male population (male tertiary GER) (UNESCO, 2012-2016 projected to 2017)
Ease of Doing Business
Support for SMEs Gender bias in access to financial services Availability of finance programs for women SME training and development programs Ease of Access to Loans Affordability of Financial Services
Women Tertiary Education Gross Enrollment Rate (F/M)
1.1 Description of Indicator and Sources
miwe 2018 11
Indicator Description (Source, Period)
C2
C3
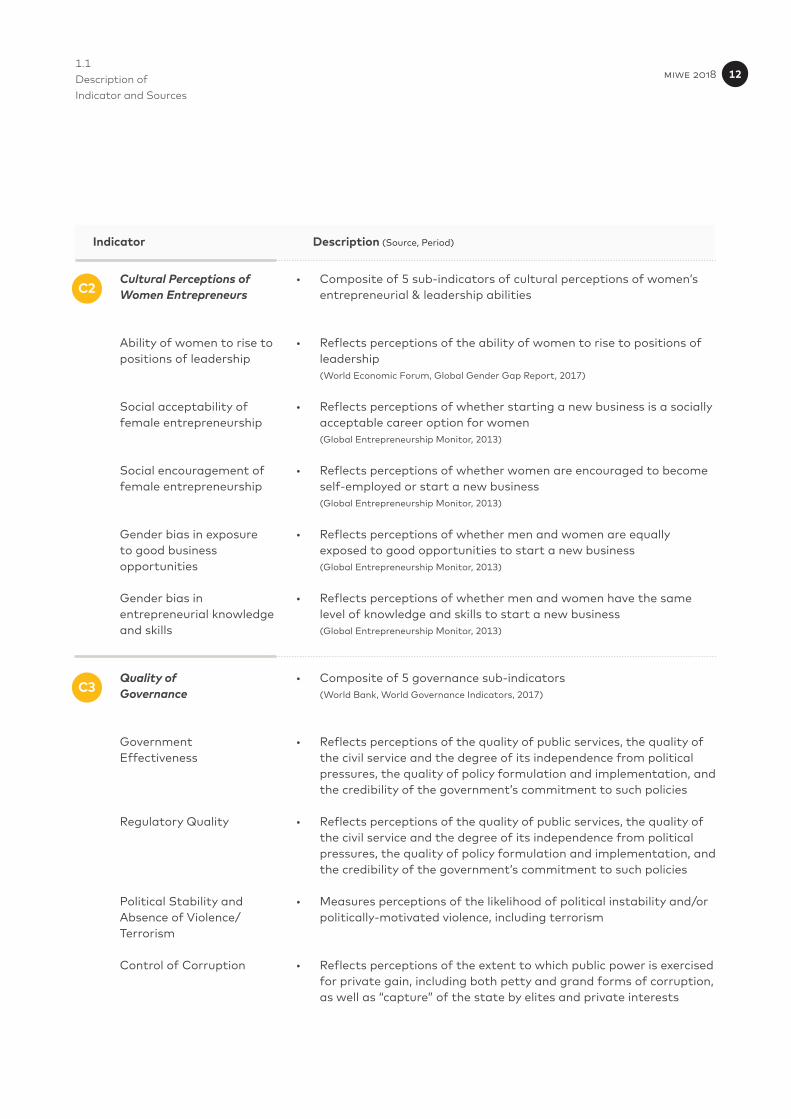
• Composite of 5 sub-indicators of cultural perceptions of women’s entrepreneurial & leadership abilities
• Reflects perceptions of the ability of women to rise to positions of leadership (World Economic Forum, Global Gender Gap Report, 2017)
• Reflects perceptions of whether starting a new business is a socially acceptable career option for women (Global Entrepreneurship Monitor, 2013)
• Reflects perceptions of whether women are encouraged to become self-employed or start a new business (Global Entrepreneurship Monitor, 2013)
• Reflects perceptions of whether men and women are equally exposed to good opportunities to start a new business (Global Entrepreneurship Monitor, 2013)
• Reflects perceptions of whether men and women have the same level of knowledge and skills to start a new business (Global Entrepreneurship Monitor, 2013)
• Composite of 5 governance sub-indicators (World Bank, World Governance Indicators, 2017)
• Reflects perceptions of the quality of public services, the quality of the civil service and the degree of its independence from political pressures, the quality of policy formulation and implementation, and the credibility of the government’s commitment to such policies
• Reflects perceptions of the quality of public services, the quality of the civil service and the degree of its independence from political pressures, the quality of policy formulation and implementation, and the credibility of the government’s commitment to such policies
• Measures perceptions of the likelihood of political instability and/or politically-motivated violence, including terrorism
• Reflects perceptions of the extent to which public power is exercised for private gain, including both petty and grand forms of corruption, as well as “capture” of the state by elites and private interests
Cultural Perceptions of Women Entrepreneurs Ability of women to rise to positions of leadership
Social acceptability of female entrepreneurship
Social encouragement of female entrepreneurship
Gender bias in exposure to good business opportunities Gender bias in entrepreneurial knowledge and skills
Quality ofGovernance
GovernmentEffectiveness
Regulatory Quality Political Stability and Absence of Violence/Terrorism Control of Corruption
1.1 Description of Indicator and Sources
miwe 2018 12
Supporting Data
Indicator Description (Source, Period)
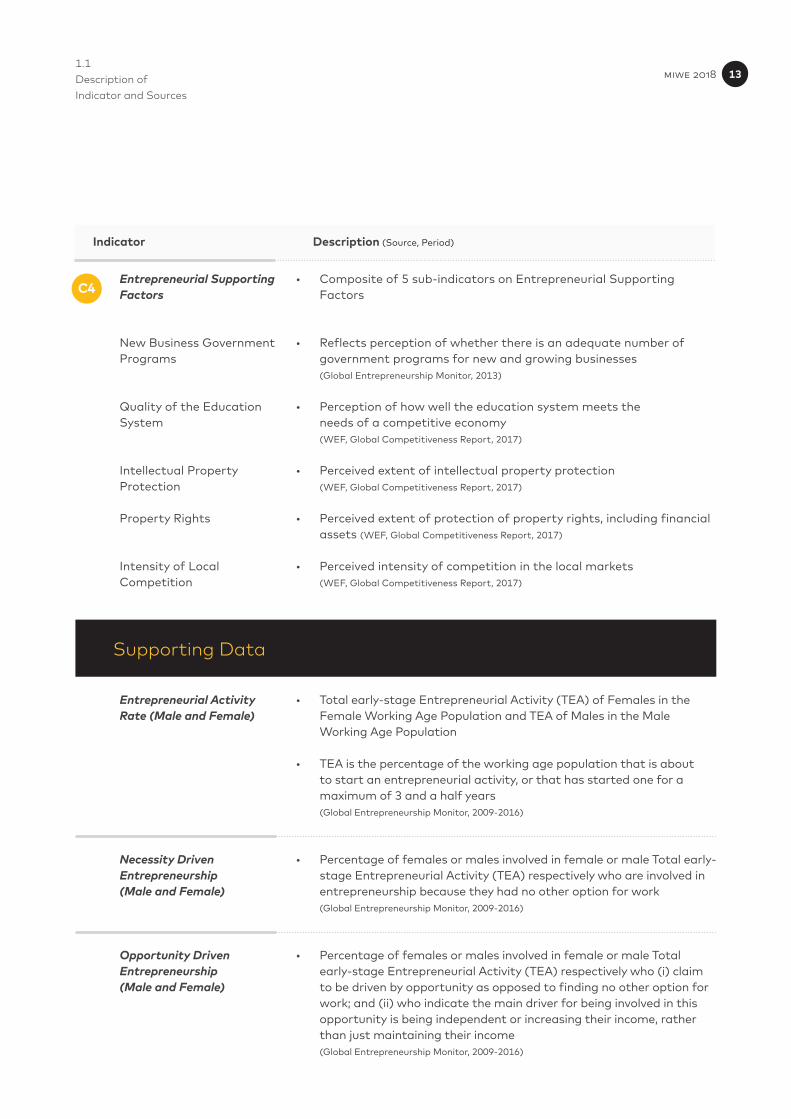
C4
• Total early-stage Entrepreneurial Activity (TEA) of Females in the Female Working Age Population and TEA of Males in the Male Working Age Population
• TEA is the percentage of the working age population that is about to start an entrepreneurial activity, or that has started one for a maximum of 3 and a half years (Global Entrepreneurship Monitor, 2009-2016)
• Percentage of females or males involved in female or male Total early-stage Entrepreneurial Activity (TEA) respectively who are involved in entrepreneurship because they had no other option for work (Global Entrepreneurship Monitor, 2009-2016)
• Percentage of females or males involved in female or male Total early-stage Entrepreneurial Activity (TEA) respectively who (i) claim to be driven by opportunity as opposed to finding no other option for work; and (ii) who indicate the main driver for being involved in this opportunity is being independent or increasing their income, rather than just maintaining their income (Global Entrepreneurship Monitor, 2009-2016)
• Composite of 5 sub-indicators on Entrepreneurial Supporting Factors
• Reflects perception of whether there is an adequate number of government programs for new and growing businesses (Global Entrepreneurship Monitor, 2013)
• Perception of how well the education system meets the needs of a competitive economy (WEF, Global Competitiveness Report, 2017)
• Perceived extent of intellectual property protection (WEF, Global Competitiveness Report, 2017)
• Perceived extent of protection of property rights, including financial assets (WEF, Global Competitiveness Report, 2017)
• Perceived intensity of competition in the local markets (WEF, Global Competitiveness Report, 2017)
Entrepreneurial Activity Rate (Male and Female) Necessity Driven Entrepreneurship(Male and Female)
Opportunity Driven Entrepreneurship(Male and Female)
Entrepreneurial Supporting Factors
New Business Government Programs Quality of the Education System Intellectual Property Protection Property Rights Intensity of Local Competition
1.1 Description of Indicator and Sources
miwe 2018 13
Indicator Description (Source, Period)
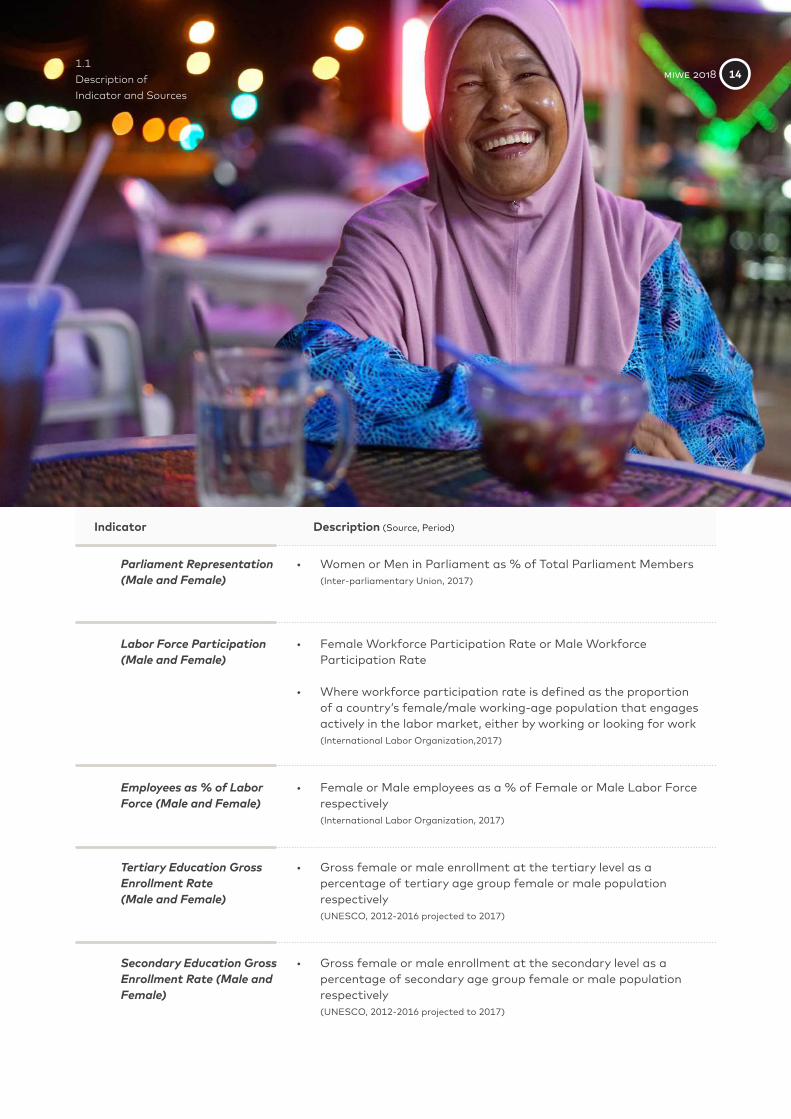
• Women or Men in Parliament as % of Total Parliament Members (Inter-parliamentary Union, 2017)
• Female Workforce Participation Rate or Male Workforce Participation Rate
• Where workforce participation rate is defined as the proportion of a country’s female/male working-age population that engages actively in the labor market, either by working or looking for work (International Labor Organization,2017)
• Female or Male employees as a % of Female or Male Labor Force respectively
(International Labor Organization, 2017)
• Gross female or male enrollment at the tertiary level as a percentage of tertiary age group female or male population respectively (UNESCO, 2012-2016 projected to 2017)
• Gross female or male enrollment at the secondary level as a percentage of secondary age group female or male population respectively (UNESCO, 2012-2016 projected to 2017)
Parliament Representation (Male and Female)
Labor Force Participation (Male and Female) Employees as % of Labor Force (Male and Female)
Tertiary Education Gross Enrollment Rate(Male and Female) Secondary Education Gross Enrollment Rate (Male and Female)
1.1 Description of Indicator and Sources
miwe 2018 14

2.0
miwe 2018 15 miwe 2018 15
Overview ofKey Findings
2.0
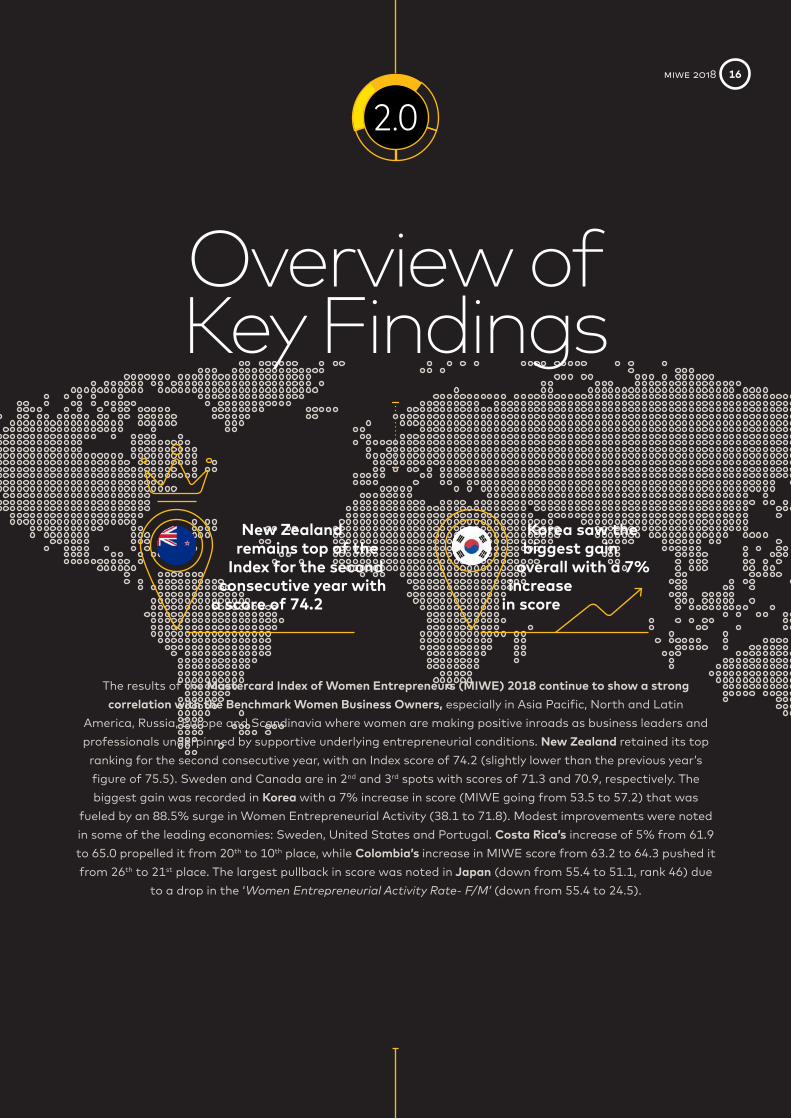
The results of the Mastercard Index of Women Entrepreneurs (MIWE) 2018 continue to show a strong correlation with the Benchmark Women Business Owners, especially in Asia Pacific, North and Latin
America, Russia, Europe and Scandinavia where women are making positive inroads as business leaders and professionals underpinned by supportive underlying entrepreneurial conditions. New Zealand retained its top
ranking for the second consecutive year, with an Index score of 74.2 (slightly lower than the previous year’s figure of 75.5). Sweden and Canada are in 2nd and 3rd spots with scores of 71.3 and 70.9, respectively. The biggest gain was recorded in Korea with a 7% increase in score (MIWE going from 53.5 to 57.2) that was
fueled by an 88.5% surge in Women Entrepreneurial Activity (38.1 to 71.8). Modest improvements were noted in some of the leading economies: Sweden, United States and Portugal. Costa Rica’s increase of 5% from 61.9 to 65.0 propelled it from 20th to 10th place, while Colombia’s increase in MIWE score from 63.2 to 64.3 pushed it from 26th to 21st place. The largest pullback in score was noted in Japan (down from 55.4 to 51.1, rank 46) due
to a drop in the ‘Women Entrepreneurial Activity Rate- F/M’ (down from 55.4 to 24.5).
New Zealand remains top of the
Index for the second consecutive year with
a score of 74.2
Korea saw the biggest gain
overall with a 7% increase
in score
miwe 2018 16
2.0 Overview of Key Findings
Out of the 3 components measured in the Index, Component A had the most changes in scores from last year’s report. This is especially evident in the sub-indicator of ‘Women Entrepreneurial Activity Rate (F/M)’ which measures the bias against women compared to men in early stage entrepreneurial activity. In Korea, the ratio of women engaging in early stage entrepreneurial activity compared to men more than doubled (up 88%), followed by Italy (up 41%) and Sweden & Costa Rica (both up 37%). Increases are also observed in Poland (up 26%), Colombia & South Africa (up 17%), Mexico (up 20% from 83 to 100, at par with men), and Egypt (up 21%). In contrast, a widening in gender divide between men and women’s entrepreneurial activity rate was observed in Japan (down 56%), Singapore (down 22%), Canada (down 17%), and Thailand (down 20%). Women in Singapore, despite being ranked 5th overall in the Index and topping the charts in 2 components (Knowledge Assets & Financial Access and Supporting Entrepreneurial Conditions), continue to be weighed down by their protracted challenges in achieving work-life balance.
Of the 3 components, gender bias against women is most apparent and pronounced in Component A: Women’s Advancement Outcomes. This is especially the case with regard to opportunities for women to be business leaders, professionals and technical workers.
The findings also revealed that women’s progress as entrepreneurs are not always aligned to the wealth and advancement of their respective economies. In fact, some of the highest rates of Women Business Ownership are observed in the less wealthy, factor-driven markets where women are driven to businesses out of necessity/need to survive (e.g. Ghana, Uganda, Bangladesh and Vietnam). In these markets, the determination of women to make a living for themselves and their families is profound, given the highly unfavorable underlying entrepreneurial, social, economic and financial conditions. On the other hand, there are other economies where the existing entrepreneurial conditions are highly conducive and enabling towards women’s ability to thrive as business owners/entrepreneurs (e.g. high support for SMEs and ease of doing business). These are usually evident in the more advanced and wealthier economies where education, financial, business, legal and regulatory frameworks and services are more developed and widespread. Here, women tend to have access to bigger pools of resources and support to pursue their business interests/desires. These markets are at the top of the Mastercard Index of Women Entrepreneurs (MIWE), and include New Zealand, Sweden, Canada, United States, Singapore, Portugal, Australia and Belgium.
The findings also point to anomalies such as the United Arab Emirates, Saudi Arabia and Tunisia which exhibit unique traits. Here, although the proportion of established business owned by women is the lowest in the world, those that made it to the business world are among the most innovative and driven in terms of growing and bringing their businesses to international grounds.
The key constraints to women’s progress as business owners remained broadly the same, with at least one being reported in all the 57 markets covered. Most of the barriers are a result of gender bias, and include poor social/cultural acceptance and lack of business resources such as finances, capital, training and development usually leading to business discontinuity. Other non-discriminatory forms of barriers stem from inefficiencies at the governance and regulatory levels such as poor support for SMEs and difficulties in doing businesses.
miwe 2018 17
Singapore
Hong Kong
0-10
ApproachingGender Parity
IncreasingGender Bias
10-15 15-20 20-25 25-30 30-35 35-40 40-50
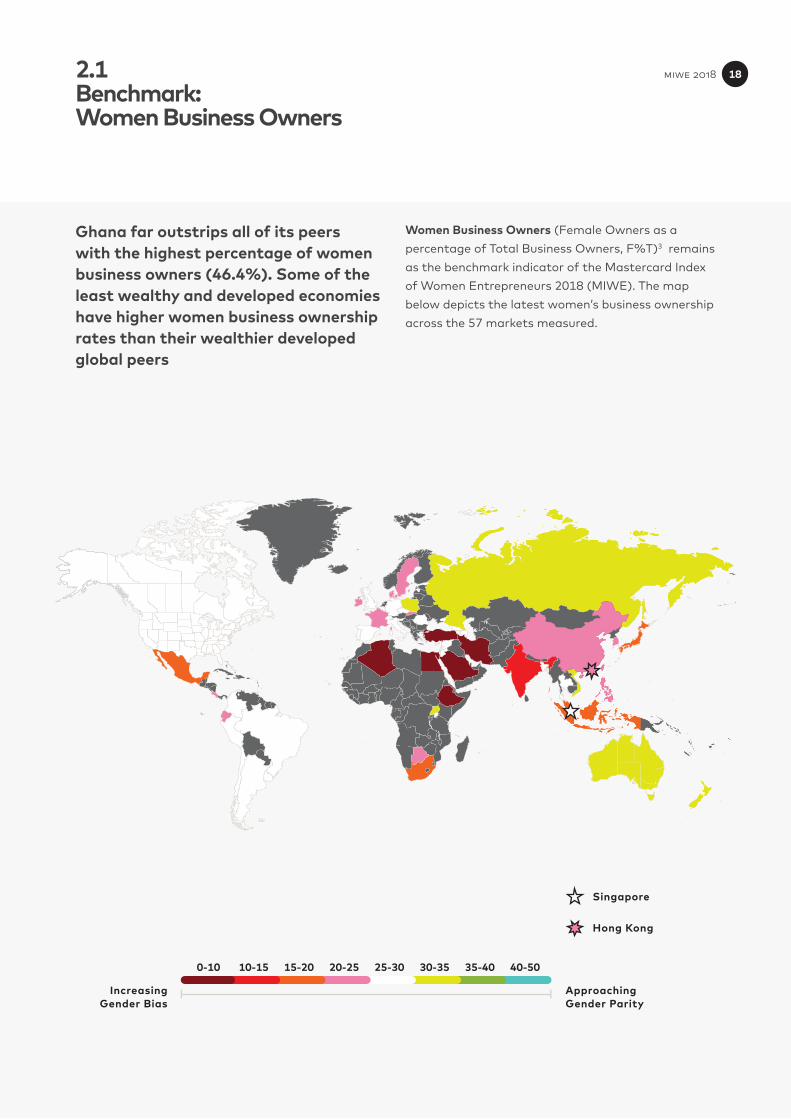
Ghana far outstrips all of its peers with the highest percentage of women business owners (46.4%). Some of the least wealthy and developed economies have higher women business ownership rates than their wealthier developed global peers
Women Business Owners (Female Owners as a percentage of Total Business Owners, F%T)3 remains as the benchmark indicator of the Mastercard Index of Women Entrepreneurs 2018 (MIWE). The map below depicts the latest women’s business ownership across the 57 markets measured.
2.1 Benchmark: Women Business Owners
miwe 2018 18
46.4
34.6
33.8
33.0
32.1
31.3
30.3
29.4
28.9
28.7
28.3
28.1
27.7
27.5
27.2
27.0
26.0
25.9
25.7
25.7
25.5
25.5
25.5
25.3
25.2
25.1
25.0
24.6
24.5
24.1
23.9
23.6
23.1
23.0
22.0
21.9
21.8
21.6
20.6
20.1
19.3
18.8
17.8
17.5
16.8
16.7
15.8
11.0
9.9
9.5
8.5
8.0
7.9
6.1
3.3
2.8
1.4
Ghana
Russia
Uganda
New Zealand
Austral ia
Vietnam
Poland
Spain
Romania
Portugal
Peru
Hungar y
Argentina
Singapore
Brazi l
Canada
Uruguay
Bangladesh
Ita ly
Colombia
Switzer land
Belg ium
United States
Germany
Thai land
Chi le
United Kingdom
France
Botswana
Korea
Phi l ippines
Czech Republ ic
China
Denmark
Hong Kong SAR
Ecuador
Sweden
Costa Rica
Taiwan
Ire land
Mexico
South Afr ica
Niger ia
Israel
Japan
Malaysia
Indonesia
India
Tunis ia
Ethiopia
Turkey
Malawi
Alger ia
Is lamic Republ ic of I ran
Egypt
United Arab Emirates
Saudi Arabia
High Income
Upper Middle Income
Lower Middle Income
Low Income
0 10 20 30 40 50
2.1 Benchmark: Women Business Owners
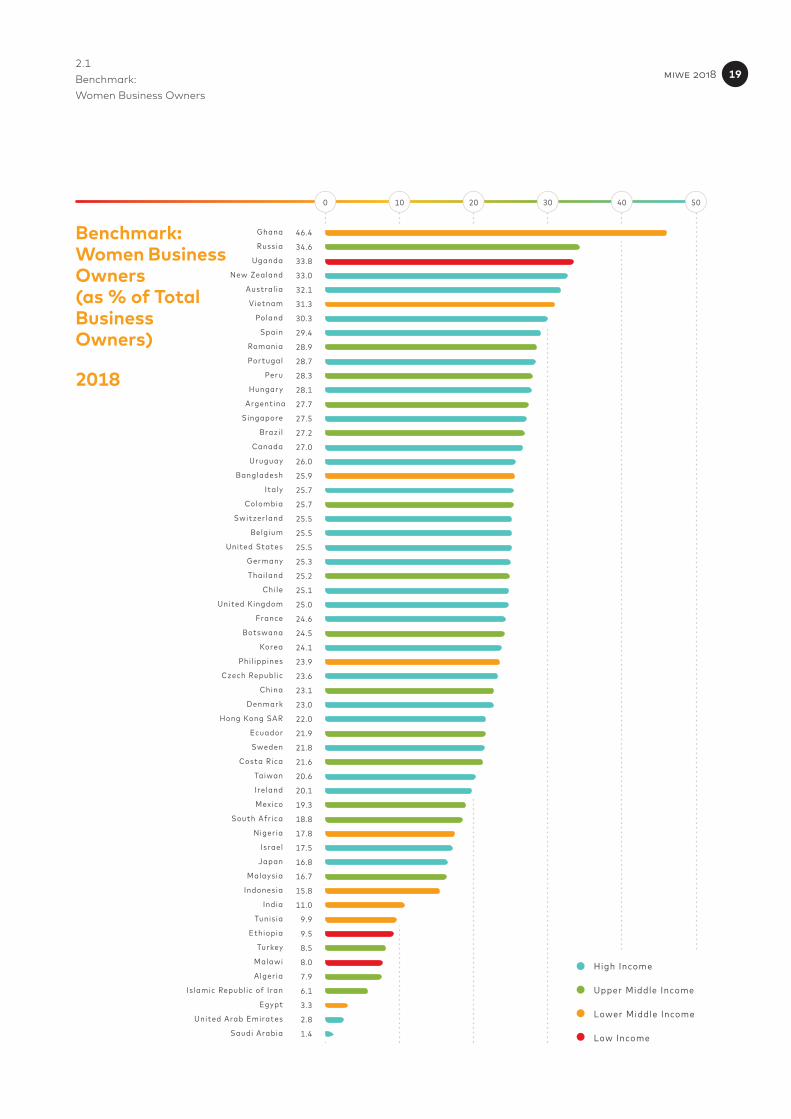
Benchmark: Women Business Owners (as % of Total Business Owners)
2018
miwe 2018 19
2.1 Benchmark: Women Business Owners
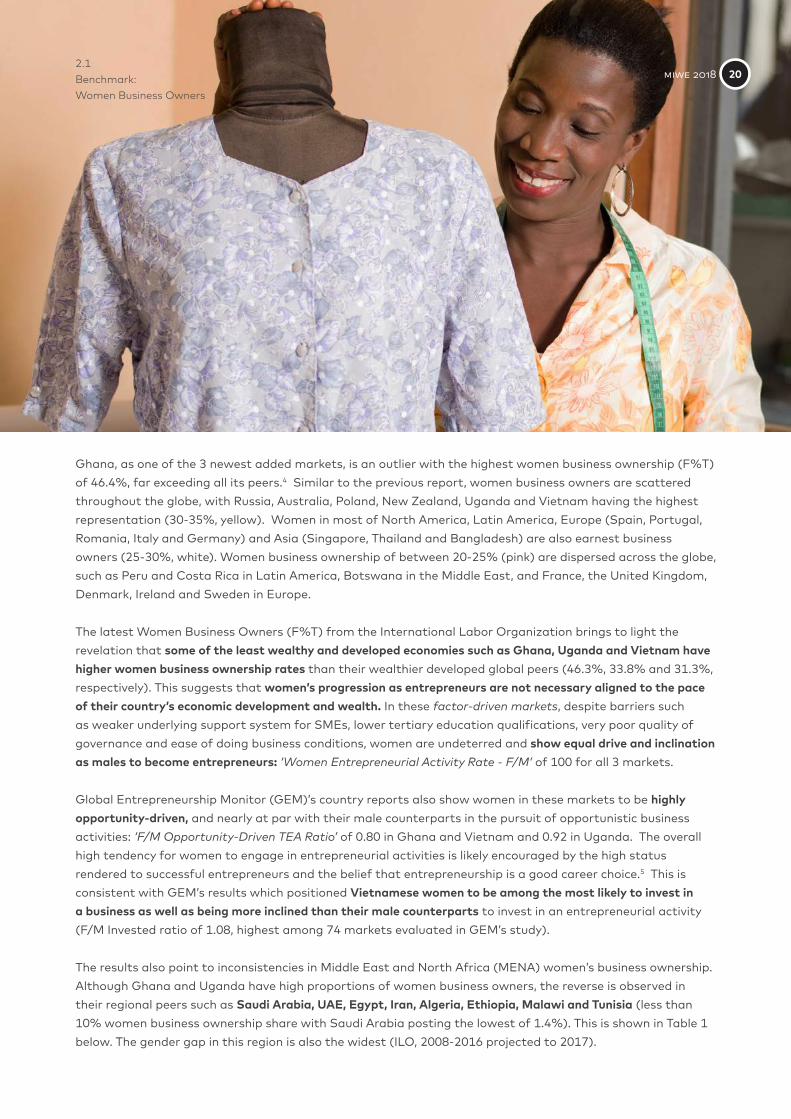
Ghana, as one of the 3 newest added markets, is an outlier with the highest women business ownership (F%T) of 46.4%, far exceeding all its peers.4 Similar to the previous report, women business owners are scattered throughout the globe, with Russia, Australia, Poland, New Zealand, Uganda and Vietnam having the highest representation (30-35%, yellow). Women in most of North America, Latin America, Europe (Spain, Portugal, Romania, Italy and Germany) and Asia (Singapore, Thailand and Bangladesh) are also earnest business owners (25-30%, white). Women business ownership of between 20-25% (pink) are dispersed across the globe, such as Peru and Costa Rica in Latin America, Botswana in the Middle East, and France, the United Kingdom, Denmark, Ireland and Sweden in Europe.
The latest Women Business Owners (F%T) from the International Labor Organization brings to light the revelation that some of the least wealthy and developed economies such as Ghana, Uganda and Vietnam have higher women business ownership rates than their wealthier developed global peers (46.3%, 33.8% and 31.3%, respectively). This suggests that women’s progression as entrepreneurs are not necessary aligned to the pace of their country’s economic development and wealth. In these factor-driven markets, despite barriers such as weaker underlying support system for SMEs, lower tertiary education qualifications, very poor quality of governance and ease of doing business conditions, women are undeterred and show equal drive and inclination as males to become entrepreneurs: ‘Women Entrepreneurial Activity Rate - F/M’ of 100 for all 3 markets.
Global Entrepreneurship Monitor (GEM)’s country reports also show women in these markets to be highly opportunity-driven, and nearly at par with their male counterparts in the pursuit of opportunistic business activities: ‘F/M Opportunity-Driven TEA Ratio’ of 0.80 in Ghana and Vietnam and 0.92 in Uganda. The overall high tendency for women to engage in entrepreneurial activities is likely encouraged by the high status rendered to successful entrepreneurs and the belief that entrepreneurship is a good career choice.5 This is consistent with GEM’s results which positioned Vietnamese women to be among the most likely to invest in a business as well as being more inclined than their male counterparts to invest in an entrepreneurial activity (F/M Invested ratio of 1.08, highest among 74 markets evaluated in GEM’s study).
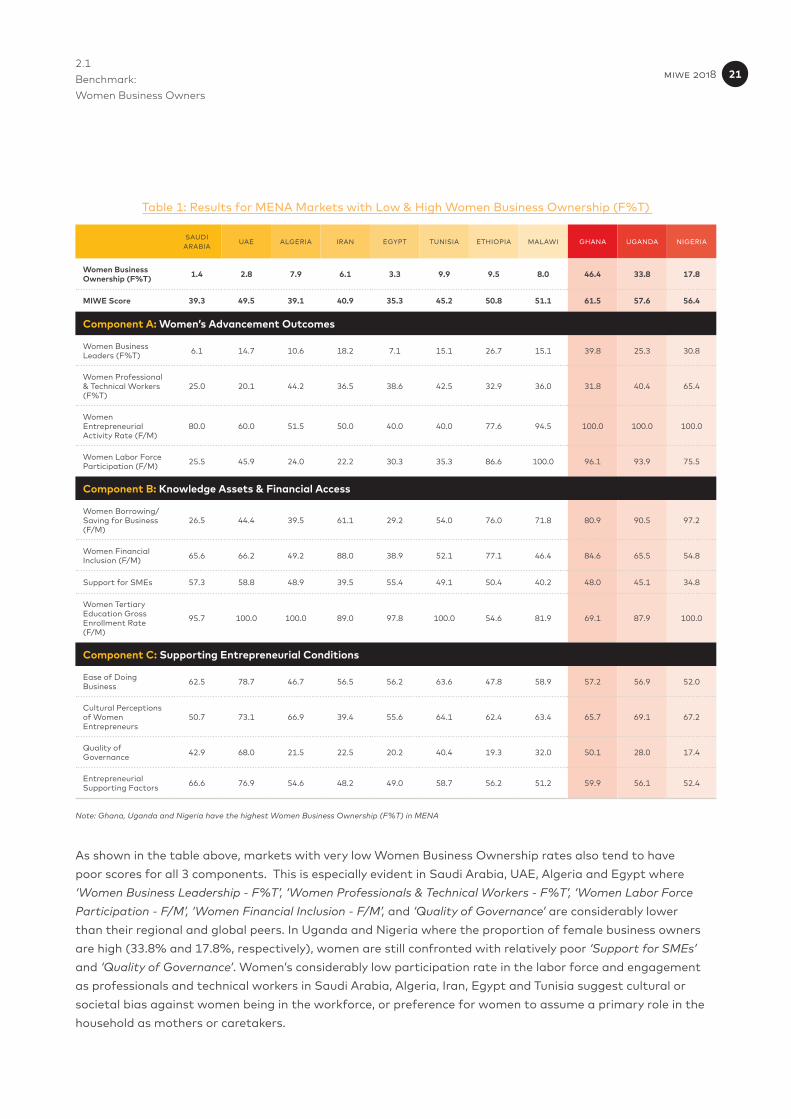
The results also point to inconsistencies in Middle East and North Africa (MENA) women’s business ownership. Although Ghana and Uganda have high proportions of women business owners, the reverse is observed in their regional peers such as Saudi Arabia, UAE, Egypt, Iran, Algeria, Ethiopia, Malawi and Tunisia (less than 10% women business ownership share with Saudi Arabia posting the lowest of 1.4%). This is shown in Table 1 below. The gender gap in this region is also the widest (ILO, 2008-2016 projected to 2017).
miwe 2018 20
2.1 Benchmark: Women Business Owners
As shown in the table above, markets with very low Women Business Ownership rates also tend to have poor scores for all 3 components. This is especially evident in Saudi Arabia, UAE, Algeria and Egypt where ‘Women Business Leadership - F%T’, ‘Women Professionals & Technical Workers - F%T’, ‘Women Labor Force Participation - F/M’, ‘Women Financial Inclusion - F/M’, and ‘Quality of Governance’ are considerably lower than their regional and global peers. In Uganda and Nigeria where the proportion of female business owners are high (33.8% and 17.8%, respectively), women are still confronted with relatively poor ‘Support for SMEs’ and ‘Quality of Governance’. Women’s considerably low participation rate in the labor force and engagement as professionals and technical workers in Saudi Arabia, Algeria, Iran, Egypt and Tunisia suggest cultural or societal bias against women being in the workforce, or preference for women to assume a primary role in the household as mothers or caretakers.
Table 1: Results for MENA Markets with Low & High Women Business Ownership (F%T)
Note: Ghana, Uganda and Nigeria have the highest Women Business Ownership (F%T) in MENA
SAUDI ARABIA
UAE ALGERIA IRAN EGYPT TUNISIA ETHIOPIA MALAWI GHANA UGANDA NIGERIA
Women Business Ownership (F%T) 1.4 2.8 7.9 6.1 3.3 9.9 9.5 8.0 46.4 33.8 17.8
MIWE Score 39.3 49.5 39.1 40.9 35.3 45.2 50.8 51.1 61.5 57.6 56.4
Component A: Women’s Advancement Outcomes
Women Business Leaders (F%T) 6.1 14.7 10.6 18.2 7.1 15.1 26.7 15.1 39.8 25.3 30.8
Women Professional & Technical Workers (F%T)
25.0 20.1 44.2 36.5 38.6 42.5 32.9 36.0 31.8 40.4 65.4
Women Entrepreneurial Activity Rate (F/M)
80.0 60.0 51.5 50.0 40.0 40.0 77.6 94.5 100.0 100.0 100.0
Women Labor Force Participation (F/M) 25.5 45.9 24.0 22.2 30.3 35.3 86.6 100.0 96.1 93.9 75.5
Component B: Knowledge Assets & Financial Access
Women Borrowing/Saving for Business (F/M)
26.5 44.4 39.5 61.1 29.2 54.0 76.0 71.8 80.9 90.5 97.2
Women Financial Inclusion (F/M) 65.6 66.2 49.2 88.0 38.9 52.1 77.1 46.4 84.6 65.5 54.8
Support for SMEs 57.3 58.8 48.9 39.5 55.4 49.1 50.4 40.2 48.0 45.1 34.8
Women Tertiary Education Gross Enrollment Rate (F/M)
95.7 100.0 100.0 89.0 97.8 100.0 54.6 81.9 69.1 87.9 100.0
Component C: Supporting Entrepreneurial Conditions
Ease of Doing Business 62.5 78.7 46.7 56.5 56.2 63.6 47.8 58.9 57.2 56.9 52.0
Cultural Perceptions of Women Entrepreneurs
50.7 73.1 66.9 39.4 55.6 64.1 62.4 63.4 65.7 69.1 67.2
Quality of Governance 42.9 68.0 21.5 22.5 20.2 40.4 19.3 32.0 50.1 28.0 17.4
Entrepreneurial Supporting Factors 66.6 76.9 54.6 48.2 49.0 58.7 56.2 51.2 59.9 56.1 52.4
miwe 2018 21
2.1 Benchmark: Women Business Owners
Changes in Score & Ranking
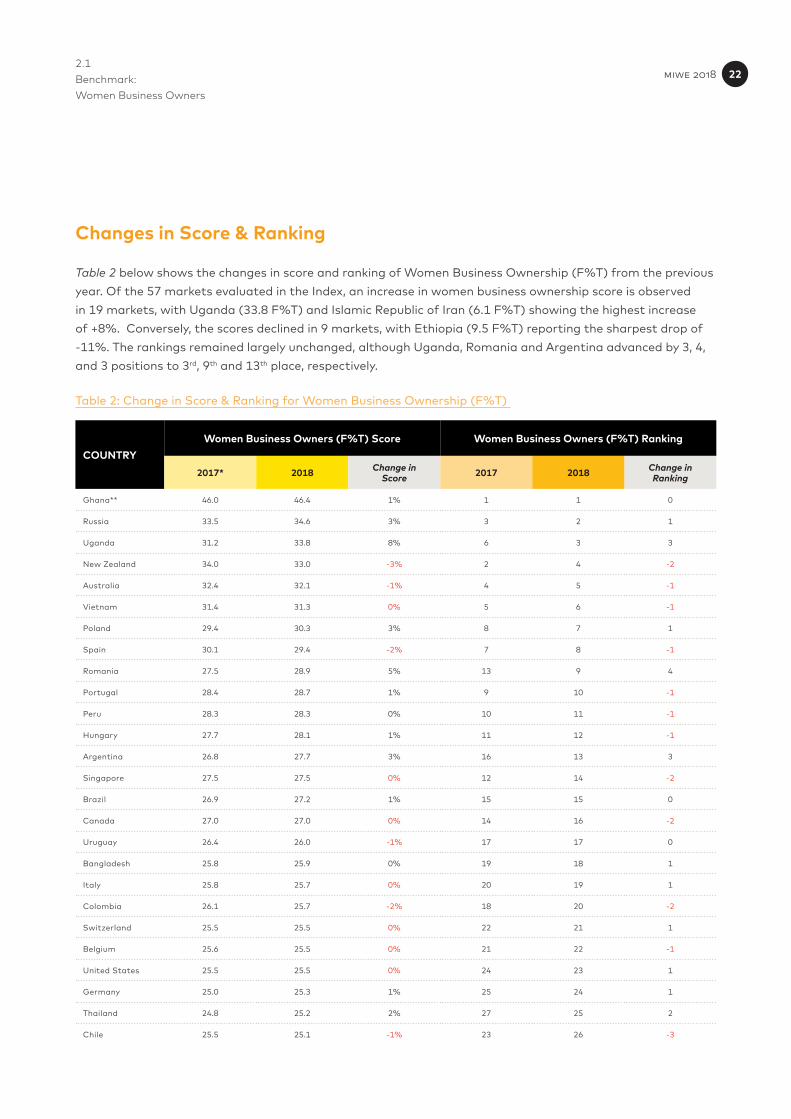
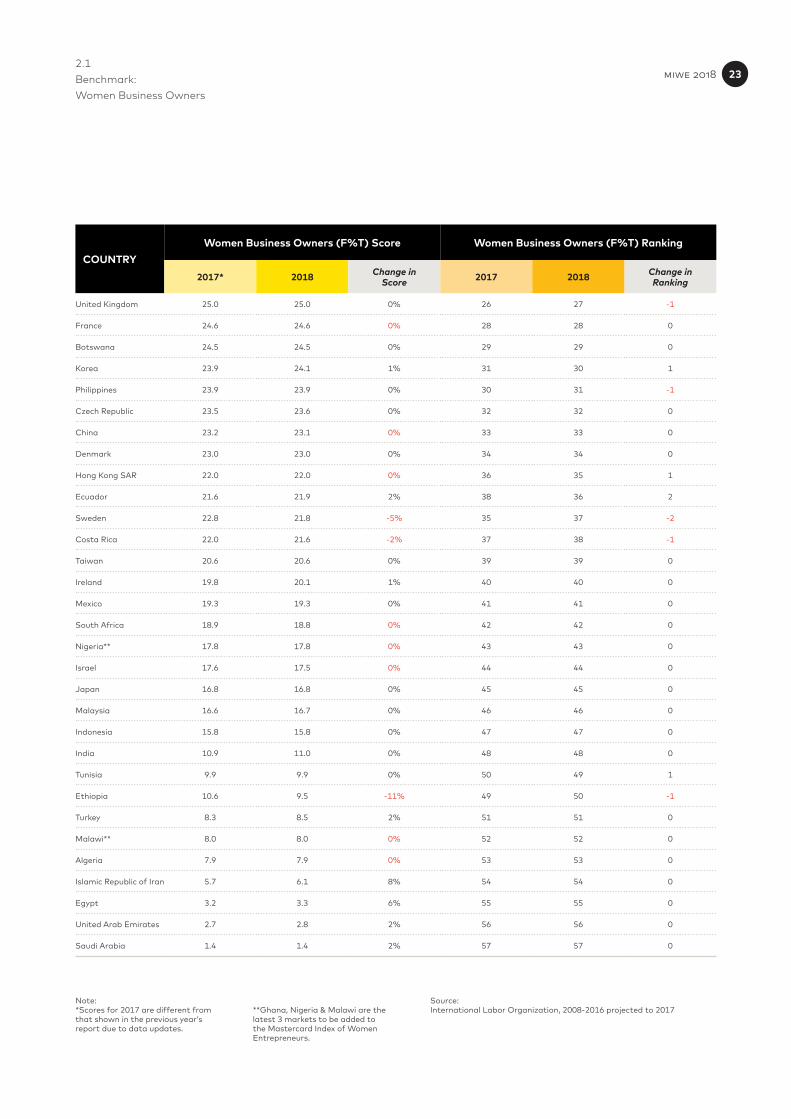
Table 2 below shows the changes in score and ranking of Women Business Ownership (F%T) from the previous year. Of the 57 markets evaluated in the Index, an increase in women business ownership score is observed in 19 markets, with Uganda (33.8 F%T) and Islamic Republic of Iran (6.1 F%T) showing the highest increase of +8%. Conversely, the scores declined in 9 markets, with Ethiopia (9.5 F%T) reporting the sharpest drop of -11%. The rankings remained largely unchanged, although Uganda, Romania and Argentina advanced by 3, 4, and 3 positions to 3rd, 9th and 13th place, respectively.
Table 2: Change in Score & Ranking for Women Business Ownership (F%T)
Ghana** 46.0 46.4 1% 1 1 0
Russia 33.5 34.6 3% 3 2 1
Uganda 31.2 33.8 8% 6 3 3
New Zealand 34.0 33.0 -3% 2 4 -2
Australia 32.4 32.1 -1% 4 5 -1
Vietnam 31.4 31.3 0% 5 6 -1
Poland 29.4 30.3 3% 8 7 1
Spain 30.1 29.4 -2% 7 8 -1
Romania 27.5 28.9 5% 13 9 4
Portugal 28.4 28.7 1% 9 10 -1
Peru 28.3 28.3 0% 10 11 -1
Hungary 27.7 28.1 1% 11 12 -1
Argentina 26.8 27.7 3% 16 13 3
Singapore 27.5 27.5 0% 12 14 -2
Brazil 26.9 27.2 1% 15 15 0
Canada 27.0 27.0 0% 14 16 -2
Uruguay 26.4 26.0 -1% 17 17 0
Bangladesh 25.8 25.9 0% 19 18 1
Italy 25.8 25.7 0% 20 19 1
Colombia 26.1 25.7 -2% 18 20 -2
Switzerland 25.5 25.5 0% 22 21 1
Belgium 25.6 25.5 0% 21 22 -1
United States 25.5 25.5 0% 24 23 1
Germany 25.0 25.3 1% 25 24 1
Thailand 24.8 25.2 2% 27 25 2
Chile 25.5 25.1 -1% 23 26 -3
COUNTRYWomen Business Owners (F%T) Score Women Business Owners (F%T) Ranking
2017* 2018 Change inScore 2017 2018 Change in
Ranking
miwe 2018 22
2.1 Benchmark: Women Business Owners
United Kingdom 25.0 25.0 0% 26 27 -1
France 24.6 24.6 0% 28 28 0
Botswana 24.5 24.5 0% 29 29 0
Korea 23.9 24.1 1% 31 30 1
Philippines 23.9 23.9 0% 30 31 -1
Czech Republic 23.5 23.6 0% 32 32 0
China 23.2 23.1 0% 33 33 0
Denmark 23.0 23.0 0% 34 34 0
Hong Kong SAR 22.0 22.0 0% 36 35 1
Ecuador 21.6 21.9 2% 38 36 2
Sweden 22.8 21.8 -5% 35 37 -2
Costa Rica 22.0 21.6 -2% 37 38 -1
Taiwan 20.6 20.6 0% 39 39 0
Ireland 19.8 20.1 1% 40 40 0
Mexico 19.3 19.3 0% 41 41 0
South Africa 18.9 18.8 0% 42 42 0
Nigeria** 17.8 17.8 0% 43 43 0
Israel 17.6 17.5 0% 44 44 0
Japan 16.8 16.8 0% 45 45 0
Malaysia 16.6 16.7 0% 46 46 0
Indonesia 15.8 15.8 0% 47 47 0
India 10.9 11.0 0% 48 48 0
Tunisia 9.9 9.9 0% 50 49 1
Ethiopia 10.6 9.5 -11% 49 50 -1
Turkey 8.3 8.5 2% 51 51 0
Malawi** 8.0 8.0 0% 52 52 0
Algeria 7.9 7.9 0% 53 53 0
Islamic Republic of Iran 5.7 6.1 8% 54 54 0
Egypt 3.2 3.3 6% 55 55 0
United Arab Emirates 2.7 2.8 2% 56 56 0
Saudi Arabia 1.4 1.4 2% 57 57 0
Note:*Scores for 2017 are different from that shown in the previous year’s report due to data updates.
**Ghana, Nigeria & Malawi are the latest 3 markets to be added to the Mastercard Index of Women Entrepreneurs.
Source:International Labor Organization, 2008-2016 projected to 2017
COUNTRYWomen Business Owners (F%T) Score Women Business Owners (F%T) Ranking
2017* 2018 Change inScore 2017 2018 Change in
Ranking
miwe 2018 23
Singapore
Hong Kong
0-20
Higher ScoreLower Score
20-30 30-40 40-50 50-60 60-70 70-80 80-100
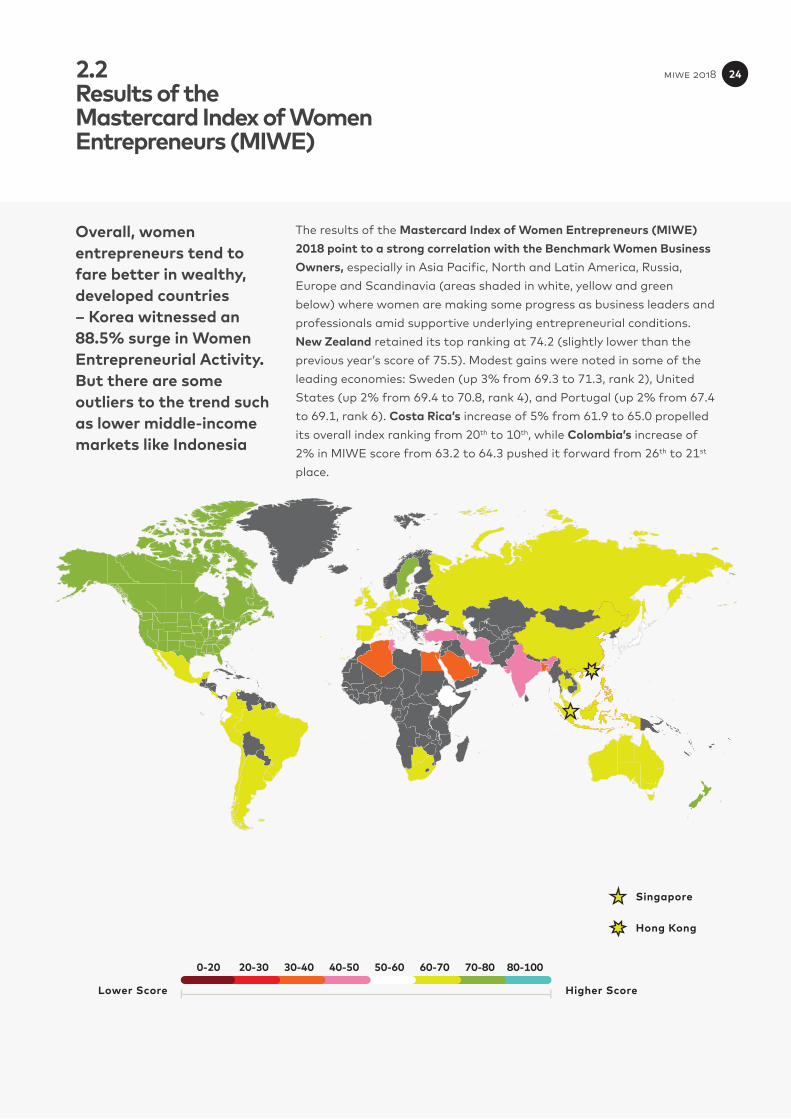
Overall, women entrepreneurs tend to fare better in wealthy, developed countries – Korea witnessed an 88.5% surge in Women Entrepreneurial Activity. But there are some outliers to the trend such as lower middle-income markets like Indonesia
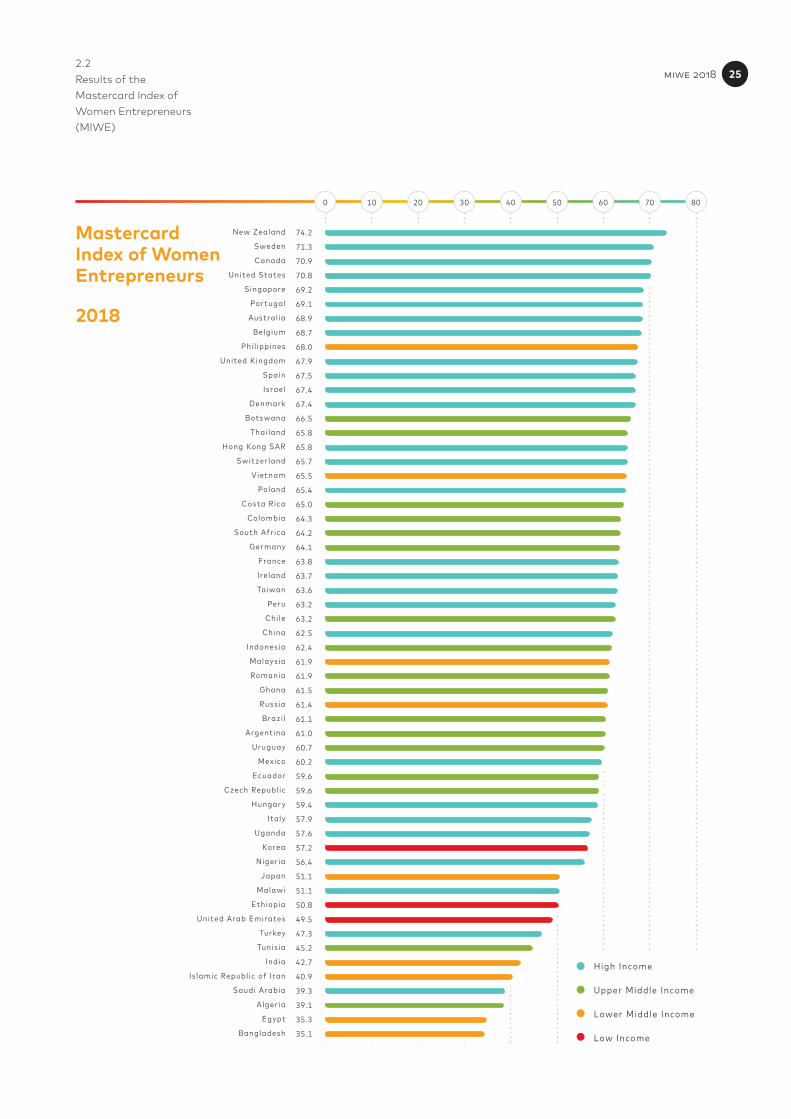
The results of the Mastercard Index of Women Entrepreneurs (MIWE) 2018 point to a strong correlation with the Benchmark Women Business Owners, especially in Asia Pacific, North and Latin America, Russia, Europe and Scandinavia (areas shaded in white, yellow and green below) where women are making some progress as business leaders and professionals amid supportive underlying entrepreneurial conditions. New Zealand retained its top ranking at 74.2 (slightly lower than the previous year’s score of 75.5). Modest gains were noted in some of the leading economies: Sweden (up 3% from 69.3 to 71.3, rank 2), United States (up 2% from 69.4 to 70.8, rank 4), and Portugal (up 2% from 67.4 to 69.1, rank 6). Costa Rica’s increase of 5% from 61.9 to 65.0 propelled its overall index ranking from 20th to 10th, while Colombia’s increase of 2% in MIWE score from 63.2 to 64.3 pushed it forward from 26th to 21st place.
2.2 Results of the Mastercard Index of Women Entrepreneurs (MIWE)
miwe 2018 24
74.2
71.3
70.9
70.8
69.2
69.1
68.9
68.7
68.0
67.9
67.5
67.4
67.4
66.5
65.8
65.8
65.7
65.5
65.4
65.0
64.3
64.2
64.1
63.8
63.7
63.6
63.2
63.2
62.5
62.4
61.9
61.9
61.5
61.4
61.1
61.0
60.7
60.2
59.6
59.6
59.4
57.9
57.6
57.2
56.4
51.1
51.1
50.8
49.5
47.3
45.2
42.7
40.9
39.3
39.1
35.3
35.1
New Zealand
Sweden
Canada
United States
Singapore
Portugal
Austral ia
Belgium
Phi l ippines
United Kingdom
Spain
Israel
Denmark
Botswana
Thai land
Hong Kong SAR
Switzer land
Vietnam
Poland
Costa Rica
Colombia
South Afr ica
Germany
France
Ire land
Taiwan
Peru
Chi le
China
Indonesia
Malaysia
Romania
Ghana
Russia
Brazi l
Argentina
Uruguay
Mexico
Ecuador
Czech Republ ic
Hungar y
Italy
Uganda
Korea
Niger ia
Japan
Malawi
Ethiopia
United Arab Emirates
Turkey
Tunis ia
India
Is lamic Republ ic of I ran
Saudi Arabia
Alger ia
Egypt
Bangladesh
0 10 20 30 40 50 60 70 80
High Income
Upper Middle Income
Lower Middle Income
Low Income
2.2 Results of the Mastercard Index of Women Entrepreneurs (MIWE)
Mastercard Index of Women Entrepreneurs
2018
miwe 2018 25
2.2 Results of the Mastercard Index of Women Entrepreneurs (MIWE)
By Income
The Index results suggest that women entrepreneurs appear to thrive better in wealthy and more developed economies such as New Zealand, Sweden, Canada, the United States and Singapore, where the component scores for women’s advancement, women’s knowledge assets and financial access, and supporting entrepreneurial conditions are higher. This is evident from the overall MIWE scores and ranking: two-thirds of the top 30 countries are high-income, 7 are upper-middle income, and 3 are lower-middle income. Similarly, markets that are less wealthy and developed tend to render comparatively less enabling conditions for women’s advancement as entrepreneurs. This is reflected in the scores and ranking among the low-income cohort: Uganda, Malawi and Ethiopia being low-income markets are ranked among the lowest with low MIWE scores, and lower-middle income markets such as Egypt, Bangladesh, India and Tunisia are ranked the lowest with very poor MIWE scores.
There are some exceptions to the trend, with lower-middle income markets Philippines and Vietnam surprising with higher-than-expected MIWE scores of 68.0 and 65.5, and rankings of 9 and 18, respectively. Indonesia and Ghana also outperformed their respective lower-middle income peers as well as the upper-middle income cohorts with higher scores of 62.4 and 61.5, and rankings of 30 and 33, respectively. In the case of Ghana, this is mostly bolstered by a very strong engagement of women as business owners (46.4% Women Business Owners - F%T), as well as high standing in terms of Women’s Advancement Outcomes (Component A: 59.1, rank 12). Here, women are at par with their male counterparts in ‘Women Entrepreneurial Activity Rate - F/M’ (100.0), and are nearly as likely as men to participate in the labor force (‘Women Labor Force Participation Rate - F/M’ of 96.1). Ghanaian women are also highly represented in the business world with nearly 4 out of every 10 business leaders being a woman (39.8% - ‘Women Business Leaders F%T’).
Regrettably, women entrepreneurship in the wealthy economies of Saudi Arabia, United Arab Emirates, Japan and Korea continue to underperform due to poor Women Advancement Outcomes (Component A) such as women’s representation as business leaders, professionals & technical workers, and labor force participation.
miwe 2018 26 miwe 2018 26
2.2 Results of the Mastercard Index of Women Entrepreneurs (MIWE)
MENA: Few Women Business Owners but High Growth Expectations, Opportunity-Driven, Innovative
Although Middle East countries have some of the lowest Established Business Owners among women (less than 10%) and the widest gender gap in this indicator (F/M only around 0.3), women who do own a business are among the most ambitious and capable in terms of growing their businesses once started. They are also among the most likely to internationalize their businesses: around 29% women in MENA are considered international, surpassing their male counterparts. In Saudi Arabia and the UAE, more than 50% and 75% of businesses owned by women, respectively, are considered global (GEM Global Report, 2016-17). In fact, GEM’s findings in 2016 showed Saudi Arabian women at the top in perceiving good business opportunities (81.5%, rank 1).
The MENA region also reports the highest average growth expectations among women at 37% and highest gender parity (just under 80% of the male rate). This means that over half of women entrepreneurs in markets such as the UAE and Tunisia expect to hire 6 or more employees in the next 5 years. Women in Saudi Arabia are more likely than men to have these ambitions to grow their businesses. These strong growth expectations are significant as they have the potential to translate to employment opportunities in this region (GEM Global Report, 2016-17). Women in MENA are also highly innovation-driven, being 60% more likely than men to offer innovative products and services. This surpasses the levels reported in North America (38%).
Women in Saudi Arabia and the UAE are nearly as motivated as males when it comes to seeking out business opportunities in the area they reside: ‘Ratio F/M Opportunity Perceptions’ of 0.9 and 1.3, respectively. Interestingly, women and men display similar risk appetite: ‘Ratio F/M Undeterred by Fear of Failure’ of 0.9 and 1.1 respectively in these markets (GEM Global Report, 2016-17).
miwe 2018 27
2.2 Results of the Mastercard Index of Women Entrepreneurs (MIWE)
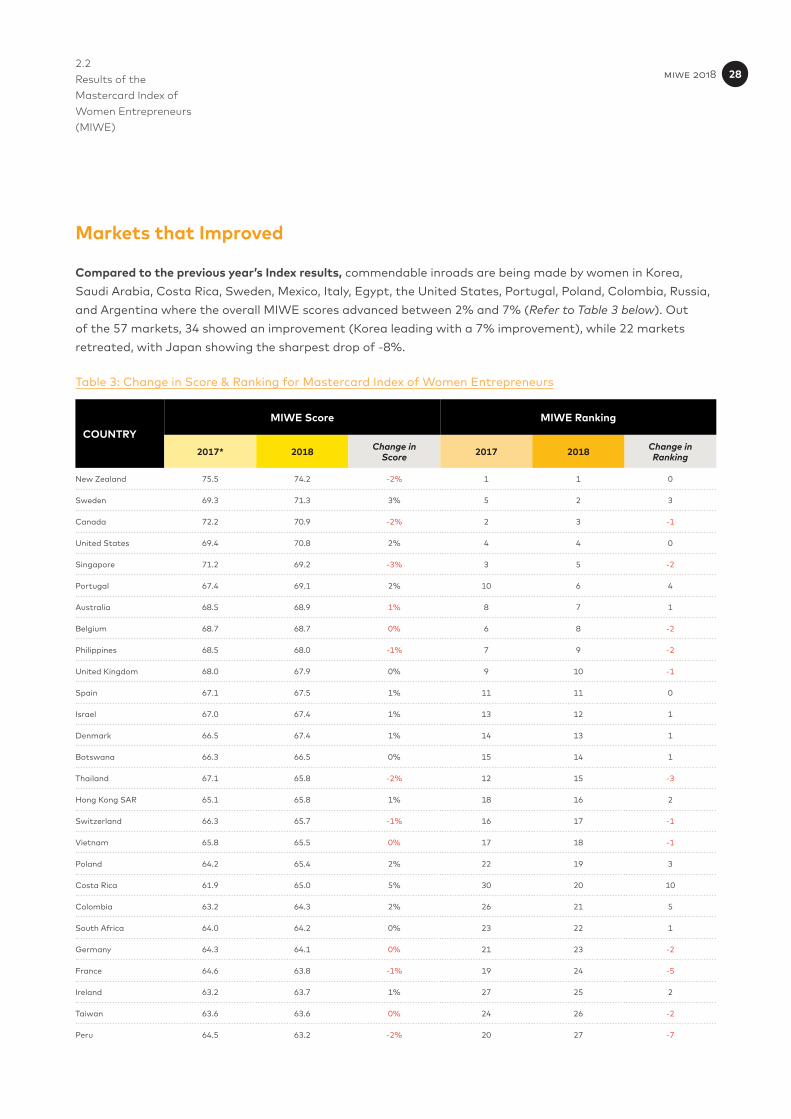
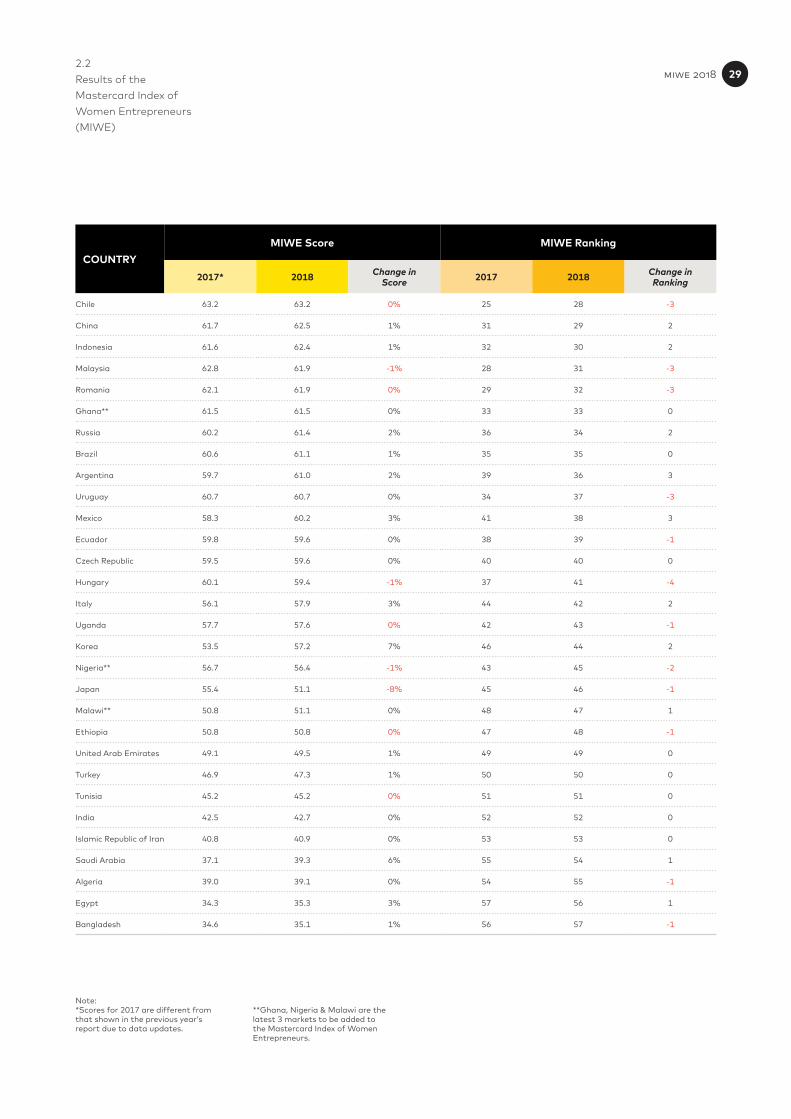
Markets that Improved
Compared to the previous year’s Index results, commendable inroads are being made by women in Korea, Saudi Arabia, Costa Rica, Sweden, Mexico, Italy, Egypt, the United States, Portugal, Poland, Colombia, Russia, and Argentina where the overall MIWE scores advanced between 2% and 7% (Refer to Table 3 below). Out of the 57 markets, 34 showed an improvement (Korea leading with a 7% improvement), while 22 markets retreated, with Japan showing the sharpest drop of -8%.
Table 3: Change in Score & Ranking for Mastercard Index of Women Entrepreneurs
New Zealand 75.5 74.2 -2% 1 1 0
Sweden 69.3 71.3 3% 5 2 3
Canada 72.2 70.9 -2% 2 3 -1
United States 69.4 70.8 2% 4 4 0
Singapore 71.2 69.2 -3% 3 5 -2
Portugal 67.4 69.1 2% 10 6 4
Australia 68.5 68.9 1% 8 7 1
Belgium 68.7 68.7 0% 6 8 -2
Philippines 68.5 68.0 -1% 7 9 -2
United Kingdom 68.0 67.9 0% 9 10 -1
Spain 67.1 67.5 1% 11 11 0
Israel 67.0 67.4 1% 13 12 1
Denmark 66.5 67.4 1% 14 13 1
Botswana 66.3 66.5 0% 15 14 1
Thailand 67.1 65.8 -2% 12 15 -3
Hong Kong SAR 65.1 65.8 1% 18 16 2
Switzerland 66.3 65.7 -1% 16 17 -1
Vietnam 65.8 65.5 0% 17 18 -1
Poland 64.2 65.4 2% 22 19 3
Costa Rica 61.9 65.0 5% 30 20 10
Colombia 63.2 64.3 2% 26 21 5
South Africa 64.0 64.2 0% 23 22 1
Germany 64.3 64.1 0% 21 23 -2
France 64.6 63.8 -1% 19 24 -5
Ireland 63.2 63.7 1% 27 25 2
Taiwan 63.6 63.6 0% 24 26 -2
Peru 64.5 63.2 -2% 20 27 -7
COUNTRYMIWE Score MIWE Ranking
2017* 2018 Change inScore 2017 2018 Change in
Ranking
miwe 2018 28
2.2 Results of the Mastercard Index of Women Entrepreneurs (MIWE)
Chile 63.2 63.2 0% 25 28 -3
China 61.7 62.5 1% 31 29 2
Indonesia 61.6 62.4 1% 32 30 2
Malaysia 62.8 61.9 -1% 28 31 -3
Romania 62.1 61.9 0% 29 32 -3
Ghana** 61.5 61.5 0% 33 33 0
Russia 60.2 61.4 2% 36 34 2
Brazil 60.6 61.1 1% 35 35 0
Argentina 59.7 61.0 2% 39 36 3
Uruguay 60.7 60.7 0% 34 37 -3
Mexico 58.3 60.2 3% 41 38 3
Ecuador 59.8 59.6 0% 38 39 -1
Czech Republic 59.5 59.6 0% 40 40 0
Hungary 60.1 59.4 -1% 37 41 -4
Italy 56.1 57.9 3% 44 42 2
Uganda 57.7 57.6 0% 42 43 -1
Korea 53.5 57.2 7% 46 44 2
Nigeria** 56.7 56.4 -1% 43 45 -2
Japan 55.4 51.1 -8% 45 46 -1
Malawi** 50.8 51.1 0% 48 47 1
Ethiopia 50.8 50.8 0% 47 48 -1
United Arab Emirates 49.1 49.5 1% 49 49 0
Turkey 46.9 47.3 1% 50 50 0
Tunisia 45.2 45.2 0% 51 51 0
India 42.5 42.7 0% 52 52 0
Islamic Republic of Iran 40.8 40.9 0% 53 53 0
Saudi Arabia 37.1 39.3 6% 55 54 1
Algeria 39.0 39.1 0% 54 55 -1
Egypt 34.3 35.3 3% 57 56 1
Bangladesh 34.6 35.1 1% 56 57 -1
Note:*Scores for 2017 are different from that shown in the previous year’s report due to data updates.
**Ghana, Nigeria & Malawi are the latest 3 markets to be added to the Mastercard Index of Women Entrepreneurs.
COUNTRYMIWE Score MIWE Ranking
2017* 2018 Change inScore 2017 2018 Change in
Ranking
miwe 2018 29
2.2 Results of the Mastercard Index of Women Entrepreneurs (MIWE)
For instance, Korea’s 7% improvement in MIWE score (53.5 to 57.2) was fueled by an 88.5% surge in Women Entrepreneurial Activity (F/M) from 38.1 to 71.8, reflected in a 17.3% rise in Component A: Women’s Advancement Outcomes. This suggests that for every 10 entrepreneurial initiatives, 7 are originated by a Korean woman, a big jump from the previous year’s figure of just 3.8. This is congruent with results from the latest Global Entrepreneurship Monitor (GEM) 2016-17 Report which shows improvements in the Korean female entrepreneurial landscape over the 2014 to 2016 period. These include significant increases in Female Opportunity Perception (up 259%), Female Capability Perception (up 118%), Female Entrepreneurial Intention (up 144%), Female-to-Male Established Business Ownership (up 80%), and Female Total Entrepreneurial Activity (TEA, 39%).6
Sweden’s improvement in MIWE score of 3% from 69.3 to 71.3 advanced it from 5th to 2nd position, driven by a 36% increase in Women Entrepreneurial Activity (F/M) from 51.3 in 2016 to 70.0. This was likely underpinned by an increase in Female Opportunity Perception (up 10% from 68.5 in 2014 to 75.3 in 2016) and an accompanying rise in the number of opportunity-driven women entrepreneurs undeterred by fear of failure (up 8% from 54.0 to 58.4).
miwe 2018 30 miwe 2018 30
2.2 Results of the Mastercard Index of Women Entrepreneurs (MIWE)
Markets that Retreated
Japan’s pullback in index score from 55.4 to 51.1 (rank 46) was pulled down by a decline in the ‘Women Entrepreneurial Activity Rate - F/M’ (down from 55.4 to 24.5). This implies that for every entrepreneurial activity, only 1 out of every 4 is initiated by a female compared to 2 out of every 4 the previous year. The decline could have been attributed to external factors, the most adverse and pertinent of which is the prevailing gendered discourse where female entrepreneurs continue to be perceived as inferior compared to men in both the social and corporate worlds. Although successful female entrepreneurs are often celebrated as “superwomen”, those that exhibit typically male qualities such as ‘strength and power’ are considered intimidating and estranged from both ‘ordinary’ women and powerful men7.
Singapore, Canada, New Zealand, Thailand and Peru also recorded some setbacks, albeit much milder of between -2% to -3%, mostly weighed down by declines in Component A: Women’s Advancement Outcomes, and specifically, the sub-component of ‘Women Entrepreneurial Activity - F/M’. For instance, Thailand’s -5.4% drop in score for Women’s Advancement Outcomes was largely dragged by a decline in the ‘Women Entrepreneurial Activity Rate - F/M‘ (100% to 80%), while Singapore and Canada were similarly weighed down by a drop in the proportion of female entrepreneurs compared to male (Singapore: 61.9% to 48.3% and Canada: 84.3% to 70.0%).
In Canada, it is noteworthy to point out that although the ‘Women Entrepreneurial Activity Rate - F/M’ declined, women maintain a relatively positive and strong mindset when it comes to Capability Perception and being Undeterred by Fear of Failure. This is evident in the narrow gender divide for the 2 indicators measured by GEM (2016), suggesting that for every 10 males, there are 7 females who believe they have the required skills and knowledge for a new business startup. When it comes to being unperturbed by business failure, both women and men are at par (F/M ratio of 0.9 in 2014 compared to 1.0 for 2016).8 Canadian women and men are also equally ambitious and enthusiastic when it comes to seeking out business opportunities: Ratio F/M Opportunity Perceptions unchanged at 1.0 in both 2014 and 2016 (GEM Global Report 2016-17).
miwe 2018 31 miwe 2018 31
Singapore
Hong Kong
0-20
Higher ScoreLower Score
20-30 30-40 40-50 50-60 60-70 70-80 80-100
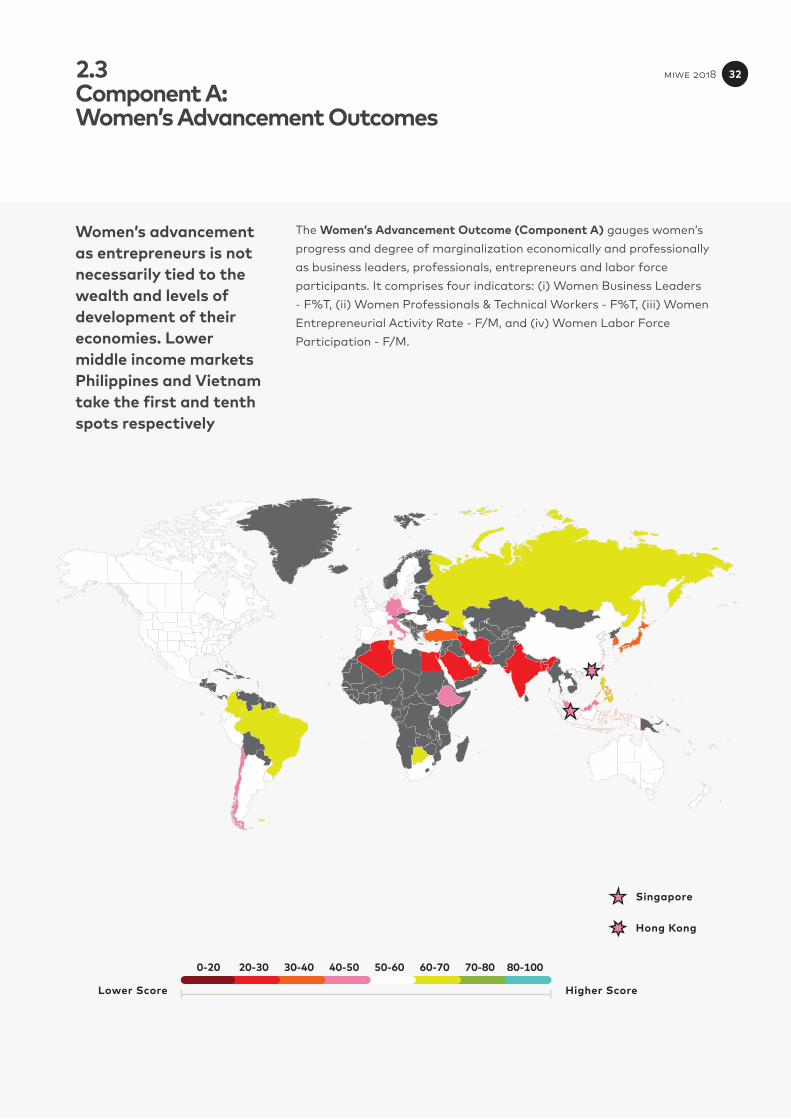
AWomen’s advancement as entrepreneurs is not necessarily tied to the wealth and levels of development of their economies. Lower middle income markets Philippines and Vietnam take the first and tenth spots respectively
The Women’s Advancement Outcome (Component A) gauges women’s progress and degree of marginalization economically and professionally as business leaders, professionals, entrepreneurs and labor force participants. It comprises four indicators: (i) Women Business Leaders - F%T, (ii) Women Professionals & Technical Workers - F%T, (iii) Women Entrepreneurial Activity Rate - F/M, and (iv) Women Labor Force Participation - F/M.
2.3 Component A: Women’s Advancement Outcomes
miwe 2018 32
65.9
64.1
63.7
62.5
62.4
61.0
59.8
59.8
59.7
59.6
59.4
59.1
58.5
58.3
58.1
57.8
57.4
57.2
56.5
56.4
55.8
55.7
55.0
54.6
54.4
54.2
54.1
52.8
52.2
51.8
51.6
51.5
51.1
50.8
50.5
50.2
49.9
49.7
49.4
49.3
48.7
47.9
47.8
47.6
47.5
43.8
40.0
31.9
30.8
30.8
30.1
29.5
29.3
27.6
24.3
24.0
23.6
Phi l ippines
Colombia
Russia
Brazi l
Niger ia
Botswana
Sweden
United States
New Zealand
Vietnam
Canada
Ghana
Austral ia
Thai land
Israel
Peru
Poland
Costa Rica
Ecuador
Spain
Portugal
Uganda
Belgium
South Afr ica
Argentina
Hungar y
China
Mexico
United Kingdom
Switzer land
Ire land
France
Romania
Indonesia
Denmark
Uruguay
Germany
Chi le
Singapore
Ethiopia
Hong Kong SAR
Taiwan
Malaysia
Malawi
Italy
Czech Republ ic
Korea
Turkey
Tunis ia
Japan
United Arab Emirates
India
Is lamic Republ ic of I ran
Alger ia
Bangladesh
Egypt
Saudi Arabia
0 10 20 30 40 50 60 70 80
High Income
Upper Middle Income
Lower Middle Income
Low Income
2.3 Component A: Women’s Advancement Outcomes
Component A: Women’s Advancement Outcomes
2018
miwe 2018 33
2.3 Component A: Women’s Advancement Outcomes
Top & Bottom Performers
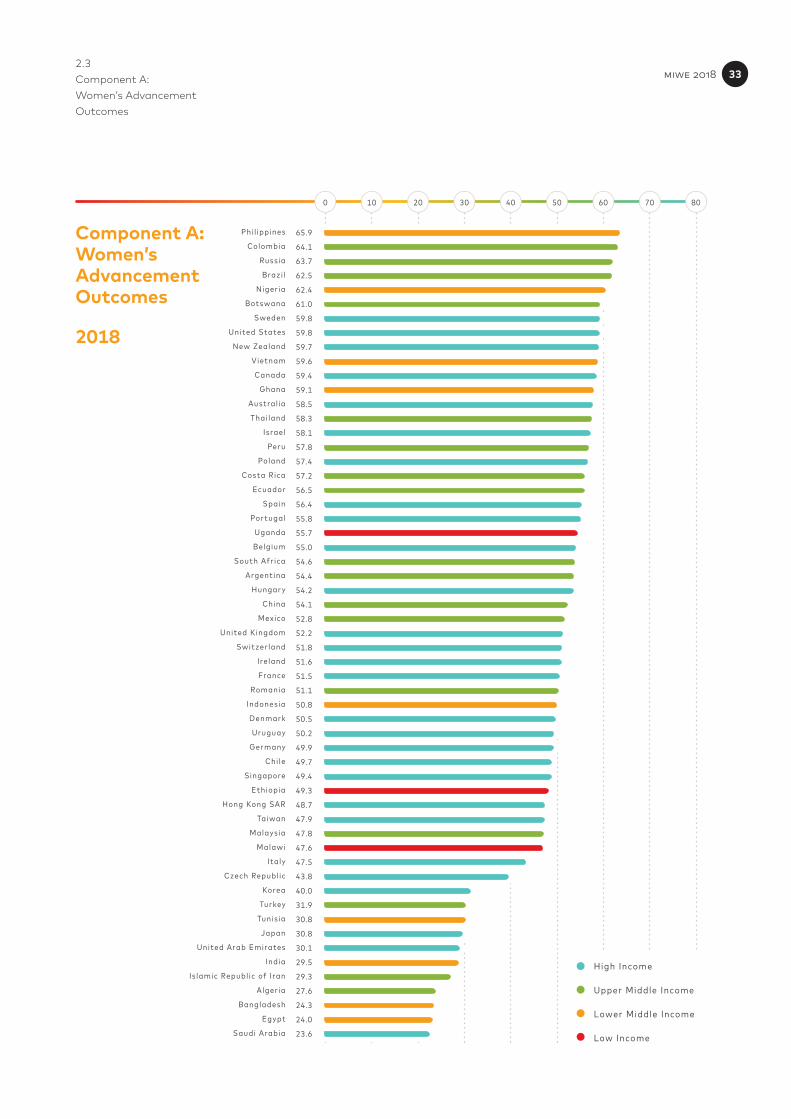
The results show no direct correlation between women’s advancement as entrepreneurs and the wealth and level of development of their economies. Of the top 10 leading markets, 7 are upper-middle and lower-middle income. Philippines retained its top spot with a component score of 65.9 (lower-middle income, unchanged from previous year), followed by upper-middle markets Colombia (64.1) and Russia (63.7) in 2nd and 3rd spot, respectively. Brazil (62.5), Nigeria (62.4), Botswana (61.0) and Vietnam (59.6) assumed 4th, 5th, 6th and 10th placings, respectively.
Out of the top 20 markets, only 8 are high income economies: Sweden, the United States, New Zealand, Canada, Australia, Israel, Poland, and Spain with scores ranging from 59.8 (Sweden) to 56.4 (Spain). It is also surprising to note that wealthy and innovation-driven economies such as Japan, the UAE and Saudi Arabia and the majority of markets in the Middle East and Africa have very low scores in Component A due to constraints as business leaders/professionals (especially Saudi Arabia, Algeria and Egypt) and being employed in the workforce (Saudi Arabia, Algeria, Iran and Egypt). The low scores for Women Entrepreneurial Activity Rate (F/M) for UAE (60.0), Algeria (51.5), Iran (50.0), Egypt (40.0) and Tunisia (40.0) points to a wide gender disparity when it comes to opportunities to start a business.
Philippines and Vietnam shine with top placing of 1st and 10th, respectively, while Indonesia trails in 34th place. Philippines’s top score of 65.9 in Women’s Advancement Outcomes stems from their strong representation as Business Leaders (48.9%, F%T) and Professionals & Technical Workers (60.0%, F%T). They are also equally inclined to engage in Entrepreneurial Activity Rate as men (F/M of 100.0). In fact, these 3 economies are among the only 5 highlighted in GEM’s Global Report 2016-17 where women’s Total Entrepreneurial Activity Rates (2015-2016) surpass those of men.9 In Vietnam and Indonesia, the number of established business owners among women is equal or higher than men.
The color map and graph above indicate that apart from the Middle Eastern and African markets, women’s advancement as entrepreneurs, business leaders, and labor force participants is adequately healthy in the majority of the regions, although there is much more room for improvement. Table 4 below summarizes the results for Component A.
miwe 2018 34
2.3 Component A: Women’s Advancement Outcomes
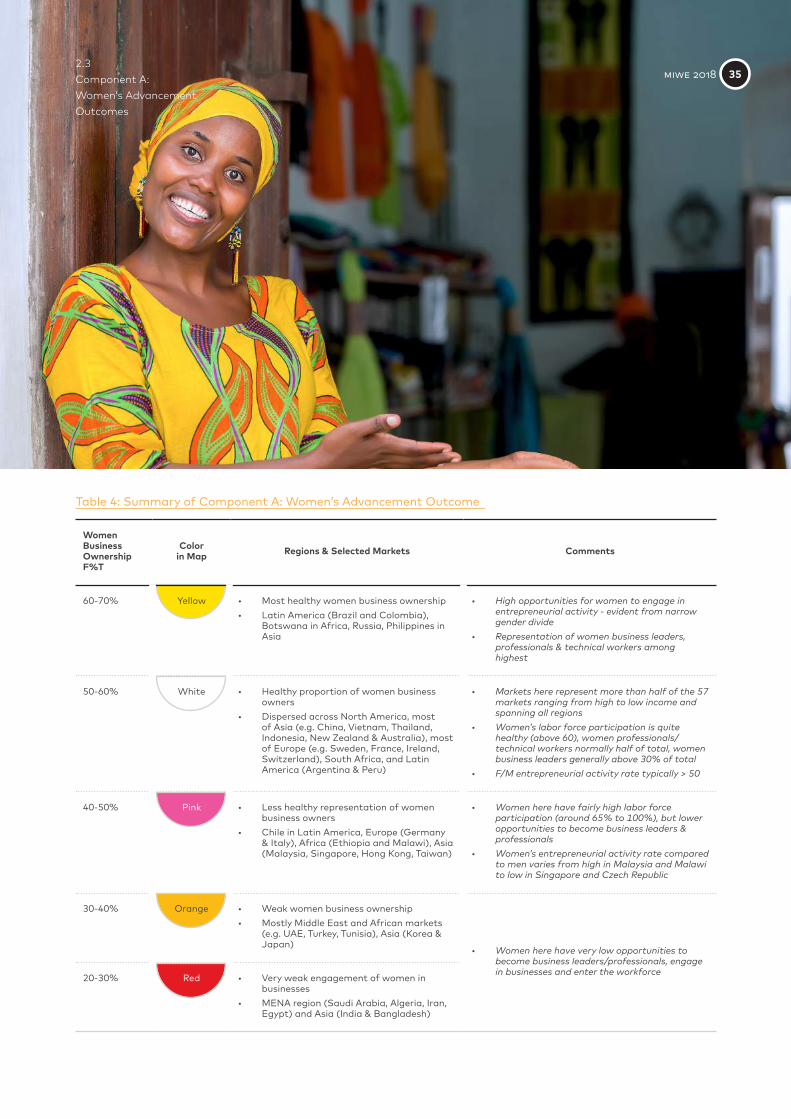
Table 4: Summary of Component A: Women’s Advancement Outcome
Women Business Ownership F%T
Colorin Map Regions & Selected Markets Comments
60-70% Yellow • Most healthy women business ownership• Latin America (Brazil and Colombia),
Botswana in Africa, Russia, Philippines in Asia
• High opportunities for women to engage in entrepreneurial activity - evident from narrow gender divide
• Representation of women business leaders, professionals & technical workers among highest
50-60% White • Healthy proportion of women business owners
• Dispersed across North America, most of Asia (e.g. China, Vietnam, Thailand, Indonesia, New Zealand & Australia), most of Europe (e.g. Sweden, France, Ireland, Switzerland), South Africa, and Latin America (Argentina & Peru)
• Markets here represent more than half of the 57 markets ranging from high to low income and spanning all regions
• Women’s labor force participation is quite healthy (above 60), women professionals/technical workers normally half of total, women business leaders generally above 30% of total
• F/M entrepreneurial activity rate typically > 50
40-50% Pink • Less healthy representation of women business owners
• Chile in Latin America, Europe (Germany & Italy), Africa (Ethiopia and Malawi), Asia (Malaysia, Singapore, Hong Kong, Taiwan)
• Women here have fairly high labor force participation (around 65% to 100%), but lower opportunities to become business leaders & professionals
• Women’s entrepreneurial activity rate compared to men varies from high in Malaysia and Malawi to low in Singapore and Czech Republic
30-40% Orange • Weak women business ownership• Mostly Middle East and African markets
(e.g. UAE, Turkey, Tunisia), Asia (Korea & Japan) • Women here have very low opportunities to
become business leaders/professionals, engage in businesses and enter the workforce20-30% Red • Very weak engagement of women in
businesses• MENA region (Saudi Arabia, Algeria, Iran,
Egypt) and Asia (India & Bangladesh)
miwe 2018 35
2.3 Component A: Women’s Advancement Outcomes
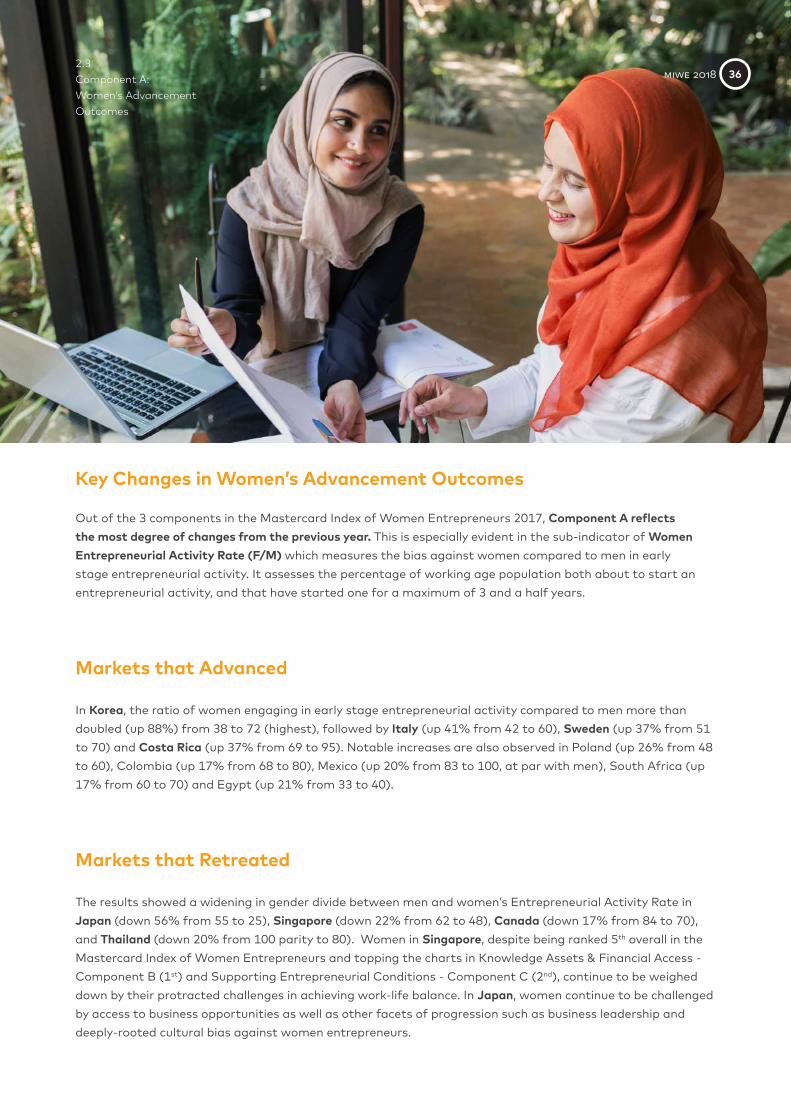
Key Changes in Women’s Advancement Outcomes Out of the 3 components in the Mastercard Index of Women Entrepreneurs 2017, Component A reflects the most degree of changes from the previous year. This is especially evident in the sub-indicator of Women Entrepreneurial Activity Rate (F/M) which measures the bias against women compared to men in early stage entrepreneurial activity. It assesses the percentage of working age population both about to start an entrepreneurial activity, and that have started one for a maximum of 3 and a half years.
Markets that Advanced In Korea, the ratio of women engaging in early stage entrepreneurial activity compared to men more than doubled (up 88%) from 38 to 72 (highest), followed by Italy (up 41% from 42 to 60), Sweden (up 37% from 51 to 70) and Costa Rica (up 37% from 69 to 95). Notable increases are also observed in Poland (up 26% from 48 to 60), Colombia (up 17% from 68 to 80), Mexico (up 20% from 83 to 100, at par with men), South Africa (up 17% from 60 to 70) and Egypt (up 21% from 33 to 40).
Markets that Retreated The results showed a widening in gender divide between men and women’s Entrepreneurial Activity Rate in Japan (down 56% from 55 to 25), Singapore (down 22% from 62 to 48), Canada (down 17% from 84 to 70), and Thailand (down 20% from 100 parity to 80). Women in Singapore, despite being ranked 5th overall in the Mastercard Index of Women Entrepreneurs and topping the charts in Knowledge Assets & Financial Access - Component B (1st) and Supporting Entrepreneurial Conditions - Component C (2nd), continue to be weighed down by their protracted challenges in achieving work-life balance. In Japan, women continue to be challenged by access to business opportunities as well as other facets of progression such as business leadership and deeply-rooted cultural bias against women entrepreneurs.
miwe 2018 36

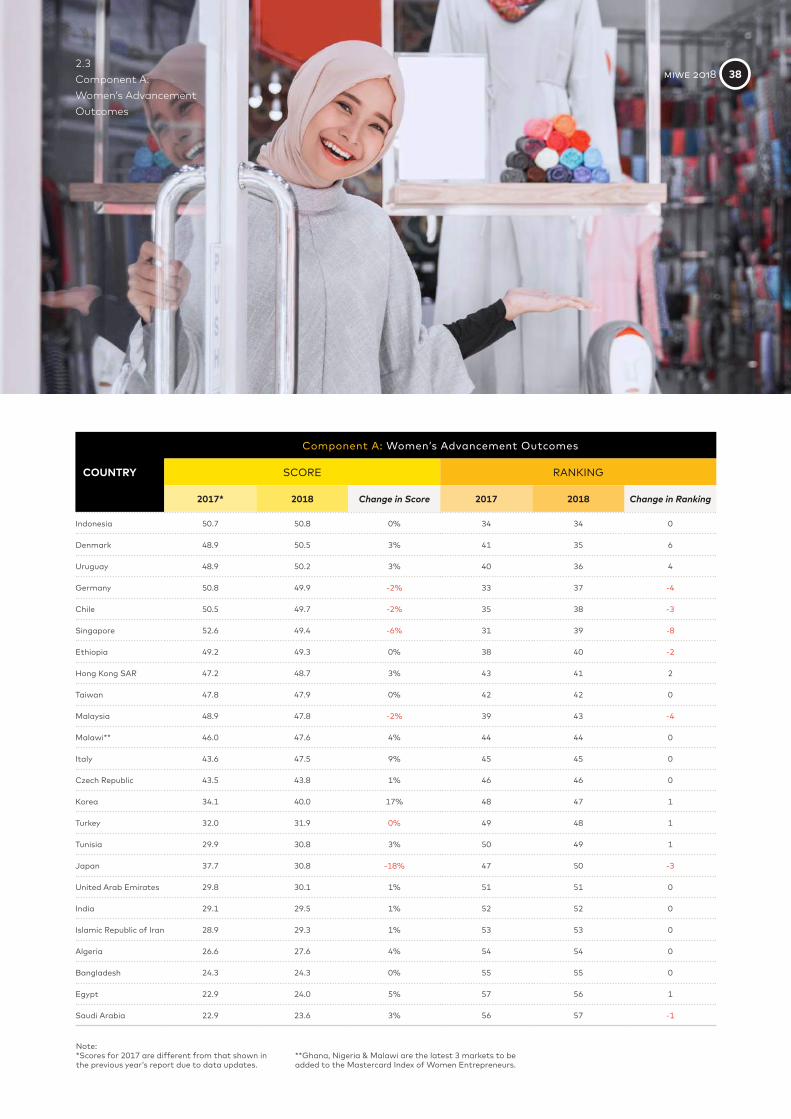
2.3 Component A: Women’s Advancement Outcomes
Philippines 65.9 65.9 0% 1 1 0
Colombia 61.7 64.1 4% 5 2 3
Russia 62.3 63.7 2% 3 3 0
Brazil 61.6 62.5 2% 7 4 3
Nigeria** 62.4 62.4 0% 2 5 -3
Botswana 61.4 61.0 -1% 8 6 2
Sweden 55.3 59.8 8% 19 7 12
United States 58.2 59.8 3% 13 8 5
New Zealand 61.2 59.7 -3% 9 9 0
Vietnam 59.5 59.6 0% 10 10 0
Canada 62.2 59.4 -5% 4 11 -7
Ghana** 59.3 59.1 0% 11 12 -1
Australia 57.5 58.5 2% 14 13 1
Thailand 61.6 58.3 -5% 6 14 -8
Israel 57.0 58.1 2% 16 15 1
Peru 59.3 57.8 -2% 12 16 -4
Poland 54.1 57.4 6% 24 17 7
Costa Rica 52.8 57.2 8% 26 18 8
Ecuador 57.2 56.5 -1% 15 19 -4
Spain 56.1 56.4 0% 17 20 -3
Portugal 54.4 55.8 3% 22 21 1
Uganda 55.6 55.7 0% 18 22 -4
Belgium 54.7 55.0 0% 21 23 -2
South Africa 52.7 54.6 4% 30 24 6
Argentina 54.2 54.4 0% 23 25 -2
Hungary 54.8 54.2 -1% 20 26 -6
China 53.4 54.1 1% 25 27 -2
Mexico 50.5 52.8 5% 36 28 8
United Kingdom 52.8 52.2 -1% 27 29 -2
Switzerland 52.7 51.8 -2% 29 30 -1
Ireland 50.1 51.6 3% 37 31 6
France 52.8 51.5 -2% 28 32 -4
Romania 51.8 51.1 -1% 32 33 -1
Table 5: Change in Score & Ranking for Component A: Women’s Advancement Outcomes
COUNTRY
Component A: Women’s Advancement Outcomes
SCORE RANKING
2017* 2018 Change in Score 2017 2018 Change in Ranking
miwe 2018 37
2.3 Component A: Women’s Advancement Outcomes
Indonesia 50.7 50.8 0% 34 34 0
Denmark 48.9 50.5 3% 41 35 6
Uruguay 48.9 50.2 3% 40 36 4
Germany 50.8 49.9 -2% 33 37 -4
Chile 50.5 49.7 -2% 35 38 -3
Singapore 52.6 49.4 -6% 31 39 -8
Ethiopia 49.2 49.3 0% 38 40 -2
Hong Kong SAR 47.2 48.7 3% 43 41 2
Taiwan 47.8 47.9 0% 42 42 0
Malaysia 48.9 47.8 -2% 39 43 -4
Malawi** 46.0 47.6 4% 44 44 0
Italy 43.6 47.5 9% 45 45 0
Czech Republic 43.5 43.8 1% 46 46 0
Korea 34.1 40.0 17% 48 47 1
Turkey 32.0 31.9 0% 49 48 1
Tunisia 29.9 30.8 3% 50 49 1
Japan 37.7 30.8 -18% 47 50 -3
United Arab Emirates 29.8 30.1 1% 51 51 0
India 29.1 29.5 1% 52 52 0
Islamic Republic of Iran 28.9 29.3 1% 53 53 0
Algeria 26.6 27.6 4% 54 54 0
Bangladesh 24.3 24.3 0% 55 55 0
Egypt 22.9 24.0 5% 57 56 1
Saudi Arabia 22.9 23.6 3% 56 57 -1
Note:*Scores for 2017 are different from that shown in the previous year’s report due to data updates.
**Ghana, Nigeria & Malawi are the latest 3 markets to be added to the Mastercard Index of Women Entrepreneurs.
COUNTRY
Component A: Women’s Advancement Outcomes
SCORE RANKING
2017* 2018 Change in Score 2017 2018 Change in Ranking
miwe 2018 38
Singapore
Hong Kong
0-20
Higher ScoreLower Score
20-30 30-40 40-50 50-60 60-70 70-80 80-100
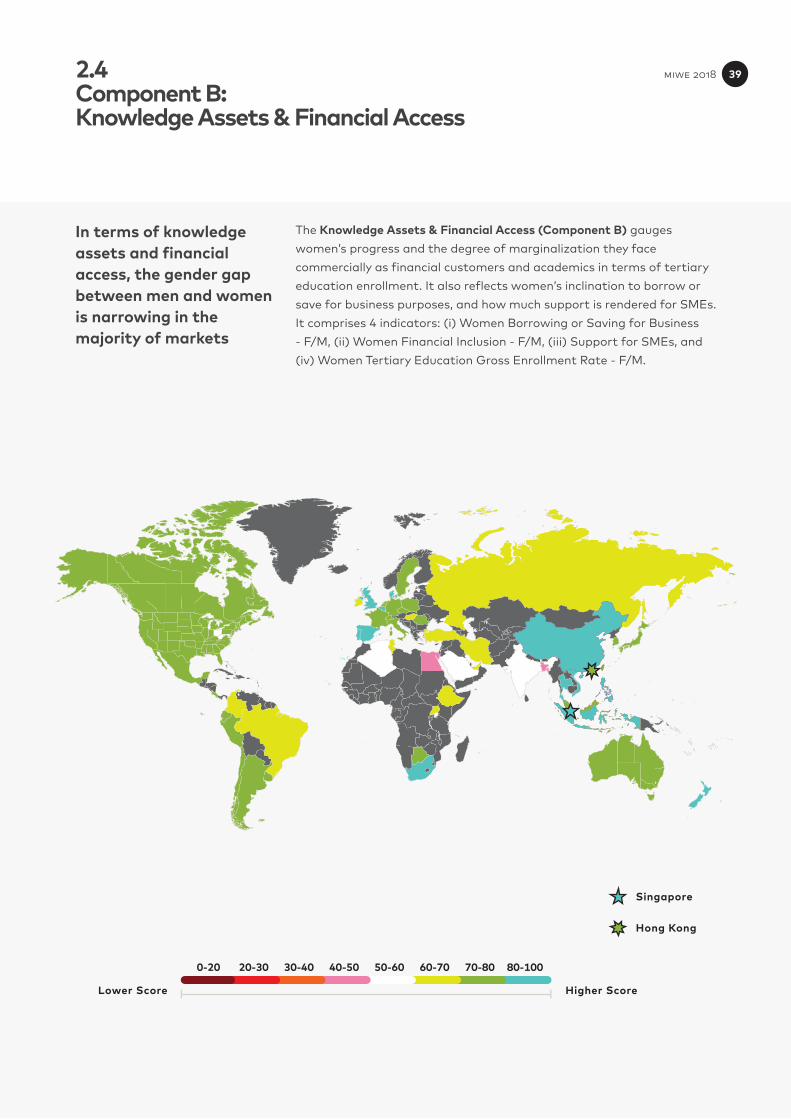
BIn terms of knowledge assets and financial access, the gender gap between men and women is narrowing in the majority of markets
The Knowledge Assets & Financial Access (Component B) gauges women’s progress and the degree of marginalization they face commercially as financial customers and academics in terms of tertiary education enrollment. It also reflects women’s inclination to borrow or save for business purposes, and how much support is rendered for SMEs. It comprises 4 indicators: (i) Women Borrowing or Saving for Business - F/M, (ii) Women Financial Inclusion - F/M, (iii) Support for SMEs, and (iv) Women Tertiary Education Gross Enrollment Rate - F/M.
2.4 Component B: Knowledge Assets & Financial Access
miwe 2018 39
90.9
89.2
86.7
86.0
84.4
84.3
83.0
82.8
82.5
82.1
81.7
81.5
81.4
81.1
79.8
79.7
79.1
78.9
78.5
77.8
77.1
76.2
76.2
76.1
76.0
74.9
74.4
74.3
73.1
73.0
73.0
72.8
72.8
72.7
72.0
72.0
71.4
70.0
69.6
69.1
69.0
68.8
68.7
68.5
67.9
66.0
65.9
65.6
64.5
63.4
61.0
57.6
55.6
55.5
54.7
49.8
48.8
Singapore
New Zealand
Vietnam
Portugal
Belg ium
South Afr ica
Spain
Thai land
United Kingdom
China
Denmark
Phi l ippines
Indonesia
Israel
Hong Kong SAR
United States
Sweden
Canada
Chi le
Peru
Taiwan
Czech Republ ic
Malaysia
Romania
Korea
Argentina
Austral ia
Ecuador
Germany
Switzer land
Botswana
Japan
Mexico
Costa Rica
France
Poland
Uruguay
Italy
Uganda
Russia
Ghana
Colombia
Hungar y
Turkey
Ire land
Is lamic Republ ic of I ran
Brazi l
Niger ia
United Arab Emirates
Ethiopia
Tunis ia
Malawi
Alger ia
Saudi Arabia
India
Egypt
Bangladesh
0 10 20 30 40 50 60 70 80 90 100
High Income
Upper Middle Income
Lower Middle Income
Low Income
2.4 Component B: Knowledge Assets & Financial Access
Component B: Knowledge Assets & Financial Access
2018
miwe 2018 40
2.4 Component B: Knowledge Assets & Financial Access
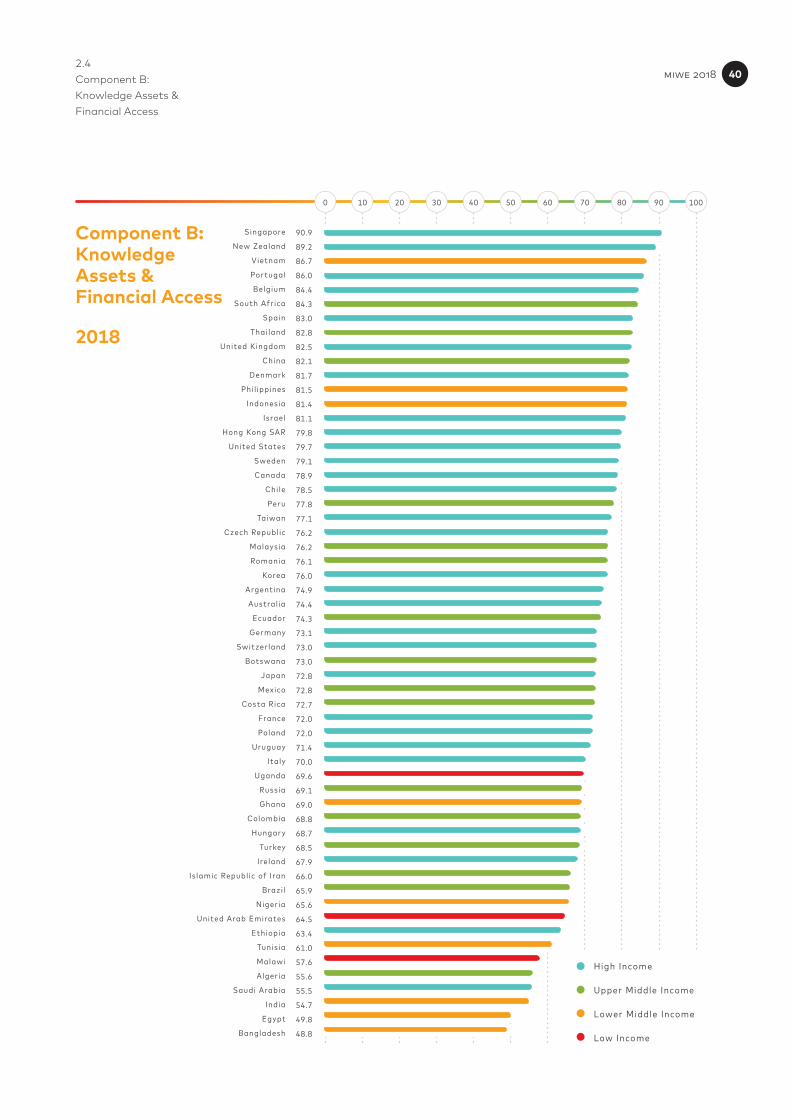
Top & Bottom Performers
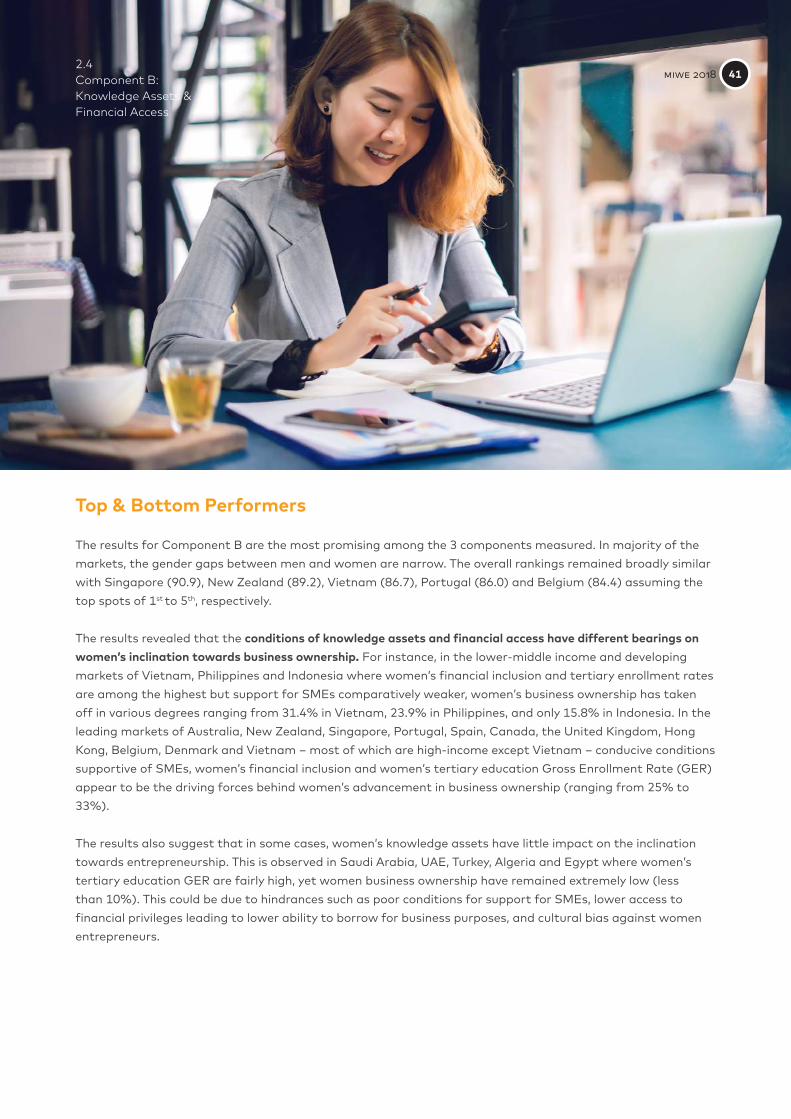
The results for Component B are the most promising among the 3 components measured. In majority of the markets, the gender gaps between men and women are narrow. The overall rankings remained broadly similar with Singapore (90.9), New Zealand (89.2), Vietnam (86.7), Portugal (86.0) and Belgium (84.4) assuming the top spots of 1st to 5th, respectively.
The results revealed that the conditions of knowledge assets and financial access have different bearings on women’s inclination towards business ownership. For instance, in the lower-middle income and developing markets of Vietnam, Philippines and Indonesia where women’s financial inclusion and tertiary enrollment rates are among the highest but support for SMEs comparatively weaker, women’s business ownership has taken off in various degrees ranging from 31.4% in Vietnam, 23.9% in Philippines, and only 15.8% in Indonesia. In the leading markets of Australia, New Zealand, Singapore, Portugal, Spain, Canada, the United Kingdom, Hong Kong, Belgium, Denmark and Vietnam – most of which are high-income except Vietnam – conducive conditions supportive of SMEs, women’s financial inclusion and women’s tertiary education Gross Enrollment Rate (GER) appear to be the driving forces behind women’s advancement in business ownership (ranging from 25% to 33%).
The results also suggest that in some cases, women’s knowledge assets have little impact on the inclination towards entrepreneurship. This is observed in Saudi Arabia, UAE, Turkey, Algeria and Egypt where women’s tertiary education GER are fairly high, yet women business ownership have remained extremely low (less than 10%). This could be due to hindrances such as poor conditions for support for SMEs, lower access to financial privileges leading to lower ability to borrow for business purposes, and cultural bias against women entrepreneurs.
miwe 2018 41
2.4 Component B: Knowledge Assets & Financial Access
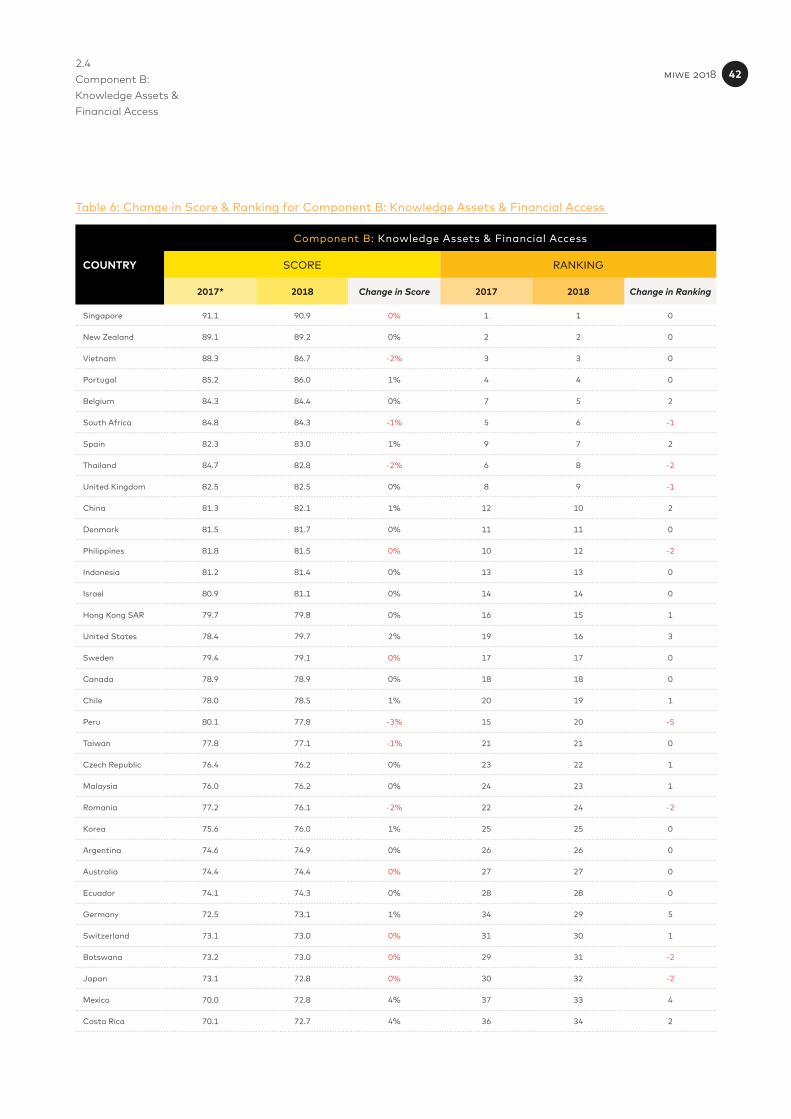
Table 6: Change in Score & Ranking for Component B: Knowledge Assets & Financial Access
Singapore 91.1 90.9 0% 1 1 0
New Zealand 89.1 89.2 0% 2 2 0
Vietnam 88.3 86.7 -2% 3 3 0
Portugal 85.2 86.0 1% 4 4 0
Belgium 84.3 84.4 0% 7 5 2
South Africa 84.8 84.3 -1% 5 6 -1
Spain 82.3 83.0 1% 9 7 2
Thailand 84.7 82.8 -2% 6 8 -2
United Kingdom 82.5 82.5 0% 8 9 -1
China 81.3 82.1 1% 12 10 2
Denmark 81.5 81.7 0% 11 11 0
Philippines 81.8 81.5 0% 10 12 -2
Indonesia 81.2 81.4 0% 13 13 0
Israel 80.9 81.1 0% 14 14 0
Hong Kong SAR 79.7 79.8 0% 16 15 1
United States 78.4 79.7 2% 19 16 3
Sweden 79.4 79.1 0% 17 17 0
Canada 78.9 78.9 0% 18 18 0
Chile 78.0 78.5 1% 20 19 1
Peru 80.1 77.8 -3% 15 20 -5
Taiwan 77.8 77.1 -1% 21 21 0
Czech Republic 76.4 76.2 0% 23 22 1
Malaysia 76.0 76.2 0% 24 23 1
Romania 77.2 76.1 -2% 22 24 -2
Korea 75.6 76.0 1% 25 25 0
Argentina 74.6 74.9 0% 26 26 0
Australia 74.4 74.4 0% 27 27 0
Ecuador 74.1 74.3 0% 28 28 0
Germany 72.5 73.1 1% 34 29 5
Switzerland 73.1 73.0 0% 31 30 1
Botswana 73.2 73.0 0% 29 31 -2
Japan 73.1 72.8 0% 30 32 -2
Mexico 70.0 72.8 4% 37 33 4
Costa Rica 70.1 72.7 4% 36 34 2
COUNTRY
Component B: Knowledge Assets & Financial Access
SCORE RANKING
2017* 2018 Change in Score 2017 2018 Change in Ranking
miwe 2018 42
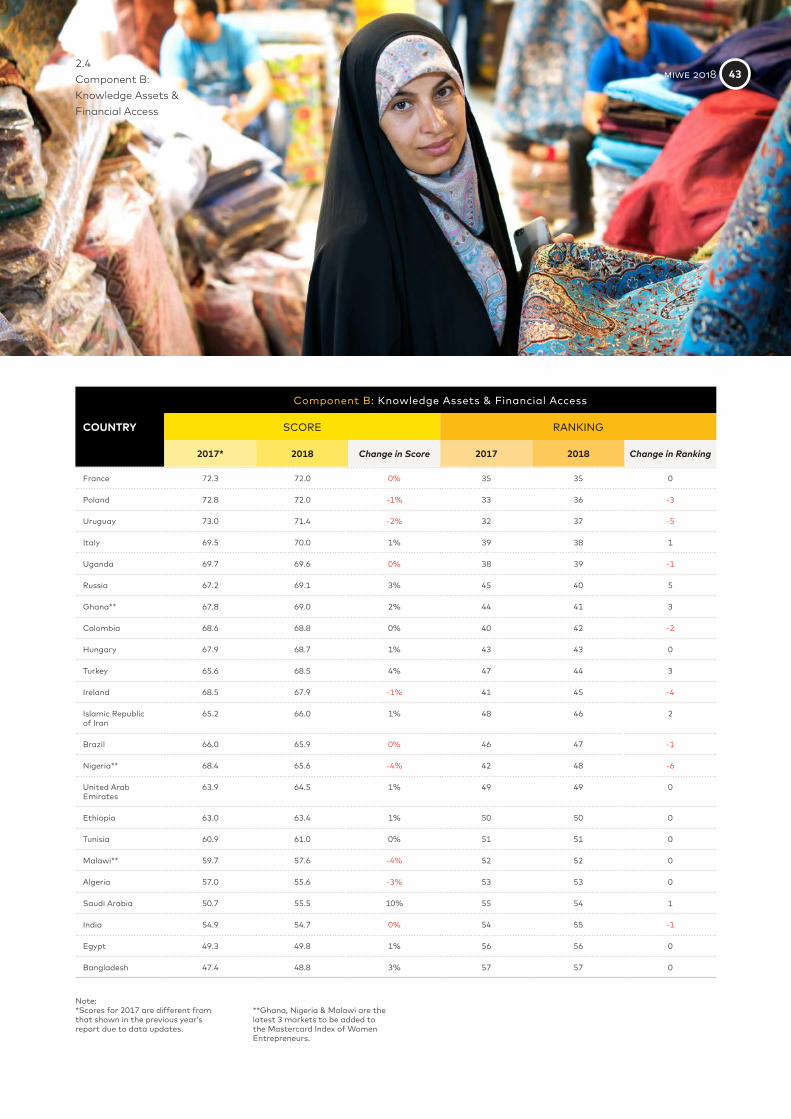
2.4 Component B: Knowledge Assets & Financial Access
France 72.3 72.0 0% 35 35 0
Poland 72.8 72.0 -1% 33 36 -3
Uruguay 73.0 71.4 -2% 32 37 -5
Italy 69.5 70.0 1% 39 38 1
Uganda 69.7 69.6 0% 38 39 -1
Russia 67.2 69.1 3% 45 40 5
Ghana** 67.8 69.0 2% 44 41 3
Colombia 68.6 68.8 0% 40 42 -2
Hungary 67.9 68.7 1% 43 43 0
Turkey 65.6 68.5 4% 47 44 3
Ireland 68.5 67.9 -1% 41 45 -4
Islamic Republic of Iran
65.2 66.0 1% 48 46 2
Brazil 66.0 65.9 0% 46 47 -1
Nigeria** 68.4 65.6 -4% 42 48 -6
United Arab Emirates
63.9 64.5 1% 49 49 0
Ethiopia 63.0 63.4 1% 50 50 0
Tunisia 60.9 61.0 0% 51 51 0
Malawi** 59.7 57.6 -4% 52 52 0
Algeria 57.0 55.6 -3% 53 53 0
Saudi Arabia 50.7 55.5 10% 55 54 1
India 54.9 54.7 0% 54 55 -1
Egypt 49.3 49.8 1% 56 56 0
Bangladesh 47.4 48.8 3% 57 57 0
Note:*Scores for 2017 are different from that shown in the previous year’s report due to data updates.
**Ghana, Nigeria & Malawi are the latest 3 markets to be added to the Mastercard Index of Women Entrepreneurs.
COUNTRY
Component B: Knowledge Assets & Financial Access
SCORE RANKING
2017* 2018 Change in Score 2017 2018 Change in Ranking
miwe 2018 43
Singapore
Hong Kong
0-20
Higher ScoreLower Score
20-30 30-40 40-50 50-60 60-70 70-80 80-100
C
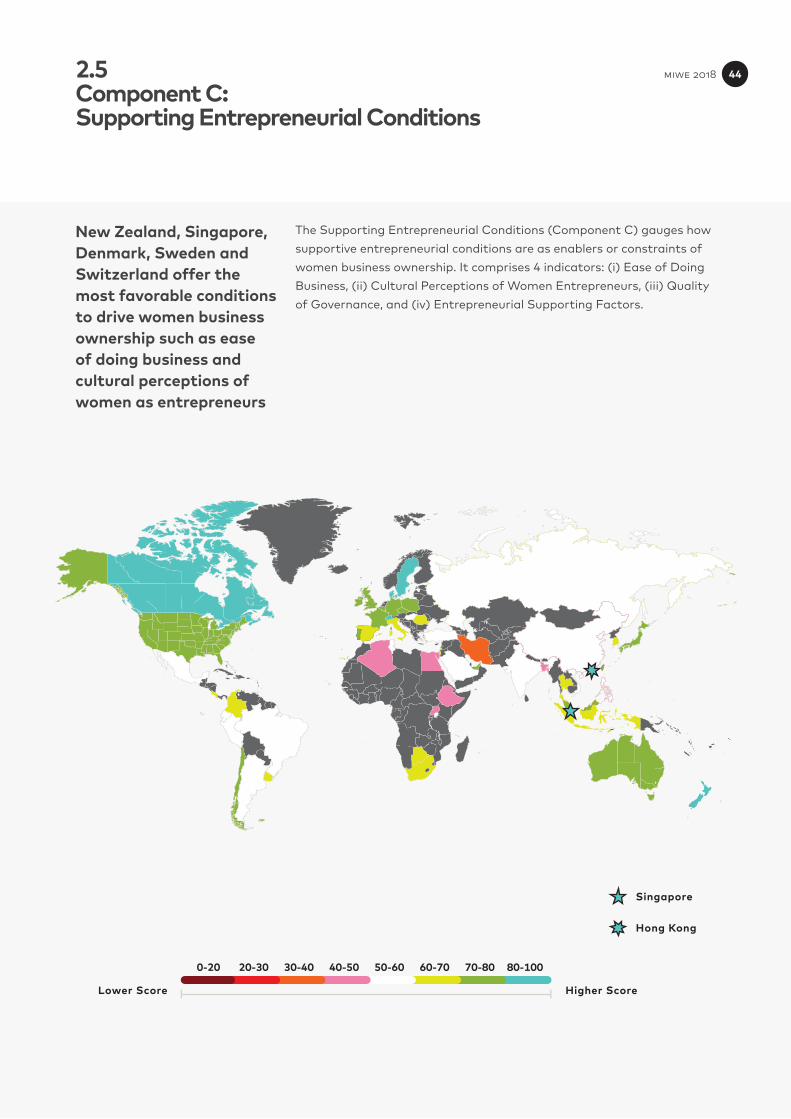
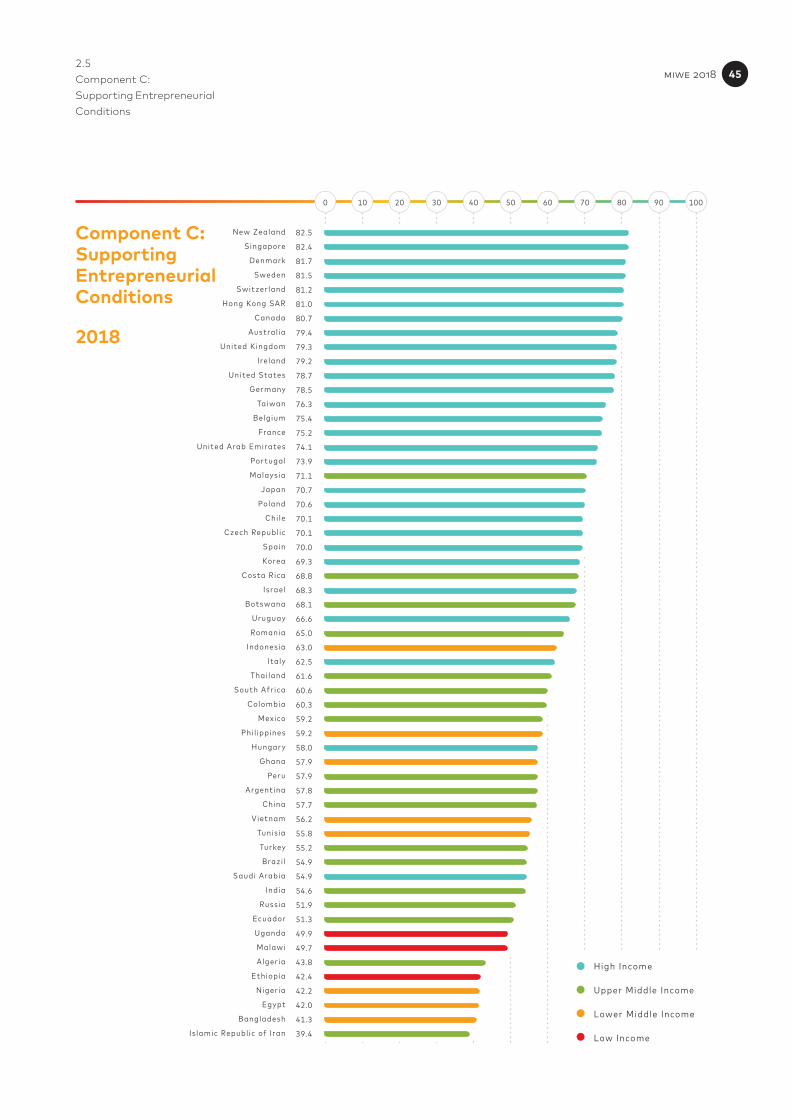
New Zealand, Singapore, Denmark, Sweden and Switzerland offer the most favorable conditions to drive women business ownership such as ease of doing business and cultural perceptions of women as entrepreneurs
The Supporting Entrepreneurial Conditions (Component C) gauges how supportive entrepreneurial conditions are as enablers or constraints of women business ownership. It comprises 4 indicators: (i) Ease of Doing Business, (ii) Cultural Perceptions of Women Entrepreneurs, (iii) Quality of Governance, and (iv) Entrepreneurial Supporting Factors.
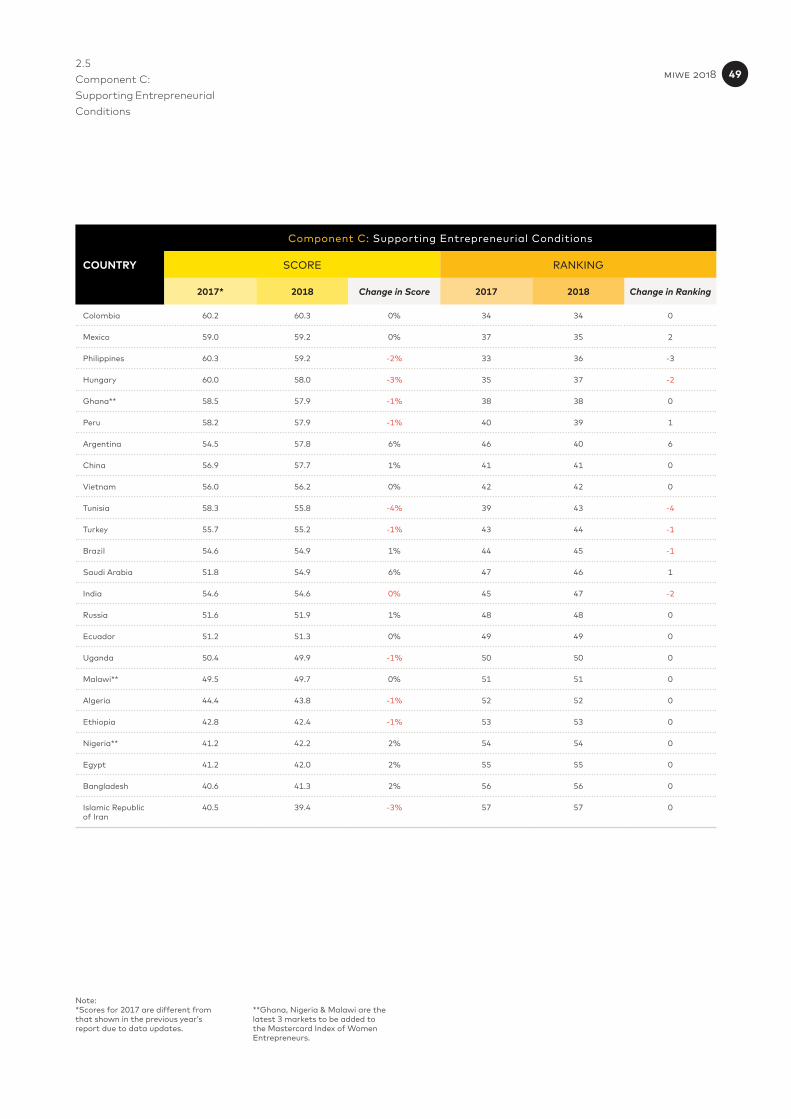
2.5 Component C: Supporting Entrepreneurial Conditions
miwe 2018 44
82.5
82.4
81.7
81.5
81.2
81.0
80.7
79.4
79.3
79.2
78.7
78.5
76.3
75.4
75.2
74.1
73.9
71.1
70.7
70.6
70.1
70.1
70.0
69.3
68.8
68.3
68.1
66.6
65.0
63.0
62.5
61.6
60.6
60.3
59.2
59.2
58.0
57.9
57.9
57.8
57.7
56.2
55.8
55.2
54.9
54.9
54.6
51.9
51.3
49.9
49.7
43.8
42.4
42.2
42.0
41.3
39.4
New Zealand
Singapore
Denmark
Sweden
Switzer land
Hong Kong SAR
Canada
Austral ia
United Kingdom
Ire land
United States
Germany
Taiwan
Belgium
France
United Arab Emirates
Portugal
Malaysia
Japan
Poland
Chi le
Czech Republ ic
Spain
Korea
Costa Rica
Israel
Botswana
Uruguay
Romania
Indonesia
Italy
Thai land
South Afr ica
Colombia
Mexico
Phi l ippines
Hungar y
Ghana
Peru
Argentina
China
Vietnam
Tunis ia
Turkey
Brazi l
Saudi Arabia
India
Russia
Ecuador
Uganda
Malawi
Alger ia
Ethiopia
Niger ia
Egypt
Bangladesh
Is lamic Republ ic of I ran
0 10 20 30 40 50 60 70 80 90 100
High Income
Upper Middle Income
Lower Middle Income
Low Income
2.5 Component C: Supporting Entrepreneurial Conditions
Component C: Supporting Entrepreneurial Conditions
2018
miwe 2018 45
2.5 Component C: Supporting Entrepreneurial Conditions
Top & Bottom Performers
Apart from Hungary and Saudi Arabia, the majority of wealthy economies render the most propitious conditions and enabling factors for entrepreneurship, while less wealthy economies tend to present more constraints. This likely stems from the fact that high income economies such as New Zealand, Singapore, Denmark and Canada tend to be highly innovative and developed where women have greater opportunities and access to better quality of education, financial facilities, effective rules of law and governance and supporting conditions for businesses. In less wealthy markets such as Ethiopia, Malawi, Bangladesh and Egypt, women’s inclination towards business ownership may be undermined by limited access to education, financial and entrepreneurial opportunities.
The rankings of the economies are broadly similar from the previous year, with New Zealand (82.5), Singapore (82.4), Denmark (81.7), Sweden (81.5) and Switzerland (81.2) offering the most favorable conditions that drive women business ownership. Not surprising, these markets are also among the top rankings in the MIWE and are wealthy and more developed and innovation-driven. In contrast, markets that are less wealthy, less developed and factor-driven such as Bangladesh (41.3), Egypt (42.0) and Ethiopia (42.4) tend to have considerably less supportive entrepreneurial conditions and therefore, lower overall index scores and rankings. Women in these markets have very low opportunities to rise in their careers as business leaders, professionals/technical workers, or participate in the workforce.
miwe 2018 46
2.5 Component C: Supporting Entrepreneurial Conditions
Nigeria stands out as an outlier: although the women here are severely undermined by poor conditions of Financial Access and Supporting Entrepreneurial Conditions such as Ease of Doing Business and Quality of Governance, they score very highly in Component A: Women’s Advancement Outcomes (62.4, rank 5). In this market, the representation of women as Business Leaders (30.8% of Total) and Professionals/Technical Workers (65.4% of Total) are among the highest. They are at par with men in Entrepreneurial Activity Rate - F/M (100.0, parity), and have a fairly healthy participation rate in the Labor Force - F/M (75.5). They are also nearly as likely as men to borrow or save for a business (F/M of 97.2), and eagerly seek out good business opportunities (F/M Opportunity-Driven TEA Ratio of 1.0).10 This high inclination towards entrepreneurial/business activity likely stems from the lack of employment opportunities. Figures from the National Bureau of Statistics (Nigeria) reveal female unemployment and underemployment rates to be very high at 16.3% and 24.2%, respectively, in the December quarter of 2016 – conditions that have been exacerbated by the negative economic growth recorded by the nation in 2016.11,12
Indonesia (63.0), Philippines (59.2), Ghana (57.9) and Vietnam (56.2) are lower-middle income and mostly factor-driven markets with comparatively poor Quality of Governance but impress with healthy Supporting Entrepreneurial Conditions. This is fueled by positive elements such as: (i) strong Cultural Perceptions of Women Entrepreneurs and Family Support, (ii) low fear of business failure; and (iii) good opportunities for new businesses. Women here also score highly for Component B: Knowledge Assets and Financial Access (top 13), driven by very high Women Financial Inclusion and Women Tertiary Education GER.
miwe 2018 47
2.5 Component C: Supporting Entrepreneurial Conditions
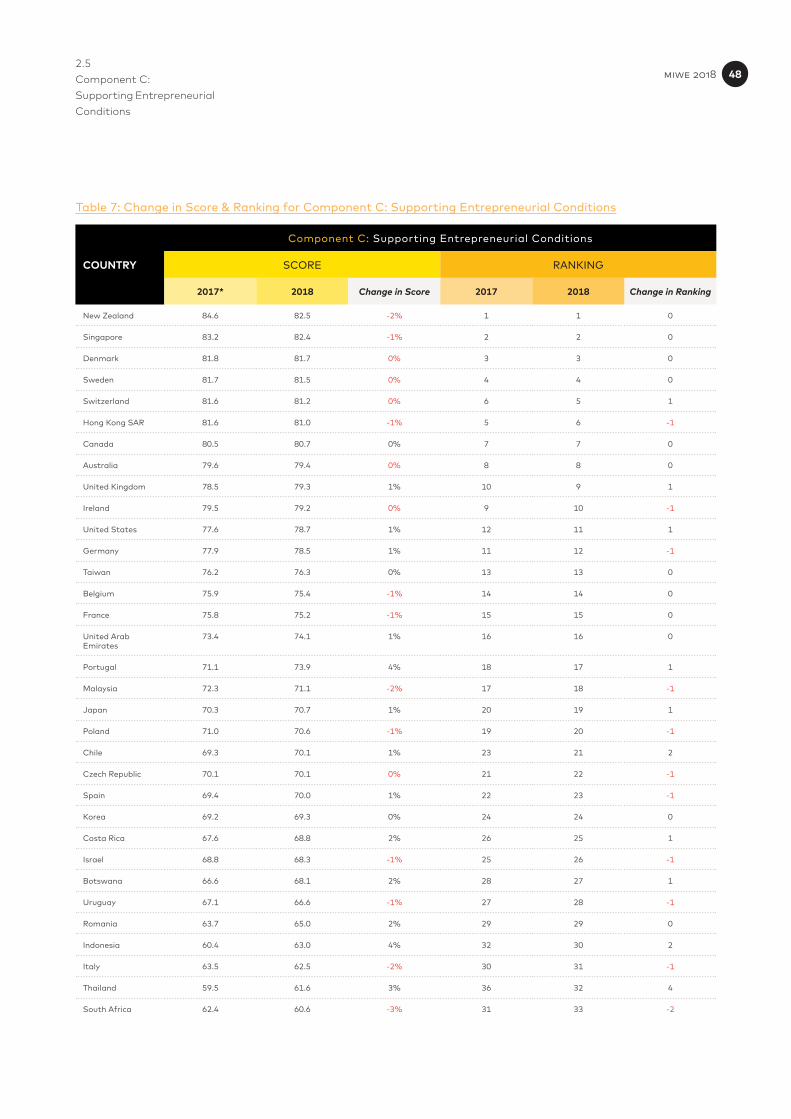
Table 7: Change in Score & Ranking for Component C: Supporting Entrepreneurial Conditions
New Zealand 84.6 82.5 -2% 1 1 0
Singapore 83.2 82.4 -1% 2 2 0
Denmark 81.8 81.7 0% 3 3 0
Sweden 81.7 81.5 0% 4 4 0
Switzerland 81.6 81.2 0% 6 5 1
Hong Kong SAR 81.6 81.0 -1% 5 6 -1
Canada 80.5 80.7 0% 7 7 0
Australia 79.6 79.4 0% 8 8 0
United Kingdom 78.5 79.3 1% 10 9 1
Ireland 79.5 79.2 0% 9 10 -1
United States 77.6 78.7 1% 12 11 1
Germany 77.9 78.5 1% 11 12 -1
Taiwan 76.2 76.3 0% 13 13 0
Belgium 75.9 75.4 -1% 14 14 0
France 75.8 75.2 -1% 15 15 0
United Arab Emirates
73.4 74.1 1% 16 16 0
Portugal 71.1 73.9 4% 18 17 1
Malaysia 72.3 71.1 -2% 17 18 -1
Japan 70.3 70.7 1% 20 19 1
Poland 71.0 70.6 -1% 19 20 -1
Chile 69.3 70.1 1% 23 21 2
Czech Republic 70.1 70.1 0% 21 22 -1
Spain 69.4 70.0 1% 22 23 -1
Korea 69.2 69.3 0% 24 24 0
Costa Rica 67.6 68.8 2% 26 25 1
Israel 68.8 68.3 -1% 25 26 -1
Botswana 66.6 68.1 2% 28 27 1
Uruguay 67.1 66.6 -1% 27 28 -1
Romania 63.7 65.0 2% 29 29 0
Indonesia 60.4 63.0 4% 32 30 2
Italy 63.5 62.5 -2% 30 31 -1
Thailand 59.5 61.6 3% 36 32 4
South Africa 62.4 60.6 -3% 31 33 -2
COUNTRY
Component C: Supporting Entrepreneurial Conditions
SCORE RANKING
2017* 2018 Change in Score 2017 2018 Change in Ranking
miwe 2018 48
2.5 Component C: Supporting Entrepreneurial Conditions
Note:*Scores for 2017 are different from that shown in the previous year’s report due to data updates.
**Ghana, Nigeria & Malawi are the latest 3 markets to be added to the Mastercard Index of Women Entrepreneurs.
Colombia 60.2 60.3 0% 34 34 0
Mexico 59.0 59.2 0% 37 35 2
Philippines 60.3 59.2 -2% 33 36 -3
Hungary 60.0 58.0 -3% 35 37 -2
Ghana** 58.5 57.9 -1% 38 38 0
Peru 58.2 57.9 -1% 40 39 1
Argentina 54.5 57.8 6% 46 40 6
China 56.9 57.7 1% 41 41 0
Vietnam 56.0 56.2 0% 42 42 0
Tunisia 58.3 55.8 -4% 39 43 -4
Turkey 55.7 55.2 -1% 43 44 -1
Brazil 54.6 54.9 1% 44 45 -1
Saudi Arabia 51.8 54.9 6% 47 46 1
India 54.6 54.6 0% 45 47 -2
Russia 51.6 51.9 1% 48 48 0
Ecuador 51.2 51.3 0% 49 49 0
Uganda 50.4 49.9 -1% 50 50 0
Malawi** 49.5 49.7 0% 51 51 0
Algeria 44.4 43.8 -1% 52 52 0
Ethiopia 42.8 42.4 -1% 53 53 0
Nigeria** 41.2 42.2 2% 54 54 0
Egypt 41.2 42.0 2% 55 55 0
Bangladesh 40.6 41.3 2% 56 56 0
Islamic Republic of Iran
40.5 39.4 -3% 57 57 0
COUNTRY
Component C: Supporting Entrepreneurial Conditions
SCORE RANKING
2017* 2018 Change in Score 2017 2018 Change in Ranking
miwe 2018 49

3.0
miwe 2018 50 miwe 2018 50
As an overall trend, markets with higher Index scores (above 55) tend to have a higher percentage of business
owners, and conversely women in markets with lower Index scores (below 55) are less active as business owners
The Matrix chart below depicts the relationship between the Mastercard Index of Women Entrepreneurs (MIWE) scores and the Benchmark indicator - Women Business Owners (as a percentage of all business
owners). The upward-curving dotted trend line reveals a strong positive correlation between the overall Index scores and Women Business Owners (as % of all owners). This is evident through the cluster of economies around the trend line or imaginary ‘line of best fit’ which represents the expected Women Business Owners
score at different MIWE score levels.
Expectations ofWomen’s Progress as
Business Owners
3.0 miwe 2018 51 miwe 2018 51
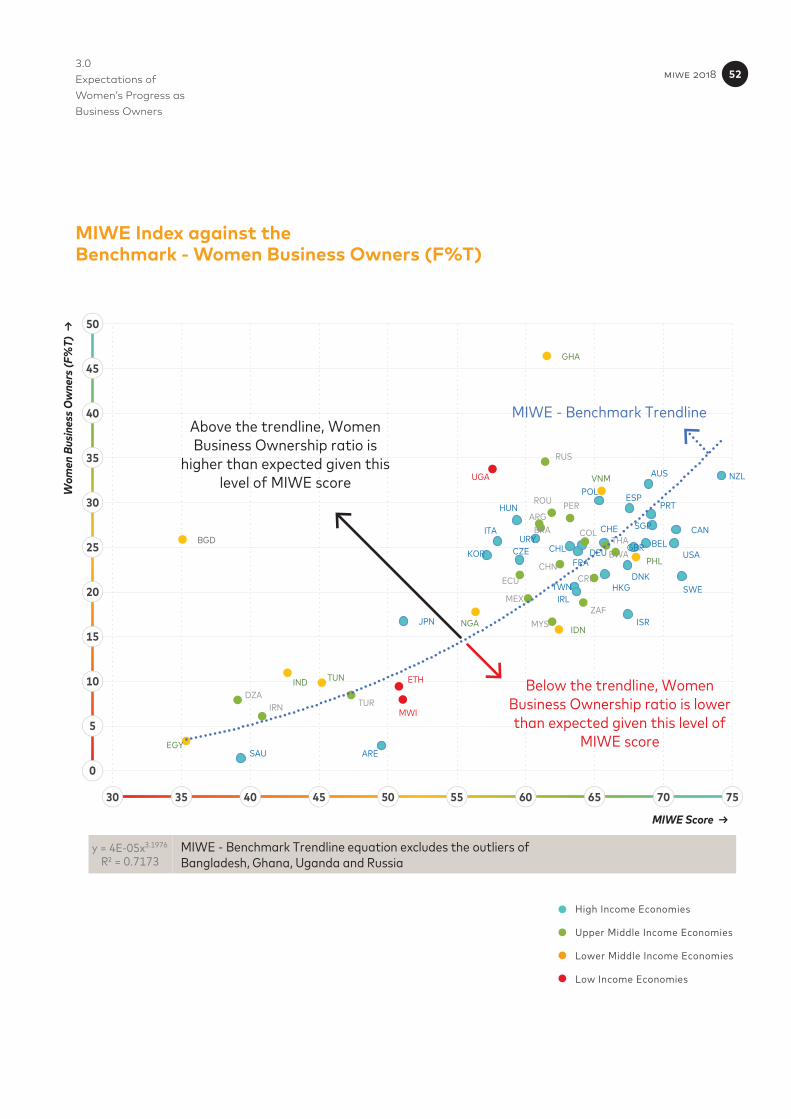
RUS
UGA
BGD
GHA
AUS
HKG
JPN
KOR
NZL
SGP
TWN
BELCZE
DNKFRA
DEU
HUN
IRL
ITA
POLPRT
ESP
SWE
CHE
GBRCHLURY
ISR
SAU ARE
CAN
USACHN
MYS
THA
ROU
TUR
ARGBRA COL
CRIECU
MEX
PER
DZAIRN
BWA
ZAF
IDN
PHL
EGY
TUNIND
VNM
NGA
ETH
MWI
MIWE Score →
y = 4E-05x3.1976
R² = 0.7173MIWE - Benchmark Trendline equation excludes the outliers of Bangladesh, Ghana, Uganda and Russia
Wom
en B
usin
ess O
wne
rs (F
%T)
→
High Income Economies
Upper Middle Income Economies
Lower Middle Income Economies
Low Income Economies
0
5
10
15
20
25
30
35
40
45
50
30 35 40 45 50 55 60 65 70 75
MIWE - Benchmark TrendlineAbove the trendline, Women Business Ownership ratio is
higher than expected given this level of MIWE score
Below the trendline, Women Business Ownership ratio is lower than expected given this level of
MIWE score
MIWE Index against the Benchmark - Women Business Owners (F%T)
3.0 Expectations of Women’s Progress as Business Owners
miwe 2018 52
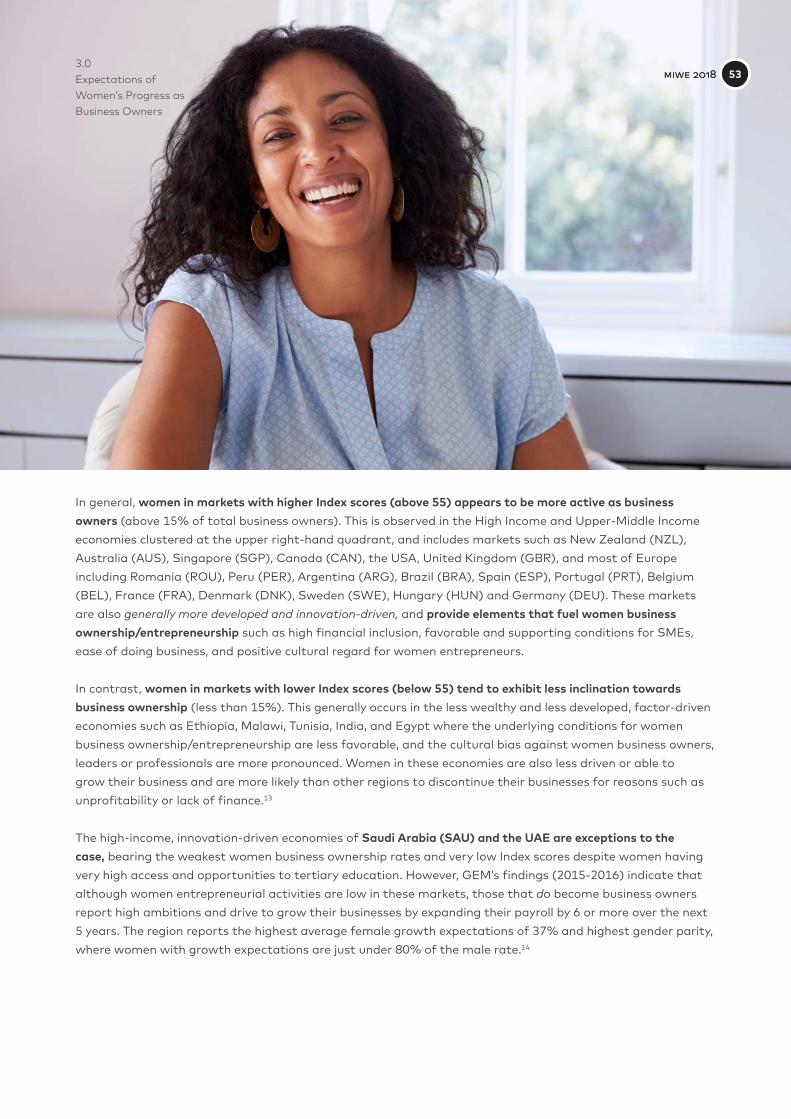
3.0 Expectations of Women’s Progress as Business Owners
In general, women in markets with higher Index scores (above 55) appears to be more active as business owners (above 15% of total business owners). This is observed in the High Income and Upper-Middle Income economies clustered at the upper right-hand quadrant, and includes markets such as New Zealand (NZL), Australia (AUS), Singapore (SGP), Canada (CAN), the USA, United Kingdom (GBR), and most of Europe including Romania (ROU), Peru (PER), Argentina (ARG), Brazil (BRA), Spain (ESP), Portugal (PRT), Belgium (BEL), France (FRA), Denmark (DNK), Sweden (SWE), Hungary (HUN) and Germany (DEU). These markets are also generally more developed and innovation-driven, and provide elements that fuel women business ownership/entrepreneurship such as high financial inclusion, favorable and supporting conditions for SMEs, ease of doing business, and positive cultural regard for women entrepreneurs.
In contrast, women in markets with lower Index scores (below 55) tend to exhibit less inclination towards business ownership (less than 15%). This generally occurs in the less wealthy and less developed, factor-driven economies such as Ethiopia, Malawi, Tunisia, India, and Egypt where the underlying conditions for women business ownership/entrepreneurship are less favorable, and the cultural bias against women business owners, leaders or professionals are more pronounced. Women in these economies are also less driven or able to grow their business and are more likely than other regions to discontinue their businesses for reasons such as unprofitability or lack of finance.13
The high-income, innovation-driven economies of Saudi Arabia (SAU) and the UAE are exceptions to the case, bearing the weakest women business ownership rates and very low Index scores despite women having very high access and opportunities to tertiary education. However, GEM’s findings (2015-2016) indicate that although women entrepreneurial activities are low in these markets, those that do become business owners report high ambitions and drive to grow their businesses by expanding their payroll by 6 or more over the next 5 years. The region reports the highest average female growth expectations of 37% and highest gender parity, where women with growth expectations are just under 80% of the male rate.14
miwe 2018 53 miwe 2018 53
3.0 Expectations of Women’s Progress as Business Owners
Markets above the MIWE - Benchmark Trendline There are some economies such as Ghana (GHA), Uganda (UGA), Bangladesh (BGD), Russia (RUS), Vietnam (VNM), Romania (ROU), Hungary (HUN), Peru (PER), Italy (ITA), and Poland (POL) residing above the MIWE - Benchmark Trendline that outperform their global peers. In these markets, although the social, financial, institutional and academic conditions for women are not always very favorable, women are able to leverage on opportunities available in their respective environments to be business owners and leaders (above 25% of total) and professionals/technical workers (30% to 60% of total). Ghana (GHA) and Bangladesh (BGD) stand out as extreme outliers at opposite ends of the index score spectrum. Although both are lower-middle income and factor-driven economies, women thrive as business owners for different reasons.
In Ghana (GHA), women’s business ownership is the highest (46.4%) with a very clear lead ahead of all its peers and Russia (RUS) in 2nd place (34.6%). Ghana’s overall index score (61.5, rank 33) is healthy, spurred by high engagement of women in entrepreneurship and the labor force relative to men (100.0 and 96.1, respectively). In fact, women and youth here are spearheading business creation, especially in hospitality and retail (58%), agricultural (22%) and government services (15%) sectors. Results from GEM’s 2012 study spanning 69 markets revealed Ghana as one of 4 markets to have more female new entrepreneurs (38%) than males (35%).15 This is also driven by positive elements such as very high regard for business as a career choice (81.6%) and high status accorded to entrepreneurs (94.1%). These businesses typically take the form of self-employment and tend to be necessity-driven as opposed to opportunity-driven. Uganda (UGA) is quite similar to Ghana, although with lower women business ownership and a lower overall Index score.
miwe 2018 54 miwe 2018 54
3.0 Expectations of Women’s Progress as Business Owners
In Bangladesh (BGD), women’s conditions and outcomes of entrepreneurship are quite different from those in Ghana. Although female’s engagement as business owners is quite high (25.9%), the overall index score and ranking are the lowest (35.1, rank 57), weighed down by acutely poor opportunities related to women financial inclusion, business leadership and professional/technical positions, women tertiary education GER, as well as poor supporting conditions for SMEs, quality of governance, and cultural perception of women entrepreneurs.
Other markets that are above the trendline – Russia (RUS), Australia (AUS), Poland (POL), Hungary (HUN), Italy (ITA) – are high/upper-middle income and advanced economies that are mostly innovation - driven.
Women entrepreneurial activities here tend to be driven by more favorable entrepreneurial conditions.
Markets below the MIWE - Benchmark Trendline The Matrix suggests that women business ownership does not necessarily take off in markets with the best Index scores (and supportive entrepreneurial conditions). This is evident in the high-income and developed economies of New Zealand (NZL), Canada (CAN), USA, Sweden (SWE), and Israel (ISR) that reside below the MIWE - Benchmark Trendline. In these markets, the level of women business ownership is lower than expected despite high Index scores, suggesting underlying constraints are restricting women’s advancement in the business world. For instance, the total entrepreneurial activity rate among women in Canada (MIWE ranking of 3) compared to men is lower (80%) due to a lower perception of required skills to launch a business and higher risk aversion. Other constraints include a lack of finance and education for entrepreneurship at the primary and secondary levels.16 Women in top ranking New Zealand are confronted with similar challenges in terms of weak perception of opportunities and capabilities, and fear of business failure.17 In Sweden (rank 3), women’s lack of self-belief in their business capabilities is a key constraint, and appears to be manifested in a high degree of aversion from business risks and low entrepreneurial intentions. They may also be held back by a lack of encouragement and support from society values: successful entrepreneurs and a career as entrepreneurs are comparatively lower here than in most other markets such as New Zealand and the USA.
miwe 2018 55

4.0
miwe 2018 56
Conclusion
4.0
Despite women making marked advances as business owners globally, some deeply entrenched factors such as gender bias are constraining their ability to start or grow
a business
Using Women Business Ownership as the Benchmark indicator of the Mastercard Index of Women Entrepreneurs (MIWE), a positive correlation is observed between the overall index rating and women’s ability
to thrive in the business world. Apart from outliers such as Ghana, Uganda and Bangladesh, markets with high Index scores generally offer the most conducive and supportive conditions that not only drive women’s inclination towards entrepreneurship, but also their capacity to nurture and grow their business start-ups.
They reside at the top of the MIWE, and include: New Zealand, Sweden, Canada, the United States, Singapore, Portugal, Australia, Belgium, Philippines and the United Kingdom. These markets usually have the least degree of gender bias in access to business, academic, economic and financial opportunities and resources. They are
also the most efficient in terms of support structure and confer greater access to resources in the form of funding, training and development. Women in these markets are confronted with significantly less constraints
at the social/cultural level, and receive more trust, recognition, acceptance and encouragement in their roles as business owners/entrepreneurs. They are also better positioned to seek out good business opportunities (as opposed to being necessity-driven). These markets tend to be mostly high-income, innovative and developed
where entrepreneurial activities are usually opportunity-driven as opposed to necessity-driven.
miwe 2018 57
4.0 Conclusion
In contrast, women in markets with lower Index scores tend to exhibit less inclination towards business ownership. This generally occurs in the less wealthy and less developed, factor-driven economies such as Ethiopia, Malawi, Tunisia, India, and Egypt where the underlying conditions for women business ownership/entrepreneurship are less favorable, and the cultural bias against women business owners, leaders or professionals are more pronounced. Women in these economies are also less likely to grow their business, whether locally or overseas, and are more prone than other regions to discontinue their businesses due to unprofitability or lack of finance. The findings reveal the high-income, innovation-driven economies of Saudi Arabia (SAU) and the UAE to be among the unique cases. Although women here are among the most educated, their engagement in businesses is very low. However, those who do become business owners are more likely than others to grow their businesses over the next 5 years.
The results reveal incidences of gender disparities in all markets, but in different ways. In top ranking New Zealand and the United States (rank 4) where the support for SMEs, quality of governance and ease of doing business are rated most favorably, women are marginalized when it comes to exposure to good business opportunities and being perceived as having the same level of know-how as men. In Portugal, women are not only constrained by a lack of cultural acceptance, but difficulties in getting bank loans, insurance, or trade finance. In Belgium where some of the most conducive conditions for nurturing women’s entrepreneurship are found, women tend to be less well-regarded and accepted by society. It is ironic to note that although Ghana (one of the 3 newly added markets) has the highest women business ownership (46.4%), women entrepreneurs are not as well-received by society as men despite them being the sole breadwinners and backbone in their families most of the time.
The results suggest that some indicators appear to have a more positive impact in driving women business ownership than others. These include ‘Support for SMEs’, ‘Cultural Perception of Women Entrepreneurs’, ‘Entrepreneurial Supportive Factors’ and ‘Quality of Governance’. Findings from various studies such as GEM also reveal that in some cases, women’s success are driven by very unique factors at the personal level, such as sheer determination to succeed, higher appetite for risks, desire for greater financial independence/higher income, high entrepreneurial drive, or pursuit for a different or better lifestyle. These enabling conditions are observed in the higher-income and innovation-driven economies such as New Zealand, Australia, United States, China, Hong Kong and Singapore.
In general, although women are making notable inroads as business owners around the world, some challenges remain protracted and deeply ingrained that are constraining women’s ability to not only start businesses, but to bring them to higher levels of growth and sustenance, and to international grounds. In order to unleash the full potential of women, changes need to be invoked not just within the society, but at the economic, financial and political levels to eradicate gender devaluation. More marketing efforts need to be made at both the institutional and personal levels to bolster and deepen women’s understanding of business and investment/financial know-how so their perception of capabilities and opportunities may be enhanced.
miwe 2018 58
5.0
miwe 2018 59 miwe 2018 59
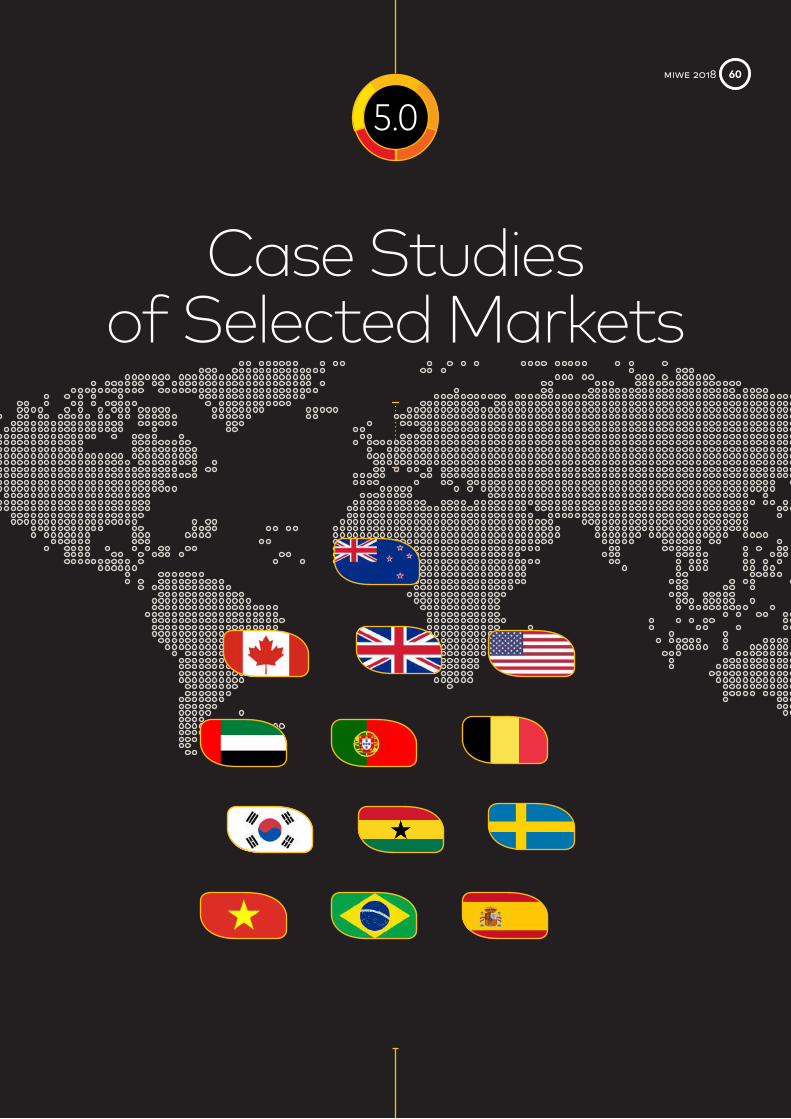
Case Studies of Selected Markets
5.0 miwe 2018 60 miwe 2018 60
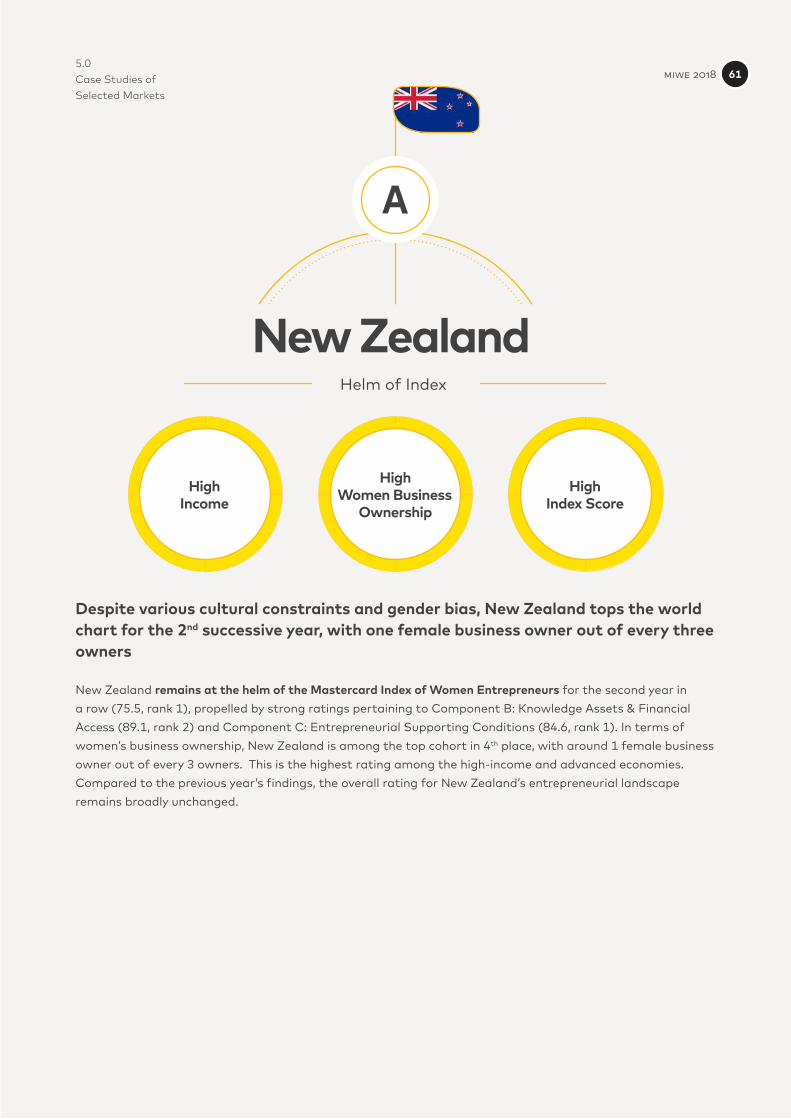
5.0 Case Studies of Selected Markets
Despite various cultural constraints and gender bias, New Zealand tops the world chart for the 2nd successive year, with one female business owner out of every three owners
New Zealand remains at the helm of the Mastercard Index of Women Entrepreneurs for the second year in a row (75.5, rank 1), propelled by strong ratings pertaining to Component B: Knowledge Assets & Financial Access (89.1, rank 2) and Component C: Entrepreneurial Supporting Conditions (84.6, rank 1). In terms of women’s business ownership, New Zealand is among the top cohort in 4th place, with around 1 female business owner out of every 3 owners. This is the highest rating among the high-income and advanced economies. Compared to the previous year’s findings, the overall rating for New Zealand’s entrepreneurial landscape remains broadly unchanged.
New ZealandHelm of Index
A
HighIncome
HighWomen Business
Ownership
HighIndex Score
miwe 2018 61
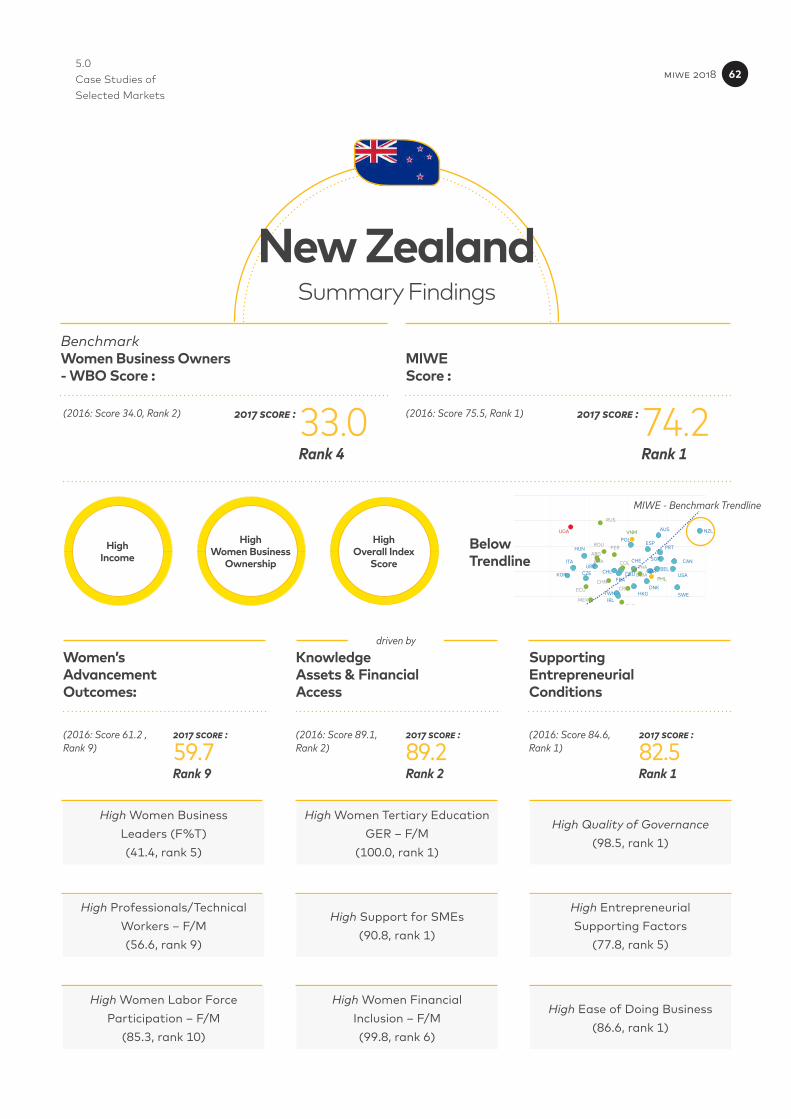
5.0 Case Studies of Selected Markets
RUS
UGA
BGD
GHA
AUS
HKG
JPN
KOR
NZL
SGP
TWN
BELCZE
DNKFRA
DEU
HUN
IRL
ITA
POLPRT
ESP
SWE
CHE
GBRCHLURY
ISR
SAU ARE
CAN
USACHN
MYS
THA
ROU
TUR
ARGBRA COL
CRIECU
MEX
PER
DZAIRN
BWA
ZAF
IDN
PHL
EGY
TUNIND
VNM
NGA
ETH
MWIWomen’sAdvancementOutcomes:
BelowTrendline
KnowledgeAssets & FinancialAccess
SupportingEntrepreneurial Conditions
MIWEScore :
BenchmarkWomen Business Owners- WBO Score :
Rank 9
Rank 4 Rank 1
Rank 2 Rank 1
2017 score :
2017 score : 2017 score :
(2016: Score 61.2 , Rank 9)
(2016: Score 34.0, Rank 2) (2016: Score 75.5, Rank 1)
2017 score : 2017 score :(2016: Score 89.1, Rank 2)
(2016: Score 84.6, Rank 1)
New ZealandSummary Findings
59.7
33.0 74.2
89.2 82.5
HighIncome
HighWomen Business
Ownership
HighOverall Index
Score
High Women BusinessLeaders (F%T)(41.4, rank 5)
High Women Tertiary Education GER – F/M
(100.0, rank 1)
High Quality of Governance(98.5, rank 1)
High Professionals/Technical Workers – F/M(56.6, rank 9)
High Support for SMEs(90.8, rank 1)
High Entrepreneurial Supporting Factors
(77.8, rank 5)
High Women Labor Force Participation – F/M
(85.3, rank 10)
High Women FinancialInclusion – F/M(99.8, rank 6)
High Ease of Doing Business(86.6, rank 1)
driven by
MIWE - Benchmark Trendline
miwe 2018 62
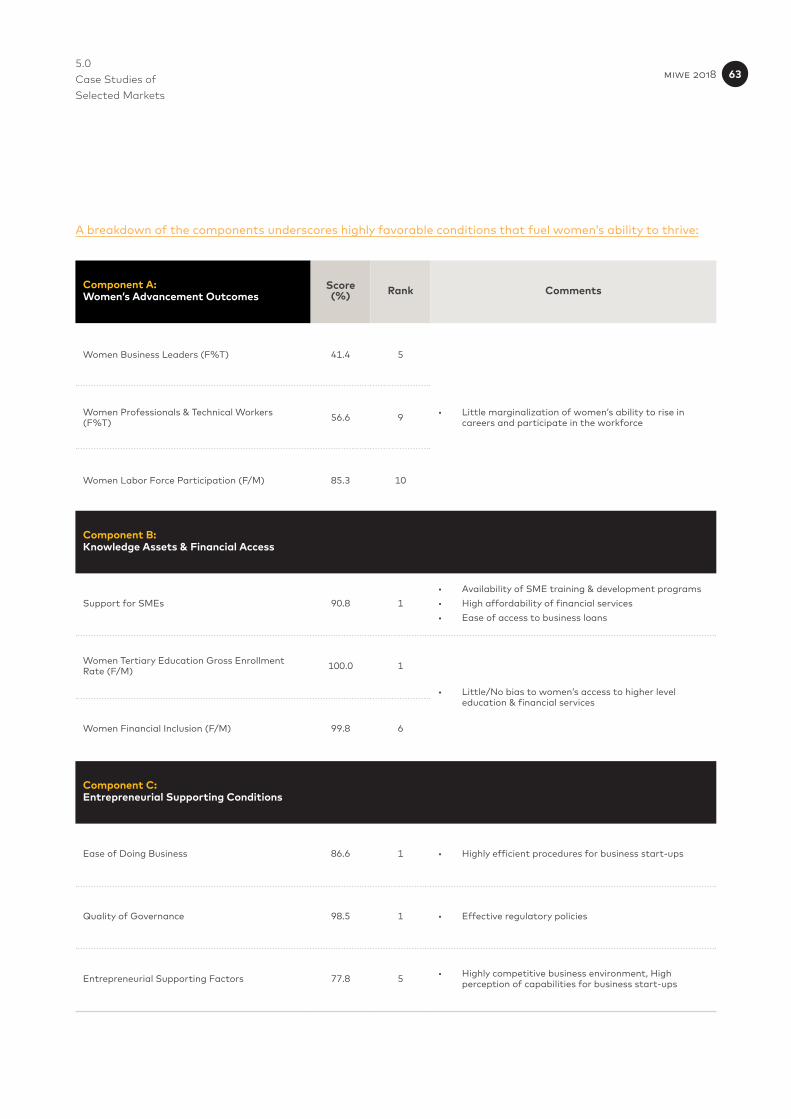
5.0 Case Studies of Selected Markets
A breakdown of the components underscores highly favorable conditions that fuel women’s ability to thrive:
Component A:Women’s Advancement Outcomes
Score (%) Rank Comments
Women Business Leaders (F%T) 41.4 5
• Little marginalization of women’s ability to rise in careers and participate in the workforce
Women Professionals & Technical Workers (F%T) 56.6 9
Women Labor Force Participation (F/M) 85.3 10
Component B:Knowledge Assets & Financial Access
Support for SMEs 90.8 1• Availability of SME training & development programs• High affordability of financial services• Ease of access to business loans
Women Tertiary Education Gross Enrollment Rate (F/M) 100.0 1
• Little/No bias to women’s access to higher level education & financial services
Women Financial Inclusion (F/M) 99.8 6
Component C:Entrepreneurial Supporting Conditions
Ease of Doing Business 86.6 1 • Highly efficient procedures for business start-ups
Quality of Governance 98.5 1 • Effective regulatory policies
Entrepreneurial Supporting Factors 77.8 5 • Highly competitive business environment, High perception of capabilities for business start-ups
miwe 2018 63
5.0 Case Studies of Selected Markets
Unique Internal Dynamics & Market Forces
The results reveal unique driving forces that are fueling women entrepreneurs’ ability to thrive on a global scale in spite of a myriad of challenges and constraints. Compared to their global peers, New Zealand women’s inclination to engage in entrepreneurial activities relative to men is lower (‘Women Entrepreneurial Activity Rate - F/M’ 63.5, rank 32). This suggests that for every 100 males undertaking some entrepreneurial activity, there are only 63.5 females doing the same. This ratio is unexpectedly low compared to other markets such as Australia (70.0), Spain (80.0), Sweden (70.0), Saudi Arabia (80.0), Malaysia (90.0), Russia (80.0), Argentina (80.0), Mexico (100.0) and Brazil (100.0). The results also show society being less receptive of female entrepreneurs. This is evident in the low ratings for ‘Cultural Perception of Women Entrepreneurs’ (70.0, rank 19) and the sub-indicators:
• ‘Social encouragement of female entrepreneurship’: 56.8, rank 39
• ‘Gender bias in exposure to good business opportunities’: 62.2, rank 32
• ‘Gender bias in entrepreneurial knowledge and skills’: 75.3, rank 30
In terms of the underlying entrepreneurial supporting conditions, there are also some shortcomings:
• A lack of government programs geared towards supporting new and growing business: 56.6, rank 32
• Start-up opportunities for new businesses: 73.0, rank 37
• Low social acceptance of entrepreneurship as a desirable career: 59.0, rank 39
• Lower-than-expected level of national encouragement of entrepreneurial risk-taking: 55.2, rank 24
OECD’s findings based on Labor Force Surveys reveal gender bias in terms of rewards for entrepreneurship: Women in New Zealand engaged in entrepreneurial activities command 32% less pay/income than their male counterparts.18
These constraints help explain why New Zealand is below the MIWE - Benchmark Trendline, and underperforming in terms of women’s progress as business owners.
miwe 2018 64
5.0 Case Studies of Selected Markets
Pure Drive & Ambition, Desire to Diverge from Corporate Lifestyle
Yet, in spite of the various cultural constraints and gender bias, women in New Zealand are able to rise above these challenges and emerge as one of the most highly represented female entrepreneurs in the world. This is likely driven by their pure drive and passion when in pursuit of business opportunities, and the desire and ambition to succeed in becoming financially stronger, more independent, or to seek a better quality of life. In some cases, this could be driven by a desire to diverge from the corporate lifestyle that may be no longer suitable for women, especially those with children. This is reflected in the fact that New Zealand is ranked among the highest in terms of ‘Female Opportunity-driven Entrepreneurial Activity as a % of Female TEA’ (89.0, rank 6). OECD’s findings (2013) reveal nearly half the population of women (47%) expressing a preference for starting their own business rather than working for someone else. More interestingly, although society’s perception of female entrepreneurs is poor, a vast majority of women (around 80%) see entrepreneurs as positive role models.19
miwe 2018 65 miwe 2018 65
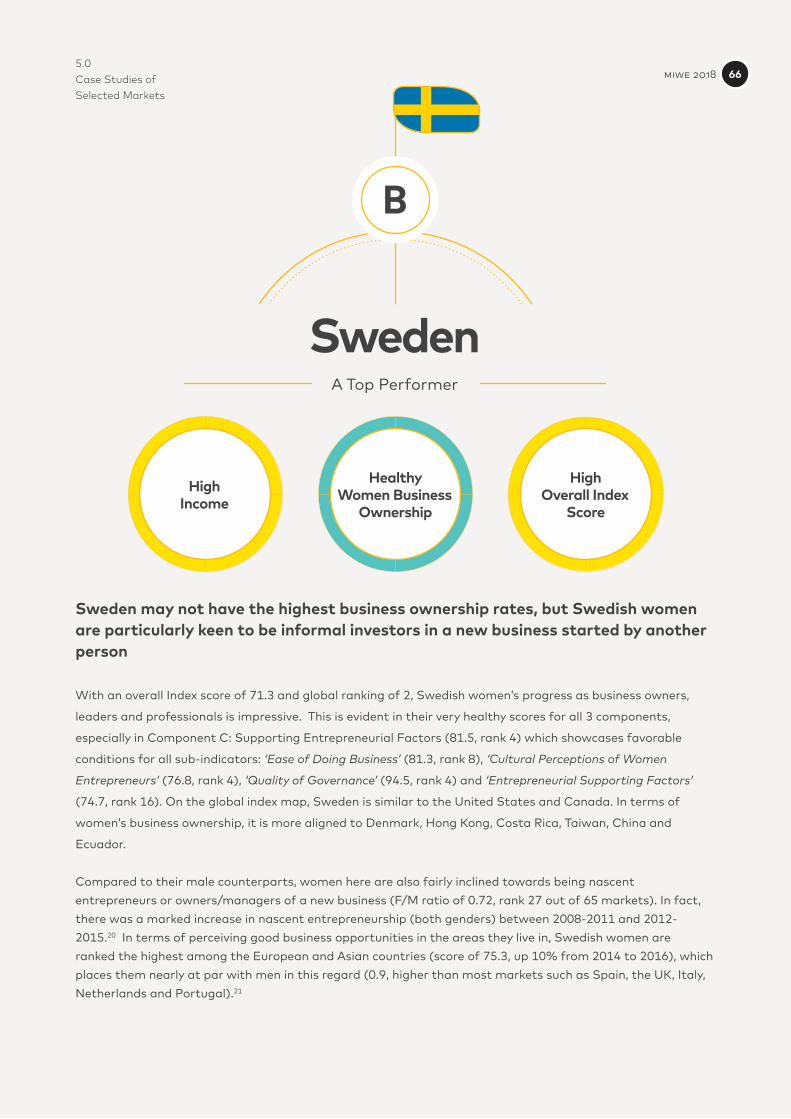
5.0 Case Studies of Selected Markets
Sweden may not have the highest business ownership rates, but Swedish women are particularly keen to be informal investors in a new business started by another person
With an overall Index score of 71.3 and global ranking of 2, Swedish women’s progress as business owners,
leaders and professionals is impressive. This is evident in their very healthy scores for all 3 components,
especially in Component C: Supporting Entrepreneurial Factors (81.5, rank 4) which showcases favorable
conditions for all sub-indicators: ‘Ease of Doing Business’ (81.3, rank 8), ‘Cultural Perceptions of Women
Entrepreneurs’ (76.8, rank 4), ‘Quality of Governance’ (94.5, rank 4) and ‘Entrepreneurial Supporting Factors’
(74.7, rank 16). On the global index map, Sweden is similar to the United States and Canada. In terms of
women’s business ownership, it is more aligned to Denmark, Hong Kong, Costa Rica, Taiwan, China and
Ecuador.
Compared to their male counterparts, women here are also fairly inclined towards being nascent entrepreneurs or owners/managers of a new business (F/M ratio of 0.72, rank 27 out of 65 markets). In fact, there was a marked increase in nascent entrepreneurship (both genders) between 2008-2011 and 2012-2015.20 In terms of perceiving good business opportunities in the areas they live in, Swedish women are ranked the highest among the European and Asian countries (score of 75.3, up 10% from 2014 to 2016), which places them nearly at par with men in this regard (0.9, higher than most markets such as Spain, the UK, Italy, Netherlands and Portugal).21
SwedenA Top Performer
B
HighIncome
Healthy Women Business
Ownership
HighOverall Index
Score
miwe 2018 66
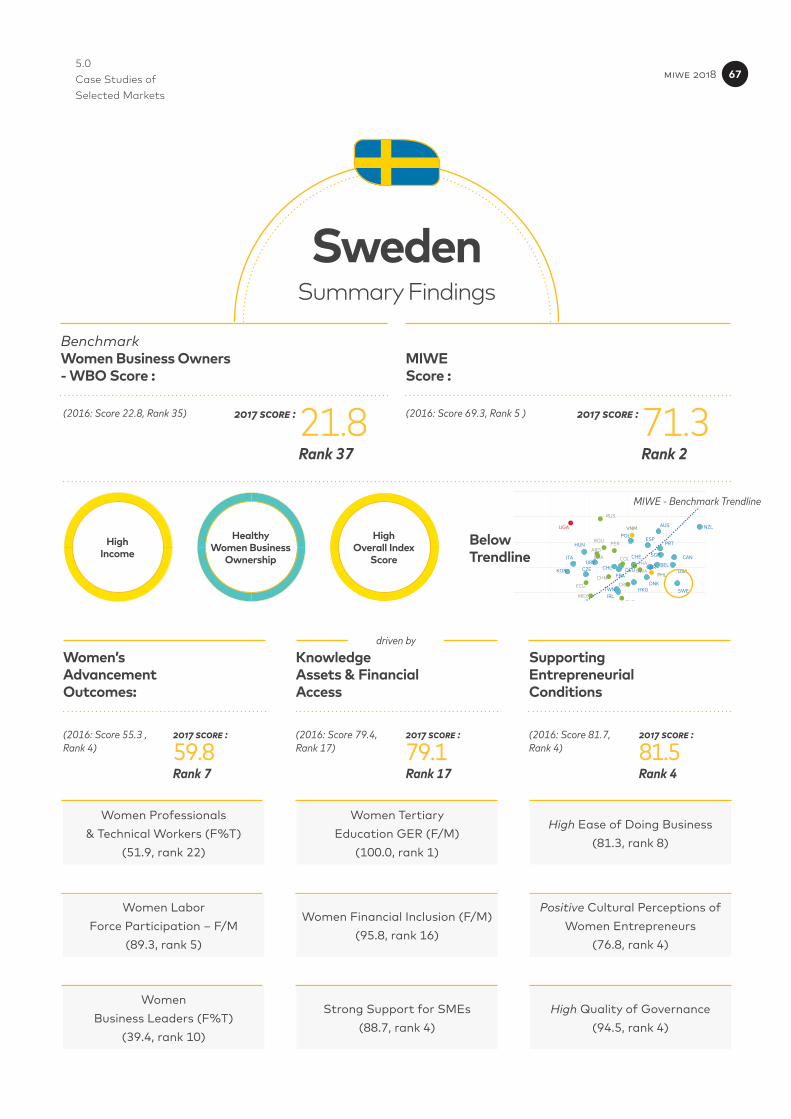
5.0 Case Studies of Selected Markets
Women’sAdvancementOutcomes:
KnowledgeAssets & FinancialAccess
SupportingEntrepreneurial Conditions
Rank 7 Rank 17 Rank 4
2017 score :(2016: Score 55.3 , Rank 4)
2017 score : 2017 score :(2016: Score 79.4, Rank 17)
(2016: Score 81.7, Rank 4)
SwedenSummary Findings
59.8 79.1 81.5
HighIncome
Healthy Women Business
Ownership
HighOverall Index
Score
Women Professionals& Technical Workers (F%T)
(51.9, rank 22)
Women TertiaryEducation GER (F/M)
(100.0, rank 1)
High Ease of Doing Business(81.3, rank 8)
Women LaborForce Participation – F/M
(89.3, rank 5)
Women Financial Inclusion (F/M)(95.8, rank 16)
Positive Cultural Perceptions of Women Entrepreneurs
(76.8, rank 4)
Women Business Leaders (F%T)
(39.4, rank 10)
Strong Support for SMEs(88.7, rank 4)
High Quality of Governance(94.5, rank 4)
RUS
UGA
BGD
GHA
AUS
HKG
JPN
KOR
NZL
SGP
TWN
BELCZE
DNKFRA
DEU
HUN
IRL
ITA
POLPRT
ESP
SWE
CHE
GBRCHLURY
ISR
SAU ARE
CAN
USACHN
MYS
THA
ROU
TUR
ARGBRA COL
CRIECU
MEX
PER
DZAIRN
BWA
ZAF
IDN
PHL
EGY
TUNIND
VNM
NGA
ETH
MWI
BelowTrendline
driven by
MIWE - Benchmark Trendline
MIWEScore :
BenchmarkWomen Business Owners- WBO Score :
Rank 37 Rank 2
2017 score : 2017 score :(2016: Score 22.8, Rank 35) (2016: Score 69.3, Rank 5 )21.8 71.3
miwe 2018 67
5.0 Case Studies of Selected Markets
In Component A: Women’s Advancement Outcomes, their high representation as ‘Women Business Leaders - F%T’ (39.4%) and ‘Women Professionals & Technical Workers - F%T’ (51.9%) places them in 7th place, surpassing all other high-income and developed markets such as the US, New Zealand, Canada and Australia.
Strengths & Opportunities
It is interesting to note that although Swedish women’s representation as business owners is not among the highest, they are particularly keen in investing in a new business started by someone else, and are nearly as likely as men to become such informal investors (0.73 compared to 0.44 in Romania, 0.54 in Poland, 0.58 in Finland, 0.52 in Germany, 0.41 in the UK and 0.38 in Norway). In fact, they are 2.5 times more inclined to invest in a business initiated by a family or relative.22
Deterrents
GEM’s Global Report revealed that although Swedish women have a keen eye on business opportunities, there is a lack of self-confidence in terms of whether they have the required skills to start a firm (Female Capability Perceptions of 26.4, among lowest). For every 10 men who believe they are capable, there are only 6 women (lowest in Europe and Asia). This also explains the relatively low entrepreneurial intention among women to start a business over the next 3 years. Other factors that may be restricting women’s ability to thrive in business include: (i) high degree of fear of failure in business start-ups (40.8%), (ii) low status awarded to successful entrepreneurs, and (iii) low societal value for entrepreneurship as a good career choice (53.6%, similar to Germany and other Nordic countries such as Denmark, Finland and Norway).
miwe 2018 68
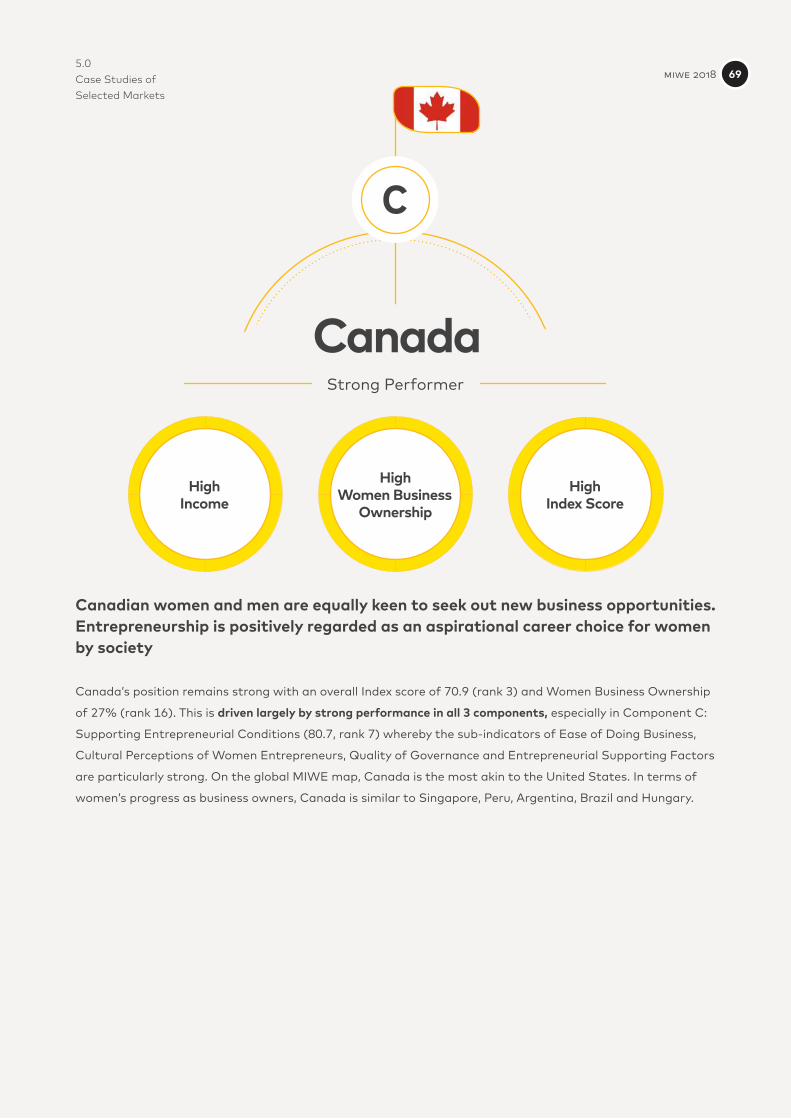
5.0 Case Studies of Selected Markets
Canadian women and men are equally keen to seek out new business opportunities. Entrepreneurship is positively regarded as an aspirational career choice for women by society
Canada’s position remains strong with an overall Index score of 70.9 (rank 3) and Women Business Ownership
of 27% (rank 16). This is driven largely by strong performance in all 3 components, especially in Component C:
Supporting Entrepreneurial Conditions (80.7, rank 7) whereby the sub-indicators of Ease of Doing Business,
Cultural Perceptions of Women Entrepreneurs, Quality of Governance and Entrepreneurial Supporting Factors
are particularly strong. On the global MIWE map, Canada is the most akin to the United States. In terms of
women’s progress as business owners, Canada is similar to Singapore, Peru, Argentina, Brazil and Hungary.
CanadaStrong Performer
C
HighIncome
HighWomen Business
Ownership
HighIndex Score
miwe 2018 69
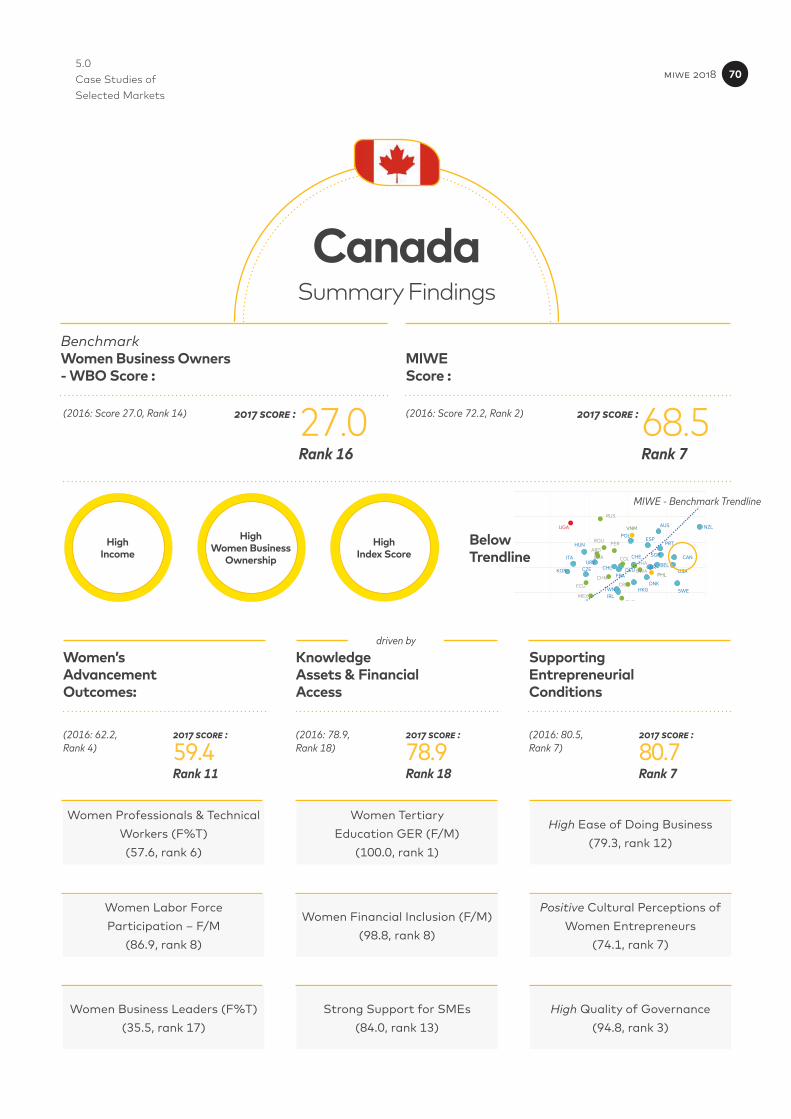
5.0 Case Studies of Selected Markets
Women’sAdvancementOutcomes:
KnowledgeAssets & FinancialAccess
SupportingEntrepreneurial Conditions
Women Professionals & Technical Workers (F%T)(57.6, rank 6)
Women TertiaryEducation GER (F/M)
(100.0, rank 1)
High Ease of Doing Business(79.3, rank 12)
Women Labor ForceParticipation – F/M
(86.9, rank 8)
Women Financial Inclusion (F/M)(98.8, rank 8)
Positive Cultural Perceptions of Women Entrepreneurs
(74.1, rank 7)
Women Business Leaders (F%T)(35.5, rank 17)
Strong Support for SMEs(84.0, rank 13)
High Quality of Governance(94.8, rank 3)
Rank 11 Rank 18 Rank 7
2017 score :(2016: 62.2, Rank 4)
2017 score : 2017 score :(2016: 78.9, Rank 18)
(2016: 80.5,Rank 7)
CanadaSummary Findings
59.4 78.9 80.7
HighIncome
HighWomen Business
Ownership
HighIndex Score
RUS
UGA
BGD
GHA
AUS
HKG
JPN
KOR
NZL
SGP
TWN
BELCZE
DNKFRA
DEU
HUN
IRL
ITA
POLPRT
ESP
SWE
CHE
GBRCHLURY
ISR
SAU ARE
CAN
USACHN
MYS
THA
ROU
TUR
ARGBRA COL
CRIECU
MEX
PER
DZAIRN
BWA
ZAF
IDN
PHL
EGY
TUNIND
VNM
NGA
ETH
MWI
BelowTrendline
driven by
MIWE - Benchmark Trendline
MIWEScore :
BenchmarkWomen Business Owners- WBO Score :
Rank 16 Rank 7
2017 score : 2017 score :(2016: Score 27.0, Rank 14) (2016: Score 72.2, Rank 2)27.0 68.5
miwe 2018 70
5.0 Case Studies of Selected Markets
The results from Component A: Women’s Advancement Outcomes shows Canadian women having strong representation in ‘Women Business Leaders’ (35.6% of total), ‘Women Professionals/Technical Workers’ (57.6% of total) and ‘Labor Force Participation Rate - F/M’ (86.9). They are also fairly driven towards Entrepreneurial Activity compared to men (70.0, down from 84.3 in 2015) and are mostly motivated by the desire to improve oneself, gain independence and to increase income.23
Strengths & Opportunities
GEM’s latest report on Canada (2016) found the most favorable conditions to reside in the country’s physical and commercial infrastructure, and underlying social and cultural norms. This is reflected in the high scores for the sub-indicators for Component B: Knowledge Assets and Financial Access - ‘Women Financial Inclusion - F/M’ (98.8), ‘Support for SMEs’ (84.1) and ‘Women Tertiary Education GER- F/M’ (100.0). Canada also boasts very strong ratings in Component C: Supporting Entrepreneurial Conditions, especially in terms of ‘Ease of Doing Business’ (79.3), ‘Cultural Perceptions of Women Entrepreneurs’ (74.1), ‘Quality of Governance’ (94.8) and ‘Entrepreneurial Supporting Factors’ (76.2). Specifically, successful entrepreneurs and entrepreneurships as a good career choice in Canada are positively regarded by society, and are well publicized and celebrated in social media. The ratings for these indicators compare favorably with other leading markets such as the US, Australia, the UK, France and Germany.24
It is noteworthy to point out that although the ‘Women Entrepreneurial Activity Rate - F/M’ declined (down from 84.3% to 70.0% in 2016), women maintain a relatively positive and strong mindset when it comes to Capability Perception and being Undeterred by Fear of Failure. This is evident in the narrow gender divide for the 2 indicators measured by GEM (2016): Ratio F/M Capability Perception of 0.7 and Ratio F/M Undeterred by Business Failure of 0.9 in 2014 compared to 1.0 for 2016.25 Canadian women and men are also equally ambitious and enthusiastic when it comes to seeking out business opportunities: Ratio F/M Opportunity Perceptions unchanged at 1.0 in both 2014 and 2016 (GEM Global Report 2016-17).
Constraints
However, GEM’s study pinpointed a lack of education geared towards entrepreneurship at the pre-tertiary levels and lack of finance as key constraints to women’s ability to thrive as business owners.26 Compared to their male counterparts, Canadian women are less confident when it comes to perception of skills required to start a business (42.9% vs. 63.1% for men). They are also less inclined to exploit and adopt latest technology, and are more driven towards consumer-oriented services.27
miwe 2018 71
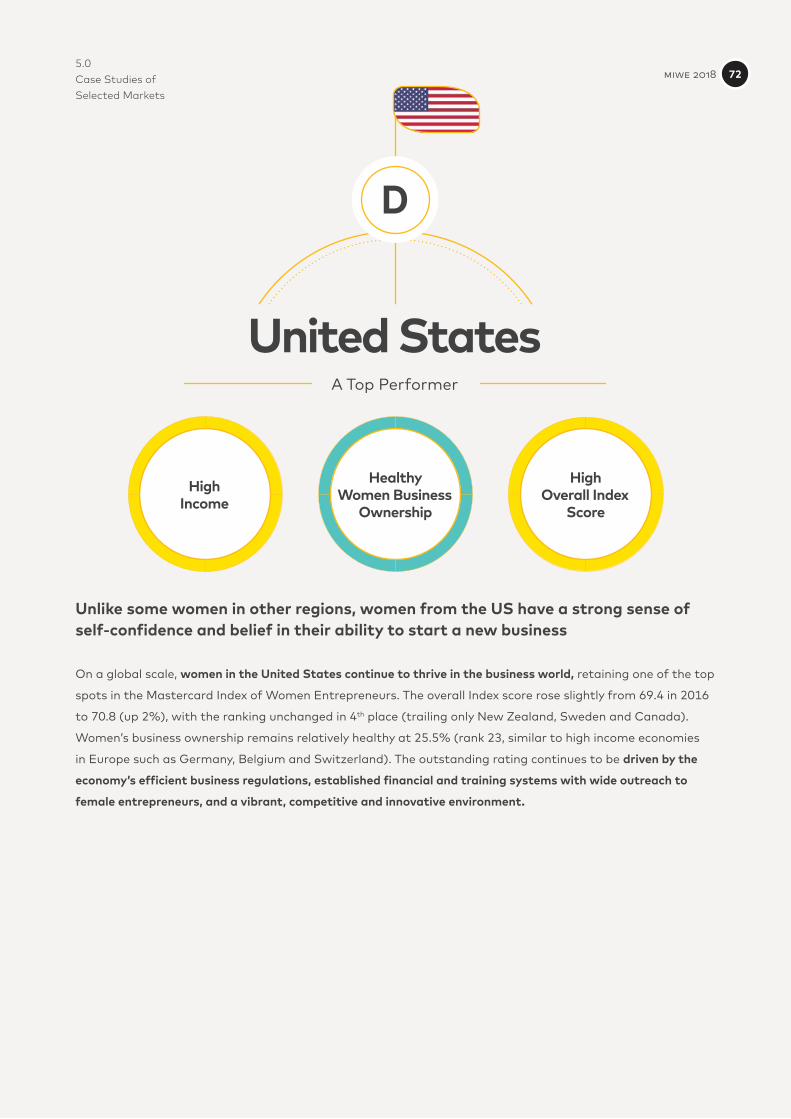
5.0 Case Studies of Selected Markets
Unlike some women in other regions, women from the US have a strong sense of self-confidence and belief in their ability to start a new business
On a global scale, women in the United States continue to thrive in the business world, retaining one of the top
spots in the Mastercard Index of Women Entrepreneurs. The overall Index score rose slightly from 69.4 in 2016
to 70.8 (up 2%), with the ranking unchanged in 4th place (trailing only New Zealand, Sweden and Canada).
Women’s business ownership remains relatively healthy at 25.5% (rank 23, similar to high income economies
in Europe such as Germany, Belgium and Switzerland). The outstanding rating continues to be driven by the
economy’s efficient business regulations, established financial and training systems with wide outreach to
female entrepreneurs, and a vibrant, competitive and innovative environment.
United StatesA Top Performer
D
HighIncome
Healthy Women Business
Ownership
HighOverall Index
Score
miwe 2018 72
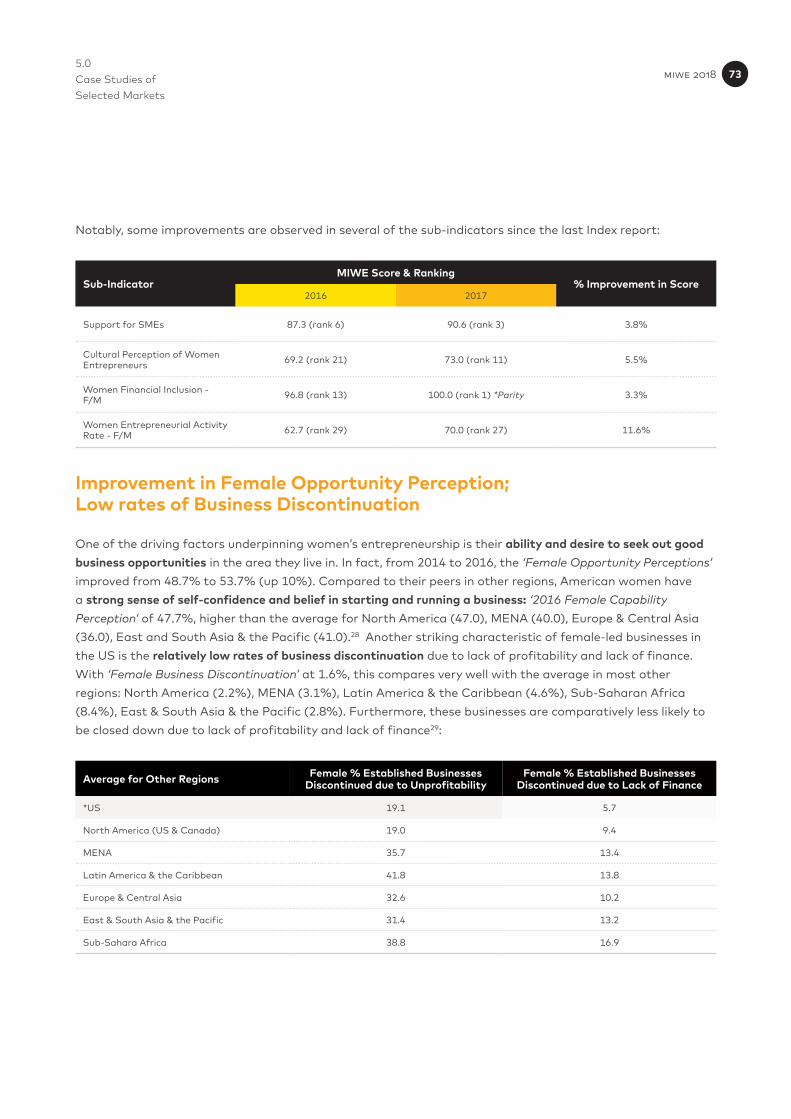
5.0 Case Studies of Selected Markets
Sub-IndicatorMIWE Score & Ranking
% Improvement in Score2016 2017
Support for SMEs 87.3 (rank 6) 90.6 (rank 3) 3.8%
Cultural Perception of Women Entrepreneurs 69.2 (rank 21) 73.0 (rank 11) 5.5%
Women Financial Inclusion - F/M 96.8 (rank 13) 100.0 (rank 1) *Parity 3.3%
Women Entrepreneurial Activity Rate - F/M 62.7 (rank 29) 70.0 (rank 27) 11.6%
Improvement in Female Opportunity Perception; Low rates of Business Discontinuation
One of the driving factors underpinning women’s entrepreneurship is their ability and desire to seek out good business opportunities in the area they live in. In fact, from 2014 to 2016, the ‘Female Opportunity Perceptions’ improved from 48.7% to 53.7% (up 10%). Compared to their peers in other regions, American women have a strong sense of self-confidence and belief in starting and running a business: ‘2016 Female Capability Perception’ of 47.7%, higher than the average for North America (47.0), MENA (40.0), Europe & Central Asia (36.0), East and South Asia & the Pacific (41.0).28 Another striking characteristic of female-led businesses in the US is the relatively low rates of business discontinuation due to lack of profitability and lack of finance. With ‘Female Business Discontinuation’ at 1.6%, this compares very well with the average in most other regions: North America (2.2%), MENA (3.1%), Latin America & the Caribbean (4.6%), Sub-Saharan Africa (8.4%), East & South Asia & the Pacific (2.8%). Furthermore, these businesses are comparatively less likely to be closed down due to lack of profitability and lack of finance29:
Average for Other Regions Female % Established Businesses Discontinued due to Unprofitability
Female % Established Businesses Discontinued due to Lack of Finance
*US 19.1 5.7
North America (US & Canada) 19.0 9.4
MENA 35.7 13.4
Latin America & the Caribbean 41.8 13.8
Europe & Central Asia 32.6 10.2
East & South Asia & the Pacific 31.4 13.2
Sub-Sahara Africa 38.8 16.9
Notably, some improvements are observed in several of the sub-indicators since the last Index report:
miwe 2018 73
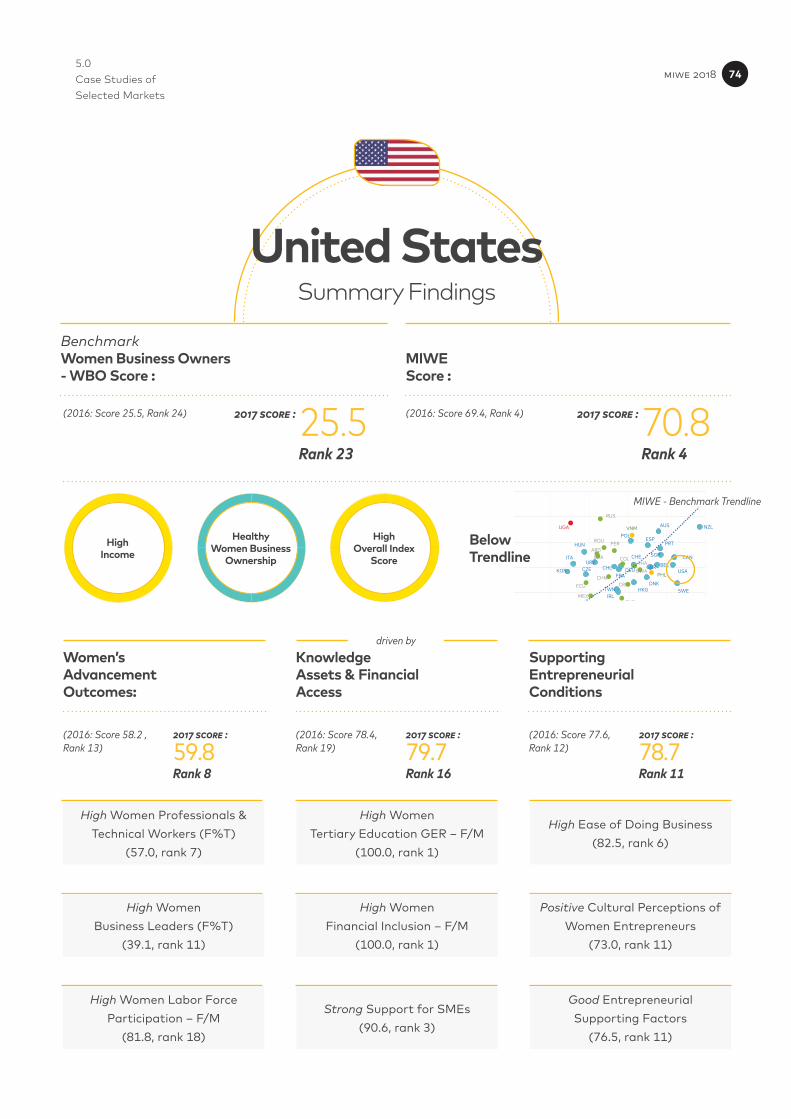
5.0 Case Studies of Selected Markets
Women’sAdvancementOutcomes:
KnowledgeAssets & FinancialAccess
SupportingEntrepreneurial Conditions
High Women Professionals & Technical Workers (F%T)
(57.0, rank 7)
High WomenTertiary Education GER – F/M
(100.0, rank 1)
High Ease of Doing Business(82.5, rank 6)
High WomenBusiness Leaders (F%T)
(39.1, rank 11)
High WomenFinancial Inclusion – F/M
(100.0, rank 1)
Positive Cultural Perceptions of Women Entrepreneurs
(73.0, rank 11)
High Women Labor Force Participation – F/M
(81.8, rank 18)
Strong Support for SMEs(90.6, rank 3)
Good EntrepreneurialSupporting Factors
(76.5, rank 11)
Rank 8 Rank 16 Rank 11
2017 score :(2016: Score 58.2 , Rank 13)
2017 score : 2017 score :(2016: Score 78.4, Rank 19)
(2016: Score 77.6, Rank 12)
United StatesSummary Findings
59.8 79.7 78.7
HighIncome
Healthy Women Business
Ownership
HighOverall Index
Score
RUS
UGA
BGD
GHA
AUS
HKG
JPN
KOR
NZL
SGP
TWN
BELCZE
DNKFRA
DEU
HUN
IRL
ITA
POLPRT
ESP
SWE
CHE
GBRCHLURY
ISR
SAU ARE
CAN
USACHN
MYS
THA
ROU
TUR
ARGBRA COL
CRIECU
MEX
PER
DZAIRN
BWA
ZAF
IDN
PHL
EGY
TUNIND
VNM
NGA
ETH
MWI
BelowTrendline
driven by
MIWE - Benchmark Trendline
MIWEScore :
BenchmarkWomen Business Owners- WBO Score :
Rank 23 Rank 4
2017 score : 2017 score :(2016: Score 25.5, Rank 24) (2016: Score 69.4, Rank 4)25.5 70.8
miwe 2018 74
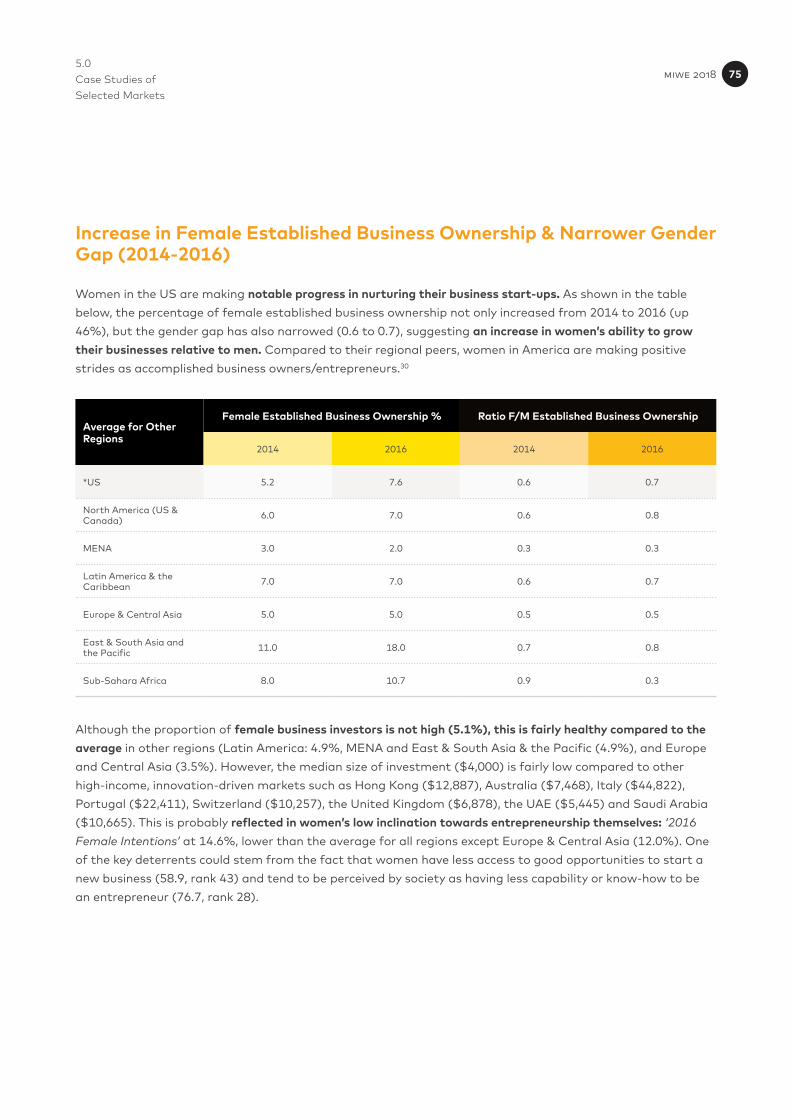
5.0 Case Studies of Selected Markets
Increase in Female Established Business Ownership & Narrower Gender Gap (2014-2016)
Women in the US are making notable progress in nurturing their business start-ups. As shown in the table below, the percentage of female established business ownership not only increased from 2014 to 2016 (up 46%), but the gender gap has also narrowed (0.6 to 0.7), suggesting an increase in women’s ability to grow their businesses relative to men. Compared to their regional peers, women in America are making positive strides as accomplished business owners/entrepreneurs.30
Average for Other Regions
Female Established Business Ownership % Ratio F/M Established Business Ownership
2014 2016 2014 2016
*US 5.2 7.6 0.6 0.7
North America (US & Canada) 6.0 7.0 0.6 0.8
MENA 3.0 2.0 0.3 0.3
Latin America & the Caribbean 7.0 7.0 0.6 0.7
Europe & Central Asia 5.0 5.0 0.5 0.5
East & South Asia and the Pacific 11.0 18.0 0.7 0.8
Sub-Sahara Africa 8.0 10.7 0.9 0.3
Although the proportion of female business investors is not high (5.1%), this is fairly healthy compared to the average in other regions (Latin America: 4.9%, MENA and East & South Asia & the Pacific (4.9%), and Europe and Central Asia (3.5%). However, the median size of investment ($4,000) is fairly low compared to other high-income, innovation-driven markets such as Hong Kong ($12,887), Australia ($7,468), Italy ($44,822), Portugal ($22,411), Switzerland ($10,257), the United Kingdom ($6,878), the UAE ($5,445) and Saudi Arabia ($10,665). This is probably reflected in women’s low inclination towards entrepreneurship themselves: ‘2016 Female Intentions’ at 14.6%, lower than the average for all regions except Europe & Central Asia (12.0%). One of the key deterrents could stem from the fact that women have less access to good opportunities to start a new business (58.9, rank 43) and tend to be perceived by society as having less capability or know-how to be an entrepreneur (76.7, rank 28).
miwe 2018 75
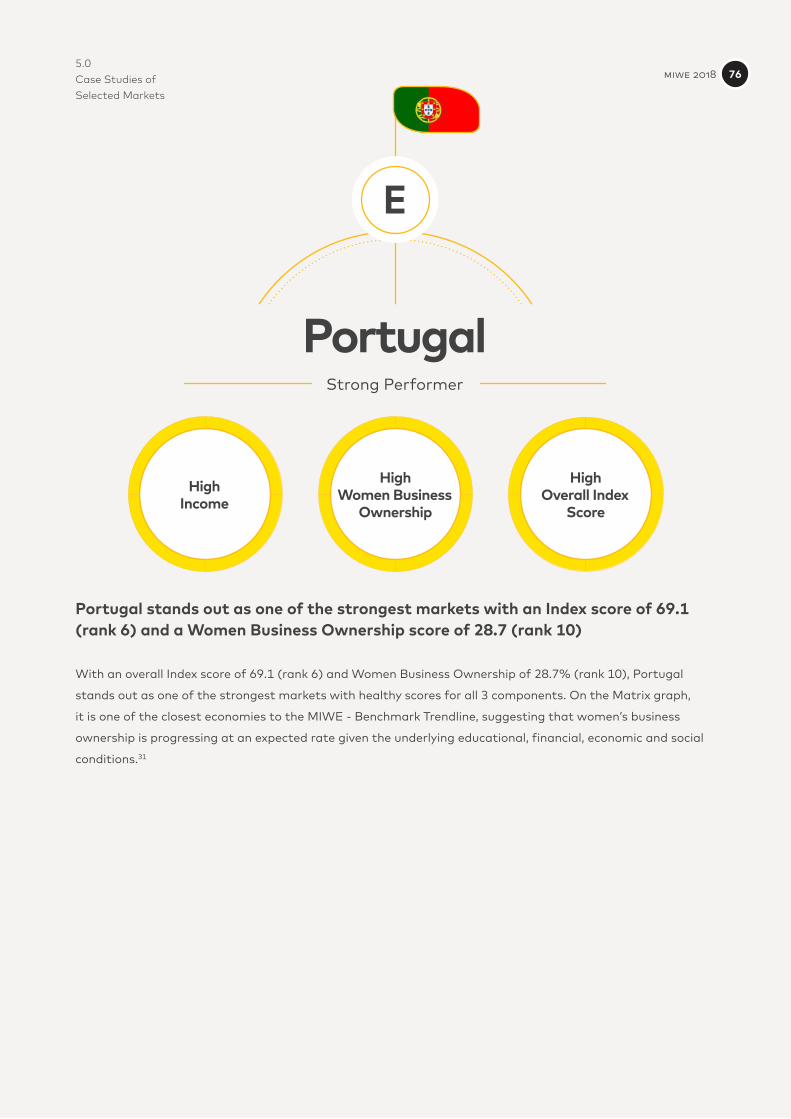
5.0 Case Studies of Selected Markets
Portugal stands out as one of the strongest markets with an Index score of 69.1 (rank 6) and a Women Business Ownership score of 28.7 (rank 10)
With an overall Index score of 69.1 (rank 6) and Women Business Ownership of 28.7% (rank 10), Portugal
stands out as one of the strongest markets with healthy scores for all 3 components. On the Matrix graph,
it is one of the closest economies to the MIWE - Benchmark Trendline, suggesting that women’s business
ownership is progressing at an expected rate given the underlying educational, financial, economic and social
conditions.31
PortugalStrong Performer
E
HighIncome
HighWomen Business
Ownership
HighOverall Index
Score
miwe 2018 76
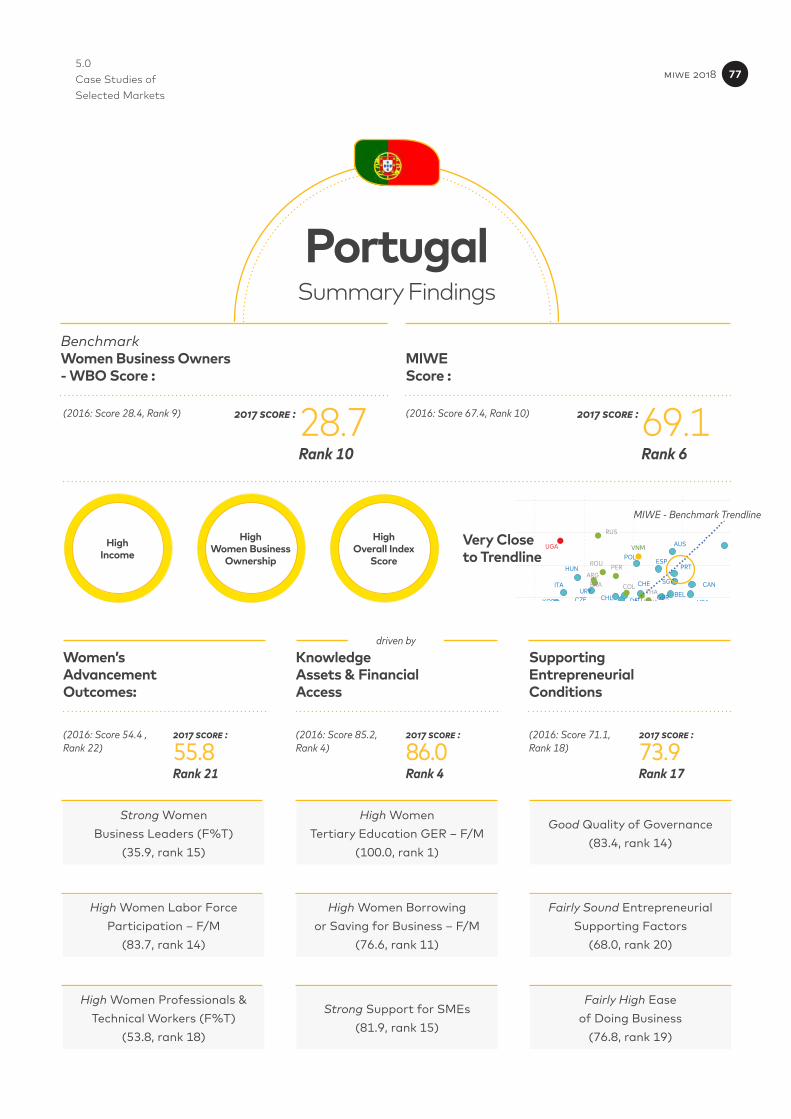
5.0 Case Studies of Selected Markets
Women’sAdvancementOutcomes:
KnowledgeAssets & FinancialAccess
SupportingEntrepreneurial Conditions
Strong WomenBusiness Leaders (F%T)
(35.9, rank 15)
High WomenTertiary Education GER – F/M
(100.0, rank 1)
Good Quality of Governance(83.4, rank 14)
High Women Labor Force Participation – F/M
(83.7, rank 14)
High Women Borrowingor Saving for Business – F/M
(76.6, rank 11)
Fairly Sound Entrepreneurial Supporting Factors
(68.0, rank 20)
High Women Professionals & Technical Workers (F%T)
(53.8, rank 18)
Strong Support for SMEs(81.9, rank 15)
Fairly High Easeof Doing Business
(76.8, rank 19)
Rank 21 Rank 4 Rank 17
2017 score :(2016: Score 54.4 , Rank 22)
2017 score : 2017 score :(2016: Score 85.2, Rank 4)
(2016: Score 71.1, Rank 18)
PortugalSummary Findings
55.8 86.0 73.9
HighIncome
HighWomen Business
Ownership
HighOverall Index
Score
RUS
UGA
BGD
GHA
AUS
HKG
JPN
KOR
NZL
SGP
TWN
BELCZE
DNKFRA
DEU
HUN
IRL
ITA
POLPRT
ESP
SWE
CHE
GBRCHLURY
ISR
SAU ARE
CAN
USACHN
MYS
THA
ROU
TUR
ARGBRA COL
CRIECU
MEX
PER
DZAIRN
BWA
ZAF
IDN
PHL
EGY
TUNIND
VNM
NGA
ETH
MWI
Very Closeto Trendline
driven by
MIWE - Benchmark Trendline
MIWEScore :
BenchmarkWomen Business Owners- WBO Score :
Rank 10 Rank 6
2017 score : 2017 score :(2016: Score 28.4, Rank 9) (2016: Score 67.4, Rank 10)28.7 69.1
miwe 2018 77
5.0 Case Studies of Selected Markets
One of the most outstanding observations of Portuguese women’s progress as business owners and entrepreneurs is that over the 2014-2016 period, their perception of good business opportunities improved notably from 19.5% to 25.7% (‘Female Opportunity Perceptions’). This effectively narrowed the gender divide with their male counterparts from 0.7 in 2014 to 0.8 in 2016. Of those who perceived good business opportunities, more are becoming less deterred by business failures, suggesting an increase in appetite for risks (‘% Change Female Undeterred by Fear of Failure 2014-2016’ up 17% from 47.6 to 55.5).32
Specifically, women exhibit a higher tendency towards micro enterprises than men (similar to the UK, Sweden, Italy, France, Denmark and Belgium).33 Most of these activities are in the Wholesale & Retail (43.7%), Government/Health/Education/Social Services (22.8%) and Financial/Professional/Administration/Customer Services (15.3%) sectors, with ICT having the lowest representation at only 2.3%.
Strengths & Opportunities
The results for Component A: Women’s Advancement Outcomes underscore the strength in Portuguese women’s empowerment in the business world and as economic contributors. At 35.9%, they are ranked 15th among the 57 markets in Mastercard’s index as business leaders. The proportion of women working as professionals and technical workers is also high (53.8% of total, rank 18). This is likely attributed to the high access to tertiary education (‘Women Tertiary Education GER - F/M’ 100.0, rank 1, similar to most European peers). Component B: Knowledge Assets & Financial Access also reveals fairly healthy ‘Support for SMEs’ (81.9, rank 15) and high inclination for ‘Women to Borrow or Save for Business- F/M’ (76.6, rank 11). Portuguese women also benefit from efficient entrepreneurial conditions such as high ‘Ease of Doing Business’ (76.8, rank 19 against 86.6 in New Zealand in top spot), and good ‘Quality of Governance’ (83.4, rank 14, compared to 98.5 in New Zealand).
Another striking characteristic about Portuguese women is that they are 4 times more likely than their male counterparts to invest in a business/entrepreneurial activity. This is the highest across all regions in the GEM 2015-2016 study on Investor Activity.34 Compared to the OECD 2014 average, Portuguese women are ranked among the highest in terms of being self-employed with employees (3%).35
miwe 2018 78
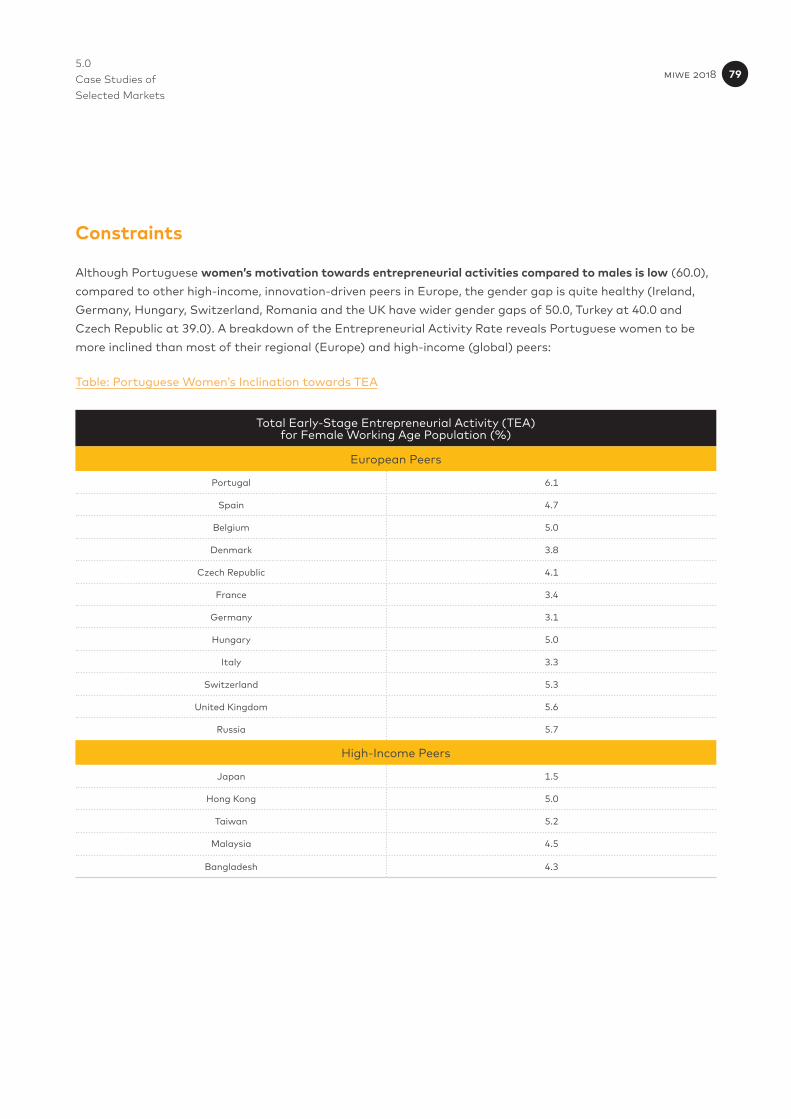
5.0 Case Studies of Selected Markets
Constraints
Although Portuguese women’s motivation towards entrepreneurial activities compared to males is low (60.0), compared to other high-income, innovation-driven peers in Europe, the gender gap is quite healthy (Ireland, Germany, Hungary, Switzerland, Romania and the UK have wider gender gaps of 50.0, Turkey at 40.0 and Czech Republic at 39.0). A breakdown of the Entrepreneurial Activity Rate reveals Portuguese women to be more inclined than most of their regional (Europe) and high-income (global) peers:
Table: Portuguese Women’s Inclination towards TEA
Total Early-Stage Entrepreneurial Activity (TEA)for Female Working Age Population (%)
European Peers
Portugal 6.1
Spain 4.7
Belgium 5.0
Denmark 3.8
Czech Republic 4.1
France 3.4
Germany 3.1
Hungary 5.0
Italy 3.3
Switzerland 5.3
United Kingdom 5.6
Russia 5.7
High-Income Peers
Japan 1.5
Hong Kong 5.0
Taiwan 5.2
Malaysia 4.5
Bangladesh 4.3
miwe 2018 79
5.0 Case Studies of Selected Markets
The low inclination towards entrepreneurial activities could be due to several constraints. For instance, in terms of ‘Support for SMEs’, although women have equal access to financial services (e.g. the ability to open a bank account), and there are financial and SME training programs for women, they face difficulties when it comes to getting a bank loan, insurance and trade finance (‘Ease of Access to Loans’ 52.2, rank 40, and ‘Affordability of Financial Services’ 57.3, rank 32). A study on 5 female Portuguese entrepreneurs in Sao Paolo in 2012 revealed all 5 necessity-driven businesses to be funded by their own resources, or with the help of relatives and business partners with none seeking loans from the banks.36
Specifically, GEM’s data shows one in 5 female-owned businesses discontinued due to Lack of Finance (19.4%) and Unprofitability (58.4%). Another deterrent could stem from the fact that although entrepreneurship is considered as a relatively desirable career choice (68.8% of population, rank 21 out of 65), successful entrepreneurs do not necessarily command high status in society (63.4%, rank 42 out of 65). The lack of cultural acceptance and encouragement likely dampened the inclination towards business ownership/entrepreneurship (‘Entrepreneurial Intentions Rate’ 13.3% for general population and 12.4% for females only).37 Research findings from the European Commission (2014) points to gender bias in pay: on average, the mean net income of women entrepreneurs in EU-28 in 2012 was 6% lower than that of men entrepreneurs.
miwe 2018 80
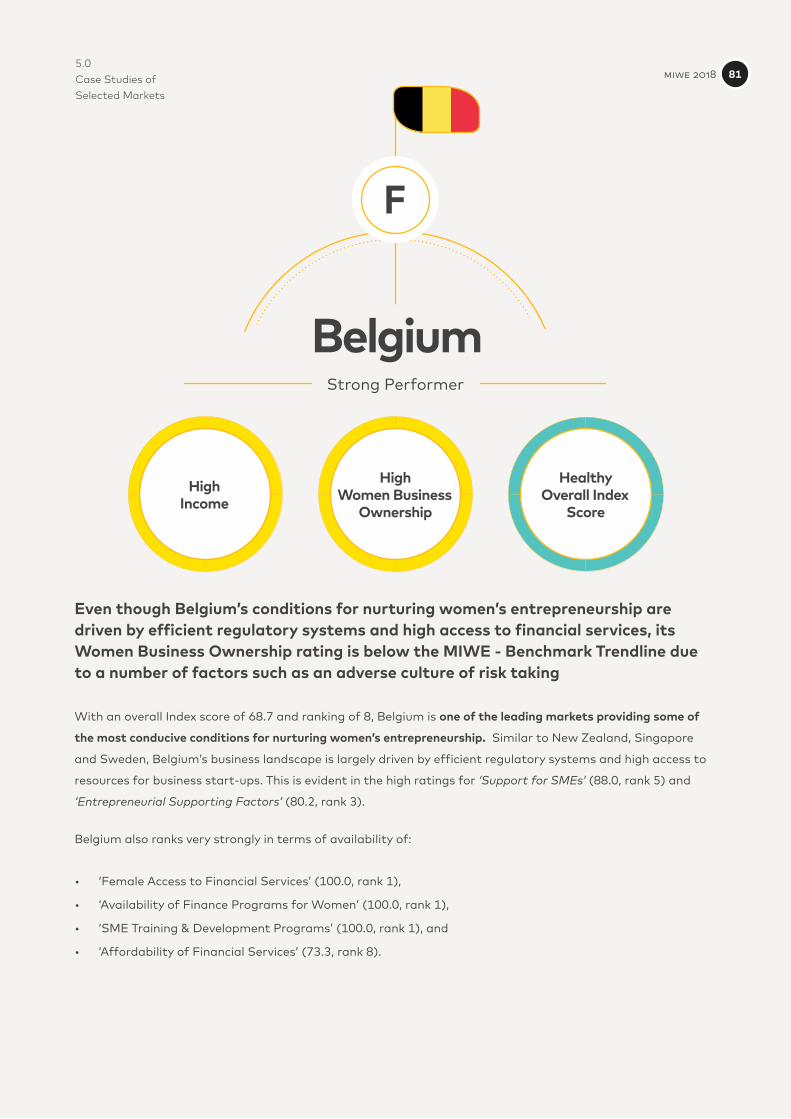
5.0 Case Studies of Selected Markets
Even though Belgium’s conditions for nurturing women’s entrepreneurship are driven by efficient regulatory systems and high access to financial services, its Women Business Ownership rating is below the MIWE - Benchmark Trendline due to a number of factors such as an adverse culture of risk taking
With an overall Index score of 68.7 and ranking of 8, Belgium is one of the leading markets providing some of
the most conducive conditions for nurturing women’s entrepreneurship. Similar to New Zealand, Singapore
and Sweden, Belgium’s business landscape is largely driven by efficient regulatory systems and high access to
resources for business start-ups. This is evident in the high ratings for ‘Support for SMEs’ (88.0, rank 5) and
‘Entrepreneurial Supporting Factors’ (80.2, rank 3).
Belgium also ranks very strongly in terms of availability of:
• ‘Female Access to Financial Services’ (100.0, rank 1),
• ‘Availability of Finance Programs for Women’ (100.0, rank 1),
• ‘SME Training & Development Programs’ (100.0, rank 1), and
• ‘Affordability of Financial Services’ (73.3, rank 8).
BelgiumStrong Performer
F
HighIncome
HighWomen Business
Ownership
HealthyOverall Index
Score
miwe 2018 81
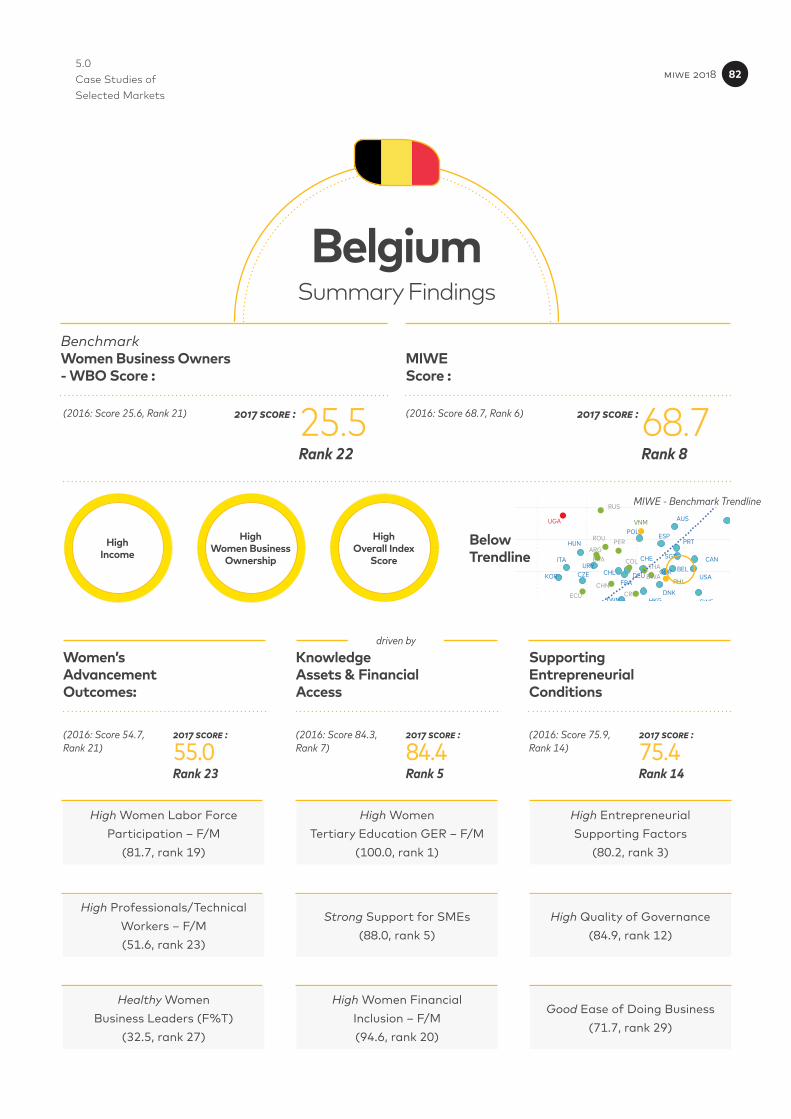
5.0 Case Studies of Selected Markets
Women’sAdvancementOutcomes:
KnowledgeAssets & FinancialAccess
SupportingEntrepreneurial Conditions
High Women Labor Force Participation – F/M
(81.7, rank 19)
High WomenTertiary Education GER – F/M
(100.0, rank 1)
High EntrepreneurialSupporting Factors
(80.2, rank 3)
High Professionals/Technical Workers – F/M(51.6, rank 23)
Strong Support for SMEs(88.0, rank 5)
High Quality of Governance(84.9, rank 12)
Healthy WomenBusiness Leaders (F%T)
(32.5, rank 27)
High Women FinancialInclusion – F/M(94.6, rank 20)
Good Ease of Doing Business(71.7, rank 29)
Rank 23 Rank 5 Rank 14
2017 score :(2016: Score 54.7, Rank 21)
2017 score : 2017 score :(2016: Score 84.3, Rank 7)
(2016: Score 75.9, Rank 14)
BelgiumSummary Findings
55.0 84.4 75.4
HighIncome
HighWomen Business
Ownership
HighOverall Index
Score
RUS
UGA
BGD
GHA
AUS
HKG
JPN
KOR
NZL
SGP
TWN
BELCZE
DNKFRA
DEU
HUN
IRL
ITA
POLPRT
ESP
SWE
CHE
GBRCHLURY
ISR
SAU ARE
CAN
USACHN
MYS
THA
ROU
TUR
ARGBRA COL
CRIECU
MEX
PER
DZAIRN
BWA
ZAF
IDN
PHL
EGY
TUNIND
VNM
NGA
ETH
MWI
BelowTrendline
driven by
MIWE - Benchmark Trendline
MIWEScore :
BenchmarkWomen Business Owners- WBO Score :
Rank 22 Rank 8
2017 score : 2017 score :(2016: Score 25.6, Rank 21) (2016: Score 68.7, Rank 6)25.5 68.7
miwe 2018 82
5.0 Case Studies of Selected Markets
Limitations & Constraints
At 25.5%, the Women Business Ownership rating is below the MIWE - Benchmark Trendline, indicating that Belgian women’s performance is below full potential or as expected. Findings from various sources reveal some possible factors that may be weighing down on women’s entrepreneurial advancement.
Low Female Perceived Capabilities Rate
Although Belgian women have equal access to higher-level education with more than half demonstrating capabilities of assuming professional or technical roles (51.6%), when it comes to starting a business, most of them lack the self-confidence in management/business know-how. This is reflected in the considerably low rating for ‘2016 Female Capability Perceptions’ of 24.5%, below the averages in all regions such as Europe & Central Asia (36.0%), East & South Asia and the Pacific (41.0%), Latin America & the Caribbean (59.0%), MENA (40.0%), and North America (47.0%). Given that the percentage for the population aged 18 to 64 is around 32%, this suggests that women in general, tend to lack the confidence to start a business.38
Low Female Perceived Opportunities Rate
Compared to their global peers, the proportion of women who perceive good business opportunities is relatively low (35.3%, around 1 in every 3 women have a positive assessment of business opportunities). This is lower than regional peers in Europe & Central Asia (36.0%), East & South Asia and the Pacific (40.0%), Latin America & the Caribbean (45.0%), MENA (43.0%), and North America (51.0%). This is both surprising and disappointing, given the availability of strong support for SMEs such as availability of financial and training programs and high affordability of financial services and access to business loans.
miwe 2018 83
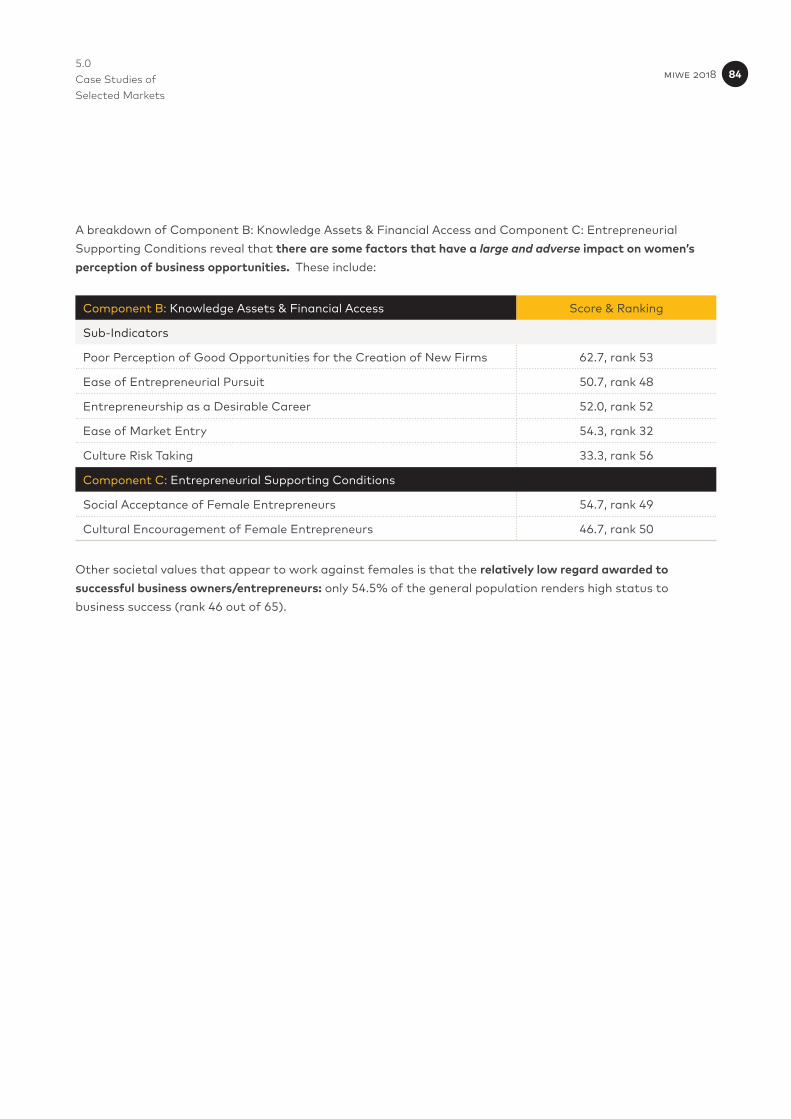
5.0 Case Studies of Selected Markets
A breakdown of Component B: Knowledge Assets & Financial Access and Component C: Entrepreneurial Supporting Conditions reveal that there are some factors that have a large and adverse impact on women’s perception of business opportunities. These include:
Component B: Knowledge Assets & Financial Access Score & Ranking
Sub-Indicators
Poor Perception of Good Opportunities for the Creation of New Firms 62.7, rank 53
Ease of Entrepreneurial Pursuit 50.7, rank 48
Entrepreneurship as a Desirable Career 52.0, rank 52
Ease of Market Entry 54.3, rank 32
Culture Risk Taking 33.3, rank 56
Component C: Entrepreneurial Supporting Conditions
Social Acceptance of Female Entrepreneurs 54.7, rank 49
Cultural Encouragement of Female Entrepreneurs 46.7, rank 50
Other societal values that appear to work against females is that the relatively low regard awarded to successful business owners/entrepreneurs: only 54.5% of the general population renders high status to business success (rank 46 out of 65).
miwe 2018 84
5.0 Case Studies of Selected Markets
Low Inclination to Invest
Given the above constraints, it is not surprising to find Belgian women lagging their global peers when it comes to investing in entrepreneurial activities. GEM’s findings for 2015/2016 revealed Belgian women to be the least inclined as investors with only 1.1% of females reporting having parked their money in a business. This is acutely low compared to the regional averages: Europe & Central Asia (3.5%), East & South Asia and the Pacific (4.9%), Latin & MENA (4.9%), North America (5.2%), and Sub-Saharan Africa (9.3%). Belgian women also tend to be more cautious than men with the amount they invest ($2,220, F/M Median Investment 0.40).
Unique Internal Dynamics
What is interesting however, is that when they do invest, they appear to be more inclined than their global peers to invest with a work colleague. Specifically, nearly 1 in 4 will do so (24.2%), higher than all regional averages and trailing only Morocco, and the UAE. Another unique observation about Belgian women’s TEA activities is that they are more likely than men to be engaged in the Manufacturing/Transportation sector (F/M of 1.35 compared to less than 1.0 for most regions). The proportion of Belgian females in this sector (14.3%) is also higher than other countries, and less concentrated in Wholesale/Retail (19.9% compared to 30.0% in Europe, 64.7% in East & South Asia and the Pacific, and 62.6% in Latin America).
miwe 2018 85
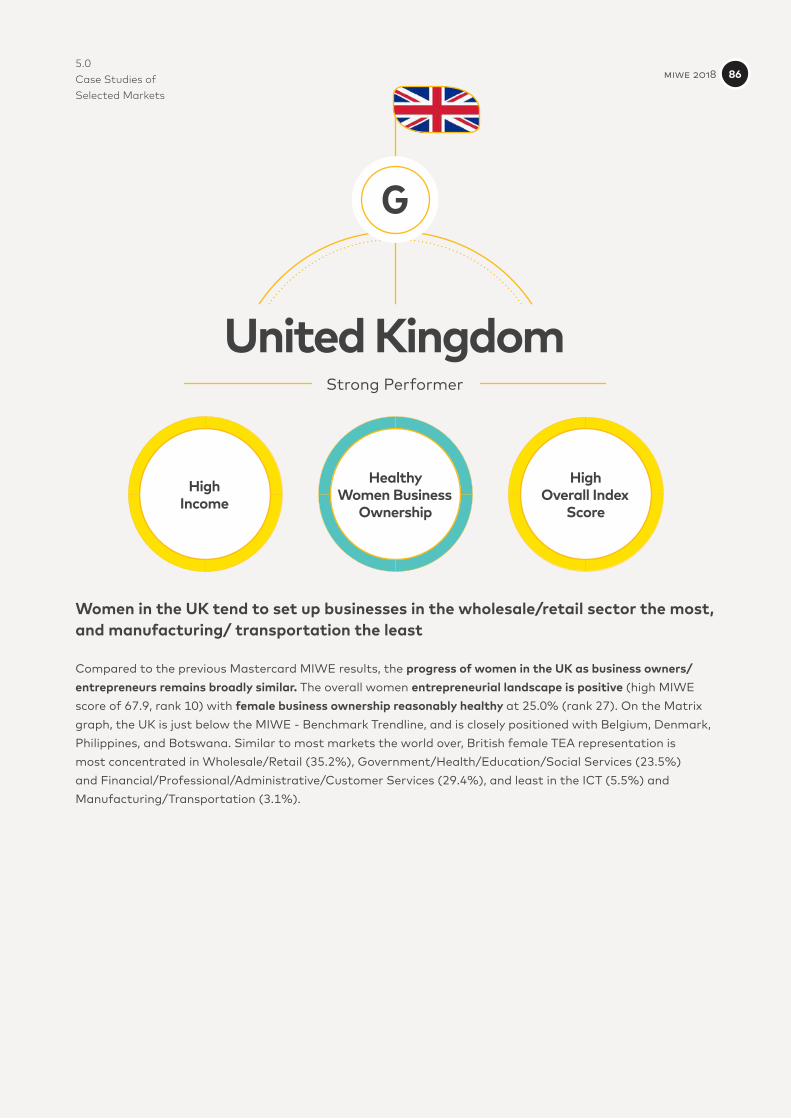
5.0 Case Studies of Selected Markets
Women in the UK tend to set up businesses in the wholesale/retail sector the most, and manufacturing/ transportation the least
Compared to the previous Mastercard MIWE results, the progress of women in the UK as business owners/entrepreneurs remains broadly similar. The overall women entrepreneurial landscape is positive (high MIWE score of 67.9, rank 10) with female business ownership reasonably healthy at 25.0% (rank 27). On the Matrix graph, the UK is just below the MIWE - Benchmark Trendline, and is closely positioned with Belgium, Denmark, Philippines, and Botswana. Similar to most markets the world over, British female TEA representation is most concentrated in Wholesale/Retail (35.2%), Government/Health/Education/Social Services (23.5%) and Financial/Professional/Administrative/Customer Services (29.4%), and least in the ICT (5.5%) and Manufacturing/Transportation (3.1%).
United KingdomStrong Performer
G
HighIncome
HealthyWomen Business
Ownership
HighOverall Index
Score
miwe 2018 86
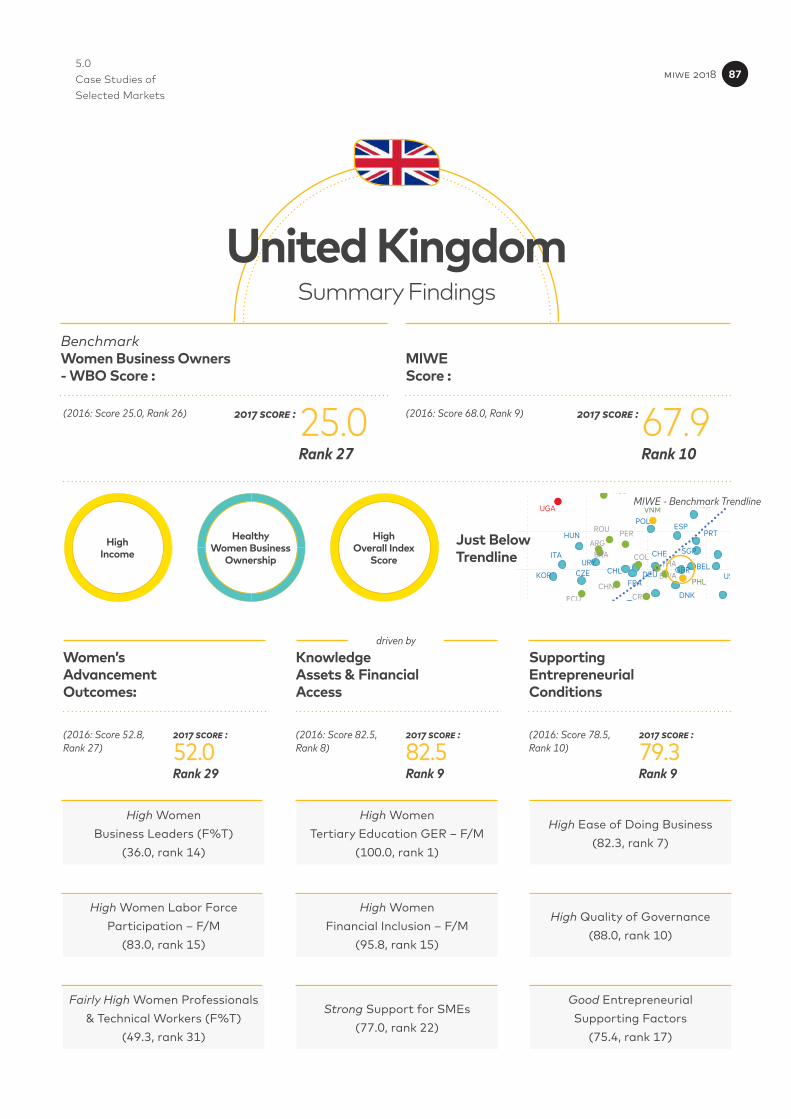
5.0 Case Studies of Selected Markets
Women’sAdvancementOutcomes:
KnowledgeAssets & FinancialAccess
SupportingEntrepreneurial Conditions
High WomenBusiness Leaders (F%T)
(36.0, rank 14)
High WomenTertiary Education GER – F/M
(100.0, rank 1)
High Ease of Doing Business(82.3, rank 7)
High Women Labor Force Participation – F/M
(83.0, rank 15)
High WomenFinancial Inclusion – F/M
(95.8, rank 15)
High Quality of Governance(88.0, rank 10)
Fairly High Women Professionals& Technical Workers (F%T)
(49.3, rank 31)
Strong Support for SMEs(77.0, rank 22)
Good EntrepreneurialSupporting Factors
(75.4, rank 17)
Rank 29 Rank 9 Rank 9
2017 score :(2016: Score 52.8, Rank 27)
2017 score : 2017 score :(2016: Score 82.5, Rank 8)
(2016: Score 78.5, Rank 10)
United KingdomSummary Findings
52.0 82.5 79.3
HighIncome
HealthyWomen Business
Ownership
HighOverall Index
Score
RUS
UGA
BGD
GHA
AUS
HKG
JPN
KOR
NZL
SGP
TWN
BELCZE
DNKFRA
DEU
HUN
IRL
ITA
POLPRT
ESP
SWE
CHE
GBRCHLURY
ISR
SAU ARE
CAN
USACHN
MYS
THA
ROU
TUR
ARGBRA COL
CRIECU
MEX
PER
DZAIRN
BWA
ZAF
IDN
PHL
EGY
TUNIND
VNM
NGA
ETH
MWI
Just Below Trendline
driven by
MIWE - Benchmark Trendline
MIWEScore :
BenchmarkWomen Business Owners- WBO Score :
Rank 27 Rank 10
2017 score : 2017 score :(2016: Score 25.0, Rank 26) (2016: Score 68.0, Rank 9)25.0 67.9
miwe 2018 87
5.0 Case Studies of Selected Markets
The highly dynamic and competitive business environment continues to power women’s relatively high representation as Business Leaders (36.1% of total, rank 14) and Labor Force Participants (F/M: 83.1%, rank 15). In terms of tertiary education GER and access to financial services such as having a bank account, credit and/or debit cards, the gender divide is negligible and very marginal, respectively (‘Women Tertiary Education GER - F/M’ of 100.0, rank 1 and ‘Women Financial Inclusion - F/M’ of 95.7, rank 17). High levels of efficiencies in ‘Ease of Doing Business’ (82.2, rank 7), ‘Quality of Governance’ (86.4, rank 11), and ‘Entrepreneurial Supporting Factors’ (77.0, rank 8) continue to stand out as some of the most enabling factors underpinning women’s success in business. This is more favorable in most European and MENA markets such as Spain, Portugal, Poland, Italy, Hungary, France, Israel, UAE, and Saudi Arabia.
GEM’s latest indicator on Female’s Investor Activities show British women tend to be less inclined than men when it comes to investing in an entrepreneurial activity (‘F/M Invested’ 0.41). For those women that do invest, more than half tend to invest in a family or relative (52.5%) or a friend or neighbor (27.5%). The median investment amount among women ($6,878) is just above the average in Europe & Central Asia ($6,675), and greater than most other regions: East and South Asia & the Pacific ($4,017), Latin America & the Caribbean ($1,501), North America ($3,157) and Sub-Saharan Africa ($230).
Entrepreneurial Intentions Remain Low
Notwithstanding the overall favorable entrepreneurial conditions, women’s motivation to start and run a business is low: 8.6% compared to 12.4% in Portugal, 10.0% in Ireland, 14.7% in France, 28.1% in Turkey, 19.4% in Poland, and 14.6% in Hungary (GEM 2015/2016 data). On a positive note, over the period from 2014 to 2016, women’s participation in entrepreneurial activity rose 24% (from 6.9% in 2014 to 8.6% in 2016) – this compares well with peers such as Netherlands, Spain, Italy, Germany, Russia, Latvia, Macedonia, Malaysia and Ecuador where declines ranging from -14% to -40% were noted.39 Other constraints include high operating costs and difficulties in getting funding for overseas expansion.
miwe 2018 88
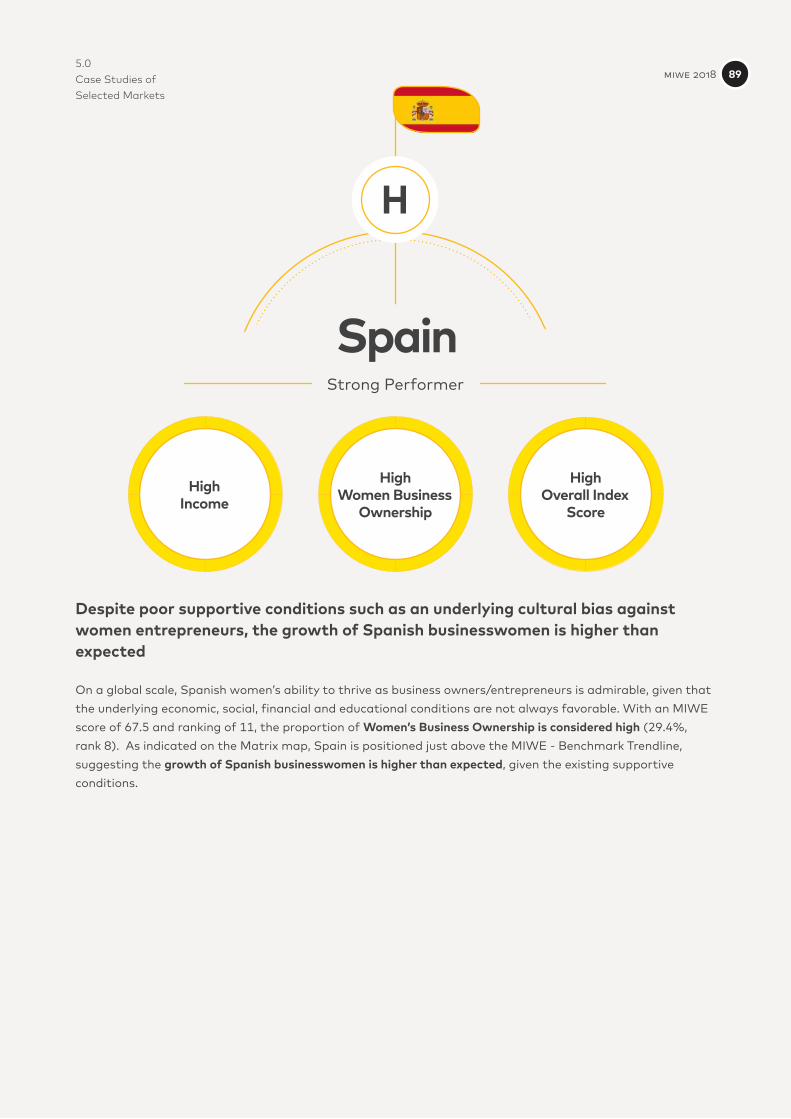
5.0 Case Studies of Selected Markets
Despite poor supportive conditions such as an underlying cultural bias against women entrepreneurs, the growth of Spanish businesswomen is higher than expected
On a global scale, Spanish women’s ability to thrive as business owners/entrepreneurs is admirable, given that the underlying economic, social, financial and educational conditions are not always favorable. With an MIWE score of 67.5 and ranking of 11, the proportion of Women’s Business Ownership is considered high (29.4%, rank 8). As indicated on the Matrix map, Spain is positioned just above the MIWE - Benchmark Trendline, suggesting the growth of Spanish businesswomen is higher than expected, given the existing supportive conditions.
SpainStrong Performer
H
HighIncome
HighWomen Business
Ownership
HighOverall Index
Score
miwe 2018 89
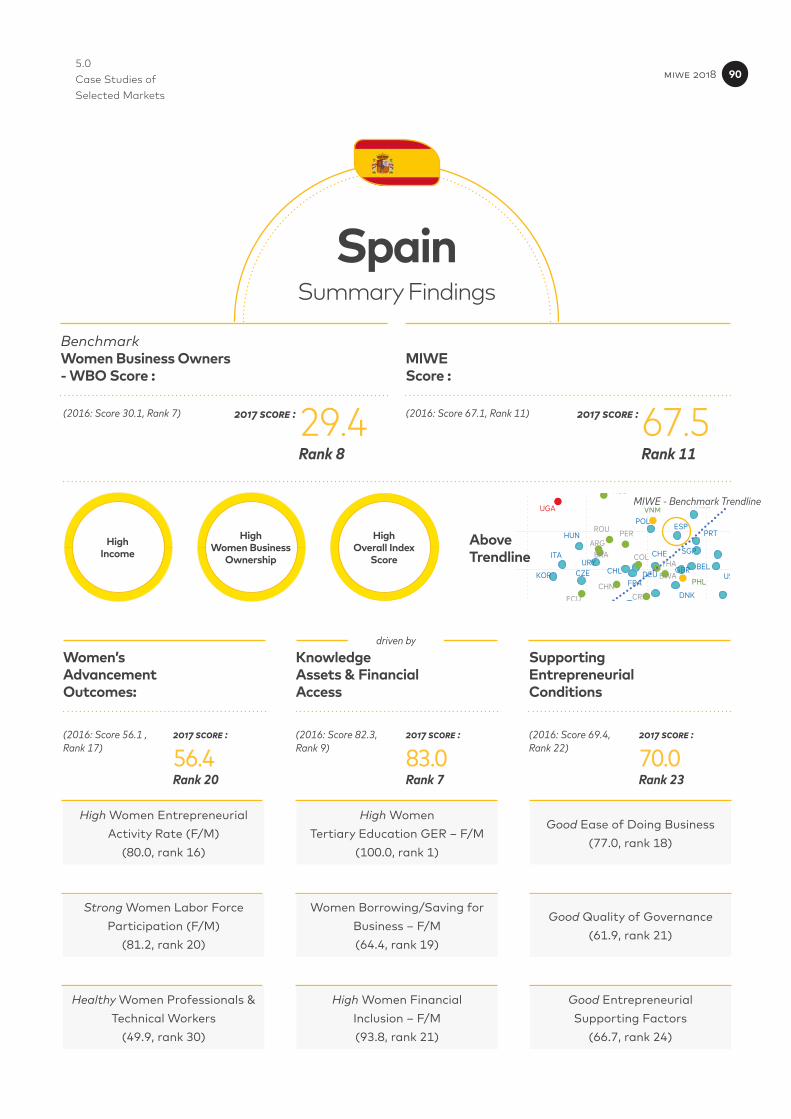
5.0 Case Studies of Selected Markets
Women’sAdvancementOutcomes:
KnowledgeAssets & FinancialAccess
SupportingEntrepreneurial Conditions
High Women Entrepreneurial Activity Rate (F/M)
(80.0, rank 16)
High WomenTertiary Education GER – F/M
(100.0, rank 1)
Good Ease of Doing Business(77.0, rank 18)
Strong Women Labor Force Participation (F/M)
(81.2, rank 20)
Women Borrowing/Saving for Business – F/M(64.4, rank 19)
Good Quality of Governance(61.9, rank 21)
Healthy Women Professionals & Technical Workers
(49.9, rank 30)
High Women FinancialInclusion – F/M(93.8, rank 21)
Good EntrepreneurialSupporting Factors
(66.7, rank 24)
Rank 20 Rank 7 Rank 23
2017 score :(2016: Score 56.1 , Rank 17)
2017 score : 2017 score :(2016: Score 82.3, Rank 9)
(2016: Score 69.4, Rank 22)
SpainSummary Findings
56.4 83.0 70.0
HighIncome
HighWomen Business
Ownership
HighOverall Index
Score
RUS
UGA
BGD
GHA
AUS
HKG
JPN
KOR
NZL
SGP
TWN
BELCZE
DNKFRA
DEU
HUN
IRL
ITA
POLPRT
ESP
SWE
CHE
GBRCHLURY
ISR
SAU ARE
CAN
USACHN
MYS
THA
ROU
TUR
ARGBRA COL
CRIECU
MEX
PER
DZAIRN
BWA
ZAF
IDN
PHL
EGY
TUNIND
VNM
NGA
ETH
MWI
AboveTrendline
driven by
MIWE - Benchmark Trendline
MIWEScore :
BenchmarkWomen Business Owners- WBO Score :
Rank 8 Rank 11
2017 score : 2017 score :(2016: Score 30.1, Rank 7) (2016: Score 67.1, Rank 11)29.4 67.5
miwe 2018 90
5.0 Case Studies of Selected Markets
Gender Comparisons: Rewards for Entrepreneurship, Start-Ups, Governance & System Efficiencies
A study conducted by Aston University revealed Spain having the closest male/female ratio of any developed economy when it comes to start-ups: 74 Spanish women entrepreneurs for every 100 male ones.40 This is reflected in GEM’s 2015/2016 findings which showed the gender gap to be narrower than the average in Europe & Central Asia (0.5) and MENA (0.3). When it comes to rewards for entrepreneurship, Spanish women enjoy one of the narrowest gender divide: down from 22% in 2011-12 to around 15% in more recent years, compared to 33% in the OECD countries.41
Component B: Knowledge Assets & Financial Access (83.0, rank 7), the strongest component of the 3, underscores high ranking in higher-level education (‘Women Tertiary Education GER - F/M’ 100.0, rank 1) and a high proportion of women with a bank account and credit/debit cards relative to men (‘Women Financial Inclusion - F/M’ 93.8, rank 21). They also demonstrate a relatively high inclination to borrow or save for a business (‘Women Borrowing or Saving for Business - F/M’ 64.4, rank 19).
When it comes to investing in a business/entrepreneurial activity, women are slightly less inclined than men (‘F/M Invested’ at 0.94), however the inclination is fairly high relative to their global peers in Europe & Central Asia (0.60), East & South Asia and the Pacific (0.81), Latin America & the Caribbean (0.62), MENA (0.63), North America (0.63) and Sub-Saharan Africa (0.63). They are also more likely to invest in businesses owned by a family/relative (67.2%) or friend/neighbor (23.8%), a trend that is similar among women in most markets.
miwe 2018 91
5.0 Case Studies of Selected Markets
Constraints: Full Potential Suppressed
GEM’s 2015/2016 results also reveal that although Spanish women are making very sound inroads as business owners, their full potential and ability to flourish remains restricted on various fronts. For instance, although they have a relatively high perception of the business skills required ‘2016 Female Capability Perceptions’ (43.7%, higher than Europe & Central Asia’s average of 36.0%), their assessment of good business opportunities is ranked among the lowest globally: ‘2016 Female Opportunity Perceptions’ at 23.0 for Spain against 40.0 for East & South Asia and the Pacific, 36.0 for Europe and Central Asia, 45.0 for Latin America & the Caribbean, 45.0 for MENA and 56.0 for North America.42 This could be dampened by the lack of social support systems, reflected in the very low scores for the sub-indicators: ‘Family Support’ (36.7, rank 56), ‘Know-how for Business Start-up’ (44.9, rank 55), and ‘Culture Risk Taking’ (31.9, rank 57). This is further exacerbated by the lack of new business opportunities and resources available, and high barriers of market entry for new business start-ups.43
Spanish women’s ability to thrive is also constrained by underlying cultural bias against women entrepreneurs: ‘Cultural Perception of Women Entrepreneurs’ 61.9, rank 44. This is evident in the low scores for the sub-indicators:44
• ‘Ability of Women to Rise to Positions of Leaderships’ - 52.0, rank 48,
• ‘Social Acceptability of Female Entrepreneurship’ - 53.5, rank 53,
• ‘Social Encouragement of Female Entrepreneurship’ - 54.1, rank 43, and
• ‘Gender Bias in Exposure to Good Business Opportunities’ - 54.1, rank 47.
miwe 2018 92
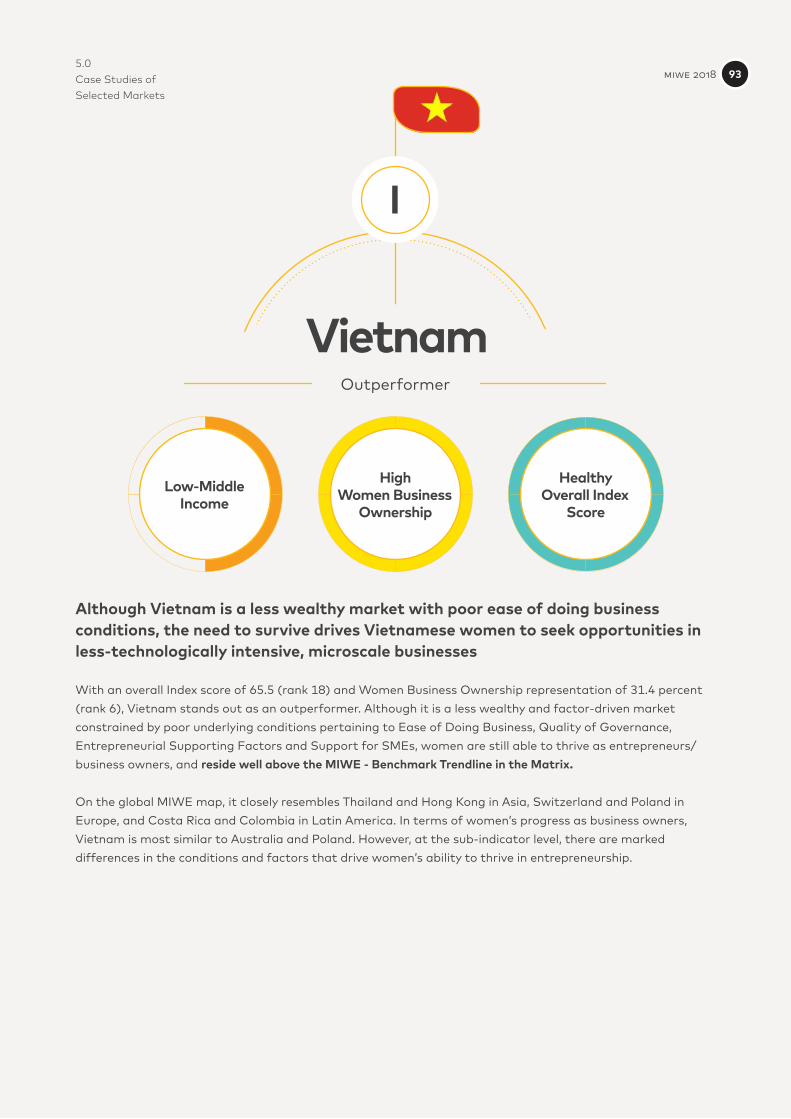
5.0 Case Studies of Selected Markets
Although Vietnam is a less wealthy market with poor ease of doing business conditions, the need to survive drives Vietnamese women to seek opportunities in less-technologically intensive, microscale businesses
With an overall Index score of 65.5 (rank 18) and Women Business Ownership representation of 31.4 percent (rank 6), Vietnam stands out as an outperformer. Although it is a less wealthy and factor-driven market constrained by poor underlying conditions pertaining to Ease of Doing Business, Quality of Governance, Entrepreneurial Supporting Factors and Support for SMEs, women are still able to thrive as entrepreneurs/business owners, and reside well above the MIWE - Benchmark Trendline in the Matrix.
On the global MIWE map, it closely resembles Thailand and Hong Kong in Asia, Switzerland and Poland in Europe, and Costa Rica and Colombia in Latin America. In terms of women’s progress as business owners, Vietnam is most similar to Australia and Poland. However, at the sub-indicator level, there are marked differences in the conditions and factors that drive women’s ability to thrive in entrepreneurship.
VietnamOutperformer
I
Low-Middle Income
HighWomen Business
Ownership
HealthyOverall Index
Score
miwe 2018 93
5.0 Case Studies of Selected Markets
Vietnam’s strength is distinct in Component A: Women’s Advancement Outcomes (59.6, rank 10) and Component B: Knowledge Assets & Financial Access (86.7, Rank 3, trailing only Singapore and New Zealand). Compared to their global peers, Vietnamese women are as likely as men to engage in businesses (‘Women Entrepreneurial Activity Rate - F/M’ 100.0, rank 1). Such high inclination is also apparent in less wealthy and factor-driven markets such as Ghana, Uganda, Nigeria, Mexico, Brazil, Indonesia and Philippines. This reaffirms the observation that women’s tendency to be engaged in entrepreneurial activities appears to be higher in the less wealthy and advanced economies where the nature of businesses is likely to be in the informal sector, less-technologically intensive, micro-scale, and assuming the form of self-employment.
Although Vietnamese women rank well in Components A and B, they trail in Component C: Supporting Entrepreneurial Conditions. At 56.2, Vietnam is ranked among the lowest cohort (42nd), weighed down by unfavorable conditions in ‘Quality of Governance’ (rank 47), ‘Entrepreneurial Supporting Factors’ (rank 48) and ‘Ease of Doing Business’ (rank 36). Women’s opportunity to rise as business leaders is also surprisingly low (rank 41, 26.2% - only 1 female out of every 4 leaders). They are also disadvantaged in terms of receiving relatively low acceptance from society (‘Cultural Perception of Women Entrepreneurs’ 68.8, rank 25). This is lower than most Asian markets, such as 76.2 in Indonesia, 82.2 in Philippines, 76.9 in Thailand, 73.8 in Malaysia, and 79.9 in Hong Kong.
miwe 2018 94
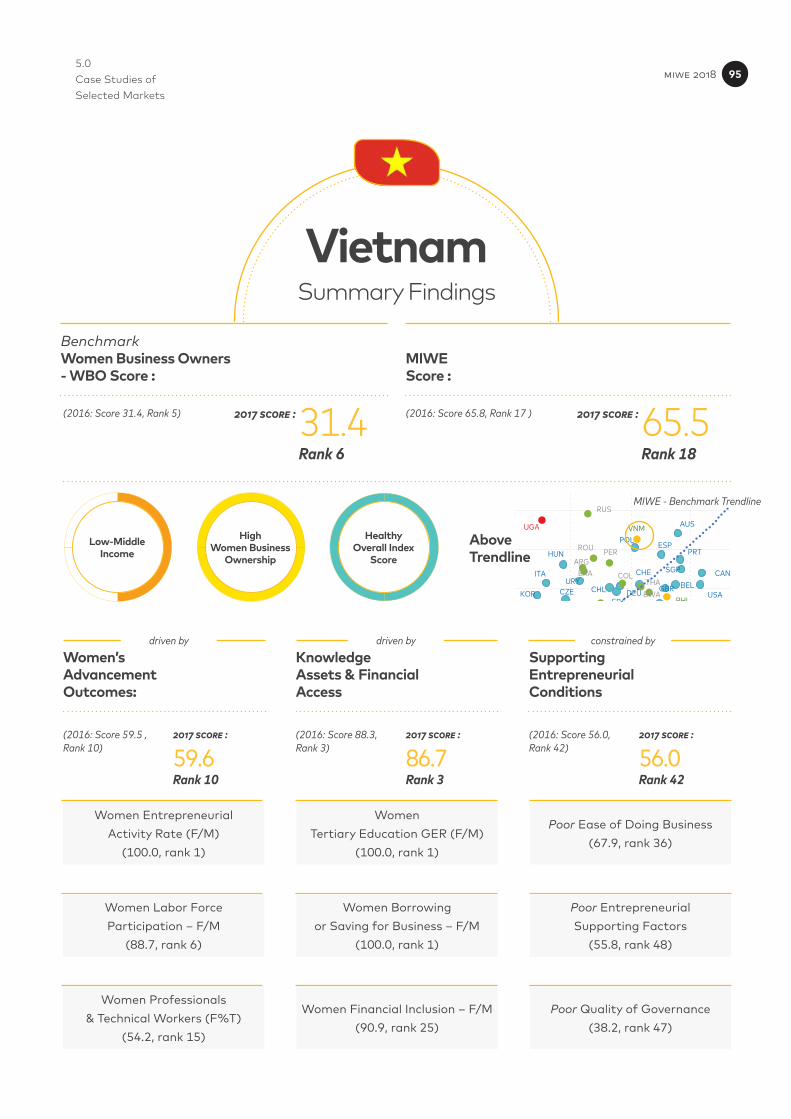
5.0 Case Studies of Selected Markets
Women’sAdvancementOutcomes:
KnowledgeAssets & FinancialAccess
SupportingEntrepreneurial Conditions
Women EntrepreneurialActivity Rate (F/M)
(100.0, rank 1)
WomenTertiary Education GER (F/M)
(100.0, rank 1)
Poor Ease of Doing Business(67.9, rank 36)
Women Labor ForceParticipation – F/M
(88.7, rank 6)
Women Borrowingor Saving for Business – F/M
(100.0, rank 1)
Poor EntrepreneurialSupporting Factors
(55.8, rank 48)
Women Professionals& Technical Workers (F%T)
(54.2, rank 15)
Women Financial Inclusion – F/M(90.9, rank 25)
Poor Quality of Governance(38.2, rank 47)
Rank 10 Rank 3 Rank 42
2017 score :(2016: Score 59.5 , Rank 10)
2017 score : 2017 score :(2016: Score 88.3, Rank 3)
(2016: Score 56.0, Rank 42)
VietnamSummary Findings
59.6 86.7 56.0
Low-Middle Income
HighWomen Business
Ownership
HealthyOverall Index
Score
constrained bydriven bydriven by
RUS
UGA
BGD
GHA
AUS
HKG
JPN
KOR
NZL
SGP
TWN
BELCZE
DNKFRA
DEU
HUN
IRL
ITA
POLPRT
ESP
SWE
CHE
GBRCHLURY
ISR
SAU ARE
CAN
USACHN
MYS
THA
ROU
TUR
ARGBRA COL
CRIECU
MEX
PER
DZAIRN
BWA
ZAF
IDN
PHL
EGY
TUNIND
VNM
NGA
ETH
MWI
AboveTrendline
MIWE - Benchmark Trendline
MIWEScore :
BenchmarkWomen Business Owners- WBO Score :
Rank 6 Rank 18
2017 score : 2017 score :(2016: Score 31.4, Rank 5) (2016: Score 65.8, Rank 17 )31.4 65.5
miwe 2018 95
5.0 Case Studies of Selected Markets
Vietnamese female entrepreneurs tend to be more driven by opportunities (43.8%) than by necessity (56.3%) in early-stage entrepreneurial activities, and have a high perception of capabilities required to do so (54.7% Female Capability Perceptions). In fact, women’s pursuit of good business opportunities increased by 51% over the period of 2014 to 2016. They also have relatively good appetite for business risks (50.7 - ‘Undeterred by Fear of Failure - Females’) and compare favorably with males (‘Ratio F/M Undeterred by Fear of Failure’ - 0.9). These conditions help explain the high Female TEA ratings in Vietnam.45
The results for Component B: Knowledge Assets & Financial Access show women having equal opportunities to higher level education (‘Women Tertiary Education GER Rate - F/M’ of 100.0, rank 1). Of the 57 markets in the MIWE study, Vietnamese women are the only ones who demonstrate equal inclination to borrow or save for their business undertakings as men (‘Women Borrowing or Saving for Business - F/M’ - 100.0, rank 1). Data from Global Findex Database 2015 showed 1 in every 5 women (21%) reporting borrowing funds from a financial institution in the past 12 months (versus 1 in every seven men - 15%).
Opportunities: Improved Business Environment, Higher Awareness & Intentions
A joint research undertaking by the Vietnam Chamber of Commerce and Industry (VCCI), Global Entrepreneurship Research Association (GERA) and others noted that the business environment in Vietnam has improved, driven by efforts of the Government to initiate programs, policies and funds geared towards supporting business start-ups and promoting entrepreneurship. This is a positive move, given the poor conditions of doing business, entrepreneurial supporting factors and quality of governance in Vietnam (67.9, 55.8 and 38.2, respectively). The increase in awareness about the existence of opportunities and business capabilities (up from 36.8% in 2013 to 56.8% in 2015) also bolstered the desire among adults to become entrepreneurs (nearly one-fourth of adults, 22.3% in 2015).
In GEM’s 2015/2016 Global study of 74 markets, women in Vietnam (and China) are among the most inclined to invest in a business or an entrepreneurial activity. Compared to their male counterparts, Vietnamese women are more inclined to invest (F/M Invested: 1.08), and will invest in a family or relative (F/M Family or Other Relative: 1.3).
miwe 2018 96
5.0 Case Studies of Selected Markets
Key Deterrents: Lack of Innovative Drive, Financial Backing & Internationalization
Although Vietnamese women are making commendable inroads as entrepreneurs, GEM’s 2015 study shed deeper insights on other conditions that appear to inhibit their ability to thrive in the business environment:
• Business activities in TEA tends to be concentrated in customer service (74.5%), and limited in others such as processing (14.4%) and business services (3.3%).
• Businesses are often discontinued due to financial problems (29.2%) and lack of profit (22.2%).
• There is a lack of innovative-drive in entrepreneurial activities (Vietnam ranks 50th out of 60 countries at 16.5%).
• The orientation towards internationalization is very low, with only 1.5% of TEA having more than 25% of international customers.
miwe 2018 97
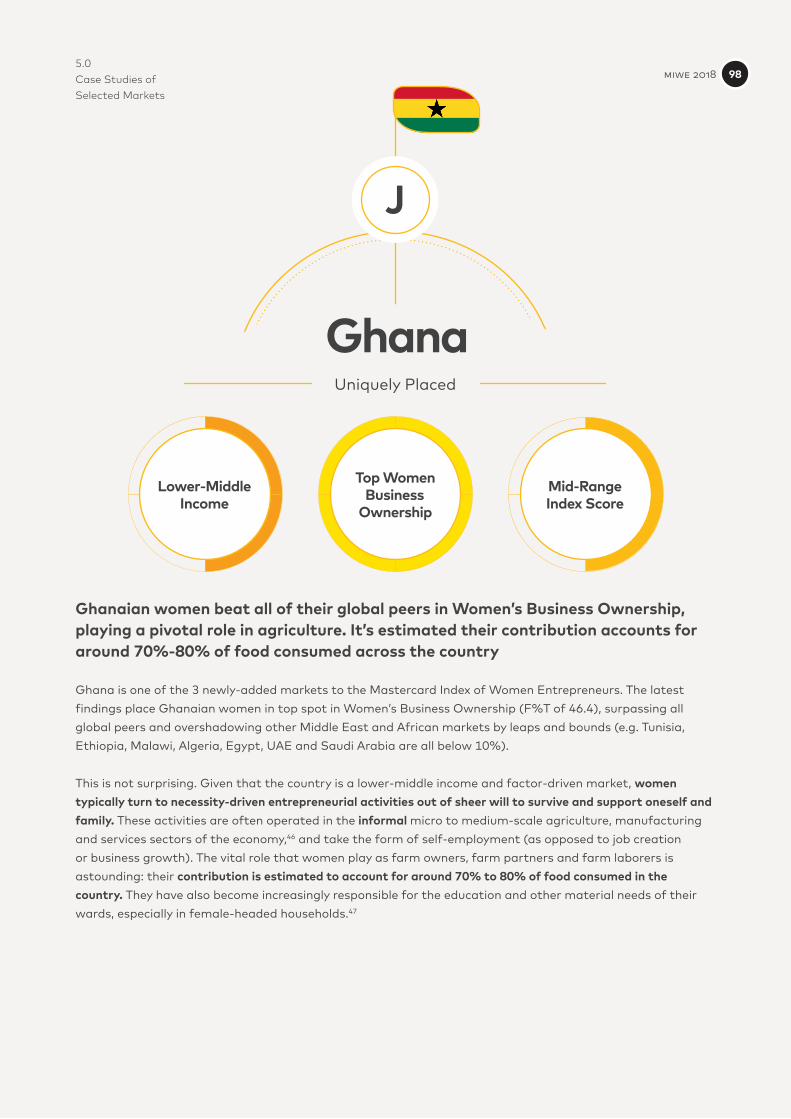
5.0 Case Studies of Selected Markets
Ghanaian women beat all of their global peers in Women’s Business Ownership, playing a pivotal role in agriculture. It’s estimated their contribution accounts for around 70%-80% of food consumed across the country
Ghana is one of the 3 newly-added markets to the Mastercard Index of Women Entrepreneurs. The latest findings place Ghanaian women in top spot in Women’s Business Ownership (F%T of 46.4), surpassing all global peers and overshadowing other Middle East and African markets by leaps and bounds (e.g. Tunisia, Ethiopia, Malawi, Algeria, Egypt, UAE and Saudi Arabia are all below 10%).
This is not surprising. Given that the country is a lower-middle income and factor-driven market, women typically turn to necessity-driven entrepreneurial activities out of sheer will to survive and support oneself and family. These activities are often operated in the informal micro to medium-scale agriculture, manufacturing and services sectors of the economy,46 and take the form of self-employment (as opposed to job creation or business growth). The vital role that women play as farm owners, farm partners and farm laborers is astounding: their contribution is estimated to account for around 70% to 80% of food consumed in the country. They have also become increasingly responsible for the education and other material needs of their wards, especially in female-headed households.47
GhanaUniquely Placed
J
Lower-Middle Income
Top Women Business
Ownership
Mid-RangeIndex Score
miwe 2018 98
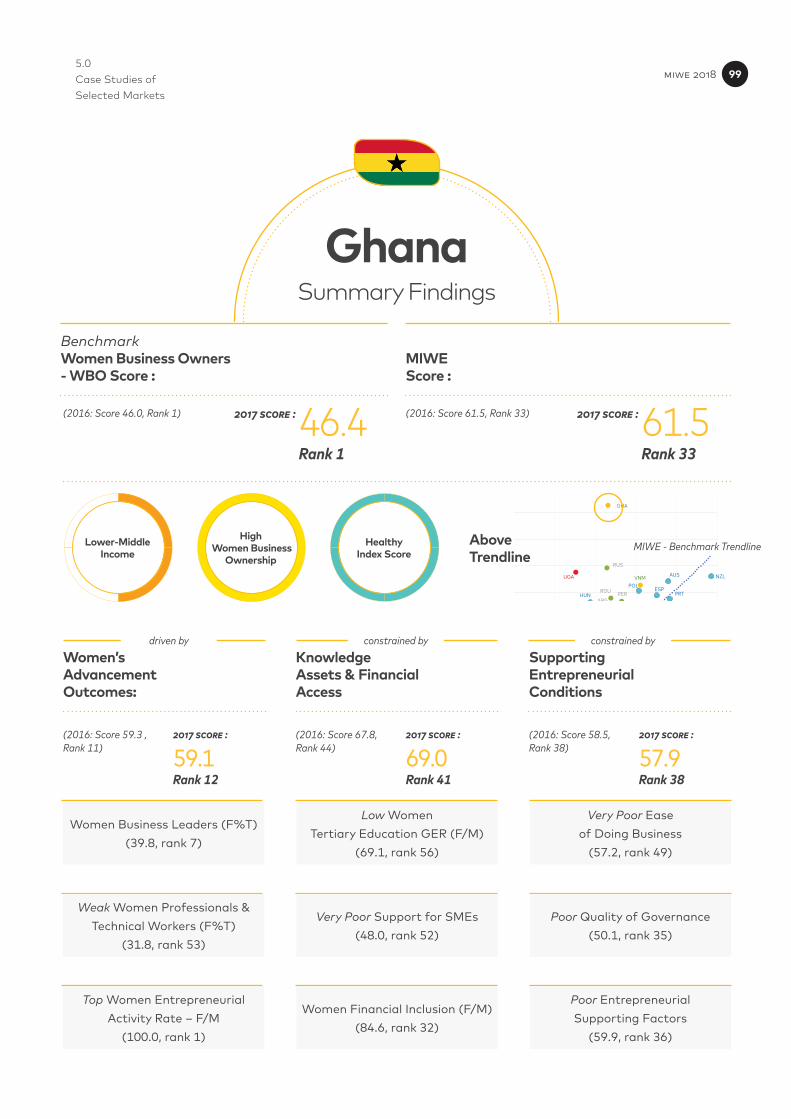
5.0 Case Studies of Selected Markets
Women’sAdvancementOutcomes:
KnowledgeAssets & FinancialAccess
SupportingEntrepreneurial Conditions
Women Business Leaders (F%T)(39.8, rank 7)
Low WomenTertiary Education GER (F/M)
(69.1, rank 56)
Very Poor Easeof Doing Business
(57.2, rank 49)
Weak Women Professionals & Technical Workers (F%T)
(31.8, rank 53)
Very Poor Support for SMEs(48.0, rank 52)
Poor Quality of Governance(50.1, rank 35)
Top Women Entrepreneurial Activity Rate – F/M
(100.0, rank 1)
Women Financial Inclusion (F/M)(84.6, rank 32)
Poor EntrepreneurialSupporting Factors
(59.9, rank 36)
Rank 12 Rank 41 Rank 38
2017 score :(2016: Score 59.3 , Rank 11)
2017 score : 2017 score :(2016: Score 67.8, Rank 44)
(2016: Score 58.5, Rank 38)
GhanaSummary Findings
59.1 69.0 57.9
constrained byconstrained bydriven by
Lower-Middle Income
High Women Business
Ownership
HealthyIndex Score
RUS
UGA
BGD
GHA
AUS
HKG
JPN
KOR
NZL
SGP
TWN
BELCZE
DNKFRA
DEU
HUN
IRL
ITA
POLPRT
ESP
SWE
CHE
GBRCHLURY
ISR
SAU ARE
CAN
USACHN
MYS
THA
ROU
TUR
ARGBRA COL
CRIECU
MEX
PER
DZAIRN
BWA
ZAF
IDN
PHL
EGY
TUNIND
VNM
NGA
ETH
MWI
AboveTrendline
MIWE - Benchmark Trendline
MIWEScore :
BenchmarkWomen Business Owners- WBO Score :
Rank 1 Rank 33
2017 score : 2017 score :(2016: Score 46.0, Rank 1) (2016: Score 61.5, Rank 33)46.4 61.5
miwe 2018 99
5.0 Case Studies of Selected Markets
The need to earn a living is also reflected in the very narrow gender gap in ‘Women Labor Force Participation -F/M’ of 96.1 (rank 2), suggesting women are just as likely to join the workforce as men. Because entrepreneurship here primarily assumes the form of small-scale, family-owned businesses in the informal sector (agricultural and sales), they require little technological know-how and capital investment.
Strengths & Opportunities
There are several notable aspects of the entrepreneurial conditions in Ghana that leads to the strong level of women entrepreneurship. First, women tend to be more inclined to engage in entrepreneurial activities (38%) than men (35%). They also have a very strong representation as Business Leaders - F%T (39.8%, rank 7). These high ratings explain Ghana’s high ranking in Component A: Women’s Advancement Outcomes (59.1, rank 12). Another enabling factor may stem from society’s high regard for entrepreneurship as a good career choice (81.6%) and successful entrepreneurs (94.1%). For both perception indicators, Ghana’s rating was the highest in the world (GEM 2012 sub-Saharan Africa).
Obstacles to Women’s Economic Empowerment
Although more inclined to engage in businesses than men, Ghanaian women are more driven by necessity and the need to survive (as opposed to pursuit of good opportunities). Coupled with a higher fear of business failure, women’s businesses are less likely to grow into sustainable, employment-creating enterprise. Insights from GEM’s 2010 study showed that although more women than men felt they had the qualifications to run a business, by 2012 over half of the men interviewed said they thought they had the capacity to run a business, against 46% of the women.
Compared to their peers, women entrepreneurs tend to be less accepted by society (‘Cultural Perceptions of Women Entrepreneurs’ 65.6, rank 35). This is lower than other African countries such as Nigeria, Uganda and Botswana. Because women’s role is viewed as primarily child-rearing and home management,48 they face marginalization when it comes to opportunities for higher-level education (‘Tertiary Education GER - F/M’ 69.1, 2nd lowest in global ranking). It is striking to note that although the national average of female-headed household in Ghana is around 34% – suggesting their increasing role as the backbone and breadwinners in their families – their participation in the informal sector means that they have very limited access to social security contributions and benefits, as well as stable remuneration and pay.49 Unsurprisingly, they are mostly in the lower echelons of economic activity and constitute less of the professional/technical staff in the labor force (‘Women Professionals/Technical Workers - F%T’, 31.8%, rank 53 in MIWE).
miwe 2018 100
5.0 Case Studies of Selected Markets
This is further exacerbated by very poor conditions pertaining to SME Support, Ease of Doing Business, Quality of Governance, and Entrepreneurial Supporting Factors. Although Ghanaian women have fairly equal access to formal financial institutions and saving mechanisms (‘Women Financial Inclusion - F/M’ of 84.6), there are constraints such as high interest rates charged by financial institutions as the key causes of business discontinuance.50
Other constraints that inhibit women’s ability to thrive socially and economically are highlighted in various studies, and include:
• Access to and Control over Land: the land tenure system and administration are embroiled in a complex maze of family/tribe/clan holdings, where the rights to hold land are entrusted typically to men.51
• Cumbersome Business & Financial Institutional Processes: It takes 12 procedures and 81 days to start a business in Ghana.52
• Lengthy Process for Registering Business and Opening of Bank Accounts: according to the World Bank’s Doing Business Report, it takes 12 procedures and 81 days to start a business in Ghana.
• Time Use: There is severe bias against women’s working hours, which are typically longer than men (Imam, 1998). This time constraint also limits their availability to participate in training programs.
• Access to Training: Women also lack business and marketing skills, and are often left unaware of these programs or do not have the time.
• Limited Entrepreneurial Privileges: Women farmers control less land than men (less than 20% of landholders are women), and also have limited access to inputs, seeds, credits, and extension services. (www.unwomen.org). Only 34% of women have a bank account, and only 8.9% of them are inclined to borrow from banks (Findex 2015, The World Bank).
• Undervalued Contributions: Women’s contribution to their families and the economy is grossly undervalued and often excluded in the national income accounting system.53
miwe 2018 101 miwe 2018 101
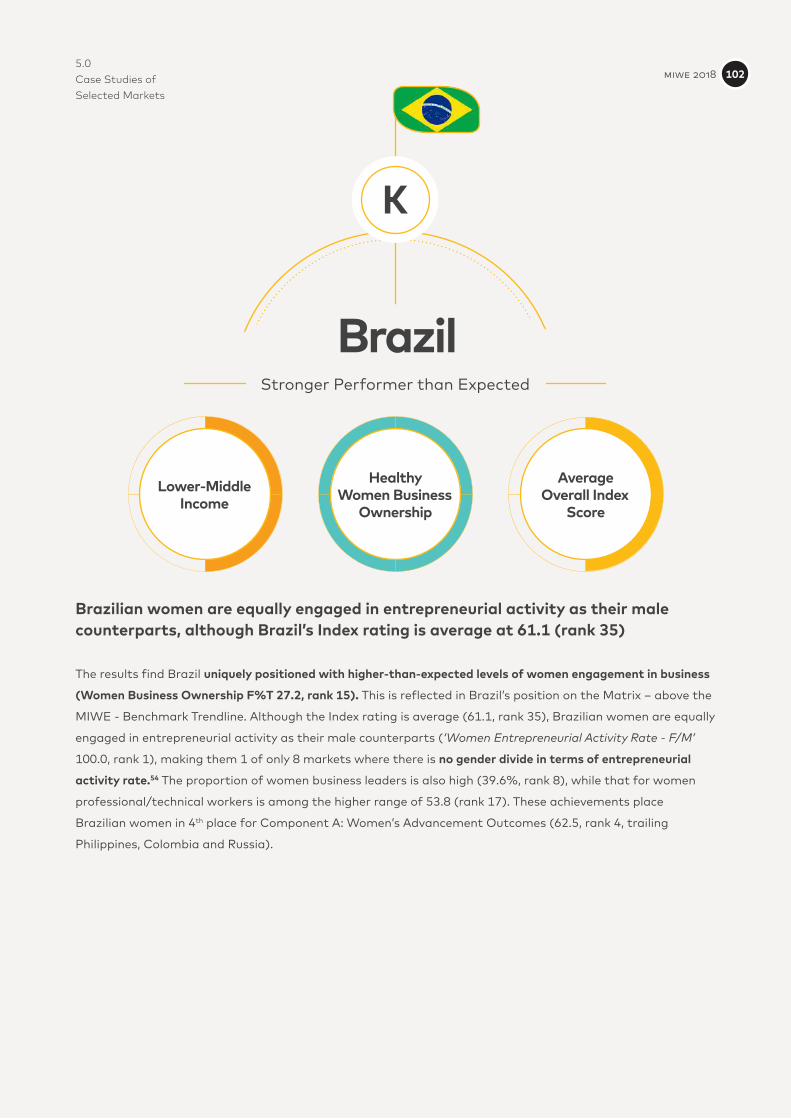
5.0 Case Studies of Selected Markets
Brazilian women are equally engaged in entrepreneurial activity as their male counterparts, although Brazil’s Index rating is average at 61.1 (rank 35)
The results find Brazil uniquely positioned with higher-than-expected levels of women engagement in business
(Women Business Ownership F%T 27.2, rank 15). This is reflected in Brazil’s position on the Matrix – above the
MIWE - Benchmark Trendline. Although the Index rating is average (61.1, rank 35), Brazilian women are equally
engaged in entrepreneurial activity as their male counterparts (‘Women Entrepreneurial Activity Rate - F/M’
100.0, rank 1), making them 1 of only 8 markets where there is no gender divide in terms of entrepreneurial
activity rate.54 The proportion of women business leaders is also high (39.6%, rank 8), while that for women
professional/technical workers is among the higher range of 53.8 (rank 17). These achievements place
Brazilian women in 4th place for Component A: Women’s Advancement Outcomes (62.5, rank 4, trailing
Philippines, Colombia and Russia).
BrazilStronger Performer than Expected
K
Lower-Middle Income
Healthy Women Business
Ownership
AverageOverall Index
Score
miwe 2018 102
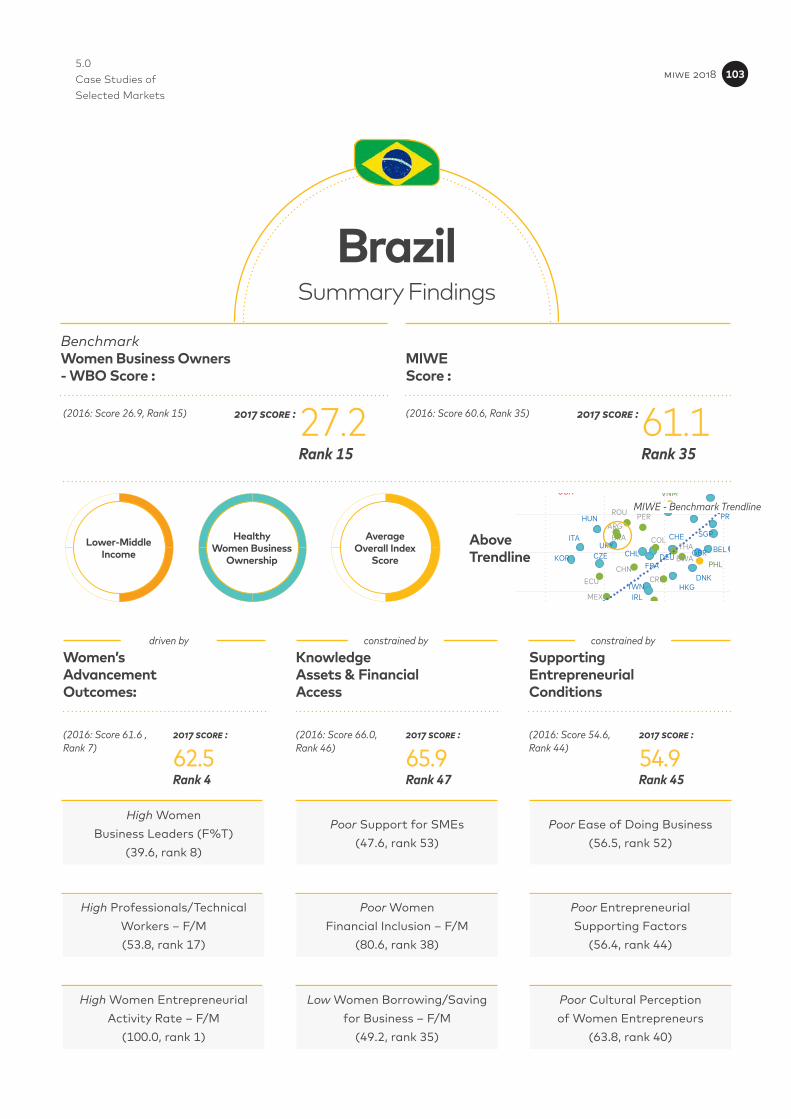
5.0 Case Studies of Selected Markets
Women’sAdvancementOutcomes:
KnowledgeAssets & FinancialAccess
SupportingEntrepreneurial Conditions
High WomenBusiness Leaders (F%T)
(39.6, rank 8)
Poor Support for SMEs(47.6, rank 53)
Poor Ease of Doing Business(56.5, rank 52)
High Professionals/Technical Workers – F/M(53.8, rank 17)
Poor WomenFinancial Inclusion – F/M
(80.6, rank 38)
Poor EntrepreneurialSupporting Factors
(56.4, rank 44)
High Women Entrepreneurial Activity Rate – F/M
(100.0, rank 1)
Low Women Borrowing/Savingfor Business – F/M
(49.2, rank 35)
Poor Cultural Perceptionof Women Entrepreneurs
(63.8, rank 40)
Rank 4 Rank 47 Rank 45
2017 score :(2016: Score 61.6 , Rank 7)
2017 score : 2017 score :(2016: Score 66.0, Rank 46)
(2016: Score 54.6, Rank 44)
BrazilSummary Findings
62.5 65.9 54.9
constrained byconstrained bydriven by
RUS
UGA
BGD
GHA
AUS
HKG
JPN
KOR
NZL
SGP
TWN
BELCZE
DNKFRA
DEU
HUN
IRL
ITA
POLPRT
ESP
SWE
CHE
GBRCHLURY
ISR
SAU ARE
CAN
USACHN
MYS
THA
ROU
TUR
ARGBRA COL
CRIECU
MEX
PER
DZAIRN
BWA
ZAF
IDN
PHL
EGY
TUNIND
VNM
NGA
ETH
MWI
AboveTrendline
Lower-Middle Income
Healthy Women Business
Ownership
AverageOverall Index
Score
MIWE - Benchmark Trendline
MIWEScore :
BenchmarkWomen Business Owners- WBO Score :
Rank 15 Rank 35
2017 score : 2017 score :(2016: Score 26.9, Rank 15) (2016: Score 60.6, Rank 35)27.2 61.1
miwe 2018 103

5.0 Case Studies of Selected Markets
Male Supremacies Evident at Multiple Levels
However, women appear to be severely constrained in Components B: Knowledge Assets & Financial Access and Component C: Supporting Entrepreneurial Conditions. Although women are at par with men in Tertiary Education GER - F/M (100.0, rank 1), incidences of male supremacy are frequently noted across many sub-indicators:
Sub-Indicators Score & Ranking Implications
Component B: Knowledge Assets & Financial Access
Low Inclination for Women to Borrow/Save for Business - F/M 35.0, rank 35
• Females tend to be less inclined to seek financial services
Women Financial Inclusion - F/M 80.6, rank 38
Support for SMEs 47.6, rank 53
• Females generally have less opportunities/access to supporting resources (funds, training & development) compared to their global peers
• Female Access to Financial Services 50.0, rank 37
• Female Access to Financial Programs 40.0, rank 42
• Ease of Access to Business Loans 51.3, rank 42
• Affordability of Financial Services 36.6, rank 56
miwe 2018 104
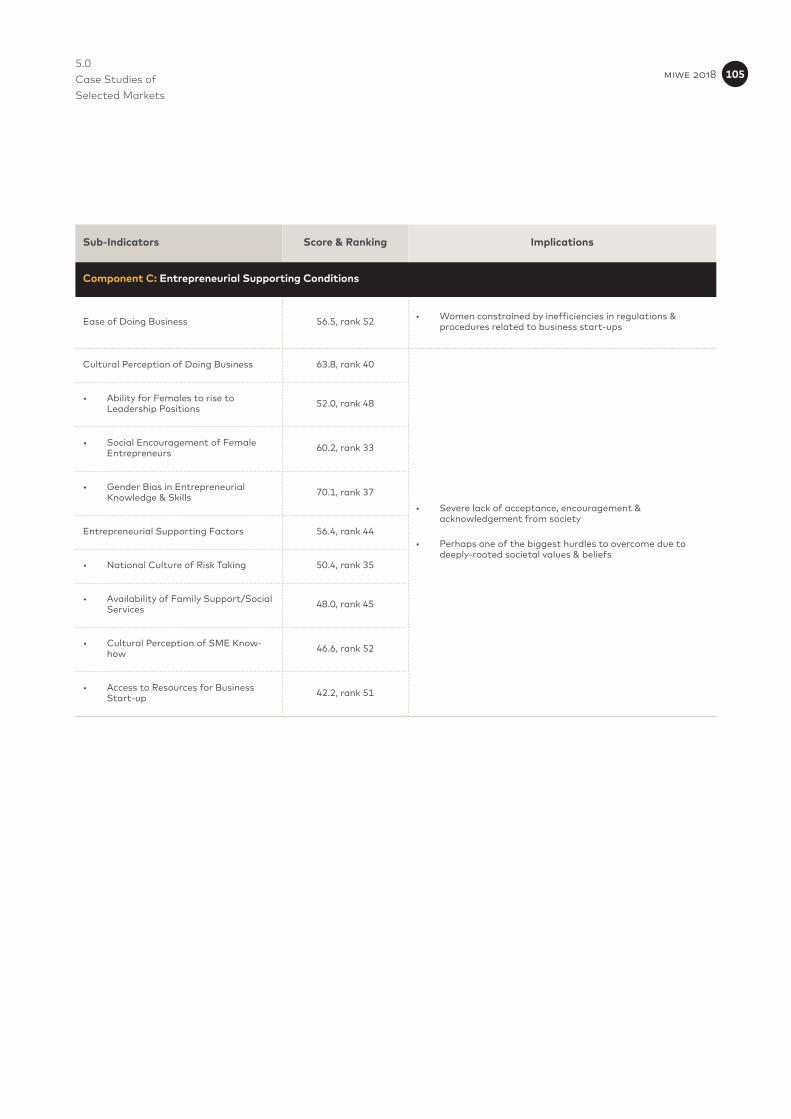
5.0 Case Studies of Selected Markets
Sub-Indicators Score & Ranking Implications
Component C: Entrepreneurial Supporting Conditions
Ease of Doing Business 56.5, rank 52 • Women constrained by inefficiencies in regulations & procedures related to business start-ups
Cultural Perception of Doing Business 63.8, rank 40
• Severe lack of acceptance, encouragement & acknowledgement from society
• Perhaps one of the biggest hurdles to overcome due to deeply-rooted societal values & beliefs
• Ability for Females to rise to Leadership Positions 52.0, rank 48
• Social Encouragement of Female Entrepreneurs 60.2, rank 33
• Gender Bias in Entrepreneurial Knowledge & Skills 70.1, rank 37
Entrepreneurial Supporting Factors 56.4, rank 44
• National Culture of Risk Taking 50.4, rank 35
• Availability of Family Support/Social Services 48.0, rank 45
• Cultural Perception of SME Know-how 46.6, rank 52
• Access to Resources for Business Start-up 42.2, rank 51
miwe 2018 105
5.0 Case Studies of Selected Markets
High Entrepreneurial Activity Rate due to Low GDP Per Capita, Employment Opportunities & Need to Survive
Results from GEM’s findings reveal necessity-driven entrepreneurs to be the most highly represented in Brazil, with nearly half of all female entrepreneurs driven by necessity or the need to survive (47.7%, rank 2, trailing only Malawi women at 51.7%). In fact, from the period of 2013/2014 to 2015/2016, there was an increase of 31% in Female Necessity TEA, compared to an increase of only 2% in Latin America and the Caribbean. This is mostly attributed to the lack of employment opportunities for women (Unemployment rate of Women in Brazil at 15.0%, ILOSTAT database, March 2017).55 This is reflected in the considerably low ‘Female Labor Force Participation Rate - F/M’ (71.7, rank 37), suggesting that only 56.0% of working age females are engaged in the workforce. This is consistent with the general observation that the level of entrepreneurship tends to be higher in markets that are factor or efficiency-driven (Brazil being the latter) where job opportunities and GDP per capita are lower, leading the population to venture into entrepreneurships (usually small-scale and self-employed).
Gender bias is also observed in the fact that women’s representation in the ICT field is very low (0.0%, GEM 2015/2016). Compared to their global peers, Brazilian women are among the most represented in the Government/Health/Education/Social Services sector (30.2% compared to 13.5% in Latin America, 20.5% in MENA, 12.9% in East & South Asia and the Pacific, and 25.6% in Europe & Central Asia).56
Low Investor Activity
GEM’s latest indicator on ‘Investor Activity’ reveals Brazilian women to be among the least inclined to invest in entrepreneurial activities (‘Female Invested’ 1.2% compared to 4.9% for Latin America, MENA & East & South Asia and the Pacific; 5.2% in North America; 9.3% in Sub-Saharan Africa and 3.5% in Europe & Central Asia). Brazilian women are the most likely to invest with a Family/Relative (91.0%, higher than all regional averages).57
miwe 2018 106
5.0 Case Studies of Selected Markets
Lack of Capability to Make Business Thrive
GEM’s 2016 findings on Brazil reveal that although there is little gender divide in terms of new business ventures created (‘Women Entrepreneurial Activity Rate - F/M’ 100.0, rank 1), women appear to have more difficulties in making their ventures thrive. The data showed that while women comprise the majority (51.5%) of new ventures (up to 42 months), men represent the majority (57.3%) of established businesses (more than 42 months). This phenomenon may be associated with the reported conditions by Brazilian entrepreneurs such as: (i) prejudice of gender, (ii) less credibility for women in a business world that is traditionally dominated and associated with men; (iii) difficulties in obtaining finance, and (iv) difficulties in reconciling demands of both family and enterprise.58 Specifically, the percentage of female-led business discontinuation due to the lack of finance is among the highest in the world (30.5%). This is higher than nearly all global peers in GEM’s 2015/2016 study except Tunisia at 32.3% and Philippines at 32.8%.59
Women Less Inclined to Reach out for Help
Brazilian women tend to be less inclined than men to seek help from support bodies such as trade unions and trade associations like Endeavor (39.9% vs. 60.1% in favor of men). Some of the key reasons for not reaching out for help include lack of knowledge or availability of information about these services/support bodies (42.2%), a lack of need (21.5%) or lack of time (12.2%). This points to the need for more effort geared towards informing and educating entrepreneurs to help bolster the success of businesses in the country.60
miwe 2018 107
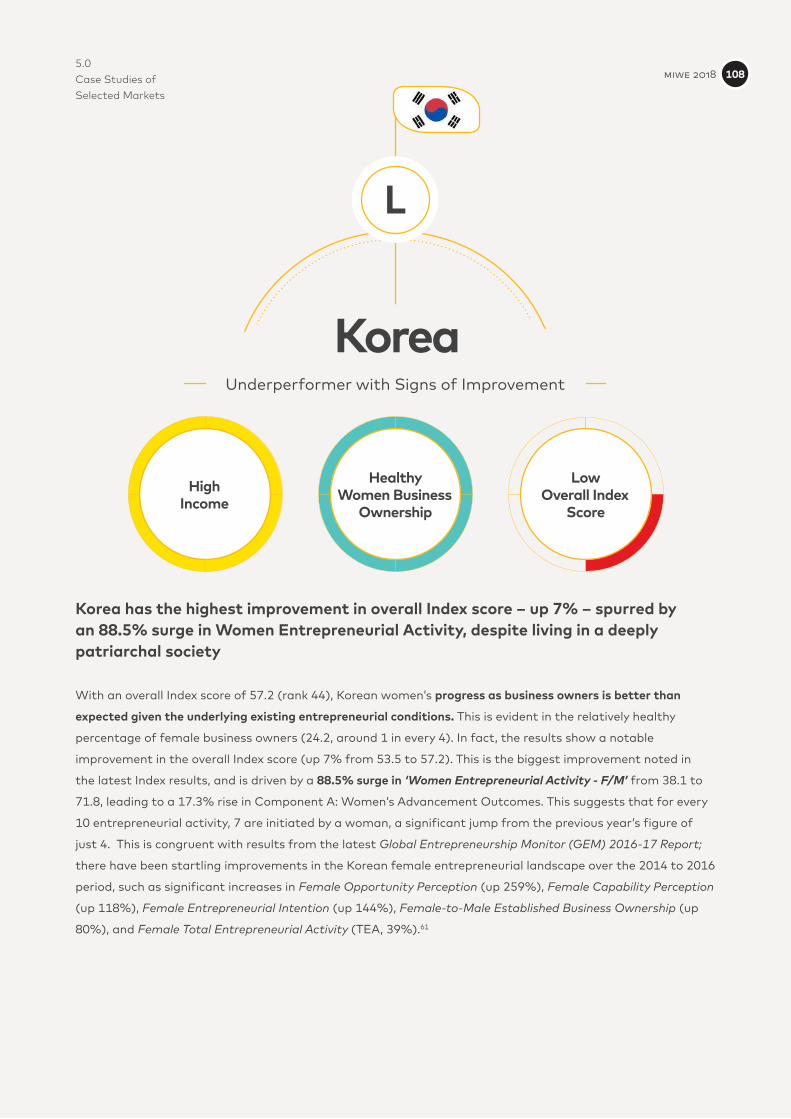
5.0 Case Studies of Selected Markets
Korea has the highest improvement in overall Index score – up 7% – spurred by an 88.5% surge in Women Entrepreneurial Activity, despite living in a deeply patriarchal society
With an overall Index score of 57.2 (rank 44), Korean women’s progress as business owners is better than
expected given the underlying existing entrepreneurial conditions. This is evident in the relatively healthy
percentage of female business owners (24.2, around 1 in every 4). In fact, the results show a notable
improvement in the overall Index score (up 7% from 53.5 to 57.2). This is the biggest improvement noted in
the latest Index results, and is driven by a 88.5% surge in ‘Women Entrepreneurial Activity - F/M’ from 38.1 to
71.8, leading to a 17.3% rise in Component A: Women’s Advancement Outcomes. This suggests that for every
10 entrepreneurial activity, 7 are initiated by a woman, a significant jump from the previous year’s figure of
just 4. This is congruent with results from the latest Global Entrepreneurship Monitor (GEM) 2016-17 Report;
there have been startling improvements in the Korean female entrepreneurial landscape over the 2014 to 2016
period, such as significant increases in Female Opportunity Perception (up 259%), Female Capability Perception
(up 118%), Female Entrepreneurial Intention (up 144%), Female-to-Male Established Business Ownership (up
80%), and Female Total Entrepreneurial Activity (TEA, 39%).61
KoreaUnderperformer with Signs of Improvement
L
HighIncome
Healthy Women Business
Ownership
LowOverall Index
Score
miwe 2018 108
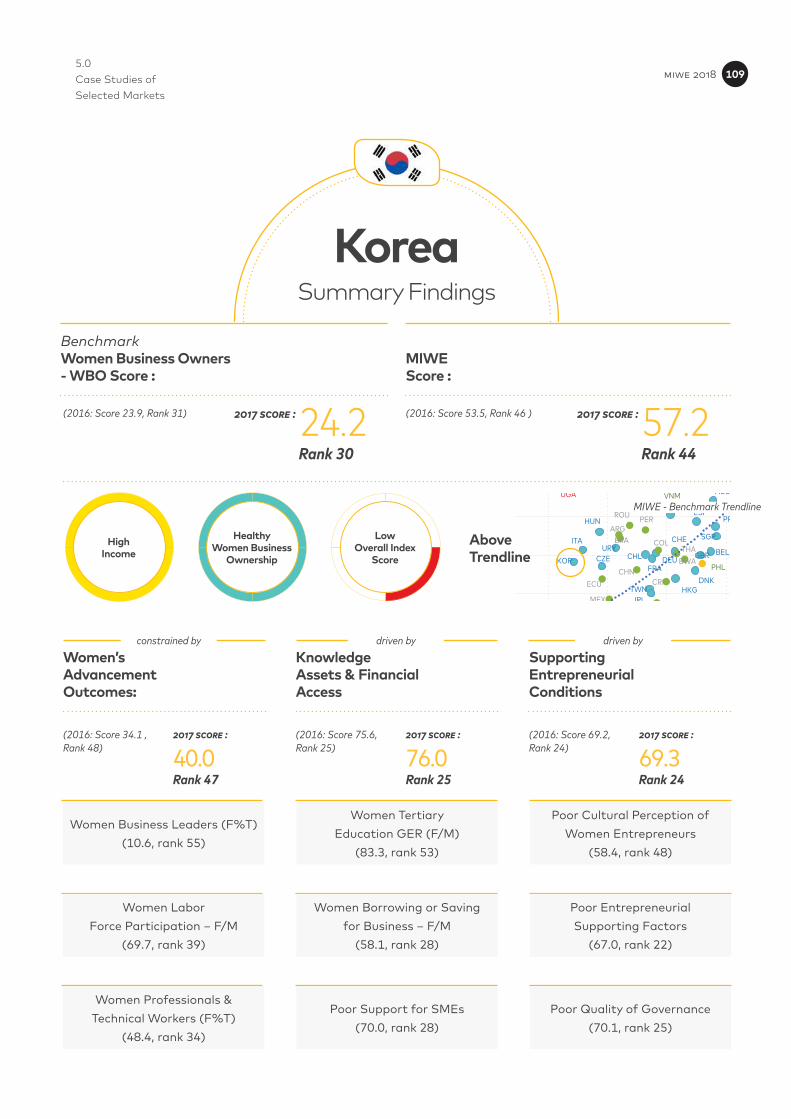
5.0 Case Studies of Selected Markets
Women’sAdvancementOutcomes:
KnowledgeAssets & FinancialAccess
SupportingEntrepreneurial Conditions
Women Business Leaders (F%T)(10.6, rank 55)
Women TertiaryEducation GER (F/M)
(83.3, rank 53)
Poor Cultural Perception of Women Entrepreneurs
(58.4, rank 48)
Women LaborForce Participation – F/M
(69.7, rank 39)
Women Borrowing or Savingfor Business – F/M
(58.1, rank 28)
Poor EntrepreneurialSupporting Factors
(67.0, rank 22)
Women Professionals &Technical Workers (F%T)
(48.4, rank 34)
Poor Support for SMEs(70.0, rank 28)
Poor Quality of Governance(70.1, rank 25)
Rank 47 Rank 25 Rank 24
2017 score :(2016: Score 34.1 , Rank 48)
2017 score : 2017 score :(2016: Score 75.6, Rank 25)
(2016: Score 69.2, Rank 24)
KoreaSummary Findings
40.0 76.0 69.3
driven bydriven byconstrained by
HighIncome
Healthy Women Business
Ownership
LowOverall Index
Score
RUS
UGA
BGD
GHA
AUS
HKG
JPN
KOR
NZL
SGP
TWN
BELCZE
DNKFRA
DEU
HUN
IRL
ITA
POLPRT
ESP
SWE
CHE
GBRCHLURY
ISR
SAU ARE
CAN
USACHN
MYS
THA
ROU
TUR
ARGBRA COL
CRIECU
MEX
PER
DZAIRN
BWA
ZAF
IDN
PHL
EGY
TUNIND
VNM
NGA
ETH
MWI
AboveTrendline
MIWE - Benchmark Trendline
MIWEScore :
BenchmarkWomen Business Owners- WBO Score :
Rank 30 Rank 44
2017 score : 2017 score :(2016: Score 23.9, Rank 31) (2016: Score 53.5, Rank 46 )24.2 57.2
miwe 2018 109
5.0 Case Studies of Selected Markets
The substantial narrowing of gender divide in Korea marks a significant milestone, given that women here reside in a deeply patriarchal society where opportunities for women in business leadership are lacking (F%T, 10.5% in 2016 and 2017) and supportive conditions for SMEs and Quality of Governance are poor compared to their global peers (around 70 for both indicators in 2016 and 2017). The recent spike in Korean women’s participation in entrepreneurial activity may be explained by various factors such as an increase in Female Opportunity and Capability Perceptions, Female Undeterred by Fear of Failure, and Female Intentions to start a business within 3 years. GEM’s study undertaken in 2016 also revealed a narrowing in gender divide between Korean men and women who are currently an owner/manager of an established business.
Such progression may have also been spurred by an increase in social media coverage and publicity rendered to successful female executives in the country’s two biggest and women-friendly internet companies, Naver and Kakao. The launch of the workplace gender equality task force in 2015 under the leadership of the previous President Park Gun-Hye may also have fueled women’s entrepreneurial spirit and drive. Looking ahead, the recent pledges of support for Women’s Entrepreneurship Facility in developing countries by the current President Moon at the G-20 Summit in July 2017, coupled with his economic goal of creating 160,000 new jobs by fostering innovative entrepreneurs throughout his 5-year tenure are positive signs for Korean women.
miwe 2018 110
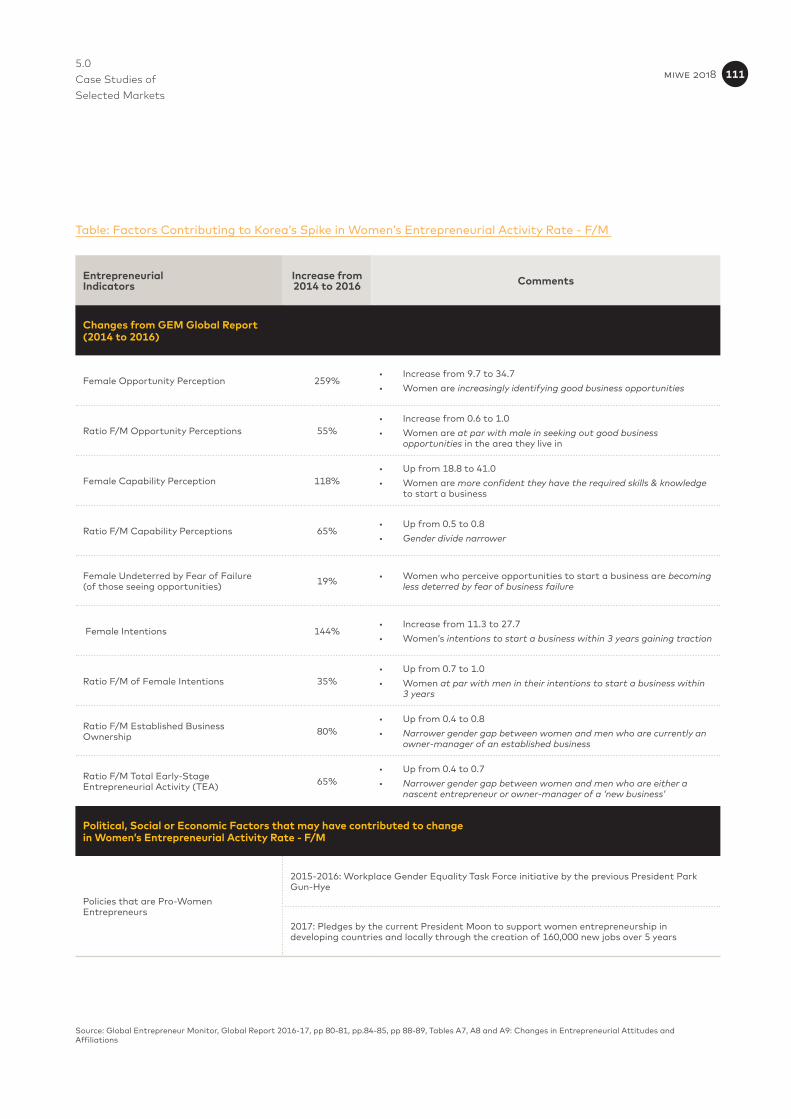
5.0 Case Studies of Selected Markets
Table: Factors Contributing to Korea’s Spike in Women’s Entrepreneurial Activity Rate - F/M
EntrepreneurialIndicators
Increase from 2014 to 2016 Comments
Changes from GEM Global Report(2014 to 2016)
Female Opportunity Perception 259%• Increase from 9.7 to 34.7• Women are increasingly identifying good business opportunities
Ratio F/M Opportunity Perceptions 55%• Increase from 0.6 to 1.0• Women are at par with male in seeking out good business
opportunities in the area they live in
Female Capability Perception 118%• Up from 18.8 to 41.0• Women are more confident they have the required skills & knowledge
to start a business
Ratio F/M Capability Perceptions 65%• Up from 0.5 to 0.8 • Gender divide narrower
Female Undeterred by Fear of Failure (of those seeing opportunities) 19% • Women who perceive opportunities to start a business are becoming
less deterred by fear of business failure
Female Intentions 144%• Increase from 11.3 to 27.7• Women’s intentions to start a business within 3 years gaining traction
Ratio F/M of Female Intentions 35%• Up from 0.7 to 1.0• Women at par with men in their intentions to start a business within
3 years
Ratio F/M Established Business Ownership 80%
• Up from 0.4 to 0.8• Narrower gender gap between women and men who are currently an
owner-manager of an established business
Ratio F/M Total Early-Stage Entrepreneurial Activity (TEA) 65%
• Up from 0.4 to 0.7• Narrower gender gap between women and men who are either a
nascent entrepreneur or owner-manager of a ‘new business’
Political, Social or Economic Factors that may have contributed to changein Women’s Entrepreneurial Activity Rate - F/M
Policies that are Pro-Women Entrepreneurs
2015-2016: Workplace Gender Equality Task Force initiative by the previous President Park Gun-Hye
2017: Pledges by the current President Moon to support women entrepreneurship in developing countries and locally through the creation of 160,000 new jobs over 5 years
Source: Global Entrepreneur Monitor, Global Report 2016-17, pp 80-81, pp.84-85, pp 88-89, Tables A7, A8 and A9: Changes in Entrepreneurial Attitudes and Affiliations
miwe 2018 111
5.0 Case Studies of Selected Markets
Deterrents: Low Inclination as Entrepreneurial Investors, Lack of Funding & Perceived Capabilities & Opportunities
However, GEM’s findings suggest that compared to their global peers, Korean women demonstrate a low tendency towards investing in entrepreneurs. Compared to their male counterparts, they are less inclined to invest (F/M Invested ratio of 0.61) and also invest considerably less than women in other markets (Female Median Investment of $78 compared to $7,565 in China, and $12,887 in Hong Kong). When they do invest, they are more likely to invest in a family/other relative, work colleague or a friend/neighbor. This could be due to constraints such as a lack of funds available, or fear of business failure. It is also observed that women in the wealthy economies of Korea, as well as Saudi Arabia, United Arab Emirates and Japan continue to be suppressed in their advancement as entrepreneurs due in large to poor Women Advancement Outcomes (Component A) such as women’s representation as business leaders, professionals & technical workers, and labor force participation.
Although there has been a marked increase in women’s perception of business opportunities (up 259% from 9.7 in 2014 to 34.7 in 2016), this is still low compared to their global peers. Similarly, Korean women’s perception of their skills and capabilities in starting and running a business compared to men is weaker (Ratio F/M Capability Perceptions 0.5 in 2014 and 0.8 in 2016). GEM’s 2016 results suggest a lack of funding among women business owners. This is evident in the Ratio F/M Discontinued Businesses due to Unprofitability (1.1) and Lack of Finance (1.7), and high percentage of Female Businesses Discontinued due to Unprofitability (60.2%).
miwe 2018 112

5.0 Case Studies of Selected Markets
Although Emirati women’s engagement in entrepreneurial activities is lower than men, they display commendable capability in bringing their business overseas with more than 75% of female-owned businesses going global
Although women in the UAE have equal opportunities to higher-level education and are among the most
educated and qualified cohorts in the world (‘Women Tertiary Education GER - F/M’ 100.0), they trail severely
in other aspects such as access to financial privileges, role as business owners/leaders/professionals/
technicians, and participation in the labor force. This is reflected in UAE’s relative position in the Matrix (below
the MIWE - Benchmark Trendline), suggesting women are constrained by in their ability to thrive as business
owners/entrepreneurs.
Data suggests that women comprise an astounding 80 to 90% of student population at the two of the nation’s 3 federal institutions of higher learning. The proportion of females who graduate is also higher than males: of the 1,410 students who earned an undergraduate degree at Zayed University in 2015-2016, 88% were women.62 Specifically, Emirati women’s monumental strides at all levels of the education system are enabled by 2 factors: (i) the presence of strong support for education from the rulers of the Emirates; and (ii) the availability of gender-segregated and cost-free primary, secondary, and tertiary education, which allows women of different socioeconomic and family circumstances to gain access to higher education.63
United Arab EmiratesUnderperformer
M
HighIncome
Very LowWomen Business
Ownership
PoorOverall Index
Score
miwe 2018 113
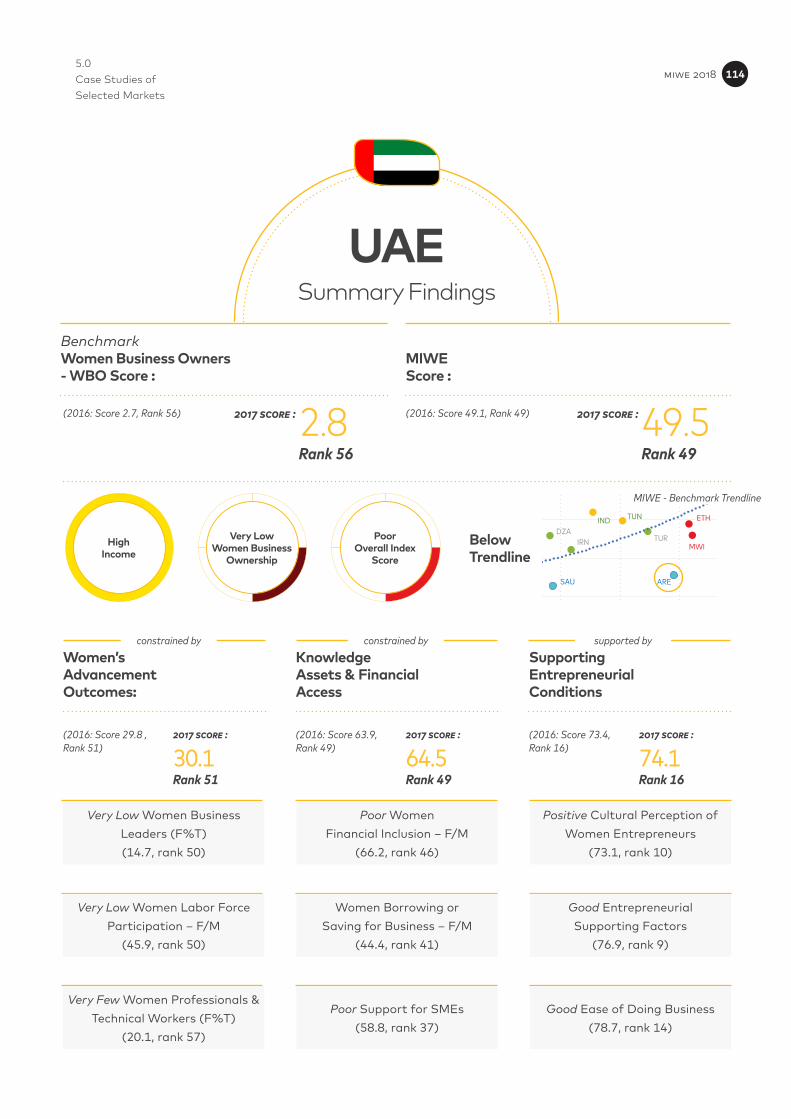
5.0 Case Studies of Selected Markets
Women’sAdvancementOutcomes:
KnowledgeAssets & FinancialAccess
SupportingEntrepreneurial Conditions
Very Low Women Business Leaders (F%T)(14.7, rank 50)
Poor WomenFinancial Inclusion – F/M
(66.2, rank 46)
Positive Cultural Perception of Women Entrepreneurs
(73.1, rank 10)
Very Low Women Labor Force Participation – F/M
(45.9, rank 50)
Women Borrowing orSaving for Business – F/M
(44.4, rank 41)
Good EntrepreneurialSupporting Factors
(76.9, rank 9)
Very Few Women Professionals & Technical Workers (F%T)
(20.1, rank 57)
Poor Support for SMEs(58.8, rank 37)
Good Ease of Doing Business(78.7, rank 14)
Rank 51 Rank 49 Rank 16
2017 score :(2016: Score 29.8 , Rank 51)
2017 score : 2017 score :(2016: Score 63.9, Rank 49)
(2016: Score 73.4, Rank 16)
UAESummary Findings
30.1 64.5 74.1
supported byconstrained byconstrained by
HighIncome
Very LowWomen Business
Ownership
PoorOverall Index
Score
RUS
UGA
BGD
GHA
AUS
HKG
JPN
KOR
NZL
SGP
TWN
BELCZE
DNKFRA
DEU
HUN
IRL
ITA
POLPRT
ESP
SWE
CHE
GBRCHLURY
ISR
SAU ARE
CAN
USACHN
MYS
THA
ROU
TUR
ARGBRA COL
CRIECU
MEX
PER
DZAIRN
BWA
ZAF
IDN
PHL
EGY
TUNIND
VNM
NGA
ETH
MWIBelowTrendline
MIWE - Benchmark Trendline
MIWEScore :
BenchmarkWomen Business Owners- WBO Score :
Rank 56 Rank 49
2017 score : 2017 score :(2016: Score 2.7, Rank 56) (2016: Score 49.1, Rank 49)2.8 49.5
miwe 2018 114
5.0 Case Studies of Selected Markets
However, women’s participation in the workforce is less compared to men (‘Women Labor Force Participation Rate - F/M’ 89.3%). In the Abu Dhabi region, 36.6% of Emirati women were in the workforce, compared to 65.2% for men (Statistic Centre Abu Dhabi Statistical Yearbook 2017).64 At 2.8%, women’s business ownership is the 2nd lowest in the index (surpassing only Saudi Arabia at 1.4%). The extremely poor conditions and factors that shape the social, economic and political landscape in the UAE are mirrored in the low scores for Component A: Women’s Advancement Outcomes (30.1, rank 51) and Component B: Knowledge Assets & Financial Access (64.5, rank 49).
The results and ratings for Component C: Supporting Entrepreneurial Conditions (74.1, rank 16) are more encouraging, with society being fairly receptive of women entrepreneurs (‘Cultural Perception of Women Entrepreneurs’ 73.1, rank 10). The sub-indicators also point to relatively acceptable ratings for ‘Ease of Doing Business’ (78.7, rank 14) and ‘Entrepreneurial Supporting Factors’ (76.9, rank 9). These underlying conditions are comparatively more favorable than those in regional MENA peers such as Saudi Arabia, Egypt and Iran. In addition, the Federation’s target-oriented policies towards women’s empowerment have spurred a strong desire amongst women to become financially independent and professionally successful. According to the UNDP’s Gender-Related Development Index for 2007/2008, the UAE ranks 43rd among 177 countries and 29th in the world under the Gender Empowerment Measure (GEM), the best rating in the Arab World. UAE women also participate actively in the political sphere via representation in the Federal National Council (FNC), local consultative councils, and in the formation and shaping of public policy through their roles as ministers in the federal Cabinet, ministries and local government bodies. 65
Under the Federation’s Constitution, women have the same legal status, claim to titles, access to education, healthcare and social welfare and the same right to practice professions as men. However, women appear to be marginalized in or less inclined to assume business leadership and professional/technical roles (14.7% and 20.1% of total, respectively). Emirati women’s motivation towards entrepreneurship is low compared to men: ‘Women Entrepreneurial Activity Rate - F/M’ (60.0, rank 33).
miwe 2018 115
5.0 Case Studies of Selected Markets
Strengths & Opportunities: High Motivation to Grow Businesses, Keen on Opportunities
On a positive note, GEM’s findings (2015-2016) suggest that although Emirati women’s engagement in entrepreneurial activities is lower than men (60.0, similar to other Middle Eastern markets such as Saudi Arabia at 80.0 and Tunisia at 40.0), those that do become business owners report high ambitions and drive to grow their businesses by expanding their payroll by 6 or more over the next 5 years. They also display commendable capability in bringing their businesses overseas with more than 75% of female-owned businesses considered global (GEM Global Report 2016-17). When it comes to seeking out good business opportunities, women surpass their male counterparts (‘Ratio F/M Opportunity Perceptions’ of 1.3). In fact, when it comes to business failure, Emirati women appear to have a bigger appetite for risk (‘Ratio F/M Undeterred by Fear of Failure’ 1.1).
Key Hindrances
One of the most disappointing elements in the UAE’s entrepreneurial landscape is the fact that in spite of women’s high knowledge assets, protracted constraints such as social/cultural bias against women entrepreneurs, lower access to financial privileges, weaker perception of required business capabilities (‘Ratio F/M Capability Perceptions’ of 0.7), lower opportunities as business leaders and professionals (compared to men) continue to hinder women’s ability to thrive in the business world.
miwe 2018 116
DescriptionFootnote No. DescriptionFootnote No.
Global Entrepreneurship Monitor Report - GEM 2017 Report
Sourced from International Labor Organization, 2008-2015, projected to 2016
International Labor Organization (ILO), 2008-2016 projected to 2017
Ghana is one of the latest 3 newly added markets including Malawi and Nigeria.
Global Entrepreneurial Monitor, Entrepreneurial Behaviour and Attitudes. Data for Ghana are from 2012, Uganda 2014 and Vietnam 2015.
Global Entrepreneurial Monitor - Global Report 2016/17, Available Online: http://www.gemconsortium.org/report/49812
Bobrowska, S. & Conrad, H. “Discourses of female entrepreneurship in the Japanese Business Press - 25 years and little progress”, Journal of Japanese Studies, Vol. 37, 2017 - Issue 1, p.1-22. Published online 19 March 2017. Available online: http://www.tandfonline.com/doi/full/10.1080/10371397.2017.1293474
Global Entrepreneurial Monitor, Canada, “Entrepreneurial Behaviour and Attitudes”, http://www.gemconsortium.org/country-profile/49
Global Entrepreneur Monitor Global Report 2016-17, p.18, Figure 4: Plot of Female vs Male Total Entrepreneurial Activity Rates, GEM 2015-2016
Global Entrepreneur Monitor, Nigeria Entrepreneurial Behavior and Attitudes, 2013. Available Online: http://www.gemconsortium.org/country-profile/93
Premium Times, “Nigeria’s unemployment rate worsens, rises to 14.2 per cent”, 6 June 2017, Available online: https://www.premiumtimesng.com/business/business-news/233172-%E2%80%8Enigerias-unemployment-rate-worsens-rises-to-14-2-per-cent.html
Trading Economics Nigeria Annual Growth Rate and National Statistics Bureau, https://tradingeconomics.com/nigeria/gdp-growth-annual The economy rebounded 0.55% YoY in Q2 2017, the first expansion in 5 quarters, driven by a turnaround in the oil sector.
Global Entrepreneur Monitor Global Report 2016-17, p.32.
Global Entrepreneur Monitor Global Report 2016-17, p.36.
Global Entrepreneur Monitor Ghana - 2012, Insights for Policy. The other 3 markets are Nigeria, Ecuador and Panama. Available online: http://www.gemconsortium.org/country-profile/65
GEM Canada Report 2016, p.5. http://www.gemconsortium.org/report/49847
GEM New Zealand, Entrepreneurial Behaviour and Attitudes, 2005. http://www.gemconsortium.org/country-profile/137
OECD Women Entrepreneurship Key Findings: New Zealand, “Who wants to be an entrepreneur?”, https://www.oecd.org/std/business-stats/EaG-New-Zealand-Eng.pdf
OECD Women Entrepreneurship Key Findings: New Zealand, “Who wants to be an entrepreneur?”, https://www.oecd.org/std/business-stats/EaG-New-Zealand-Eng.pdf
Pg. 3
Pg. 18
Pg. 20
Pg. 30
Pg. 31
Pg. 34
Pg. 47
Pg. 47
Pg. 53
Pg. 54
Pg. 55
Pg. 64
Pg. 65
1
2
3
4
5
6
7
8
9
10
11
12
13
14
15
16
17
18
19
Endnotes miwe 2018 117
ENDNOTES
DescriptionFootnote No. DescriptionFootnote No.
The Entrepreneurial Challenge - A comparative study of entrepreneurial dynamics in China, Europe and the US - 2016. p.20 http://www.gemconsortium.org/country-profile/110 This include entrepreneurs who are actively involved in setting up businesses they will own or co-own.
Global Entrepreneur Report - Global Report 2016-17, Table A5: Entrepreneurial Attitudes and Affiliations, p.72-73
The Entrepreneurial Challenge - A comparative study of entrepreneurial dynamics in China, Europe and the US - 2016. p.22. http://www.gemconsortium.org/country-profile/110
GEM Canada Report 2016, p.28. http://www.gemconsortium.org/report/49847
GEM Canada Report 2016, p.18. http://www.gemconsortium.org/report/49847
Global Entrepreneurial Monitor, Canada, “Entrepreneurial Behaviour and Attitudes”, http://www.gemconsortium.org/country-profile/49
GEM Canada Report 2016, p.7. http://www.gemconsortium.org/report/49847
GEM Canada Report 2016, p.56 to 58. http://www.gemconsortium.org/report/49847
GEM Global Report, Table A9
GEM Global Report, Table A2
GEM Global Report 2016-2017, Table A8 and A6
The other markets that are very close to the Benchmark Trendline are Thailand, Germany, Mexico, Turkey, Iran and Egypt.
GEM Global Report 2016-17, Tables A1 and A5
European Commission “Statistical Data on Women Entrepreneurs in Europe”, September 2014, p.19. Micro enterprises have less than 10 employees.
GEM Global Report 2016-17, Tables A6
Entrepreneurship at a Glance 2016, “Women entrepreneurship - Key Findings: Portugal”, Figure 6, forthcoming, OECD Publishing, Paris. https://www.oecd.org/std/business-stats/EaG-Portugal-Eng.pdf
de Almeida Mariz, M.E. and Bógus, L.M.M. (2014) Portuguese Women: Entrepreneurs in Sao Paulo City. Open Journal of Social Sciences, 2, p.314. http://dx.doi.org/10.4236/jss.2014.24034
GEM Global Report 2016-2017, Table A2 - Intentions, and GEM Report on Portugal http://www.gemconsortium.org/country-profile/100
GEM 2016 Results & Ranking, Entrepreneurial Behaviour and Attitudes - Belgium, http://www.gemconsortium.org/country-profile/41
GEM Global Report, Table A8
“Gender gap narrows among entrepreneurs as women excel with start ups”, 4 July 2017, Quoted findings from study by Aston University. http://www.independent.co.uk/news/business/news/gender-gap-entrepreneurs-narrowing-male-female-numbers-start-ups-report-a7823491.html
OECD, Women Entrepreneurship Key Findings: Spain, “Who wants to be an entrepreneur”, https://www.oecd.org/std/business-stats/EaG-Spain-Eng.pdf
Pg. 66
Pg. 68
Pg. 71
Pg. 73
Pg. 75
Pg. 76
Pg. 78
Pg. 80
Pg. 83
Pg. 88 Pg. 91
20
21
22
23
24
25
26
27
28
29
30
31
32
33
34
35
36
37
38
39
40
41
miwe 2018 118
ENDNOTES
DescriptionFootnote No. DescriptionFootnote No.
The World Bank, Ease of Doing Business Database, 2017
Amu, N. J. “The role of women in Ghana’s Economy”, Friedrich Ebert Stiftung, p.3. Available Online: http://library.fes.de/pdf-files/bueros/ghana/02990.pdf
The 8 markets with no gender gap in Women Entrepreneurial Activity Rate - F/M are: Brazil, Mexico, Indonesia, Philippines, Vietnam, Ghana, Nigeria and Uganda.
The World Bank, Brazil Female Unemployment Rate, Modeled ILO estimate, March 2017, https://data.worldbank.org/indicator/SL.UEM.TOTL.FE.ZS?locations=BR
GEM 2015/2016 Report, Table A4
GEM 2015/2016 Report, Table A6
Global Entrepreneur Monitor Brazil 2016 Report, http://www.gemconsortium.org/country-profile/46
GEM 2015/2016 Report, Table A2
Global Entrepreneur Monitor Brazil 2016 Report, p.51, http://www.gemconsortium.org/country-profile/46
Global Entrepreneurial Monitor - Global Report 2016/17, Available Online: http://www.gemconsortium.org/report/49812
The National News Online, “Women continue to dominate UAE federal colleges and universities”, 26 Aug 2017, https://www.thenational.ae/uae/women-continue-to-dominate-uae-federal-colleges-and-universities-1.622982
The Perception of Opportunities among the general population 18-64 including both males and females is very similar in GEM’s 2016 results: 25.6%, rank 57 out of 65. http://www.gemconsortium.org/country-profile/109
Global Entrepreneur Monitor - National Experts Survey (GEM-NES) 2013
World Economic Forum - Global Gender Gap 2017, and Global Entrepreneur Monitor - National Experts Survey (GEM-NES) 2013
GEM Global Report 2016-17, Table A1 and A5.
WikiGender University, “Women’s entrepreneurship in Ghana”, Ghana Living Standard Survey GLSS6, 2014, http://www.wikigender.org/wiki/womens-entrepreneurship-in-ghana/
Amu, N. J. “The role of women in Ghana’s Economy”, Friedrich Ebert Stiftung, p.3. Available Online: http://library.fes.de/pdf-files/bueros/ghana/02990.pdf
Women and Youth Spearheading Business Creation, GEM Ghana Report “Insights for Policy”, 2012. http://www.gemconsortium.org/country-profile/65
Amu, N. J. “The role of women in Ghana’s Economy”, Friedrich Ebert Stiftung, p.3. Available Online: http://library.fes.de/pdf-files/bueros/ghana/02990.pdf
Women and Youth Spearheading Business Creation, GEM Ghana Report “Insights for Policy”, 2012. http://www.gemconsortium.org/country-profile/65
Harrison, H.M. “ABANTU for Development and Change”, African Gender Institute, http://agi.ac.za/sites/agi.ac.za/files/fa_4_profile_4.pdf
52
53
54
55
56
57
58
59
60
61
62
Pg. 92
Pg. 96
Pg. 98
Pg. 100
Pg. 101
Pg. 101
Pg. 102
Pg. 106
Pg. 107
Pg. 108
Pg. 113
42
43
44
45
46
47
48
49
50
51
miwe 2018 119
ENDNOTES
DescriptionFootnote No.
“Abdulla, Fatima (2006), “Education and Employment Among Women in the UAE”, The Boston College Center for International Higher Education, International Higher Education - A Quarterly Publication, http://www.uae-embassy.org/sites/default/files/Women_in_the_UAE_Eng.pdf
The National News Online, “Women continue to dominate UAE federal colleges and universities”, 26 Aug 2017, https://www.thenational.ae/uae/women-continue-to-dominate-uae-federal-colleges-and-universities-1.622982
Report on “Women in the United Arab Emirates: A Portrait of Progress”, Prepared for the Ministry of State for Federal National Council Affairs, p.3. http://www.uae-embassy.org/sites/default/files/Women_in_the_UAE_Eng.pdf
63
64
65
Pg. 113
Pg. 117
miwe 2018 120
MastercardIndex of WomenEntrepreneurs(MIWE) 2018
MA
ST
ER
CA
RD
IND
EX
OF
WO
ME
N E
NT
RE
PR
EN
EU
RS
2018
www.newsroom.mastercard.com


