+ All Categories
Home > Documents > Masters of Applied Research HL84eprints.qut.edu.au/49143/1/Dominic_Orth_Thesis.pdf · pointing of...

Masters of Applied Research HL84eprints.qut.edu.au/49143/1/Dominic_Orth_Thesis.pdf · pointing of...

Date post: 11-Jul-2020
Category:
Upload: others
View: 1 times
Download: 0 times
Share this document with a friend
129
Masters of Applied Research HL84 Dominic Orth BAppSc (HMS) with Honours School of Human Movement Studies 2011 INTERACTING CONSTRAINTS OF DEFENSIVE PRESSURE AND BALL DISPLACEMENT TRAJECTORIES SHAPE LOCOMOTOR POINTING BEHAVIOURS IN ASSOCIATION FOOTBALL
Transcript

Masters of Applied Research HL84

Dominic Orth BAppSc (HMS) with Honours

School of Human Movement Studies

2011

INTERACTING CONSTRAINTS OF DEFENSIVE PRESSURE AND BALL

DISPLACEMENT TRAJECTORIES SHAPE LOCOMOTOR POINTING

BEHAVIOURS IN ASSOCIATION FOOTBALL

2

Key Words Kicking in football, ecological constraints, representative design, perception-

action coupling,

3

Abstract Performance of locomotor pointing tasks (goal-directed locomotion) in sport is

typically constrained by dynamic factors, such as positioning of opponents and

objects for interception. In the team sport of association football, performers

have to coordinate their gait with ball displacement when dribbling and when

trying to prevent opponent interception when running to kick a ball. This thesis

comprises two studies analysing the movement patterns during locomotor

pointing of eight experienced youth football players under static and dynamic

constraints by manipulating levels of ball displacement (ball stationary or

moving) and defensive pressure (defenders absent, or positioned near or far

during performance). ANOVA with repeated measures was used to analyse

effects of these task constraints on gait parameters during the run-up and cross

performance sub-phase. Experiment 1 revealed outcomes consistent with

previous research on locomotor pointing. When under defensive pressure,

participants performed the run-up more quickly, concurrently modifying footfall

placements relative to the ball location over trials. In experiment 2 players

coordinated their gait relative to a moving ball significantly differently when

under defensive pressure. Despite no specific task instructions being provided

beforehand, context dependent constraints interacted to influence footfall

placements over trials and running velocity of participants in different conditions.

Data suggest that coaches need to manipulate task constraints carefully to

facilitate emergent movement behaviours during practice in team games like

football.

4

Peer Reviewed Conference Proceedings Orth, D., Davids, K., Renshaw, I., & Vilar, L. (2011). Constraints on emergence of

player-ball coordination patterns in association football. Paper presented at the

7th World Congress on Science and Football, May 26 – 30, 2011: In Science and

Football, 8 (Suppl. 1), 136. Nagoya, Japan: Japanese Society of Science and

Football.

This oral presentation was awarded 2nd Prize in the Tom Reilly

New Investigation Award at the 7th World Congress on Science

and Football 2011

5

Article Submissions under Review Orth D, Davids K, Araújo D, Renshaw I, Passos P. Interacting constraints of

defensive pressure and ball position on emergence of player-ball angle of

approach in a kicking task. Submitted 2011.

Orth D, Davids D, Renshaw I, Araújo D, Passos P. Emergence of locomotor

pointing behaviour in the football cross under defensive pressure. Submitted

2011.

6

Table of Contents KEY WORDS ......................................................................................................... 2 

ABSTRACT ............................................................................................................ 3 

PEER REVIEWED CONFERENCE PROCEEDINGS ............................................................ 4 

ARTICLE SUBMISSIONS UNDER REVIEW ..................................................................... 5 

TABLE OF CONTENTS .............................................................................................. 6 

LIST OF FIGURES ................................................................................................. 10 

LIST OF TABLES ................................................................................................... 13 

ACKNOWLEDGMENTS ........................................................................................... 14 

STATEMENT OF ORIGINAL AUTHORSHIP .................................................................... 16 

CHAPTER 1: INTRODUCTION ................................................................................... 17 

CHAPTER 1: INTRODUCTION ................................................................................... 17 

1.  CONSTRAINTS ON EMERGENT BEHAVIOURS IN SPORT PERFORMANCE .............................. 17 

1.1 THE ECOLOGICAL SCALE OF ANALYSIS 17 

1.2 ECOLOGICAL PSYCHOLOGY: PERCEPTION-ACTION COUPLING 18 

1.2.1 Direct Perception ........................................................................................................... 18 

1.2.2 Affordances and Intentionality ...................................................................................... 19 

1.2.3 Prospective Control ........................................................................................................ 22 

1.2.4 Theoretical Summary ..................................................................................................... 23 

7

1.2.4.1 Ecological Psychology ................................................................................................. 23 

1.3 COMPLEX DYNAMIC SYSTEMS 24 

1.3.1 Complex Systems in Nature .......................................................................................... 25 

1.3.2 Self-Organisation in Sport Performance ........................................................................ 28 

1.3.3 Constraints on Movement Coordination ....................................................................... 31 

1.3.4 Theoretical Summary ..................................................................................................... 33 

1.3.4.1 Complex Dynamic Systems ........................................................................................ 33 

1.3.4.2 Ecological Dynamics: Representative Sub-Phases from Sport Reveal Coordination

Processes .................................................................................................................................. 35 

1.4 LOCOMOTOR POINTING: RUNNING TO PERFORM TASKS 38 

1.4.1 Visual Regulation of Gait in Locomotor Pointing ........................................................... 38 

1.4.2 Control Strategies .......................................................................................................... 42 

1.4.2.1 Step Length Adjustment ............................................................................................. 42 

1.4.3 Constraints Shaping the Approach to Perform Nested Tasks ...................................... 44 

1.4.3.1 Differences in findings between Laboratory Simulations and Natural Locomotor

Pointing Task Performance ...................................................................................................... 44 

1.4.3.2 The Role of Visual Information in Guiding Locomotor Pointing Behaviour ............ 48 

1.4.3.3 Task Constraints that have Manipulated Running Velocity ..................................... 52 

1.4.3.4 Instructional Constraints on Locomotor Pointing ..................................................... 54 

1.4.4 Summary of Locomotor Pointing Research................................................................... 55 

1.5 CONCLUSIONS 57 

1.5.1 Research Issues Examined in this Thesis ..................................................................... 57 

CHAPTER 2: STUDY 1 .......................................................................................... 59 

8

2.  EFFECTS OF PRESENCE AND PROXIMITY OF THE NEAREST DEFENDER ON A PERFORMER’S

GAIT PATTERN WHEN RUNNING TO CROSS A STATIONARY BALL ................................................... 59 

2.1 INTRODUCTION 59 

2.2 METHODS 62 

2.2.1 Participants .................................................................................................................... 62 

2.2.2 Task ................................................................................................................................ 63 

2.2.3 Apparatus ....................................................................................................................... 64 

2.2.4 Data Capture .................................................................................................................. 66 

2.2.5 Experimental Design ...................................................................................................... 68 

2.3 RESULTS 70 

2.3.1 Outcomes ....................................................................................................................... 72 

2.3.2 Foot/Ball Distance Variability and Step Length Analysis .............................................. 73 

2.3.2.1 Foot/Ball Distance Variability ..................................................................................... 73 

2.3.2.2 Absolute Step Lengths ................................................................................................ 75 

2.3.2.3. Absolute Foot/Ball Distance ...................................................................................... 78 

2.3.3 Displacement Velocity ................................................................................................... 80 

2.4 DISCUSSION 83 

2.4.1 Effect of Dynamic Constraints in the Run-Up to perform a cross pass in Football ...... 83 

2.5 CONCLUSIONS AND FUTURE RESEARCH 88 

CHAPTER 3: STUDY 2 .......................................................................................... 91 

3.  EFFECTS OF DIFFERENT LEVELS OF DEFENSIVE PRESSURE ON EMERGENT BEHAVIOURS OF

BALL-CARRIERS IN FOOTBALL ......................................................................................................... 91 

3.1 INTRODUCTION 91 

9

3.2 METHODS 92 

3.2.1 Task ................................................................................................................................ 93 

3.3 RESULTS 95 

3.3.1 Outcomes ....................................................................................................................... 96 

3.3.2 Foot/Ball Distance and Step Length Control Analysis .................................................. 98 

3.3.2.1 Foot/Ball Distance Variability ..................................................................................... 98 

3.3.2.2 Absolute Step Lengths ............................................................................................. 100 

3.3.3 Velocity Change during the Dribble to Cross ............................................................... 103 

3.3.4 Final Player-Byline Distance at the Cross .................................................................... 105 

3.4 DISCUSSION 106 

3.4.1 Funnel-Shaped Control During Dribbling .................................................................... 106 

3.4.2 Effect of Defensive Pressure on Gait Parameters While Dribbling ............................. 107 

3.5 CONCLUSIONS AND FUTURE RESEARCH 109 

CHAPTER 4: CONCLUSION .................................................................................. 111 

4.  REFLECTIONS ........................................................................................................................ 111 

4.1 SUMMARY OF THE PRACTICAL IMPLICATIONS 111 

4.2 SUMMARY OF THE THEORETICAL IMPLICATIONS 111 

APPENDIX A: FORMULAE FOR ACTION-SCALED ADVERSARY DISTANCE ........................ 114 

APPENDIX B: EXAMPLE PARTICIPANT INFORMATION AND CONSENT FORMS ................. 116 

REFERENCES ................................................................................................... 122 

10

List of Figures Figure 1.1 An image of a termite mound of the genus Macrotermes .................. 27 

Figure 1.2 Newell’s adapted Model of Constraints on Performance ................... 32 

Figure 1.3 Representation of the task constraints used in the study by Montagne

et al. (2003) .............................................................................................................. 46 

Figure 2.1 Schematic of the experimental task in Study 1. B = Ball, A = Attacker,

GK = Goal-keeper, R = Receiver, D = Defender. Only the defender’s involvement

was changed across the different levels of defensive pressure (either absent, far

or near), all other variables were held constant. The numbered scale reflects

units of distance in metres. ..................................................................................... 63 

Figure 2.2 Schematic of the experimental task and apparatus dimensions. A =

Attacker, D = Defender, B = Ball, m = metres. ....................................................... 65 

Figure 2.3 The assumptions regarding linearity and planarity of two-dimensional

direct linear transformation (2D-DLT). The left column shows conditions that

violate assumptions of 2D-DLT whilst, the right column shows conditions that

meet the assumption. The point of interest is marked as I. The four control points

are also shown, denoted c1, c2, c3 and c4. Note how the relationship between

the point of interest and the control points are critical to accurate 2D-DLT. ...... 68 

Figure 2.4 Mean outcomes of accuracy (primary axis) and ball velocity (secondary

axis) of the three conditions of defensive pressure. km/hr = kilometres per hour.

Error bars = 95% confidence intervals. .................................................................. 72 

Figure 2.5 Mean foot/ball distance variability patterns of the eight participants

for each of the three levels of defensive pressure for the final 13 footfalls of the

run-up to cross. Error bars = 95% Confidence Intervals. ...................................... 74 

Figure 2.6 The mean step lengths for the eight participants across the three

levels of defensive pressure, calculated between the final 13 successive footfalls

of the run-up to cross. Error bars = 95% confidence intervals. ............................ 76 

11

Figure 2.7 Mean foot/ball distances across the three levels of defensive

pressure calculated over the final 13 footfalls. m = metres. Error bars = 95%

confidence intervals. ................................................................................................ 79 

Figure 2.8 Mean horizontal displacement velocity across the three levels of

defensive pressure calculated at each footfall. Note that because the central

moving differences method was used, the final footfall (0) is unknown. m•s-1 =

metres per second. Error bars = 95% confidence intervals. ................................. 81 

Figure 3.1 Schematic of the experimental task in Study 2. B = Ball, A = Attacker,

GK = Goal-keeper, R = Receiver, D = Defender. Only the defender was changed

across conditions of defensive pressure (i.e. absent, far or near), all other

variables were held constant. The numbered scale reflects meter units. The

arrow indicates that the target for the attacker was the penalty spot. The

brackets indicate that the attacker was free to pass at any location in the

approach toward the by-line. ................................................................................... 94 

Figure 3.2 Mean outcomes of accuracy (primary axis) and ball velocity (secondary

axis) when players were required to dribble the ball under different levels of

defensive pressure. m/s = metres per second. Error bars = 95% confidence

intervals. ................................................................................................................... 97 

Figure 3.3 Mean foot/ball distance variability patterns of the eight participants

for each of the three levels of defensive pressure for the final 11 footfalls of the

dribble to cross. Error bars = 95% confidence intervals. ...................................... 98 

Figure 3.4 Participant Two’s foot/ball distance variability patterns for the three

levels of defensive pressure. Note the large and non-declining nature of the

Defender Absent condition. ..................................................................................... 99 

Figure 3.5 Mean foot/ball distance variability patterns of seven participants (to

the exclusion of Participant Two) for each of the three levels of defensive

pressure for the final 11 footfalls of the dribble to cross. Note the large

reduction in the mean foot/ball distance SDs in the No Defender conditions final

few footfalls. Error bars = 95% confidence intervals. .......................................... 100 

12

Figure 3.6 The mean step lengths for the seven participants (participant number

2 excluded) across the three defensive pressure conditions for Study 2. Step

lengths were calculated by taking the difference between the final 11 successive

footfalls of the dribble to cross. ............................................................................ 101 

Figure 3.7 Mean horizontal displacement velocity across the three conditions

calculated for the final 11 footfalls (minus footfall 0). Note that because the

central moving differences method was used, the final footfall (0) is unknown.

m/s = metres per second. Error bars = 95% confidence intervals. ................... 104 

13

List of Tables Table 2.1 Participant age, competition experience and relevant anthropometric

details ....................................................................................................................... 62 

Table 2.2 Main effect and planned contrasts of the three levels of defensive

pressure on the dependent variables during the locomotor pointing task .......... 71 

Table 2.3 Planned contrasts of the mean foot/ball distance (m) standard

deviations at the final 13 footfalls across the three levels of defensive pressure.

................................................................................................................................... 75 

Table 2.4 Planned contrast of the mean distances (m) between the final 13

successive footfalls across the three levels of defensive pressure. .................... 78 

Table 2.5 Planned contratsts of the mean foot/ball distance (m) at the final

successive 13 footfalls for the three levels of defensive pressure. ..................... 80 

Table 2.6 Planned contrasts of the mean displacement velocity (m•s-1) at the

final successive 13 footfalls for the three levels of defensive pressure. ............. 83 

Table 3.1 Main effects of Study 2. .......................................................................... 96 

Table 3.2 Planned contrasts of the distance between the final 11 successive

footfalls across the three conditions of defensive pressure when players dribbled

the ball. ................................................................................................................... 103 

Table 3.3 Planned contrasts of the mean horizontal displacement velocity (m•s-

1) at each of the final 11 (minus footfall 0) footfalls for each level of defensive

pressure. ................................................................................................................. 105 

14

Acknowledgments This MSc. has been a challenge. This contributed to by a desire to make a

difference in the views of others (a rookie mistake to be sure) and the inspiring

lecture series given by Dr. Ian Renshaw in my final undergraduate year. I’ve

always been interested in science and it seemed for the first time under Ian’s

talks, the many pieces of information that I had accumulated in years of study

began to appear like a whole. I can’t thank you Ian enough for showing me the

world from a different perspective. Your insights have fueled the work in the past

year.

It’s unfortunate to say that my awareness of the world around me narrowed a

great deal this past year, firstly I would like to thank my girlfriend for putting up

with me. Thanks to Mum and Dad for supporting me throughout the task. Thank

you to my Brother Julian for the many forced beers and wines, looking over early

drafts, helping with early pilot work, and lending me the wide screen t.v. set for

the seemingly endless 21/2 months it took to ‘get the data’. To the judo squad at

Lang Park PCYC and especially my coach Rob Close, thank you for providing a

place I could escape the pressures of academic work. To the group of excellent

researchers on level 3, I’ve been fortunate in being able to learn from and be

supported by you all. Thank you especially to Jonathan Headricks for consistently

manning the radar gun and paving the way for this work, and also to Scotty

Russell for taking the well practiced role of refereeing the football players. Finally

thank you to David Opar and Luís Vilar for the inspiring lunch time chats.

To the Kelvin Grove School of Excellence program boys who enthusiastically

participated and to the most outstanding and insightful coach I’ve ever had the

opportunity of discussing issues of learning with, Ian Milligan- thank you for trust,

enthusiasm and support in making this complex experiment possible. To the QUT

faculty of Health I’d like to thank for you all for your support and trust, and

especially to Allen “the Great Enabler” Barlow for the practical aid and advice

across the various methodological issues that arose.

15

Also to my principal advisor Keith Davids, thank you for showing us the way with

the example of such a tremendous body of work. Your writings and insights

prompt an uncompromising method in understanding emergent behaviour in the

area of human performance and skill acquisition. As a young researcher, the

opportunity to learn the research process has been invaluable- the critiques,

recommendations, prompts and questions throughout provided important

lessons.

Finally I would like to acknowledge the outstanding 10-week practicum

placement at the Australian Institute of Sport under the mentorship of Richard

Shuttleworth and Adam Gorman that preceded this Masters. Richard for showing

me it is possible to change things and to Adam for showing me you need to be

cautious in how you try to do it (though this is an ongoing lesson).

16

Statement of Original Authorship The work contained in this thesis has not been previously submitted to meet the

requirements for an award at this or any other higher education institution. To

the best of my knowledge and belief, the thesis contains no material previously

published or written by another person except where due reference is made.

Signature

Date

17

Chapter 1: Introduction

1. CONSTRAINTS ON EMERGENT BEHAVIOURS IN SPORT PERFORMANCE

1.1 THE ECOLOGICAL SCALE OF ANALYSIS

The ecological dynamics approach to understanding human performance and

skill acquisition in sport emphasises the performer-environment relationship

(Araújo, Davids, & Hristovski, 2006; Chow, Davids, Hristovski, Araújo, & Passos,

2011; Davids & Araújo, 2010). This performer-environment scale of anlysis

considers that there is a close coupling of performers and their performance

context (Davids, Renshaw, & Glazier, 2005; Williams, Davids, & Williams, 1999).

Coupling occurs both mechanically, through forces exerted by the performer, and

informationally, through energy fields that interact with structured environments

(such as optic, acoustic, inertial and chemical) (Davids, Button, & Bennett, 2008;

Warren, 2006). The coupling of the performer and environment reflects a co-

dependency between these two systems where control of performance is shared

over the performer-environment system (Warren, 2006). In the field of human

perception and performance in sport, mutual interdependence of the performer

and environment provides a strong rational for focussing analyses of

performance behaviour at this performer-environment scale (Araújo, et al., 2006;

Davids, Kingsbury, Bennett, & Handford, 2001; Newell & Liu, 2001; Warren,

2006).

Research at the performer-environment scale of analysis can test theories of

human behaviour by focussing on: (i) how organisms perceive and act relative to

their environments, and (ii) the nature of the contraints that shape the dynamic

process of perception and action (Davids, et al., 2008; Warren, 2006). An

ecological dynamics understanding of human behaviours in sport provides a

theoretical underpinning to the general problem of movement pattern

coordination considered in this thesis: How does one coordinate locomotion

towards a target in space in order to carry out another task like jumping, bowling

18

or kicking a ball? How do key objects, events and surfaces in the environment

influence coordinated performance of individuals?

In the following sections of this chapter, a theoretical rationale is presented that

explains: (i) the relationship between perception and action, and (ii) the nature of

the constraints impinging on this relationship. This rationalisation leads to a

juxtaposition of ecological psychology and complex dynamic systems theory

under an ecological dynamics theoretical framework. A review of research related

to locomotor pointing1 with nested task constraints (a form of goal directed gait

where performers aim to position a held implement or body segment at a key

surface, event or location) is then undertaken. Extensions for future research are

presented, identifying the research questions of this thesis.

1.2 ECOLOGICAL PSYCHOLOGY: PERCEPTION-ACTION COUPLING

1.2.1 Direct Perception

James Gibson (1979), founder of the ecological psychology approach to the

study of animal-environment relations, provided a theoretical rationale of how

animals are able to guide their actions relative to key surfaces, objects and

events in their environment. His account of emergent behaviour was predicated

on a theory of direct perception (Gibson, 1979). Direct perception proposed an

explanation of how properties in the environment are perceived to support

actions. From a Gibsonian perspective, the information available in the

environment does not need to be disambiguated by the Central Nervous System

(CNS) (Warren, 1998). Instead information is specific enough to be directly

percieved by an organism’s functionally adapted sensory-movement systems (for

alternative perspectives see, Norman, 2002; Zago, McIntyre, Senot, &

Lacquaniti, 2009).

Gibson argued that physical laws and properties of the environment, coupled

with the need to locomote for survival, served a role in the evolution of integrated

perceptual and action systems (Warren, 1998). Because lawful relationships 1 The key term, locomotor pointing, is defined as goal-directed gait that requires positioning of a body segment or held implement at a location in space and time. Locmotor pointing is provided a detailed definition in section 1.4 below.

19

exist between environmental properties and the structure of the surrounding

energy flows (Warren, 1998), the environment can unambiguously inform the

animal about the motion and location of objects and their own self-motion

(Williams, et al., 1999).

Gibson (1979) also proposed mechanisms for how humans perceived

information in the environment in order to coordinate contextual, role specific

actions. In the theory of Direct Perception, variants and invariants from the

surrounding energy flows are related to affordances for intentionally driven

behaviour.

1.2.2 Affordances and Intentionality

Variants and invariants in the energy flows surrounding the organism are

generated by movement. As the organism moves, at a superficial level,

structures in the informational array change relative to key surfaces or events

and are considered variant (Davids, et al., 2008). On the other hand, invariants

in the underlying structure remain (Davids, et al., 2008). Invariants represent

higher order properties constantly available to inform actors what behaviours are

occurring and are required in order to achieve performance goals (Montagne,

2005). Optical energy picked-up by visual perception systems may specify the

timing for an action such as positioning of a foot on a target at a specific location

in space (Warren, Kay, Zosh, Duchon, & Sahuc, 2001). For example, in the long

jump run-up the orderly nature of the expansion of the retinal image of the take-

off board2 might contain an optical invariant to support when, where and how to

begin preparing to position the feet for the take-off footfall (Fajen, Riley, &

Turvey, 2009; Lee, Lishman, & Thomson, 1982; Montagne, 2005).

From an ecological psychology perspective, the spatial-temporal specification of

an invariant when coupled with intentions of an animal, would be considered an

affordance for an animal to undertake related actions in preparation of carrying

2 In long jump, athletes attempt to, in the jump footfall, position their toe relative to the edge of a take-off board. In this footfall athletes generate a jump where the objective is to achieve as mush distance from the edge of the take-off board as possible. Athletes are penalised for positioning the toe of the jump footfall beyond the edge of the take-off board.

20

out an interaction with an affordance (Davids, et al., 2008; Montagne, 2005). By

definition, an affordance is an opportunity for action specified in the environment

relative to the organism’s personal constraints (including intentions) and current

state of movement (Gibson, 1979). Objects in the environment can afford certain

actions; balls on the ground are kick-able, balls in the air are catch-able or head-

able, and implements in the hands are throw-able (Fajen, et al., 2009). For

example, how kick-able a ball is, will be related to its mass relative to the force

an athlete is able to generate whilst this action is driven by the intent to meet

environmental challenges (Fajen, 2005). The implications of the use of

affordances in movement coordination indicate that organisms do not generate

actions according to an arbitrary measurement such as grams, rather, they do so

in a manner scaled from the reference point of the performer relative to the

environment (Turvey, 1992).

The possibility that affordances provide can help explain goal directed behaviour

was tested in a seminal study by Warren (1984) who undertook a stair climbing

experiment into whether actions could be informed by the limb lengths of

participants relative to the environmental properties of the stair raiser height.

Warren (1984) demonstrated key influences on decisional behaviour in a stair

climbing task at the performer-environment scale of analysis. He observed that

performance of participants was supported by the metrics of both the individual’s

leg length and the stair raiser height. He found a dimensionless ratio between a

participant’s leg length and the height of the stair. As the height of the stair was

systematically increased, a decision that the stair was no longer ‘step-up-able’

emerged at a critical ratio value (0.88), with participants spontaneously adopting

a four-limbed climbing style instead beyond this value. The scaling of actions

relative to body dimensions is an example of how movement solutions are ‘body-

scaled’ and are likely to be individualised.

In addition, decisions are also influenced by the action capabilities of the

individual performer whereby, action capabilities scale perception of the capacity

to produce a response to an environmental challenge (Ramenzoni, Riley, Davis,

Shockley, & Armstrong, 2008). For example, in football during penalty kicks,

research has shown that a goalkeeper’s movement time, constrains when they

21

initiate movement to intercept the ball relative to his/her own action capabilities

(Dicks, Davids, & Button., 2010). Movement initiation relative to action-

capabilities was shown in that goalkeepers with slower movement times tended

to move earlier and base their decisions on the perception of information

exclusively from the run-up of the penalty kickers. Whereas goalkeepers with

fast movement times delayed their movements, giving them the capacity to

observe information from the shooter’s run up and kicking action (Dicks, et al.,

2010). This tendency to delay actions relative to one’s own action-capabilities

was described by Dicks et al. (2010) as a reflection of an interaction between the

performer and environment, limited by a critical action boundary. The critical

action boundary biased performers’ actions toward remaining within a stable

performance region (or safety margin), ensuring that a performer retained access

to functional (and achievable) actions (Fajen & Devaney, 2006).

Although previous research on stair climbing and goalkeeping strategies in the

penalty kick have demonstrated how perception-action coupling supports

coordinated actions in dynamic performance environments, intentionality also

has an important role in how performers interact with affordances (Turvey,

1992). Intentionality refers to the specific intentions that each individual has at

any moment during performance, for example, to run as fast as possible or to run

with accuracy in order to prepare to place a foot on a target area in the

environment (Montagne, 2005).

The research discussed so far indicates that each individual will generate a

relatively unique coordinated movement pattern for the ‘same’ problem because,

movement solutions are both scaled to body dimensions and action capabilities

(Dicks, et al., 2010; Ramenzoni, et al., 2008; Warren, 1984) and interactions

with affordances can change depending on the intentions of the individual in a

given performance context (Montagne, 2005). Affordances have been shown to

be dynamic in the behavioural opportunities they provide (Dicks, et al., 2010).

Despite a location in space being a static surface, the intentions of a performer

can change what they afford (Maraj, 2002; Newell & Ranganathan, 2010).

Perception and action relative to key surfaces unfolds over the process of

carrying out a performance objective (Montagne, 2005). The moment-to-moment

22

nature of perception and action implicates an ongoing coupling between

perceptions of important information with subsequent movements. Control of

action by a perception-action coupling implies that adjustments will not be

produced unless the requirement is perceived as functionally necessary for

performance (Montagne, Cornus, Glize, Quaine, & Laurent, 2000). According to a

prospective control model, adjusting movements occur continuously throughout

the process of coordinating actions with the environment (Montagne, 2005). The

next section details theoretical arguments and research supporting a prospective

control of performance behaviour.

1.2.3 Prospective Control

Evidence for prospective control is fundamental to ecological psychology’s theory

of Direct Perception (Turvey, 1992). This is because if performers can be shown

to generate adaptive behaviour that is required and based on their current

behaviour, it provides evidence of a continuous and circular relationship between

perception and action, rather than a process interrupted by the need to recall

and initiate a specific movement plan (Montagne, 2005; Warren, 1998). Strong

evidence for prospective control has been observed in activities that involve

interception during tasks with severe spatio-temporal constraints, such as those

found in many sport contexts involving interceptive action (for a review see

Davids, Savelsbergh, Bennett, & van der Kamp, 2002).

For example, the study by Bootsma and van Wieringen (1990) exemplified the

role of prospective control in interceptive actions. In their work, highly

experienced table-tennis players performed fore-hand returns to a target location

on the other side of a competition table (Bootsma & van Wieringen, 1990). The

researchers found that despite variability observed at the initiation of

movements, these skilled players were able to modify the acceleration and the

orientation of the bat to achieve high level of timing and placement at the all-

important point of bat/ball contact (Bootsma & van Wieringen, 1990). Terming

the phenomena as ‘kinematic convergence’ (also termed funnel shaped control,

Montagne, et al., 2000), the largest variability in bat position occurred at onset of

stroke initiation and the lowest bat position variability occurred at the point of

bat/ball contact (Bootsma & van Wieringen, 1990). This finding of a pattern of

23

high to low amounts of variability in bat/ball positioning indicated that the

athletes were not just producing a routine action; they were adapting their

movements to achieve the task goal of hitting the ball. Through further individual

analysis, Bootsma and van Wieringen (1990) found that 2 of the 5 players

displayed the lowest amount of variability during the middle to final part of their

movement (Bootsma & van Wieringen, 1990). The individual analysis suggested

that some athletes were adapting their movements relative to the ball

throughout the entire action, implicating a prospective control strategy (Bootsma

& van Wieringen, 1990).

1.2.4 Theoretical Summary

1.2.4.1 Ecological Psychology

To summarise so far, the environment is considered to contain sources of

unambiguous information that has influenced the evolution of perceptual and

action systems (Warren, 1998). Evolutionary scale adaptations has subsequently

been shaped to directly perceive a variety of continuously available sources of

energy to support perception-action cycles and for humans include vision, haptic,

auditory, olfactory and proprioception (Davids, et al., 2008). Coordinated

solutions to task specific and environmental affordances for action have been

shown to be individualised (Dicks, et al., 2010; Warren, 1984). Behaviour that

reflects individualisation of movement patterns has been observed in the

influence of body-scaling on actions (Dicks, et al., 2010; Ramenzoni, et al.,

2008), implying that unique coordination patterns are scaled to body dimensions

(Warren, 1984) and action capabilities of individual performers (Dicks, et al.,

2010). The ability to adapt movements continuously throughout interceptive

actions by use of a prospective control strategy has been outlined (Bootsma &

van Wieringen, 1990; Montagne, 2005; Turvey, 1992). In summary, an argument

has been proposed to account for how information on a variety of factors is

detected to control action, and vice versa, in terms of a perception-action cycle.

Control using a continuous perception-action cycle relies on:

an unambiguous link between the status of the environment and that

which is perceived (Jacobs & Michaels, 2007; Turvey, 1992);

24

the availability of higher order invariants that can specify current and

required actions (Williams, et al., 1999);

coordinated actions being scaled by body dimensions and action

capabilities relative to the environment (Dicks, et al., 2010; Turvey, 1992;

Warren, 1984),

a cyclic, interdependent process of movement for perception and

perception for movement (Bootsma & van Wieringen, 1990; Montagne,

2005), and;

the adaptation of movement based on the current and required state of

the movement system relative to environmental challenges (Turvey,

1992).

The ideas given coverage from ecological psychology’s theory of Direct

Perception describe how information can help regulate action in a manner

spread over the performer-environment system. Clearly Gibson (1979) did not

argue that performer-environment interactions were regulated in a manner akin

to the use of a central executive or decision maker (Warren, 2006). However,

additional perspectives are needed to understand other constraints on the

emergence of performance behavior, such as instructions and intentions. For

instance, just because an action is possible according to affordances, does not

mean it will emerge. What constrains and drives perception and action and how

is this related to emergent performance? In the following section, how

constraints of performance contexts impinge on an individual’s perceptual-action

cycles is considered (Glazier & Davids, 2009). It is argued that this dynamic

process results in the emergence of self-organised patterns of movement

coordination (Glazier & Davids, 2009).

1.3 COMPLEX DYNAMIC SYSTEMS

Studies of complex systems occur across various disciplines including for

example, sport (Gréhaigne, Bouthier, & David, 1997; Hristovski, Davids, Araújo, &

Button, 2006; McGarry, 2005), skill acquisition (Chow, et al., 2011; Davids, et

al., 2008), human movement systems (Kelso, 1995; Schöner & Kelso, 1988),

biology (Sumpter, 2006), physics (Bak & Paczuski, 1995), chemistry (Verlard &

25

Normand, 1980), and social networks (Miller & Page, 2007). Generally, complex

systems are defined as systems made up of interacting and interdependent units

that constrain each other’s behaviours across multiple levels and timescales

(Davids, et al., 2008; Newell & Liu, 2001). Despite apparent differences, such as

being a chemical or biological system, complex systems share key characteristics

that extend across the discipline of observation. These characteristics include

self organisation, local interaction rules which can lead to large scale system

changes and emergence. In this section, characteristics of complex systems are

defined alongside empirical examples in biological3 and sport performance

systems.

1.3.1 Complex Systems in Nature

Self-organisation is defined as the process of pattern-formation that occurs in

complex systems solely from the numerous local interactions within the system

and without intervention from external directing forces (Camazine, et al., 2001;

Kauffman, 1993). Rather than requiring an external component to direct

perceptions and actions of organisms, local information rules specify the

interactions among the components that make up the system (Camazine, et al.,

2001). Complex system principles (i.e. self organisation, local interaction rules,

emergence, stability, instability, large scale changes, heterogenous responses)

can underpin the coordination tendencies shown by interacting components that

make up complex systems. Considering pattern formation as a coordination

tendency reflects how individual components can function independently but can

come together and coordinate actions as they become informationally-coupled

(Kelso, 1995; Kelso & Engstrom, 2006).

The study and measurement of complex sysems begins with the observation of

patterns that occur among a systems components (Kelso, 1995). The patterns

displayed by a complex system can show emergent properties, and it is largely

these properties that generate the research interest into complex systems

3 The choice to focus on how complex system properties relate to biological systems in particular was made because, biological systems differ fundamentally to physical systems in that: (i) sub-units exhibit greater complexity in biological systems, and; (ii) the interactions are between inanimate objects in physical systems (Camazine et al., 2001).

26

(Camazine, et al., 2001; Kelso, 1995). This is because the patterns of behaviour

appear to equal much more than the sum of the individual parts that contribute

to their occurance (Camazine, et al., 2001). The local interactions can

sometimes be identified to follow simple rules of thumb which paradoxically

generate highly complex, functional behaviours (Camazine, et al., 2001). A key

objective of complex systems research is to identify the rules that regulate the

interactions between the elements in a system responsible for generating

emergent properties (Camazine, et al., 2001). Consider for example the building

of the large African termite mounds of the genus Macrotermes depicted below in

Figure 1.1. These mounds reflect sophistocated structures that regulate heat

critical to the survival and reproduction of the inhabitants (Bristow & Holt, 1987),

contain a variety of purpose built chambers (Rouland, Lenoir, & Lepage, 1991),

generate a self-sufficient food supply (Rouland, et al., 1991) and are immense in

size relative to the inhabitants who build them.

27

Figure 1.1 An image of a termite mound of the genus Macrotermes

28

Millions of fairly homogenous units (termites) interact and build these structures

over numerous lifetimes from the intial beginnings of a queen-king combination

(Camazine, et al., 2001). How do termites know where to begin, or when to stop?

Do each follow an individualised template?; are they guided by the queen or, are

actions influenced by self-organising principles, such as through information

governed interactions with local concentrations of pheromone laid down by other

ants undertaking nest builing activities (Camazine, et al., 2001)? Understanding

what governs emergent behaviours can reveal how natural systems, that cen be

made up to millions of degrees of freedom, as in termite colonies, exploit

surrounding physical and informational resources in efficient, functional and

creative ways (Camazine, et al., 2001). Whether self-organising features of

natural biological systems can inform sport performance is predicated on the

notion of whether human movement systems also display similar emergent self-

organised qualities.

1.3.2 Self-Organisation in Sport Performance

To consider the feasability of a complex systems approach in sport performance

contexts, research has imported systemic theoretical perspectives and methods

to consider human movement systems as a complex system in their own right

(Davids, Glazier, Araújo, & Bartlett, 2003). For example the human body can be

considered as made up of numerous heterogenous parts, with some 102 joints,

103 muscles, 103 cell types and 1014 neurons and neruonal connections, whose

interactions contribute to a functional, neurobiological movement system (Kelso,

1995). Extending this within individual systems approach, has been the

conceptualisation of between human interactions as a complex system (for

reviews see Marsh, Richardson, Baron, & Schmidt, 2006; Oullier, de Guzman,

Jantzen, Lagarde, & Kelso, 2008). From a systems perspective, the interactions

between team members on sport fields provide a context rich with emergent

patterns of interpersonal coordination tendencies (McGarry, 2005). As athletes

support their decisions on the local information available (i.e. distance to the

nearest team mate, an area of empty space, the stumble of a defender), a global

pattern often emerges, with no one player responsible for orchestrating the

29

functional structure of an offensive or defensive system (Gréhaigne, et al.,

1997).

Important questions that systems theorists are interested in posing regarding

sport performance in team games include: how do humans exploit the available

physical and informational resources in performance contexs in such efficient,

functional and creative ways? Do these performance behaviours display

emergent properties and if so, what local interaction rules govern coordination

between humans, their environments and tasks? Can such insights be

harnessed to promote emergence in performance behaviour through

theoretically driven design of practice settings? (Chow, et al., 2011; Davids, et

al., 2008; Renshaw, 2010).

Early work applying complex systems perspectives to sport have used a dynamic

systems approach to consider sport performance. Outlined for example by

McGarry et al. (2002), the dynamic systems approach involves an emphasis on

mapping the possible states of complex systems in terms of a numerical phase

space (Davids, et al., 2008). By definition a dynamic system is any system that

evolves in time under the action of a deterministic or stochastic (random) law or

rule (Kelso, 1995). Two key components give a prediction of a systems dynamics

(Kelso, 1995). First, a state vector (a collection of state variables) describes the

state of the system at any instant of time (Kelso, 1995; Newell & Liu, 2001).

Second, a rule or function predicts/controls where the system will be in a future

instant of time, given that the current state is known (Kelso, 1995; Newell & Liu,

2001). By observing a system as it responds to changing circumstances, the

constraints important in shaping the organisation of functional behaviours of the

system can be identified (Kelso, 1995; Kelso & Engstrom, 2006). Coordination

tendencies revealed this way are considered functional in that they allow an

organism to function more effectively in its particular performance environment

(Davids, et al., 2008).

Due to the difficulty of mapping a numerical phase space in sport contexts,

dynamic systems approaches in team sport have tended to be qualitative

(McGarry, Anderson, Wallace, Hughes, & Franks, 2002). For example, McGarry et

al. (2002) characterised football as a dynamic system made up of two sub-

30

systems (i.e. each team). The system as a whole displays periods of stability

(Gréhaigne, et al., 1997), transient periods of disorder (Hughes, Dawkins, David,

& Mills, 1998) and complete break downs in structural organisation (Gréhaigne,

et al., 1997). McGarry et al. (2002) speculated that simple local interaction rules

might govern these states. For instance to generate team structural order and

fulfill a defensive role players might tend to keep the distance to team members

relatively consistent or reduce distance to near opponents (McGarry, et al.,

2002). While on the other hand to fulfill an attacking role and generate

opportunities for a goal, team members might attempt to fill available space and

undertake actions that generate distance between themselves and a defensive

player (McGarry, et al., 2002).

Passos, et al. (2009) quantitatively extended understanding in the field of

dynamic systems theory research in sport performance settings provided by

qualitative analysis. Using a dynamic systems approach to understand try scoring

in rugby, Passos et al. (2009) analysed coordination tendencies between players

as it emerged from rugby 1v1 situations at the defensive try-line. In their

experiment, an attacker was positioned 10 m from the try-line where a defender

was positioned to protect it. The attacker had an area of 5 m width in which to

attempt to run past the defender to score a try. In this situation, although the

attacker’s desired to have a large distance between themselves and the

defender, they were pressured by the task objective to reduce this distance

(Passos, Araújo, Davids, Serpa, et al., 2009). At a specific distance to the

defender (a value of 4 m), the mutual actions of the players became coordinated

and very instrumental in determining the performance outcome (Passos, Araújo,

Davids, Serpa, et al., 2009). That is, within close proximity actions became highly

correlated and if the attacker could generate a high enough relative velocity with

the defender inside a 4 m proximity, then the attacker could take advantage of

the space surrounding the defender and move past (Passos, Araújo, Davids,

Serpa, et al., 2009). If the defender could keep the relative velocity low, there

was a greater probability of success in intercepting the attacker and maintaining

stability in the dyadic system (Passos, Araújo, Davids, Serpa, et al., 2009). The

relatively simple and nested rules Passos et al. (2009) uncovered for attackers

to get past a defender in 1v1 sub-phases of team sports, suggested that an

31

attacker should aim to achieve a velocity that is higher relative to an approximate

defender when within 4 m in distance. Behaviours that might reduce this relative

velocity within this critical 4 m region should be avoided. Any action the defender

shows that might be exploited to increase the relative velocity should be

attended to. These straightforward pedagogical instructions can direct an

individual performer’s attention to important task specific information and

actions. Importantly, information governed instructions enables the performer to

generate prospectively controlled, creative and emergent behaviours to achieve

task objectives (Chow et al., 2007; Passos & Araújo, 2008).

Passos et al. (2009) showed how examining a situation that commonly occurs in

sport (known as a representative sub-phase, for a review of these methods see

Davids, Button, Araújo, Renshaw, & Hristovski, 2006), can reveal insights into

how constraints interact to influence coordination tendencies and ultimately

sport performance outcomes. The interaction between the task and the

performers constrained the behaviours that emerged. The task constraints

established a boundary to the performance context that resulted in emergent

coordination tendencies (Passos, Araújo, Davids, Serpa, et al., 2009). As

behaviours emerged under the pressure of constraints, functional aspects of the

performance context became apparent (i.e. interpersonal distance was critically

nested with relative velocity). The constraints that influence movement

performance were first described by Newell (1986) and provide a model for

understanding how coordinated behaviour emerges from complex dynamical

systems. The important role and characteristics of constraints are defined and

described in the following section.

1.3.3 Constraints on Movement Coordination

Newell (1986) provided a model summarising the categories of constraints on

behavior (see below in Figure 1.2). It has since been adapted to show how

constraints interact to impinge on circular information-movement couplings

(Glazier & Davids, 2009). There are three categories of constraints to consider

32

including: personal, environmental and task constraints (Newell, 1986).

Figure 1.2 Newell’s adapted Model of Constraints on Performance

Personal constraints refer to existing structural and functional characteristics of

an individual (Chow et al., 2006). Structural characteristics include body

composition, height and limb lengths. Functional characteristics refer to

connective strength of synapses in the brain, motivations, emotions, intentions

and cognitions (Chow, et al., 2006). Environmental constraints may be physical

(mechanical), informational or social in nature (Chow, et al., 2006). Physical

constraints might include forces generated through the body such as ground

reaction forces. Informational constraints might include those such as ambient

light, temperature, sound, wind and moisture. Social constraints might be factors

such as peer groups, parents and socioeconomic status that act on performance

(albeit over a somewhat larger timescale) (Chow, et al., 2006). Finally, there are

task constraints. These tend to be much more specific to the performance

context and include rules, equipment, opponents or field dimensions (Chow, et

al., 2006).

It is important to note that constraints are interrelated and interdependent in

how they impinge on behaviour (Davids, et al., 2008). This can make it

somewhat difficult to separate one type of constraint from another because as

one constraint changes, this will influence another, often in non-linear ways

(Davids, et al., 2008; Newell & Liu, 2001). For example how a performer might

interact with task constraints might change based on contextual constraints

33

previously not available to the performers. Guerin and Kunkle (2004) highlighted

how task constraints are dynamic and can emerge and decay over time. Consider

a goal-keeper’s task to kick a ball from a goal-kick situation. The goal-keeper

might kick the ball long in order that the ball is contested in the other team’s half

or alternatively, kick the ball short in order that the receiving player might work

the ball up the field with a succession of passes between team-members. Early

in the game, the goal-keeper might be more inclined to pass short in order that

his/her team retains possession of the ball and have the opportunity to generate

goal scoring opportunities. If, later in the game the goal-keeper’s team is holding

on to a game winning lead by points, new task constraints have emerged, he/she

might consider it too risky to chance a short pass, and instead play the ball long.

This is an example of how constraints can emerge (i.e. need to score goals) and

decay to be replaced by a different one (i.e. prevent goal scoring opportunities for

the other team) through the outcomes of interactions that occur over time (i.e.

point scoring).

Another important feature of constraints on behaviour is that they can act over

different, shorter and longer time-scales relative to the time that a performance

occurs over (Newell & Liu, 2001). For example in basketball, tallness carries

certain performance advantages and could lead to institutions choosing players

on the basis of their height (Phillips, Davids, Renshaw, & Portus, 2010). This in

turn would change the environment for players train and perform under. As a

consequence perceptual and action learning and coordination would be shaped

differently over time to reflect the homogenisation of opposition characteristics

(Cordovil et al., 2009).

1.3.4 Theoretical Summary

1.3.4.1 Complex Dynamic Systems

To summarise, complex systems theoretical principles have been shown to play

an important role in emergent performer-environment coordination (Camazine, et

al., 2001; Cordovil, et al., 2009; Davids, et al., 2008; Newell & Liu, 2001;

Passos, Araújo, Davids, Serpa, et al., 2009). The value and potential

mechanisms of emergent properties in biological systems have been outlined.

34

Complex systems can show functional properties of self-organised behaviour

based on simple rules governing local information based interactions (Camazine,

et al., 2001). The different types of constraints (personal, environmental and

task) impinging on the self-organisation of behaviour have been outlined (Chow,

et al., 2006; Newell, 1986). Their interrelated and interdependent

characteristics, ability to emerge and decay, and to act over different time-scales

have been described (Cordovil, et al., 2009; Guerin & Kunkle, 2004; Newell &

Liu, 2001; Phillips, et al., 2010).

In sport performance, distinctive patterns emerge from the interdependence and

interactions among players, their environments and tasks (Davids, et al., 2008).

Despite the apparent order in performance behaviour, there is no single dictating

source responsible for imposing it, rather, human performance systems are self-

organising systems under constraint (Kauffman, 1993). The role of complex

systems theory in understanding how organism-environment interactions are

constrained can be summarised in that functional coordination tendencies

emerge:

from interdependent and interrelated interactions of task, environmental

and personal constraints that act across multiple timescales (Davids, et

al., 2008; Newell & Liu, 2001);

displaying characteristics of dynamic, self-organising systems (Passos et

al., 2008; Passos, Araújo, Davids, Milho, & Gouveia, 2009);

potentially on the basis of simple rules of thumb governing interactions

with locally based information (Camazine, et al., 2001; Passos, Araújo,

Davids, Serpa, et al., 2009), and;

through interactions with dynamic constraints within and shaped by the

performance context (Guerin & Kunkle, 2004,Passos, 2009 #33).

These concepts from complex systems (Bradshaw & Sparrow, 2001) have been

combined with key ideas in ecological psychology to form an ecological dynamics

framework, providing the theoretical underpinnings of this thesis. Ecological

dynamics research has shown some evidence of the signatures of self-

organisation within and between athletes during sport performance (Araújo, et

al., 2006; Davids, Button, et al., 2006; Hristovski, Davids, & Araújo, 2006;

35

Hristovski, Davids, Araújo, et al., 2006; Passos, Araújo, Davids, Serpa, et al.,

2009). The following section is concerned with providing juxtaposition the two

fields of research, ecological psychology and complex dynamic systems theory,

under the ecological dynamics umbrella. The questions raised at the beginning of

this chapter will then be considered using this ecological dynamics approach, i.e.:

How do humans coordinate locomotion towards a target in space in order to

carry out another task such as to jump, bowl or kick a ball?, and; How do key

objects, events and surfaces in the environment influence emergent coordinated

performance during locomotion towards a spatial target?

1.3.4.2 Ecological Dynamics: Representative Sub-Phases from Sport Reveal

Coordination Processes

Addressing the questions surrounding performer-environment interactions, an

ecological dynamics approach is needed because of its multidimensional focus

and its emphasis on the performer-environment scale of analysis. Ecological

psychology emphasises the information in the environment that performers use

to regulate action. Dynamical systems perspective focuses on constraints, how

they interact and lead to behavioural emergence. Both theoretical perspectives

are complementary in emphasising the interrelatedness and codependency of

both the performer and environment.

Ecological dynamics considers the emergent nature of behaviour as dependent

on the interaction of each individual performer under the specific constraints of

each performance context (Araújo, et al., 2006). As performers move they

generate information to support their interactions with the environment that can

make possible their objectives (Passos, Araújo, Davids, Serpa, et al., 2009). An

ecological dynamics model (adapted from Araújo, et al. (2006)) to explain how

humans locomote to carry out tasks at key surfaces or objects in space, such as

running to kick a ball (recall that this a process known as locomotor pointing

toward a nested task), would propose that:

behaviour is strongly influenced by the detection and use of contextual

information (Dicks, et al., 2010; Turvey, 1992; Warren, 1984);

36

functional coordination is characterised by the narrowing of variability of

actions and by the progressive attention to relevant sources of

information (Bootsma & van Wieringen, 1990; Davids, et al., 2003;

Jacobs & Michaels, 2007; Montagne, et al., 2000), and;

the maintenance and the transition between stable functional patterns of

behaviour is the result of the interaction of multiple constraints (Chow,

Davids, Button, & Koh, 2008; Newell & Liu, 2001; Passos, Araújo, Davids,

Serpa, et al., 2009) (Kelso, 1995).

The important analytic consequences of this model of locomotor pointing

performance behaviour are that:

it is possible to measure and explain the effects of relevant constraints on

coordination tendencies of an individual as well as the extent of these

effects (Araújo, et al., 2006; Chow, et al., 2008; Kelso, 1995; Passos,

Araújo, Davids, Serpa, et al., 2009), and;

it is possible to measure and explain stable patterns of interaction

between performers and the environment (Araújo, et al., 2006; Kelso,

1995; Passos, Araújo, Davids, Serpa, et al., 2009).

Measurement of coordination during locomotor pointing according to this

framework has important implications for experimental design, suggesting

that constraints on participants should:

maintain the interacting nature of constraints that they are familiar with

regarding the tasks that the research intends to generalise, otherwise

enabling qualitatively different coordination tendencies to emerge (Araújo,

et al., 2006; Davids, Button, et al., 2006; Kelso, 1995), and;

allow performers to act on information in a way that supports tasks

objectives according to their expertise level (Araújo, et al., 2006; Araújo,

Davids, & Serpa, 2005; Davids, Button, et al., 2006).

Ecological dynamics advocates utilising representative tasks or performance

sub-phases that commonly occur in team sport contexts as task vehicles to

consider questions surrounding performer-environment relations (Davids, Button,

37

et al., 2006). A representative performance sub-phase in team sports, such as a

1v1 sub-phase, is a common emergent situation in competitive contexts (Davids,

Button, et al., 2006). For example, the research by Passos et al. (2009) aimed to

understand interpersonal coordination tendencies during competitive

performance in team games. To achieve this, Passos et al. (2009) used the

situation in rugby union where an attacker faces a single defender near the try

line. The advantage of using performance sub-phases from team sports in

empirical work means that the ecological constraints of natural performance

settings can be used to study movement patterns of performers who are familiar

with the task constraints (Araújo, et al., 2006). Complex, emergent behaviours

may be observed in the natural performance context and not in artificially

constructed experimental environments that may restrict performers from

displaying functional variability (Passos, Araújo, Davids, Milho, et al., 2009). The

implications of this approach is twofold since it provides: (i) valid theoretical

information from which to model performer-environment relations (Davids, et al.,

2005; Passos, Araújo, Davids, Milho, et al., 2009; Passos, Araújo, Davids, Serpa,

et al., 2009), and (ii) practically applicable information for sport performance

analysis (Chow, et al., 2011; Davids, et al., 2005; Passos & Araújo, 2008;

Passos, et al., 2008).

This thesis will examine how these theoretical ideas impact on performer-

environment relations during goal directed gait that requires a task to be

performed at the end: i.e. locomotor pointing is the task vehicle to investigate

these concepts. Athletes frequently rely on the ability to successfully coordinate

gait toward a target in space in order to carry out contextually driven actions,

such as running to bowl or kick a ball (Fajen, et al., 2009; Montagne, 2005).

Additionally, these types of processes also frequently emerge in mundane,

everyday activities such as walking to place a foot on the kerb (Fajen, et al.,

2009; Montagne, 2005). The following section reviews the research on

locomotor pointing with nested tasks and considers how a representative sub-

phase from team sports might be used as a task vehicle to contribute to current

understanding in the extant literature.

38

1.4 LOCOMOTOR POINTING: RUNNING TO PERFORM TASKS

An important objective in locomotor pointing research is to understand how one

coordinates locomotion with reference to a target in space under different task

conditions and within specific performance environments (Davids, et al., 2005;

Montagne, 2005; Warren, 2006). As previously defined, the term ‘locomotor

pointing’ describes goal directed gait towards a target in space (Montagne,

2005). Locomotor pointing tasks include day-to-day activities, such as walking to

place a foot on an escalator or a road side curb, as well as specialised sport

tasks, such as running to jump from a long-jump or gymnastics vaulting board, to

bowl a ball in cricket or to kick a football ball (Fajen, et al., 2009; Montagne,

2005). In sport the nested tasks at the end of a locomotion phase of the task

often involve coordinating a specific physical orientation of the body to interact

with an object (Fajen, et al., 2009; Montagne, 2005). The run-up approach

should aim to prepare the body for performance of a context specific interceptive

action (Montagne, 2005).

An interesting question concerns how an individual might regulate gait in order to

successfully perform a task nested at the end of a run up. The following section

reviews the extant research on constraints on locomotor pointing coordination.

The review begins by discussing the evolution of the research and measurement

techniques. This is followed by coverage of experimental designs that have

considered personal, environmental and task related influences on locomotor

pointing coordination. Specific research gaps are highlighted throughout this

review with a summary of the specific questions addressed in this thesis

presented at the conclusion of this chapter.

1.4.1 Visual Regulation of Gait in Locomotor Pointing

Lee, Lishman, and Thomson (1982) provided the first evidence of a possible

visual regulation strategy in human locomotor pointing tasks. They aimed to

examine whether gait during the long jump run-up was stereotyped with

subsequent findings having important implications for understanding locomotor

pointing. To test the stereotyped run-up hypothesis, highly experienced athletes

(participants were at international competitive standard) were observed

39

repeatedly undertaking a long jump run-up and jump. If they were relying on a

prewired pattern then they should have developed a stereotyped run-up,

revealed in the invariance of their foot positions relative to the board between

trials. The measure of variability in this study was the standard deviation (SD) of

each footfall distance to the edge of the take-off board throughout the run-up.

The stereotyped run-up hypothesis was not supported, with the grouped data

showing that foot position SDs increased during the approach but, at about four

footfalls from the board, showed a period of systematic decline (Lee, et al.,

1982). At the same time as this there was a concomitant increase in the step

length SDs, indicating that the athletes were functionally adjusting their step

lengths to achieve low levels of foot/board distance variability in the final footfall.

To Lee et al. (1982), the ascending/descending nature of the foot/board SDs

reflected two distinct phases: an ‘acceleration phase’ and a ‘zeroing-in’ phase

(Lee et al. 1982). During the acceleration phase athletes attempted to gain as

much horizontal velocity as possible in order to maximise jump length. In the

process however, there accrued natural movement system variability (for a

review of natural system variability see Davids, et al., 2003), demonstrated by

the ascending SDs in foot/board distances (Lee, et al., 1982). At a specific

distance value from the board, the athletes were required to ‘make up’ for the

accrued variability, demonstrated by the systematic reduction in the foot/board

SD distances to very low levels up to the jump footfall (Lee, et al., 1982).

A compelling explanation for the funnel shaped control during the final four steps

was that long jumpers were visually regulating their adjustments between

successive footfalls relative to the long-jump board (Lee, et al., 1982). The

concomitant onset of the decrease in foot/board distance SDs and increase in

step length SDs indicated to Lee et al. (1982), the importance of coupling visual

information with movement adjustments in locomotor pointing tasks. Since the

seminal work of Lee et al. (1982) the observation of a funnel shape control in

foot-to-object distance variability has been a consistent finding in the literature

(Montagne, 2005). For example, Hay (1988), Berg et al. (1994), and Montagne

(2000) since confirming the Lee et al. (1982) findings with long jumpers showing

40

a similar pattern of ascending and descending variability in foot/board

placements across trials.

However, some levels of doubt about these findings have been shown by

individual analyses of foot/board distance variability data. For example, Hay and

Koh (1988) found that by examining the individual patterns of variability that four

of their athletes (from a pool of 36 participants) showed very low foot/board

distance SDs across all footfalls when compared with the typical pattern (i.e. the

typical pattern underwent an ascending/descending process, but some

participants showed a consistently low pattern). This pattern of sustained low

level variability would appear to contradict the findings by Lee et al. (1982) and

indicate a stereotyped locomotor pointing strategy, not reliant on visual

regulation. Further confounding the funnel shaped control pattern shown by Lee

et al (1982), Hay and Koh (1988) also reported one participant showing an

ascending pattern of variability in the ‘zeroing-in phase’. Ascending patterns of

footfall variability are normally only seen when the run-up board is absent (shown

by Maraj, 2002) or during running to a location without nested task constraints

at the end (for example in 100 m sprinting events shown by Glize & Laurent,

1997).

Although these findings confound the conclusions about how perception and

action is coupled in locomotor pointing, an explanation for these individual

variations was proposed by Montagne et al. (2000) who suggested the athletes

may have not needed to make adjustments. Adapting a trial-by-trial analysis

method from Glize and Laurent (1997), Montagne et al. (2000) considered with

a greater level of detail the functionality of the final six footfalls in the long jump

run up. The trial-by-trial method analysed the relationship (i.e. using simple linear

regression) between the amount adjustment long jumpers needed to make at a

given footfall, with the amount actually produced. Montagne et al. (2000) found

that, in the final six footfalls, athletes would begin correlating their adjustments

made with those needed. The clearest indication that these adjustments were on

an as needs basis was the finding that an inverse relationship between the

footfall from which the regulation began and the amount of the regulation that

occurred subsequent to this footfall. That is, the further from the board the long

41

jumpers began regulating, the more they regulated, indicating a contextually

driven requirement on a trial-to-trial basis.

The trial-by-trial method of analysis was also applied by Renshaw and Davids

(2004) who examined the cricket bowler run-up across the final 13 footfalls up to

the footfall prior to the delivery footfall. Similar to the Montagne et al. (2000)

study they found correlations emerged between the adjustment needed and the

adjustment produced. However, in contrast to Montagne et al. (2000), Renshaw

and Davids (2004) found no negative correlation between the footfall at which

regulation began and the amount of adjustments cricket bowlers made and it

appeared cricket bowlers generated adjustments early in the run-up, not just

during the zeroing in phase (a finding also suggested in long jumpers in the

analysis by Glize and Laurent, 1997). The absence of correlation showed the

distinct differences between these two tasks (i.e. bowling and long jumping). The

nested task at the end of the long jump run-up requires that participants

generate a maximal speed prior to jumping from the take-off bard. On the other

hand, the cricket bowler run up requires only a sub-maximal speed approach

prior to ball delivery. The Renshaw and Davids (2004) study showed how the

nested task shapes athletes adjustments of their footfalls to achieve the

requirements of the task. When combined, the Montagne et al. (2000) and

Renshaw and Davids (2004) findings suggest that individuals not only display

different strategies for when they regulate their footfall, but that movement

coordination strategies are related to the nested task.

Since the initial research by Lee et al. (1982) a wide range of performance

constraints have been considered using measures of gait parameters across the

extant literature, including: levels of expertise (Maraj, Allard, & Elliott, 1998;

Scott, Li, & Davids, 1997), fidelity of visual information (Berg & Mark, 2005; de

Rugy, Montagne, Buekers, & Laurent, 2000, 2001), speed of the run-up

(Bradshaw & Sparrow, 2000, 2001), instructional constraints (Maraj, 2002;

Maraj, et al., 1998) and characteristics of the nested task (Bradshaw & Sparrow,

2001; Renshaw & Davids, 2004, 2006). All of these constraints appeared to

influence patterns of emergent coordination processes. In the following section,

the key findings from the locomotor pointing research on this range of topics will

42

be summarised. Apparent control strategies and the constraints- individual,

environmental and task- that influence gait coordination will be given coverage.

1.4.2 Control Strategies

1.4.2.1 Step Length Adjustment

By studying inter- and intra-trial variability, control strategies that humans use to

carry out tasks at the end of a run-up, can be revealed (for a review see Davids,

Bennett, & Newell, 2006). In locomotor pointing with nested tasks, humans use

step length adjustments to prepare for and carry out the nested task, the

consequence of this is a reduction of between trial foot/object distance

variability at the end of the run-up (de Rugy, Montagne, Taga, Buekers, &

Luerent, 2002; Warren, Young, & Lee, 1986). Use of step length adjustments as

a control strategy, has been shown to influence both approach speed (Bradshaw

& Sparrow, 2001) and body orientation (Montagne, et al., 2000), important for

success in nested tasks (Montagne, 2005).

Interestingly, a functional competition between the use of either a step

lengthening or a step shortening strategy has been reported in some locomotor

pointing studies (de Rugy, et al., 2002; Montagne, et al., 2000; Warren, et al.,

1986). For example, as a long jumper approaches the take-off board they may be

able to reach the board in 9 steps based on their average running step length.

However, during the approach they will accumulate natural system variability

(Davids, et al., 2003). It may be that to reach the board with a stable posture

they could make up for accumulated variability by making longer a given step

length and still reach the board in 9 footfalls, or alternatively, reduce a given step

length and reach the board in 10 footfalls.

This effect of competing tendencies between step lengthening and shortening

was highlighted in modeling research that used a dynamic system model that

shared control of successive footfalls over a performer-environment system (de

Rugy, et al., 2002). In this model, as the each successive footfall brought the

43

agent4 closer to the interception point, it was not until a critical distance emerged

that step adjustments were made. Adjustments occurred based on where the

distance of the agent-interception point emerged and the functional step lengths

available to the agent based on musculoskeletal model of the lower limbs. De

Rugy et al., (2002) resolved the lengthening/shortening competition by having

their system choose the method that involved the smallest absolute adjustment.

This approach of adjusting as needed is in line with human research in natural

locomotor pointing tasks that suggests that the adjustment needed will closely

correspond to the adjustment required.

Further research is needed to consider the competing dynamic between

lengthening and shortening of steps during run-ups. For example, observing

mechanisms underpinning this might reflect an affordance-based control

strategy similar to that suggested by Fajen (2005). Performers under an

affordance-based control model would operate within a bandwidth influenced by

their sensitivity to their own action capabilities and body-dimensions (for a

detailed theoretical account, see section 1.2.2 Affordances and Intentionality

above) (Fajen, 2005). For instance a step-lengthening or shortening strategy

would be expected to be sensitive to ‘step length-ability’ reflecting that

performers actions are biased by their body dimensions (i.e. the stride length an

individual is capable of based on their overall leg length, see for a discussion

Scott et al, 1997) and deceleration capacity of the musculoskeletal system

responsible for slowing a person down. If a performers required adjustments in

the approach to a target became too large and were unable to be met by the

performers body-dimensions and action-capabilities, they might change to a

different control strategy, such as a suddenly taking a smaller step to ‘make up

for lost ground’.

An example of these differences in control strategies was described by Fajen

(2005) who modelled driver breaking behaviour. He described a system whereby

if drivers approached a target at a maximum breaking capacity, they could arrive

at the fastest possible time, the disadvantage being that mistakenly going over

maximum deceleration capacity would result in a collision (Fajen, 2005). Skilled

4 The term agent is used to reflect that the performer is a computer simulation in this case.

44

performers he pointed out, would be well ‘calibrated’ to this maximum breaking

capacity and be capable of operating their vehicle near this critical action

threshold (i.e. maximum breaking capacity) (Fajen, 2005, p. 735). Alternatively, a

more ‘conservative’ strategy is available to the cautious driver who could remain

well below the maximum deceleration at the cost of a more time consuming

approach (Fajen, 2005).

A logical extension of this research could be made to running toward a target to

carry out a nested task. On the one hand, the performer could delay their

deceleration to arrive at the object as quickly as possible: however the possibility

of making a mistake and going outside the maximum deceleration capacity of

the musculoskeletal system would have consequences for the performance task

at the end (i.e. such as having to make very large adjustments in step and

disrupt displacement velocity, Montagne et al, 2000). The possible existence of a

critical action boundary operating in step length adjustments requires further

research.

In summary, the known control strategies available in bipedal running to a target

include changing the distances between footfalls. By changing these parameters,

performers are able to generate functional relations important for carrying out

tasks at objects, surfaces or events in the environment. In the following section,

the constraints impinging on the performer-environment relations so far

described (i.e. foot/object variability, whole body displacement velocity and step

length adjustments) will be discussed in so far that they have been shown

empirically in the locomotor pointing research.

1.4.3 Constraints Shaping the Approach to Perform Nested Tasks

1.4.3.1 Differences in findings between Laboratory Simulations and Natural

Locomotor Pointing Task Performance

Fajen (2005) argued that an important element allowing humans to successfully

undertake locomotor pointing tasks, is the ‘calibration’ of the performer to the

boundaries separating possible and impossible actions. Part of this process of

calibration he argued, was learning to perceive what actions are possible and

45

impossible, scaled relative to affordances. In locomotor pointing research,

studies have attempted to directly examine perceptual learning of the

boundaries of possible actions. A single study by Montagne et al (2003) who

undertook a pretest, learning, posttest protocol and expert-novice studies by a

number of authors (Glize & Laurent, 1997; Maraj, et al., 1998; Scott, et al.,

1997) provide the clearest evidence of perceptual-action learning in locomotor

pointing tasks.

With the aim to understand what personal and environmental spatio-temporal

variables humans learn to control, Montagne et al. (2003) observed the role of

practice in the acquisition of successful locomotor pointing strategies. Using a

treadmill and projector screen set up, participants were attached to a rigid rod

that kept the position of the participant on the treadmill unchanged. Depicted

below in Figure 1.3, this experimental device allowed a representation of a virtual

scene which showed a periodically opening and closing door that approached

relative to the walking speed controlled by the participants on the treadmill

(Montagne, et al., 2003). Participants determined their movement speed relative

to the cyclical opening and closing doors on the virtual screen and subsequently

whether they would pass through the doors successfully (although they were not

‘allowed to stop at any point’). They achieved this task goal by increasing or

decreasing their walking speed.

Compensatory behaviour of participants (e.g. changes in walking velocity),

relative to the status of the doors at arrival were monitored across a pretest,

intermediate and posttest procedure. In early stages of the learning trials,

participants relied almost exclusively on a deceleration strategy to pass the

doors, showing a 24% success rate in the pretest phase (Montagne, et al.,

2003). This success rate may have reflected a lack of familiarity with the virtual

locomotor pointing task constraints. During the intermediate and posttest phases

participants learned to exhibit greater levels of functional variability in their

approach velocity by using both increasing and decreasing acceleration

strategies (velocity SD subsequently increased between trials). The increase in

variability in walking speeds was concurrent with a concomitant decrease in the

variability of the doors condition at the moment of ‘passing through’. Participants

46

were able to time their approach so that the door was more consistently at a

point of maximum opening. This was also shown in the success rates of the

intermediate and posttests showing 62% and 64% respectively.

Figure 1.3 Representation of the task constraints used in the study by Montagne et al. (2003)

Participants learned to make adjustments in their walking velocity in a manner

relative to the virtual door opening status (which became relatively invariant)

using a mixture of acceleration and deceleration strategies. Participants over

repeated trials learned to adjust their gait to best fit the situation on a trial-to-trial

basis (Montagne, et al., 2003). This adaptive behaviour is consistent with

findings across learning research that tends to show a progression in the

exploitation of movement system degrees of freedom whilst becoming more

consistent in some task specific feature (for a review see Chow, 2007; Davids,

Bennett, et al., 2006). The findings by Montagne et al. (2003) suggested that

participants learned to use information allowing for the production of prospective

movement adaptations.

47

One of the striking limitations of this study, however, is that participants were

unable to achieve 100% success in this task with an average success rate across

the study of 52%. This success rate may be the result of limitations in the

experimental task constraints considering that a mundane task of walking

through an opening and closing door should be associated with greater level of

success in an adult group of participants. In natural locomotor pointing tasks

novices are able to be highly accurate despite a lack of familiarity with a nested

task (Scott, 2002; Scott, et al., 1997). The experimental constraints imposed in

the Montagne et al. (2003) study may have shaped the data in specific ways. For

example, being fixed to the rigid rod and forced to walk in straight path only,

might have prevented participants from changing speeds or approaching the

obstacle with a different angle. Subsequently the experimental task constraints

may have prevented participants from showing their full functional abilities. For

example the study by Glize and Laurent (1997) showed that a non-long jumper

group reduced zeroing-in velocity by 12% relative to their overall velocity (this

compared to a 4% decrease in the skilled group). The data from Glize and

Laurent (1997) suggests that novices are able to generate high levels of

variation in approach speeds despite their lack of familiarity with a nested task

constraint which is something the participants in the Montagne (2003) study did

not show until after a period of familiarisation.

In the theoretical discussion above in section 1.3.4, it was highlighted that valid

generalisations about constraints on perception and action couplings, are

predicated on experimental designs that observe participants in a manner that

allows them to perform their unique functional adaptations to the environment

(Davids, Button, et al., 2006). Indeed, the limitations regarding the validity of the

experimental task constraints designed by Montagne et al. (2003) have been

criticised by other researchers (Bastin, Craig, & Montagne, 2006; Berg & Mark,

2005). For example, Bastin et al. (2006), using the same device as Montagne et

al. (2003), noted that; it was ‘…easier to accelerate than to decelerate given the

mechanical constraints of the motorised treadmill’5 (p.730). Further confounding

5 The use of the term ‘motorized treadmill’ is somewhat misleading, the

movement of the belt from the Montagne et al. (2003) account was achieved by

48

the virtual display technique, Berg and Mark (2005) pointed out that the virtual

display of the locomotor pointing target disappeared 200 ms prior to ‘contact’.

This terminal information however has been shown to be used by humans, with

Reynolds and Day (2005) showing that humans make adjustments in the

interception limb as near as 56 mm from the target. In light of the limitations of

the experimental device used by Montagne et al. (2003), future research is

needed to confirm the learning of perception-action couplings shown by

Montagne, et al. (2003). This should be in natural locomotor pointing settings

that enable participants to generate perception-action couplings consistent with

their adapted perceptual-movement systems, environments and capacity to use

movement system variability to functionally adapt their actions (Berg & Mark,

2005; Davids, et al., 2001). Ecologically valid task designs (discussed

previously, see section 1.3.4 above) can be a valid alternative in the study of

locomotor pointing with nested task constraints.

1.4.3.2 The Role of Visual Information in Guiding Locomotor Pointing Behaviour

In sport specific locomotor pointing tasks when important objects or surfaces are

absent, coordination changes dramatically. Maraj, (2002) showed the

importance of key surfaces on movement coordination by comparing foot/board

distance standard deviations (SDs) under conditions when the board was

present versus absent. When the board was absent the foot/board distance SDs

systematically increased at approximately the footfall which, under normal

curcumstances, would have systematically decreased (Maraj, 2002). To consider

providing an ‘initial velocity to the belt to ‘allow subjects to overcome the inertia

produced by the friction forces exerted on the belt. This "aid" was chosen so that

the forces generated by the subject would result in a velocity of the moving belt

that was practically equivalent to the velocity that would have resulted if the

same forces were generated by the subject while walking on a normal surface’

(p. 555). Presumably this means that should performers decelerate too much,

this action might make it difficult to maintain a desired speed after this process.

However, the assumption in these studies is that participants moved the belt

themselves.

49

the role of visual information, other studes have sought to make deliberate

manipulations of a variety of potential optical sources of information.

Experiments focussing on visual information may be categorised as visual

manipulations of: (i) global information during the entire approach, (ii) global

optical information and/or nested task information only during the final ‘zeroing-

in phase’, and

(iii) global and nested task expansion information throuhgout the entire

approach.

Visual manipulations during the run-up, have highlighted the important role of

optical information during the approach process. Laurent & Thomson (1988)

were early authors to examine the effect of vision on regulation of an approach to

position a foot as near as possible to a target on the ground. When vision was

uninterrupted during this process, or interrupted only during single limb support,

adjustments were ‘smoothly’ made. When vision was disrupted at all times

(participants were blindfolded after viewing the target), regulation became

‘clumsy and ill coordinated’ (Laurent & Thomson, 1988). These findings by

Laurent and Thomson (1988) illustrated how humans are much more consistent

at achieving movement objectives when visual information is continously

available.

A number of studies have manipulated the availability of optical information

specifically whilst carrying out the nested task (i.e. around the final few footfalls

prior to foot-to-object interaction). In a detailed study by Reynolds and Day

(2005) it was found that for accuracy of foot positioning to a target position,

additional fine-tuning of foot placement can occur after the penultimate footfall.

Reynolds and Day (2005) removed vision using occlusion goggles at the swing

phase onset, just prior to positioning the foot, and showed measures of variability

increased in the final foot position accuracy (Reynolds & Day, 2005). Importantly,

these researchers also analysed the kinematics of the final step by using the

angle of the foot relative to the target (i.e. termed a ‘heading angle’, a vector was

drawn through two points of the foot to the target) (Reynolds & Day, 2005). The

presence of vision caused alterations in this angle that showed a steering of the

foot more towards the target compared with the no-vision conditions (Reynolds &

50

Day, 2005). Across all conditions these adjusting movements in the heading

angle started to occur as the foot approached (reported as 56–72 mm) the

target (Reynolds & Day, 2005). The implications of research by Reynolds and Day

(2005), is that visual information is used to make ongoing adjustments

throughout the final positioning of the foot toward a target even during fast, well-

practiced movements. This would implicate a prospective type strategy in the

terminal interceptive movement process and not just in positioning footfalls,

Research has also manipulated optic information during the run-up and during

the undertaking of the nested task. De Rugy and colleagues (de Rugy, et al.,

2000, 2001) analysed the foot-to-line distance SDs and step length adjustments

made. Using an experimental set up similar to the one described above in

Montagne et al. (2003), de Rugy and colleagues (de Rugy, et al., 2000, 2001),

aimed to test the use of different types of optical information, by comparing

normally lighted conditions involving a progression of reduced ambient sources

of light. The reduced light conditions removed ambient room light, and/or

modified the rate of expansion of the target to intercept. They found very similar

control strategies between the conditions and very similar levels of success.

Importantly, the fully lighted conditions showed the lowest foot/object SDs (de

Rugy, et al., 2000) and initiation of adjustments occurred one step later (de

Rugy, et al., 2001). To consider whether speed might change how visual

information is regulated under natural conditions (i.e. not on a treadmill), Berg

and Mark (2005) manipulated of the availability of light and the target for

interceptions rate of expansion during the approach. In this study participants

ran the length of an indoor track to position their foot as close to a light projected

onto the ground as possible. The foot-to-line distance SDs were analysed across

full light, dark room, and absence of rate of expansion of the target during each

of these conditions. In line with de Rugy and colleagues (de Rugy, et al., 2000,

2001), this study found no meaningful effects on performance across conditions.

This suggests that performers were able to adapt their coordination relative to

the object of interception despite a change in its optical behaviour.

Participants in the experiments described throughout this section appeared able

to adapt their behaviour to a variety of constraints involving modification of

51

optical information of the surrounding environment and of the object for

interception. Importantly, participants showed the lowest foot-to-object distance

SDs during the run-up and final foot positions under lighted conditions where

optic information was not distorted in any way. These findings whereby humans

adapt to an absence of normally available optical information are consistent with

other similar research approaches involving object interception and pursuit in

immersive virtual environments (for discussions see Davids, et al., 2001;

Warren, et al., 2001; Zago, et al., 2009). For example, Warren et al. (2001) have

shown, using immersive virtual environments, that when different optic flow

information is experimentally manipulated, people increasingly use this

information: demonstrated by more direct locomotion paths with smaller

adjustments in their angle of approach.

Explanations regarding the movement adaptation to changes in optical

information has led to a multisensory visual regulation hypotheses (Bastin &

Montagne, 2005; Berg & Mark, 2005). When one source of information is not

available, another might be used to support action (Bastin & Montagne, 2005).

This apparent degeneracy that human perceptual-movement systems display

has been considered in other research (Davids, Button, et al., 2006; Edelman &

Gally, 2001). Degeneracy in human perception-action systems reflects that as

informational constraints of performance change, skilled performers are readily

able to adapt their information-movement couplings (Davids, Button, et al.,

2006). For example, when cricket batters must intercept a ball travelling in

excess of 160 km/hr delivered by a human or by a bowling machine, they can

achieve very similar outcomes despite the absence of information from the

bowler’s run-up (Davids & Araújo, 2010; Pinder, Renshaw, & Davids, 2009).

The outcomes of the research focusing on how vision regulates locomotion and

positioning of feet at nested tasks has shown that: (i) humans perform with

lowest foot-to-object distance SDs under fully light conditions, (ii) manipulating

optical information changes run-up and final foot positioning accuracy, and (iii)

humans adapt to changes in optical information still enabling relative success

albeit with increases in foot-to-object variability over trails. Future research

aiming to provide models for how humans interact with key surfaces or events in

52

the sport performance environments should sustain sources of information

normally available in participant’s environments. Because humans adapt to

changing environmental constraints, it might be that the behaviours exhibited

under optically manipulated conditions reflect an exploratory process consistent

with learning to coordinate movements under novel constraints.

1.4.3.3 Task Constraints that have Manipulated Running Velocity

Two different methods have been used to manipulate running speed in

locomotor pointing research: (i) instructions, or (ii) the nested task constraint. In

the following section the effect of running velocity and the nested task constraint

on shaping approach velocity and foot-to-object variability is considered.

Bradshaw and Sparrow (2001) aimed to test whether step length adjustments

were shaped by: (i) approach velocity, and (ii) the nature of the nested task.

Velocity was manipulated by asking participants to walk, jog or sprint toward

different nested tasks. The different nested tasks required: (i) positioning a heel

close to a line, (ii) positioning a toe close to a line, (iii) positioning a foot between

two lines, (iv) stepping over a raised rod, (v) stepping onto a box, and (vi)

stepping with both feet onto a gymnastic springboard. Bradshaw and Sparrow

(2001) showed that increased approach speed was associated with reduced

final foot/object distance variability (similar to other studies, for example

Bradshaw & Sparrow, 2000;Reynolds & Day, 2005). Bradshaw and Sparrow

(2001) suggested that the speed/accuracy trade-off, shown when participants

were moving faster, might have been a result of experience level. It was

concluded that because people tend to spend a greater amount of time walking

than running to intercept spatial locations they show less accuracy when running

(Bradshaw & Sparrow, 2001). Providing support to explain performance accuracy

as an experience moderated effect was shown in the research by Scott et al.

(1997). Scott et al. (1997) analysed the accuracy of the final step and compared

this with elite an experienced long-jumpers (recall that their own study involved

non-long jumpers). They found that the non-long jumpers displayed a larger error

in the final footfall relative to the experienced groups (their group showing 25 cm

SD whilst the largest SD reported in experienced groups was 14 cm, see Berg et

al. 1994).

53

With regard to manipulations of the nested task, the main effects showed a

number of significant effects in the Bradshaw and Sparrow (2001) study. When

participants were asked to position the heel closest to the line, an increased

foot/object variability was associated with the placement (Bradshaw & Sparrow,

2001). This may indicated that the ability to see the part of the body which is

intended to be closest to the target is important and may confirm the use of a so

called eye-toe visual axis used in modeling research (described previously, see

de Rugy, et al., 2002). However, in light of research by Renshaw and Davids

(2004), the increased foot/object variability may have been due to a lack of

familiarity of the participants in Bradshaw and Sparrow’s (2001) study with the

task constraints. Participants day-to-day activities may not tend to involve

intercepting a surface with a heel. Whereas in Renshaw and Davids (2004)

study, cricket bowlers who must position the heel as close to a line as possible

showed low foot-to-line distance SDs (as low as 8 cm, comparable to elite long

jumpers foot-to-board SDs), suggesting experience can moderate the accuracy of

positioning the heel at a line.

In addition to examining foot-to-object distance SDs, Bradshaw and Sparrow

(2001) analysed absolute step length adjustment patterns. They found that the

nature of the nested task changed how participants regulated their step lengths.

When participants were required to position a foot between the two lines, step

lengths shortened significantly throughout the entire approach. Gait also

changed to reduce approach velocity indicating that the participants were

controlling velocity to be successful in this task. The nature of the nested task

also influenced step length control between the penultimate footfall and last

footfall. When approaching the gymnastic springboard, participants favoured a

lengthening strategy between the third and second to last footfall (i.e. where the

final footfall is the one that lands on the target). On the other hand, when

approaching the rod and box, participants favoured a step shortening strategy

between the third and second footfall.

Bradshaw and Sparrow (2001) uncovered that the nested task appeared to

shape: (i) the coordination patterns during the entire approach, (ii) the ‘zeroing

in’ velocity and, (iii) the final emergent step length patterns. These findings are

54

consistent with other research by this group who also considered the

speed/accuracy trade-off in detail (Bradshaw & Sparrow, 2000). Bradshaw and

Sparrow (2000) revealed a linear speed/accuracy trade-off effect on approach

characteristics when target size was manipulated. In this study, the final whole

body speed and step lengths were reduced in order to accurately strike the

smaller targets. These observations suggested that step length is regulated when

approaching obstacles in order to achieve a task specific body orientation to

accommodate the ability of the interception foot to move in a manner suitable to

carry out the nested task.

An important limitation in research described above it that in order to observe

how participants to engage with the task constraints, researchers relied almost

exclusively on instructions. Often in day-to-day tasks and sport performance

settings, humans do not undergo movement coordination relative to key objects

and events under the constraint of instructions. The use of instructions in sport

performance have been shown to generate different approach velocities and

foot/object distance variability patterns (Maraj, 2002). In the following section,

the influence of instructional constraints on locomotor pointing coordination is

explored in detail.

1.4.3.4 Instructional Constraints on Locomotor Pointing

Instructional constraints influence the intentions of individual participants in

research experiments so that they can approach the task in meaningfully

different ways (Newell, 2010). A limited amount of research exists on how

instructional constraints influence behaviour. This is surprising considering the

amount of research that requires participants’ follow instructions to fulfill

parameters of locomotor pointing experiments. For example in the Reynolds and

Day (2005) study participants were given instructions that ‘…strongly

emphasised that foot placement accuracy was the primary goal of the task, and

that timing was secondary…’ and emphasised ‘…that a natural stepping

movement was required’ (p.678). This was despite a constraint on the

participants to regulate step speed on each trial coordinated with a 300 (fast

step) or 600 ms (slow step) sound after an initiation beep. Indeed, all studies

except for those using natural tasks (the long-jump run-up and cricket bowl run-

55

up), used instructions to achieve different running speeds and positioning

procedures relative to the nested task. This is despite research showing that

instructional constraints can influence coordination (Cordoval, 2008;Newell,

2010) and generalisability of findings to theoretical models in movement science

(Araújo, et al., 2006).

In locomotor pointing research the influence of instructions on coordination has

been demonstrated by Maraj and colleagues (2002; 1998). They used

instructions to generate three different performance contexts for competition

level triple jumpers (Maraj, et al., 1998). Under an experimental control condition

jumpers were instructed to jump as they would under normal competition

conditions. Under a distance condition, participants were instructed to jump as

far as possible ‘as if it were their first jump’ (Maraj, et al., 1998). Finally under an

accuracy condition, athletes were instructed to jump conservatively, as if all

previous jumps were fouls and they needed to get a jump recorded or face

disqualification (Maraj, et al., 1998). Maraj et al. (1998) found that the biggest

changes in behaviour was in the control of velocity and movement patterns

projected by changes in the magnitude of the SD of the foot/board distance.

Under the control condition athletes ran significantly slower during both the

acceleration phase and zeroing-in phase. During the distance condition athletes

ran significantly faster in both the acceleration and zeroing-in phase. Finally, the

accuracy condition was significantly different to the distance condition in that

during the approach participants reduced velocity. In addition to this finding the

control condition showed higher overall values of foot-to-board distance SDs

(although all conditions showed the typical ascending/descending pattern of

foot/board variability) (Maraj, et al., 1998). The Maraj et al. (1998) findings

showed that intentionality generated by instructional constraints altered

emergent perceptual-action coordination processes of athletes showing how

individuals adapted movement patterns to satisfy changing instructional

constraints.

1.4.4 Summary of Locomotor Pointing Research

In summary, locomotor pointing has been considered as process whereby task

specific interactions between a performer and nested task is successful through

56

modification in step lengths and whole-body displacement velocity. The control of

locomotion is dependent on both the performer and the environment. Learning

to perceive variables from the environment and relate these to movement

pattern adjustments has been empirically demonstrated (Montagne et al, 2003).

The influence of changing fidelity of visually information has been given coverage

and can clearly modify the coordination process during locomotor pointing tasks

when disrupted or withdrawn (Warren, 2001). The presence of a nested task

constraint at the end of an approach run has been shown to affect footfall

regulation for the whole approach and step lengthening and shortening just

prior to carrying out the nested action (Bradshaw and Sparrow, 2001). Also,

more experienced performers are able to modify actions in functional ways

whilst travelling at higher velocities than less experienced counterparts Scott,

et al. (2002). Finally, task instructions change how performers interact with

nested tasks.

Future experimental designs aiming to observe coordination and control of

locomotor pointing tasks should consider that regulation of gait and velocity

will:

occur in a manner scaled to the performer’s body dimensions and

action capabilities (Dicks, et al., 2010);

occur relative to visually available information and will adapt in some

functional manner when these are manipulated or absent (Berg &

Mark, 2005);

occur throughout the entire process of carrying out these tasks,

including the process of positioning the final footfall (Reynolds & Day,

2005);

be shaped by the nested task constraint at the end of the approach

(Bradshaw & Sparrow, 2001; Renshaw & Davids, 2004), and;

change depending on the contextual focus that instructions provide

the performers (Maraj, et al., 1998).

57

1.5 CONCLUSIONS

1.5.1 Research Issues Examined in this Thesis

This thesis will take an ecological dynamics approach in considering how

constraints interact to shape the coordination process of performer-environment

relations. The extant locomotor pointing research has focused on single

constraint based manipulations with a bias toward manipulation of visual

information. This research bias toward manipulating visual information has

distinct limitations in that visual information in typical sport performance and

day-to-day contexts is normally not withdrawn. In fact to the contrary, most urban

environments and organised sports carefully monitor ambient light and take

measures to ensure its availability. This provides a strong case for ensuring

visual information be maintained, rather than occluded in an experimental

testing environment.

Previous research in ecological dynamics in sport performance has shown how

interpersonal constraints generate coordination tendencies when the constraints

are representative of the performance context (Passos et al, 2009). In

performance settings, constraints provide a drive to undertake goal directed

locomotion, often these constraints are dynamic in nature and capable of

being fluid. For example in sport, perceptions and actions emerge relative to

the actions (and perceptions) of team-mates and/or opponents (Fajen, 2009).

How do dynamic task constraints influence emergent coordination tendencies

when compared to task instructions?

As a task vehicle, team games like football can provide a performance context to

empirically evaluate the influence of interpersonal constraints on emergent

locomotor pointing behaviour. Football is abundant with examples of goal

directed gait under the influence of dynamic, interpersonal constraints. For

example, attacking players often run towards or dribble with a ball in order to

make a cross pass to team-member inside the penalty area. This emergent sub-

phase of the game often occurs whilst an opponent pursues the attacker.

58

By using a representative sub-phase from football a number of important

theoretical and practical questions can be considered. This thesis will consider

the following questions:

Does running to make a cross pass in football involve the same funnel-

type control strategy as observed in other locomotor pointing tasks with

nested actions at the end?

How do interpersonal constraints differently influence movement

coordination in locomotor pointing tasks when compared to instructional

constraints alone?

The influence of instructions in comparison to interpersonal and task constraints

will be evaluated by measures on the following dependent variables: (i) an

attacking player’s patterns of foot/ball distance variability when running to cross

a static ball, (ii) successive step length patterns of the attacking player, and (iii)

ongoing horizontal displacement velocity of the attacking player. If instructional

constraints influence coordination in the same manner as interpersonal

constraints then, these dependent variables should not significantly differ

between conditions. On the other hand, if there are significant differences in the

attacking player’s patterns of foot/ball variability, step length control patterns

and displacement velocity, this will reflect a coordination tendency that emerges

under the flux of sub-phase specific interpersonal and task constraints.

Additionally, if coordination is scaled relative to affordances then, if a defender is

closer to the attacker, a spatial constraint should emerge to change behaviour in

a functional manner.

In the chapters that follow two studies are presented to address the questions

raised. In Chapter 2, a study is presented which examines the influence of

instructional constraints when compared to interpersonal constraints during a

football run up and cross. In Chapter 3, to consider how the task constraint of

dribbling a football ball might influence coordination is then considered under

the same manipulations of Study 1. In the final chapter, Chapter 4, a reflections

section will be presented detailing the contributions and considerations for

future research generated by this Master’s thesis.

59

Chapter 2: Study 1

2. EFFECTS OF PRESENCE AND PROXIMITY OF THE NEAREST DEFENDER ON A

PERFORMER’S GAIT PATTERN WHEN RUNNING TO CROSS A STATIONARY BALL

2.1 INTRODUCTION

Locomotor pointing research typically has relied on instructions (Bradshaw &

Sparrow, 2001; Maraj, et al., 1998), or natural task constraints (Lee, et al.,

1982; Montagne, et al., 2000) to make tasks meaningful to participants during

coordination of goal directed gait. In many day-to-day and sport performance

activities, goal directed gait is under the pressure of constraints that are

dynamic. Dynamic constraints are not commonly observed in the extant

locomotor pointing research (Fajen, et al., 2009; Montagne, 2005; Zago, et al.,

2009). However, during goal directed gait, constraints can change over the time

taken to perform the task. For example, a human aiming to cross a road may be

driven by multiple constraints. Some may be static, such as invariants (Williams,

et al., 1999) in the environmental surface layout (for example the target curb on

the opposite side of the road). Others may be dynamic (Fajen, et al., 2009), and

alter gait patterns significantly, such as avoiding collision with an approaching

vehicle.

Fajen (2005) outlined a basis for affordance-based control that included

perceptual calibration to a critical action threshold. The critical action threshold

presumably might be scaled to the action capabilities (Ramenzoni, et al., 2008)

and body dimensions (Warren, 1984) of individuals, to separate those actions

which are possible from those that are impossible (Fajen, 2005). This critical

region has been shown to influence behaviours in drivers’ braking to avoid a

collision (Fajen, 2005) and in interceptive actions in sport (Dicks, et al., 2010). In

sport, performance tasks often involve locomotion toward key objects and events

(Fajen, et al., 2009). If performers are under influence of an affordance-based

60

control mechanism, performers should perceptually engage with this critical

action threshold (Fajen, 2005). Evidence of the perception of a critical region

(either accurately or inaccurately by the person) would be implicated via its role

in constraining decisional behaviours (i.e. emergent performance actions) (Dicks,

et al., 2010). For example, in football as a player approaches a ball under

defensive pressure, perception of whether he/she can reach the ball prior to the

defender would be shown in the action of attempting to reach the ball first.

Should the attacker perceive he/she has the time to carry out an additional task

(for example he/she may attempt a cross pass), this would be shown by the

attempt at carrying out the goal directed kicking action. Therefore, the decision

by the attacker to attempt to cross the ball would be due to: (i) the distance and

behaviour of the defender affording the attacker to reach the ball first, and (ii)

that the affordance is perceived (Fajen, 2005). Affordance-based control would

suggest that decisions are based on both what oneself is capable of achieving

and on the basis of what the defender is capable of achieving. The relative action

capabilities of an attacker and defender would together influence a critical

boundary. An attacking player who is perceptually calibrated to the critical region

would therefore scale his/her possible actions relative to the defender’s possible

actions (Fajen, 2005). It is likely that locomotion behviours in sport performance

contexts such as a football match emerge scaled relative to interpersonal

affordances, although, this idea has largely gone unexplored in the extant

research (for an exception see Dicks et al, 2010).

An experiment was designed with the aim of considering the difference between

static task constraints and dynamic task constraints that accommodated the

possibility of affordance-based control into the experimental design. An emergent

sub-phase from football was chosen whereby an attacking player runs down the

sideline in order to make a cross pass back toward the penalty area in order to

generate a goal scoring opportunity. This situation commonly emerges in football

matches.

Players were asked to undertake this task with and without the presence of

defensive pressure. It was expected that instructional task constraints would

generate functionally different player-ball coordination tendencies when

61

compared to coordination generated when dynamic interpersonal information

was present pressurizing the attacker whilst undertaking the cross. By increasing

the defensive pressure the aim was to observe whether an attacker would attend

to a critical action threshold by moving faster. Whether players perceive and act

according to a critical threshold informed by both, their own and a defender’s

action capabilities was also considered by scaling a defender’s interpersonal

starting position to two different distances. If the players scale their actions

relative to a perceived critical threshold, it was anticipated that players would

attempt to give themselves a certain amount of time to carry out the task. This

would be reflected in the attacking player’s displacement velocity being higher,

the closer that the defender is initially positioned.

Furthermore, how the defender might influence the player/ball coordination

tendencies was also of interest because it might be that attackers quantitatively

change how they manage the position of their footfalls when approaching a ball

under defensive pressure. Montagne et al. (2000) demonstrated that there is a

link between the amount of variability in a given trial and the amount of

adjustment that a person undergoes when undertaking a locomotor pointing task

at maximal velocity. Specifically Montagne et al. (2000) showed that the greater

the variability in footfall placements, the greater the amount of adjustments

people make when approaching the nested task. Scott et al, (1997) provided

evidence that expert long jumpers functionally spread adjustments between foot

placements over as many footfalls as available in the zeroing in phase of the

long-jump. If football players run faster under defensive pressure, then it might

be expected that the management of foot positions may become much more

important for success in the kick. Therefore, football players would be expected

to more functionally position their feet relative to the ball throughout the entire

run-up in a manner important for beating a defensive player, as opposed to

merely accurately pass a ball. A reduced level of foot/ball6 distance variability

during the run-up would be important so that the amount of adjustments at the

zeroing in phase would be manageable whilst running at the higher velocity

required to complete the task before the defender could intercept the ball. This

hypothesis would be confirmed if the magnitude of the standard deviations

6 The term foot/ball distance signifies the foot/ball distance value at each footfall placement.

62

around the mean foot/ball positions were reduced when attackers are under

defensive pressure due to players running faster during the task under increased

defensive pressure.

In summary, the aims of this experiment were to consider: (i) whether the

running to complete a football kick is under similar funnel shaped control as

other locomotor pointing tasks, (ii) how movement coordination is influenced by

instructional task constraints compared to dynamic interpersonal constraints,

and (iii) whether players attend to a critical threshold informed by the action

capabilities from themselves and their opponent.

2.2 METHODS

2.2.1 Participants

Participants (n = 8) were members of a football school of excellence program

(average age = 15.25 yrs, SD = 0.46 yrs) and had on average of 8.25 years (SD =

2.12 yrs) of competition season experience. The demographic details of

participants are summarised below in Table 2.1. The study was approved by a

University Ethics Committee. Participants along with parent guardians signed

information and consent forms prior to undertaking the experiment.

Table 2.1 Participant age, competition experience and relevant anthropometric details 

Participant (ID)

Age (yrs)

Competitive Seasons (yrs)

Height (m)

Hip-to-Foot length (m)

Weight (kg)

1 16 5 1.84 0.81 80.5 2 15 8 1.81 0.98 68.6

3 15 9 1.84 1.07 60.3

4 16 10 1.82 0.93 80.0

5 15 10 1.82 0.95 59.0

6 15 5 1.73 0.86 68.4

7 15 9 1.80 0.94 63.9

8 15 10 1.60 0.87 53.5

Mean 15.25 8.25 1.78 0.93 66.78

63

2.2.2 Task

Below Figure 2.1 depicts the nature of the task and the roles of each player

involved in the experiment. Broadly speaking the task involved an attacking

player sprinting down the side-line and toward the opposition by-line where a

stationary ball was positioned in order to cross it back toward a team-member

positioned at the opposition penalty spot. The experimental manipulations

involved changing the level of defensive pressure by having the attacker

undertake the task with: (i) no defensive pressure, (ii) with a defender initially

positioned at a large distance (with a 20% disadvantage, refer below for an

explanation of how this value was arrived at), and (iii) with a defender initially

positioned at a close distance (with a 10% disadvantage). The defender was

always positioned at a disadvantage relative to the attacker and the position of

the ball. That is, the attacker was always able to get to the ball first based on the

action scaling procedure used.

Figure 2.1 Schematic of the experimental task in Study 1. B = Ball, A = Attacker, GK = Goal-keeper, R = Receiver, D = Defender. Only the defender’s involvement was changed across the different levels of defensive pressure (either absent, far or near), all other variables were held constant. The numbered scale reflects units of distance in metres.

64

To precisely scale the defender’s starting distance to the ball, pilot work

established: (i) the time it took each attacker to sprint 20 m and cross a ball, and

(ii) the time it took each defender to sprint 20 m. Referring to Appendix A for

formulae, the pilot data provided the information necessary to action-scale the

defender’s initial starting distance from the ball relative to the attacker. Because

the defender was scheduled to arrive after the attacker by a precise amount, the

attacker-defender dyads should not have been mismatched due to the action

capabilities of either individual and it could be predicted the attacker would

arrive at the ball first and with enough time to carry out the kicking task.

Task instructions for each player in the experiment were as follows. The attacker

was instructed to sprint to the ball (denoted B below in figure 2.1) and cross it

back towards the penalty spot. A receiving player (denoted R) was the target to

receive the crossed ball at the penalty spot. The receiver was instructed to time

the run to receive the ball at the penalty spot and attack the goal. A goal-keeper

(denoted GK) was instructed to protect the goal. In conditions where one was

present, the defender (denoted D) was instructed to meet the attacker at the

earliest point and prevent the cross within the laws of the game. To enforce the

laws of the game a referee was positioned in the field. The task was initiated at

the attacker’s discretion after a signal from the referee.

In interpreting the data, it is important to note that participants were not given

specific instructions on how to regulate footfall placement and velocity during the

run up. The behaviours of participants observed in this study were emergent

under the interacting constraints of performance.

2.2.3 Apparatus

The experiment was undertaken on the participants’ regular training field to

ensure familiarity (this was a grassed outdoor football field), at a similar time of

the day between sessions. Observations between sessions were recorded within

a one week time frame. A regular competition approved size 5 football ball was

used. This was positioned 3 m from the by-line and 4 m from the side-line (to

65

ensure consistent ball placement a spot was marked on the grass). Referring

below to Figure 2.2 for dimensions of the task environment, the attacker was

asked to pass the ball a distance of approximately 28 m perpendicular to their

starting position. The target was the penalty spot which was marked with white

spot paint. As shown in Figure 2.2, the position of the defender was manipulated

along a line taken from the ball that intersected with the corner of the 18-yard

box. For health and safety reasons, trials were only undertaken and observed in

dry weather conditions. Participants wore the same clothes and equipment as

they normally would for competition (including studded boots and shin pads).

Figure 2.2 Schematic of the experimental task and apparatus dimensions. A = Attacker, D = Defender, B = Ball, m = metres.

66

2.2.4 Data Capture

Two cameras were positioned perpendicular to the running direction of the

attacker (Sony HDR-XR520V and Sony HVR-V1P). The cameras were positioned

10 m apart, at 15 m from the side of the run and at a 5 m elevation relative to

the running surface (similar to methods by Maraj et al, 1998). The cameras were

zoomed to collectively capture an area of 25 m by 5 m. An overlap in the visual

angle of each camera allowed the entire run-up and cross action to be captured.

Post processing cut the footage at 25 Hz and synchronized it using an LED light

in the shared visual angle (files were saved in *.AVI format using Final Cut Pro 7

software (Final Cut Pro, Apple inc, Cupertino, CA)). Although no explicit

instructions were given, this was the area in which the attackers were expected

to remain within during the performance of the task. This area was surrounded

by high visibility markers that provided control points needed for two-dimensional

direct linear transformation (2D-DLT; these procedures first described by Abdel-

Aziz & Karara, 1971). This was performed using custom-built and pre-validated

software for these purposes (Digipan software).

High visibility markers (2.5 cm wide x 5 cm height) were placed on three

positions of each foot of the attacker. These were: the center of the heel, 2.5 cm

from the heel, and 5 cm from the heel. The position of the marker 2.5 cm from

the heel was the reference point of the foot used to calculate the distance of the

foot to the ball. The distance from the foot to the ball was calculated for each

footfall taken by attackers across all 96 trials. The foot/ball distance value at

each footfall placement was then used to obtain the standard deviations (SD) of

each foot position for each participant in each condition.

Measures of the attacker’s displacement velocity was recorded using the known

distance travelled and the number of frames between which the attacker was in

mid-swing of their gait cycle (as per Berg & Mark, 2005; and Lee, et al., 1982).

The central moving differences method was used to derive the velocity of the

attacker at each footfall (subsequently the velocity at the first and final footfall

were unknown) (Hamill & Knutzen, 2003). Pilot work established accuracy using

the method proposed by Bradshaw and Sparrow (2001). Shoes positioned at

known locations on a tape measure inside a number of locations throughout the

67

capture field were digitized and the digitized coordinates were compared to the

tape measured coordinates. The mean differences (n = 13) of this procedure

between the real and digitized points were found at 1.53 ±.63 cm. These levels

are similar across studies of this type (e.g. Lee et al, 1982, Berg et al, 2005).

Since the approximations of the foot positions were made using 2D-DLT

procedures some key assumptions needed to be met (Duarte et al., 2010).

2D-DLT is a valid method of reconstructing the locations of objects in a digital

image. To define the location of a point of interest in an image using 2D-DLT a

minimum of four points in the image and the distances between them must be

visible and known. These points must be collectively non-collinear to each other

and co-planar to the point of interest. The establishment of comprehensive

experimental design protocols regarding control points, the point/s of interest

and operation of the camera can maximise the accuracy and reliability of the

technique. These requirements for accurate and reliable application of 2D-DLT is

summarised below in

Figure 2.3.

68

Figure 2.3 The assumptions regarding linearity and planarity of two-dimensional direct linear transformation (2D-DLT). The left column shows conditions that violate assumptions of 2D-DLT whilst, the right column shows conditions that meet the assumption. The point of interest is marked as I. The four control points are also shown, denoted c1, c2, c3 and c4. Note how the relationship between the point of interest and the control points are critical to accurate 2D-DLT.

Additionally in order to collect data on the outcomes of the cross a radar gun was

positioned in line with the anticipated kicking direction of the cross. This allowed

the collection ball peak velocities post kick. Finally, the accuracy of the pass was

assessed by notational analysis whereby if the centrally positioned receiving

player touched the ball a score of 1 as coded for the trial whilst, if the receiving

player failed to touch the ball the pass was coded a 0.

2.2.5 Experimental Design

After verifying that all the assumptions were met with due corrections for

violation of the sphericity assumption (Schultz & Gessaroli, 1987) a one-way

69

analysis of variance (ANOVA) with repeated measures was used to investigate

three levels of defensive pressure (defender absent (control), far and near

positioning of defender) on the means of the gait parameters and cross

outcomes (ball speed and accuracy). Planned contrasts were to follow up the

main effects. A detailed analysis of at each footfall was then undertaken to

compare the gait parameters at successive footfalls across the three conditions.

Participants performed four trials in each condition for a total of 12 trials per

participant (i.e. a total of 32 trials per condition and a grand total of 96 trials

across the three conditions). These were administered using a quasi-Latin

square design to counterbalance order of treatment effects (Thomas, Nelson, &

Silverman, 2005).

To calculate the F-ratio main effect using the ANOVA with repeated measures

design note that:

F = MSM/MSR

Since:

MSM = MSM/dfM

And that:

MSR = MSR/dfR

We note that:

dfM = (k - 1)

Noting also that:

dfR = (dfw – dfM)

Considering also:

dfW = n × (k – 1)

70

Therefore the degrees of freedom for the variation explained by the model (MSM)

which is denoted dfM, equals the number of conditions (k) minus 1 which gives

dfM of 2.

The degrees of freedom for the variation explained by extraneous variables (i.e.

mean square of the residual error, denoted MSR) which is denoted dfR, is equal to

the degrees of freedom of the within participant sums of squares (i.e. dfW =

number of participants (n) multiplied by the number of conditions (k) subtracted

by 1) subtracted by the degrees of freedom of the model (dfM, see above).

Consequently this results in the sum, 16 minus 2 which results in dfR = 14 (i.e.

df(2, 14))

Since planned contrasts at each footfall were also intended it is noted the

degrees of freedom for the planned contrast F-ratio are: dfM = k -1, which is the

sum 2 -1 resulting in dfM = 1; and, dfR = dfM - (n × (k – 1)), which is the sum, 1 -

(8 × (2 – 1)), resulting in dfR = 7 (i.e. df(1, 7)).

The experiment was administered over two separate testing sessions with one

week between sessions. Participants undertook 4 trials in succession before

being scheduled a minimum rest period of 8 minutes. Between successive trials,

rest periods were scheduled for 2-minutes or participants took as long as they

needed to recover between trials. Attacker-defender dyads were formed by

random assignment. SPSS version 15.0 (SPSS inc, Chicago, IL) was used for

analysis.

2.3 RESULTS

Table 2.2 shows the main effects on mean gait parameters and peak ball speed

and pass accuracy outcomes in the different conditions: defender-absent,

defender-far and defender-near. Significance was declared at the traditional

alpha level of .05.

The following table summarises the main effects of the three conditions

defensive pressure and provides overall mean values on each of the dependent

variables on these conditions.

71

Table 2.2 Main effect and planned contrasts of the three levels of defensive pressure on the dependent variables during the locomotor pointing task

Gait Characteristics

Main Effect,

F (dfM, dfR)

Defender Condition (±95% CI)

Absent Far Near

Mean Footfall Variability (m) 3.75* (2,14) 0.922

±0.28 0.461,3 ±0.28

0.592 ±0.29

Mean Step Length (m) 1.20 (2,14) 1.50

±0.04 1.52

±0.07 1.52

±0.06

Mean Velocity (m•s-1) 8.69* (2,14) 5.403

±0.21 5.413

±0.15 5.601,2

±0.21

Mean Foot/Ball Distance (m) 3.43 (2, 14) 9.443

±0.62 9.84

±1.26 9.941 ±1.00

Outcome Characteristics

Accuracy (1 = Received, 0 = Not Received)

1.36 (2,14) 0.78 ±0.23

0.78 ±0.17

0.59 ±0.19

Peak Ball Velocity (km•hr-

1)

21.18* (2,14)

83.632,3 ±2.61

74.421,3 ±2.57

69.581,2 ±2.57

Significant main effects starred (*0.05). Pair-wise significant effects numbered where different to 0.05 level (1Absent/2Far/3Near different at 0.05 level). CI = confidence intervals. dfM = Degrees of freedom of the model. dfR = Degrees of freedom of the residual. F = critical value for F-ratio

Presented in detail below are the planned contrasts of each of the dependant

variables across the final 13 footfalls across the three conditions. In interpreting

the following data, it is important to note that: (i) the final 13 footfalls were

evaluated across all because this number of steps was common to all

participants, and (ii) footfalls are reported by number from the planting phase.

For example footfall number 0 indicates this is the planting phase footfall that

supported the kick. Footfall number 1 indicates that this is one footfall from the

planting phase footfall that supported the kick and so on.

72

2.3.1 Outcomes

There were no significant differences between conditions in terms of pass

accuracy (Table 2.2, Figure 2.4). Analysis of peak ball velocities showed that

participants kicked the ball fastest in the defender-absent condition compared to

the defender-far condition (F(1, 7) = 14.12 (p ≤ .05) and the defender-near

condition (F(1, 7) = 28.85 (p ≤ .05)). This trend continued with participants

kicking the ball with less velocity in the defender-near condition compared with

the defender-far condition (F(1, 7) = 14.89 (p ≤ .05)).

Figure 2.4 Mean outcomes of accuracy (primary axis) and ball velocity (secondary axis) of the three conditions of defensive pressure. km/hr = kilometres per hour. Error bars = 95% confidence intervals.

73

2.3.2 Foot/Ball Distance Variability and Step Length Analysis

2.3.2.1 Foot/Ball Distance Variability

A one way ANOVA with repeated measures was undertaken to evaluate the effect

of the three levels of defensive pressure on the overall mean foot/ball distance

(m) variability averaged over the final 13 footfalls leading into the kick. Footfall

variability was significantly affected by the level of defensive pressure, F(1.11,

7.79) = 3.75 (p ≤ .05) (Error! Reference source not found.).

The pair-wise comparisons of the means for each level of defensive pressure

revealed that the defender-absent condition was more variable than the

defender-far condition (F(1, 7) = 5.14 (p ≤ .05)) and the defender-far condition

was significantly less variable than the defender-near condition (F(1, 7) = 5.54 (p

≤ .05)). No other significant differences between levels of defensive pressure

were found.

Planned contrasts of the mean variability between each condition and at each

footfall leading into the cross were also undertaken. These values with 95%

confidence intervals are shown below in Figure 2.5 for visual inspection (see also

Table2.3).

74

Figure 2.5 Mean foot/ball distance variability patterns of the eight participants for each of the three levels of defensive pressure for the final 13 footfalls of the run-up to cross. Error bars = 95% Confidence Intervals.

Planned contrasts revealed that the defender-absent condition was significantly

more variable compared to the defender-far condition on: footfall 12 (F(1, 7) =

5.50 (p ≤ .05)); footfall 11 (F(1, 7) = 6.04 (p ≤ .05)); footfall 10 (F(1, 7) = 6.73 (p

≤ .05)); footfall 9 (F(1, 7) = 6.89 (p ≤ .05)); footfall 8 (F(1, 7) = 6.67 (p ≤ .05));

footfall 7 (F(1, 7) = 5.49 (p ≤ .05)); footfall 5 (F(1, 7) = 5.28 (p ≤ .05)); and,

footfall 4 (F(1, 7) = 5.70 (p ≤ .05)). In the final plant phase footfall (footfall 0) that

supported the kick the defender-absent condition reversed the previous trend

and was significantly less variable than the defender-far condition; (F(1, 7) =

8.53 (p ≤ .05)).

Planned contrasts comparisons revealed that the defender-absent condition was

not significantly different to the defender-near condition at any footfall.

75

Planned contrasts revealed that the defender-far condition was significantly less

variable compared to the defender-near condition on; footfall 9 (F(1, 7) = 5.85 (p

≤ .05)) and footfall 1 (F(1, 7) = 5.58 (p ≤ .05)).

Table 2.3 Planned contrasts of the mean foot/ball distance (m) standard deviations at the final 13 footfalls across the three levels of defensive pressure.

Footfall Defender Condition 

Absent  Far  Near 

12  1.012 0.441 0.61 

11  1.122 0.481 0.64 

10  1.202 0.541 0.68 

9  1.212    0.531, 3  0.722 

8  1.252 0.551 0.71 

7  1.282 0.611 0.74 

6  1.34 0.69  0.73 

5  1.212 0.571 0.69 

4  1.002 0.471 0.65 

3  0.66 0.38 0.59 

2  0.37 0.31 0.48 

1  0.22 0.213 0.292 

0  0.082 0.131 0.14 

Planned contrast significant effects numbered where different to 0.05 level (1absent/2far/3near at 0.05 level) 

2.3.2.2 Absolute Step Lengths

The patterns of step length modifications were analysed for the final successive

13 footfalls for each three conditions of defensive pressure. Defensive Pressure

revealed no main effect on the overall mean step lengths (m) adopted by the

players: F(1.34, 9.53) = .91 (p ≤ .05). Additionally planned contrasts showed no

significant comparisons between conditions on overall mean step length (Error!

Reference source not found.).

The mean step lengths over the final 13 footfalls for each condition with 95%

confidence intervals are shown below in Figure 2.6 for visual inspection.

76

Figure 2.6 The mean step lengths for the eight participants across the three levels of defensive pressure, calculated between the final 13 successive footfalls of the run-up to cross. Error bars = 95% confidence intervals.

The mean step lengths at each footfall were then compared between each level

of defensive pressure. The mean values and significant planned contrasts are

summarised below in Table 2.4.

Planned contrasts between the defender-absent and defender-far conditions

showed that early in the run up the players adopted significantly larger distances

between footfalls in the defender-absent condition between footfalls 12-11 (F(1,

7) = 14.07 (p ≤ .05)). This trend was reversed with the defender-absent condition

showing a significantly reduced step length compared to the defender-far

condition between footfalls 5-4 (F(1, 7) = 11.28 (p ≤ .05)).

Planned contrasts between the defender-absent and defender-near conditions

showed that early in the run up the players adopted significantly larger distances

between footfalls in the defender-absent condition between: footfalls 12-11 (F(1,

77

7) = 13.68 (p ≤ .01)); and, footfalls 10-9 (F(1, 7) = 6.62 (p ≤ .05)). This trend was

reversed with the defender-absent condition showing a significantly reduced step

length compared to the defender-near condition between: footfalls 5-4 (F(1, 7) =

5.61 (p ≤ .05)); footfalls 4-3 (F(1, 7) = 5.29 (p ≤ .05)) and footfalls 3-2 (F(1, 7) =

15.45 (p ≤ .05)).

Despite trends in which the attacking players adopted larger step lengths

particularly over footfalls 6-3, there were no significant planned contrasts in the

step lengths adopted between the defender-far and defender-near conditions

over final 13 footfalls leading into the cross.

78

Table 2.4 Planned contrast of the mean distances (m) between the final 13 successive footfalls across the three levels of defensive pressure.

Step Defender Condition

Absent Far Near

13-12 1.24 1.16 1.18

12-11 1.402,3 1.311 1.281

11-10 1.46 1.42 1.41

10-9 1.553 1.51 1.491

9-8 1.58 1.57 1.55

8-7 1.65 1.62 1.61

7-6 1.75 1.71 1.72

6-5 1.66 1.76 1.68

5-4 1.522,3 1.731 1.711

4-3 1.283 1.41 1.46 1

3-2 1.363 1.50 1.631

2-1 1.25 1.25 1.31

1-0 1.77 1.76 1.71 Pair-wise significant effects numbered where different to 0.05 level (1absent/2far/3near at 0.05 level)

2.3.2.3. Absolute Foot/Ball Distance

The mean foot/ball distance (m) observed over the final 13 footfall in the run-up

were analysed in a one way ANOVA with repeated measures with three levels of

Defensive Pressure. The results indicated no significant main effect of Defensive

Pressure on the mean foot/ball distance of the attacking players (F(1, 14) =

3.43).

Planned contrasts of the average foot/ball distance between the different levels

of defensive pressure however, showed that the players in the defender-absent

condition covered significantly more ground over the final 13 footfalls than the

defender-near condition (F(1, 7) = 8.27 (p ≤ .05). No other significant differences

between conditions emerged. These findings are summarised above in Error!

Reference source not found..

The mean foot/ball distance over the final 13 footfalls for each condition with

95% confidence intervals are shown below in Figure 2.7 for visual inspection.

79

Figure 2.7 Mean foot/ball distances across the three levels of defensive pressure calculated over the final 13 footfalls. m = metres. Error bars = 95% confidence intervals.

The mean foot/ball distance at each footfall (12-0) were then compared between

each level of defensive pressure. The mean values and significant planned

contrasts are summarised below in Table 2.5.

Planned contrasts of the mean foot/ball distance at each footfall between the

defender-absent and defender-far condition revealed that in the defender-far

condition, players were further from the ball at footfall 0 (F(1, 7) = 9.99 (p ≤

.05)). No other significant differences were found between these groups at any

other footfall.

Planned contrasts of the mean foot/ball distance at each footfall between the

defender-absent and defender-near condition revealed that in the defender-near

condition, players had covered significantly less distance at: footfall 12 (F(1, 7) =

5.07 (p ≤ .05)); footfall 11 (F(1, 7) = 6.74 (p ≤ .05)); footfall 10 (F(1, 7) = 6.94 (p

≤ .05)); footfall 9 (F(1, 7) = 7.89 (p ≤ .05)); footfall 8 (F(1, 7) = 8.22 (p ≤ .05));

80

footfall 7 (F(1, 7) = 9.27 (p ≤ .05)); footfall 6 (F(1, 7) = 9.76 (p ≤ .05)); footfall 5

(F(1, 7) = 7.02 (p ≤ .05)); footfall 4 (F(1, 7) = 6.44 (p ≤ .05)); and, footfall 0 (F(1,

7) = 6.20 (p ≤ .05)).

Planned contrasts of the mean foot/ball distance at each footfall between the

defender-far and defender-near condition revealed that there were no footfalls

where these two conditions were significantly different.

Table 2.5 Planned contratsts of the mean foot/ball distance (m) at the final successive 13 footfalls for the three levels of defensive pressure.

Footfall Defender Condition

Absent Far Near 12 18.603 18.99 19.041

11 17.213 17.69 17.761

10 15.743 16.26 16.351

9 14.203 14.76 14.861

8 12.623 13.19 13.311

7 10.963 11.57 11.701

6 9.213 9.86 9.981

5 7.55,3 8.10 8.301

4 6.033 6.37 6.591

3 4.75 4.96 5.13

2 3.39 3.46 3.50 1 2.14 2.21 2.19

0 0.372,3 0.451 0.481

Pair-wise significant effects numbered where different to 0.05 level (1absent/2far/3near at 0.05 level).

2.3.3 Displacement Velocity

The mean horizontal displacement velocities observed over the final 13 footfall

(minus footfall 0) in the run-up were analysed in a one way ANOVA with repeated

measures with three levels of Defensive Pressure. The results indicated a

significant main effect of Defensive Pressure on the mean horizontal

displacement velocity (m•s-1) of the attacking players (F(1.22, 8.58) = 8.69 (p ≤

.05)).

Planned contrasts of the average velocity between the different levels of

defensive pressure showed that the players in the defender-absent condition ran

significantly slower than when undertaking the cross compared to the defender-

81

near condition (F(1, 7) = 57.12 (p ≤ .05). Additionally, players in the defender-far

condition ran significantly slower than the defender-near condition (F(1, 7) =

7.41 (p ≤ .05). No other significant differences emerged between groups (Error!

Reference source not found.).

The mean horizontal displacement velocity (m•s-1) over the final 13 footfalls

(minus footfall 0) for each condition of defensive pressure with 95% confidence

intervals are shown below in Figure 2.8 for visual inspection.

Figure 2.8 Mean horizontal displacement velocity across the three levels of defensive pressure calculated at each footfall. Note that because the central moving differences method was used, the final footfall (0) is unknown. m•s-1 = metres per second. Error bars = 95% confidence intervals.

The mean horizontal displacement velocity at each footfall (12 to 1) were then

compared between each level of defensive pressure. The mean values and

significant planned contrasts are summarised below in Table 2.6.

82

Planned contrasts of the mean velocity at each footfall between the defender-

absent and defender-far condition revealed that in the defender-far condition,

players ran significantly faster at: footfall 8 (F(1, 7) = 6.47 (p ≤ .05)); footfall 6

(F(1, 7) = 12.96 (p ≤ .05)); and, footfall 5 (F(1, 7) = 17.21 (p ≤ .05)). This trend

was reversed with the attacking players adopting a significantly slower velocity at

footfall 1 in the defender-far condition compared to the defender-absent

condition (F(1, 7) = 25.48 (p ≤ .05)).

Planned contrasts of the mean velocity at each footfall between the defender-

absent and defender-near condition revealed that in the defender-near condition,

players ran significantly faster at: footfall 7 (F(1, 7) = 20.17 (p ≤ .05)); footfall 6

(F(1, 7) = 41.48 (p ≤ .05); footfall 5 (F(1, 7) = 90.34 (p ≤ .05)); footfall 4 (F(1, 7)

= 48.98 (p ≤ .05)); and, footfall 3 (F(1, 7) = 30.91 (p ≤ .05)). This trend was

reversed with the attacking players adopting a significantly slower velocity at

footfall 1 in the Defender Near condition compared to the defender-absent

condition (F(1, 7) = 11.60 (p ≤ .05)).

Planned contrasts of the mean velocity at each footfall between the defender-far

and defender-near condition revealed that in the defender-near condition,

players ran significantly faster at: footfall 7 (F(1, 7) = 6.76 (p ≤ .05)); footfall 5

(F(1, 7) = 10.39 (p ≤ .05)); footfall 3 (F(1, 7) = 5.35 (p ≤ .05)); and, footfall 2 (F(1,

7) = 7.30 (p ≤ .05)).

83

Table 2.6 Planned contrasts of the mean displacement velocity (m•s-1) at the final successive 13 footfalls for the three levels of defensive pressure.

Footfall Defender Condition

Absent Far Near 12 5.13 4.92 4.94

11 5.58 5.48 5.48 10 5.80 5.86 5.88 9 5.98 6.04 6.12

8 5.972 6.211 6.19 7 6.043 6.193 6.391, 2

6 6.012,3 6.431 6.721

5 5.682,3 6.211,3 6.521,2

4 5.623 5.98 6.221

3 5.073 5.213 5.551,2

2 4.38 4.073 4.522

1 3.432,3 2.311 2.621

Pair-wise significant effects numbered where different to 0.05 level (1absent/2far/3near at 0.05 level).

2.4 DISCUSSION

The aims of this experiment were to consider: (i) whether the football kick is

under similar funnel shaped control as other locomotor pointing tasks, (ii) how

movement coordination is influenced by instructional task constraints compared

to dynamic interpersonal constraints, and (iii) whether players attend to a critical

threshold informed by the action capabilities from themselves and their

opponent. In consideration of the results, the aims of the experiment will be

evaluated in the discussion below.

2.4.1 Effect of Dynamic Constraints in the Run-Up to perform a cross

pass in Football

The patterns of foot/ball distance standard deviations (SDs) observed in this

study showed similarities with data from previous locomotor pointing studies

(see for example Maraj, et al., 1998). Referring to Figure 2.5, in broad terms it

appears that as players ran to approach the ball between trials they accumulated

variability in the values of their foot/ball distances and at a specific footfall with

variability in positioning of footfalls relative to the ball being systematically

reduced to low levels prior to foot/ball interaction. The same pattern of

84

ascending/descending variability, first described by Lee et al. (1982), appears

also to occur in the football cross run-up to kick a ball, whether a defender is

present or not.

Scott et al. (1997) suggested that patterns of variability shown in run-ups reflect

an index of the control strategy used. If this were the case, it appears different

control strategies are operating between conditions where the attackers were

unopposed, compared to those where there was defensive pressure from

defenders. When defensive pressure was present in the experiment, the amount

of trial-to-trial foot/ball distance variability observed showed that the defender-

absent condition contained significantly more performance variability across

trials during the early footfalls of the run-up.

A similarly significantly (p < .05) larger amount of foot/target variability was

shown by Maraj et al. (1998) in a triple-jump group in a condition that involved

no speed or accuracy related instructions compared to instructions that

emphasized either speed or accuracy. When long jumpers were given specific

instructions to maintain certain levels of speed or accuracy, the trial-to-trial

variability in the foot/board distance of footfalls reduced significantly.

The findings by Maraj et al, (1998) suggested that experimental task constraints

change the control strategies that humans use to achieve the same task goal. In

this group of football players, when undertaking a cross the presence of the

defender reduced the amount of variability in successive footfall distances

relative to the ball between trials. This finding makes sense in that when a

defender is present there is, ‘less room for error’ in that mistakes during the run-

up might allow the defender to get to the ball first, or the attacker may be unable

to carry out the nested task at the end of the approach run. That is, players may

have discarded patterns of foot/ball coordination that were no longer perceived

as functional when the task also involved getting to the ball before an opponent.

The reduction in foot/ball distance variability between trials makes much more

sense when evaluating the step length patterns shown above in Figure 2.6. The

pattern of step length systematically changes in the run-up between footfalls 7-8

in the defender-absent condition and between footfalls 5-4 in the ‘With Defender’

85

conditions. Specifically, the defender-absent condition began reducing step

lengths two footfalls prior to when they began reducing step lengths when under

defensive pressure.

This delay in when step lengths are reduced when under defensive pressure

suggests that players have fewer footfalls over which they prepare for the kick

and in the defender-absent condition; this group of participants allowed

themselves more footfalls to prepare for the kick. The reduction in footfalls

available to prepare for the kick meant the football players reduced early

variability in their footfalls relative to the ball in the run-up. This interpretation

that players reduce foot/ball distance variability because they have fewer steps

to generate adjustments at the end of the run-up is in line with the research by

Montagne et al, (2000) who found that the amount of variability accrued during

the run-up is associated with the amount of adjustments required in the final

footfalls. In order that the process of preparing for the kick be less likely to be

disturbed by dysfunctional foot/ball position during the run-up, football players

might have more carefully positioned successive footfalls relative to the ball. This

interpretation is supported by the reduced foot/ball variability between trials

when players were under defensive pressure as opposed to no defensive

pressure.

Intriguingly, as the defender was scaled closer, overall mean foot/ball variability

begin to increase again (refer to Error! Reference source not found., showing an

increase in variability in the Defender Near condition compared to the Defender

Far condition). This trend of an increase in variability as the defender was scaled

closer would suggest that an apparent ‘destabilisation’ was occurring in how

players were coordinating relative to the ball. For example because the defender

may have been slightly closer at the point when the attackers were kicking, the

attacking players may have begun kicking the ball differently, introducing a

greater amount of variability into overall pattern. This interpretation is supported

when examining the absolute foot/ball distance patterns (see Table 2.5 and

Figure 2.7) and the foot/ball distance SD data at footfall 0. This data revealed

that when under the defender-near condition players were both significantly

86

more variable in the positioning of this final footfall, and positioned their foot

significantly further from the ball in supporting the kicking leg.

Since in dynamic systems, increased variability after a period stability is

predictive of change (Davids, Bennett, et al., 2006), it is likely that if the

defender was scaled even closer a qualitatively change in how the attackers

coordinated themselves relative to the ball would have emerged revealed by a

renewed measure of low level variability. For example instead of preparing to kick

the ball, the attacking players may no longer perceive this as an option and

instead begin a straight run to the ball to ensure they were at least able to

‘possess’ it after the run-up.

The importance of football players reducing variability when under defensive

pressure is important for another and interrelated reason when considering the

patterns of horizontal displacement velocities between conditions and the data

on both the foot/ball absolute distance (see Table 2.5) and variability at the plant

phase footfall (see Table 2.3).

Bradshaw and Sparrow (2001) provided evidence for a speed-accuracy trade-off

when participants were asked to position a foot as close to a line as possible

under different displacement velocities (walking, jogging, sprinting; as described

in section 1.4.3.3 Task Constraints that have Manipulated Running Velocity). In

this group of football players, it is shown in Figure 2.8, that with added presence

of a defender and as the defender was positioned closer, players ran faster

overall (see Error! Reference source not found. for planned contrasts between

levels of average displacement velocity under different levels of defensive

pressure). Displacement velocity underwent a more abruptly sloped deceleration

(Table 2.6 shows how at footfall 5 the defender-absent condition players were

travelling significantly slower than when under defensive pressure. However, at

footfall 1 player’s travelled significantly faster than when under defensive

pressure. As a result, the deceleration over the final 5 footfalls was significantly

greater than when no defensive pressure was present.

In light of the velocity data an alternative to the explanation that, the change in

football distance at the plant phase was a reflection of different kicking strategy,

87

is that it may have been due to a possible speed/accuracy trade off. By

examining the running velocity profiles of the attacking players between

conditions, the consequences of delaying when to begin preparing for the cross

(i.e. shown in the step length data, see Table 2.4) appeared to result in a greater

peak velocity in the With Defender conditions because of the larger step lengths

the players generated just prior to preparing for the kick. Presumably the football

players ran faster in order to make sure they reached the ball before the

defender. The trade-off of generating a larger peak running velocity and

deceleration however, may have been both a greater amount of variability in the

positioning of the plant phase footfall relative to the ball and a change in the

absolute distance of the plant phase footfall relative to the ball.

Since however, previous research has also associated variability as being

functional for performance (Davids, Bennett, et al., 2006), these two possible

explanations (i.e. functional variability and speed/accuracy trade-off) for changes

in foot-to-ball coordination warrant further investigation. It may be that in the

zeroing-in phase, the interpersonal information from the defender might

generate required adjustments in the attacker. For example, they may need to

kick the ball differently from trial-to-trial because in some instances the defender

might be closer and be able to intercept the ball unless the attacker kicked it

higher, or with a curved path. Alternatively, the increased running velocity and

greater deceleration may have prevented the attackers from positioning their

feet as accurately due to a loss of control at these higher speeds.

The final concern of this study was to consider whether the attacking players

attended to a critical threshold that separated possible from impossible

behaviours and that informing this threshold was the affordances of the action

capabilities of the attacking and defending players. Indeed as the defending

player was scaled closer, the attacking player significantly increased their peak

velocity and deceleration velocity over the final 5 footfalls (see Table 2.6). This

would support the conclusion that the attacking players were managing the

interpersonal distance of the defender on a trial-by-trial basis informed by the

affordances of each player.

88

2.5 CONCLUSIONS AND FUTURE RESEARCH

This study has shown how interpersonal constraints on the time and space

available to a football player shape the emergence of movement patterns used

to perform a run-up and cross. The data show that performers use movement

pattern variability to regulate the functionality of their behaviours. Specifically,

the findings reported here: (i) reflect a funnel shaped control over repeated trials;

(ii) show how attackers vary running velocity under the constraint of defensive

pressure, and as a defender’s positioning is scaled closer to the nested task; (iii)

show a delay in when the emergent deceleration process begins and the number

of footfalls over which it occurs when defensive pressure is present; (iv) suggest

that because fewer footfalls are available in the deceleration process under

defensive pressure, players more carefully position successive footfalls during

the early part of the run-up; and (v), reflect a sharper declining approach velocity

slope in an attacker when the defensive pressure is present which may result in

greater variability in the planting phase footfall or result in a strategic change in

the kick due to the interpersonal distance of the defensive player.

Exactly how the interpersonal distance of each attacker and the defender was

managed throughout performance is unknown because the position of the

defender was not recorded during the run-up, being beyond the scope of the

present study. The increase in running velocity that occurred when the defender

was present and positioned closer, suggests players in this study managed the

distance of the defender throughout the later portion of the run-up. Future

research hoping to confirm affordance-based control in human performance

environments should include the interpersonal level of analysis on top of the

observation of action capabilities.

The observation of a funnel-shaped control in the football run-up to kick confirms

that football players, like long jumpers and cricket bowlers (Montagne, 2005), do

not generate a stereotyped run-up coordination with the object of interception,

rather they make functional adjustments in final phase of approaching the

football ball in order to kick it. An interesting question for future research is

whether similar patterns of player/ball coordination tendencies emerge when

89

players dribble a ball prior to passing it. This study has shown the efficacy of

considering the player-ball as a system that displays emergent coordination

patterns under constraints. Whether this method can be extended to understand

player/ball coordination whilst dribbling would be an interesting question for

future research considering the vast majority of research into kicking football

balls has been under conditions when the ball is stationary (Kellis & Katis, 2007;

Lees, Asai, Andersen, Nunome, & Sterzing, 2010; Lees & Nolan, 1998).

Future research should seek to consider player/ball coordination tendencies

when football players are able to dribble the ball since this is a task that also

commonly occurs prior to crossing a ball in football. Whether football players

generate a preferred foot/ball distance coordination pattern when they are in

control of the ball would suggest that interpersonal information driving the

differences in coordination tendencies in this study were due to the need to get

the ball faster. If player’s dribble the ball prior to making a pass they are

effectively in control of when they pass and may not change their coordination

patterns to achieve the cross pass when under defensive pressure.

How locomotor pointing is influenced when players dribble a ball is unknown, for

example how does dribbling a ball change gait preceding a cross? Will the

presence of a defender alter this process as in this study, or because players

now have control of the ball during the run-up, will participants moderate

approach velocity in a stable and unperturbed way? Based on the research

findings in this study, it would be predicted that football players would still reduce

the between trial variability in their successive foot/ball distances throughout the

run-up. This is because any mistake in the process would mean the defender

could prevent the attacker from undertaking the cross. However, assuming that

an increased velocity is associated with an increased variability at the planting

phase footfall it would be expected that football players would not increase

velocity relative to defensive pressure, rather they would pass the ball earlier.

In the second study of this thesis, an experiment was designed to consider how

locomotor pointing is influenced when players dribble a ball, scaled to the same

levels of defensive pressure in this study (i.e. absent, far at 20% disadvantage,

and near at 10% disadvantage).

90

91

Chapter 3: Study 2

3. EFFECTS OF DIFFERENT LEVELS OF DEFENSIVE PRESSURE ON EMERGENT

BEHAVIOURS OF BALL-CARRIERS IN FOOTBALL

3.1 INTRODUCTION

The aim of this second experiment was to consider how coordination of gait is

constrained when football players dribble a ball in order to carry out a cross pass

at the end. Two key questions are addressed: (i) is the player-to-ball coordination

when dribbling under the same funnel shaped control as observed when players

run towards a stationary ball?; and (ii) how are gait parameters influenced by

different levels of defensive pressure when football players are able to dribble

the ball before crossing it?

Currently, no research from a coordination and control perspective has examined

the influence of dribbling a ball on gait parameters. Research from physiological

perspectives have used player tracking technologies to relate the movement

displacement trajectories of players to physiological estimates of energy

expenditure (Nevill, Atkinson, & Hughes, 2008). It has been shown that over the

course of a match individual players tend to dribble the ball a total distance of

119-286 m (Di Salvo et al., 2007). Experimental physiological studies have also

considered player-to-ball relations in the task of dribbling whilst on a treadmill

(Reilly & Ball, 1984). Reilly and Williams (2003) reported that the energy

requirements for dribbling a ball incurred an additional burden of 5.2kJ.min-1 on

players’ energy expenditure above what is expended when running without a ball.

Additionally it was found that lactate measures and perceived exertion also

appear to be higher when dribbling as opposed to jogging without a ball on a

treadmill (Reilly & Williams, 2003). Gait cycle characteristics whilst dribbling were

also examined in this study, where stride rate was found to increase and stride

lengths decreased compared with running free at the same relative speed. Key

92

limitations of physiological research is that: (i) in the case of player tracking

studies, the descriptive methods used mean each action of the player is

decontextualised from the performance behaviour of dribbling; and (ii), the

measurements of football players whilst dribbling on a treadmill is likely to

represent a very different task constraint than that required in the performance

environment. When players run and dribble with a ball during games, they do so

under the specific constraints of the performance context, such as the presence

of defenders and team mates. The presence and positioning of defenders, for

example, in Study 1 of this thesis have been shown to influence how players

coordinate movements relative to the ball and should be a feature of

experimental designs that consider the movement coordination of football

players.

The aims of this study were to: (i) test whether dribbling the ball reduces the

variability in foot/ball distance between trials during the acceleration phase

when under defensive pressure, and (ii) test whether football players gait

patterns and displacement velocity remains stable under defensive pressure

when free to chose when and where to kick from.

3.2 METHODS

The same eight participants were involved in this study as Study 1 (see Table

2.1). The same apparatus and data capture procedures were also reapplied in

this experiment from Study 1 (see section 2.2.3 Apparatus, and section 2.2.4

Data Capture above). In addition, the same dependent variables, foot/ball

distance SD, step length patterns and the horizontal displacement velocity of the

players were used to evaluate the independent variables in this study (i.e.

dribbling under no defensive pressure, and increased levels of defensive

pressure, detailed below in section 3.2.1 Task). Because of the nature of the

dribbling task constraints in this study, which did not pre-specify where and when

to generate the cross (i.e. the participants could cross the ball at any time and

place), the additional dependent variable, ‘player-to-by-line distance’ was

consequently evaluated. This measure indicated how far down the field the

players dribbled the ball before making the cross. The closer to the by-line that

93

they got, the further they had dribbled the ball. Finally, rather than evaluate the

foot/ball absolute distance at each footfall (as in Study 1), only the final plant

phase foot/ball distance was considered as this value is of interest to evaluate

whether kicking strategy changed between levels of defensive pressure.

3.2.1 Task

Below, Figure 3.1 depicts the nature the task and roles of each player. The

attacker (denoted A) was instructed to sprint with the ball (denoted B) to the by-

line and cross it back towards the penalty spot. A receiving player (denoted R)

was instructed to receive the ball at the penalty spot and attack the goal. A goal-

keeper (denoted GK) was instructed to protect the goal. In conditions where one

was present, the defender (denoted D) was instructed to meet the attacker at the

earliest point and stop the cross. In order to ensure health and safety,

participants were instructed to perform within the laws of the game with an

emphasis on the non-contact requirements of the sport. To enforce the laws of

the game a referee was positioned in the field. The task was initiated at the

attacker’s discretion after a signal from the referee.

94

Figure 3.1 Schematic of the experimental task in Study 2. B = Ball, A = Attacker, GK = Goal-keeper, R = Receiver, D = Defender. Only the defender was changed across conditions of defensive pressure (i.e. absent, far or near), all other variables were held constant. The numbered scale reflects meter units. The arrow indicates that the target for the attacker was the penalty spot. The brackets indicate that the attacker was free to pass at any location in the approach toward the by-line.

A one way analysis of variance (ANOVA) with repeated measures was used to

investigate the effect of the three levels of defensive pressure (Defender Absent

(control), Defender Far and Defender Near) on the overall means of the

dependent variables and also the means at each footfall leading into the cross.

Participants performed four trials for each of the three levels of defensive

pressure for a total of 12 trials per participant (i.e. a total of 32 trials per

condition and a grand total of 96 trials across the three conditions). Trials were

completed over two separate testing sessions. Participants were scheduled 2-

minute rest periods between trials or took as long as required. Treatments were

counterbalanced using a quasi-Latin square design.

Direction

of play

95

Defenders were positioned with a 20% and a 10% disadvantage relative to the

attacker. This was achieved by recording each defender’s sprint time over 20 m

and each attacker’s time to dribble a ball as quickly as possible over 20 m and

cross the ball. The same procedure described in Study 1 to position the

defenders was used (refer to Appendix A: for Action-Scaled Adversary Distance

for formulas and to section 2.2.5 Experimental Design for a more detailed

description). Note also that the degrees of freedom were derived in the same

way as Study 1.

3.3 RESULTS

The results are presented in two sub-sections below. The first sub-section is

concerned with the foot/ball position effects across the three conditions of

defensive pressure. These include the foot/ball variability and the successive

mean step lengths. The second section is concerned with the horizontal

displacement velocities at each footfall prior to the planting phase footfall and

the distance from the by-line that the pass emerged between the different levels

of defensive pressure. As with Study 1 because of the multiple levels of

independent variables, where the assumptions of sphericity were violated

according to Mauchly’s test, effects were reported with the degrees of freedom of

the error term of the ANOVAs corrected using the Greenhouse-Geisser estimates

of sphericity (Shutz & Gessaroli, 1987). Note also that the degrees of freedom

were determined using the same method described in section 2.2.5

Experimental Design.

In interpreting the following data, it is critical to note that, the final 11 footfalls

are evaluated across the three conditions of defensive pressure because this

number of footfalls was common to all participants across the three conditions.

In addition, for ease of interpretation, also note that the footfalls are reported by

number from the plant phase footfall. For example footfall number 0 indicates

this is the final planted foot position used to support the kick. Footfall number 1

indicates that this is one footfall from the plant phase footfall and so on. Error!

Reference source not found. shows the main effects of the defensive pressure

96

conditions and provides overall mean values on each of the dependent variables

under the three levels of defensive pressure.

Table 3.1 Main effects of Study 2.

Gait Characteristic

Main Effect,

F (dfM, dfR)

Player

Absent Far Near

By-Line Distance (m) at Footfall 0

3.02 (2,12) 3.50 ±0.74

4.81 ±1.27

4.62 ±1.01

Mean Footfall Variability (m)

0.57 (2, 12) 0.72 ±0.42

0.63 ±0.32

0.82 ±0.81

Mean Step Length (m)

0.53 (2, 12) 1.45 ±0.05

1.48 ±0.09

1.48 ±0.10

Mean Horizontal Displacement Velocity (m•s-1)

2.86 (2, 14) 4.81 ±0.69

5.05 ±0.55

5.02 ±0.64

Mean Plant Phase Foot/ Ball Distance (m)

3.03 (2, 14) 3.51 ± 1.48

4.81 ±2.55

4.62 ±2.02

Outcome Variables

Accuracy (1 = received, 0 = not received)

1.36 (2,14) 0.59 ±0.19

0.53 ±0.21

0.56 ±0.21

Peak Ball Velocity (km•hr-1)

92.58 (2,14)*

80.62 ±2.78

67.89 ±2.57

65.81 ±2.56

Significant main effects starred (*0.05). Pair-wise significant effects numbered where different to 0.05 level (1Absent/2Far/3Near different at 0.05 level). CI = confidence intervals. dfM = Degrees of freedom of the model. dfR = Degrees of freedom of the residual. F = critical value for F-ratio

3.3.1 Outcomes

Two outcome measures were collected in order to provide an indication of level

of success performers were capable of achieving between levels of Defensive

97

Pressure. The mean values with 95% confidence intervals are shown below in

Figure 3.2 for visual inspection. The main effect of Defensive Pressure on Pass

Accuracy (1 = Received, 0 = Not Received) revealed no significant effect of

Defensive Pressure, F(2, 14) = 0.13. Additionally there were no significant

differences between conditions.

With regard to the peak ball velocities (m•s-1) generated by players, similar to

study 1 there was a significant main effect of Defensive Pressure, F(2, 14) =

53.28 (p ≤ .05). Planned contrasts showed that players kicked the ball fastest in

the defender-absent condition compared to the defender-far condition (F(1, 7) =

10.69 (p ≤ .05) and the defender-near condition (F(1, 7) = 10.87 (p ≤ .05)).

However there were no significant differences in ball speeds between the

defender-near condition compared with the defender-far condition.

Figure 3.2 Mean outcomes of accuracy (primary axis) and ball velocity (secondary axis) when players were required to dribble the ball under different levels of defensive pressure. m/s = metres per second. Error bars = 95% confidence intervals.

98

3.3.2 Foot/Ball Distance and Step Length Control Analysis

3.3.2.1 Foot/Ball Distance Variability

The mean foot/ball distance standard deviations (m) for the final 11 footfalls

were examined across each of the three levels of defensive pressure. A one way

ANOVA with repeated measures was conducted on the effect of the three levels

of defensive pressure on overall mean foot/ball distance variability. There was no

significant main effect of level of Defensive Pressure found, F(1.46, 10.22) =

0.40.

The mean standard deviations of the foot/ball distances were plotted below with

95% confidence intervals in Figure 3.3 for visual examination.

Figure 3.3 Mean foot/ball distance variability patterns of the eight participants for each of the three levels of defensive pressure for the final 11 footfalls of the dribble to cross. Error bars = 95% confidence intervals.

The plot showed an unexpected trend in the foot/ball distance SDs at the plant

phase footfall in the defender-absent condition. Instead of reducing

99

systematically during the zeroing in phase as expected, the foot/ball distance

variability increased. An individual analysis was undertaken to explore the data

for potential outliers. An outlier beyond three standard deviations from the mean

was shown by participant number 2 (shown below in Figure 3.4). The data of

Participant Two was subsequently removed from future data analyses regarding

foot/ball coordination variables.

Figure 3.4 Participant Two’s foot/ball distance variability patterns for the three levels of defensive pressure. Note the large and non-declining nature of the Defender Absent condition.

The ANOVA with repeated measures was repeated on the foot/ball distance

variability between the three levels of defensive pressure to the exclusion of

Participant Two. The main effect of Defensive Pressure again did not show a

significant effect, F(1.55, 9.31) = 0.57. However, there was a large change in the

defender-absent final foot/ball distance SD pattern which can be seen below in

100

Figure 3.5. No planned contrasts showed significant differences between

conditions at any footfall (the mean values for each condition are summarised

above in Error! Reference source not found.).

Figure 3.5 Mean foot/ball distance variability patterns of seven participants (to the exclusion of Participant Two) for each of the three levels of defensive pressure for the final 11 footfalls of the dribble to cross. Note the large reduction in the mean foot/ball distance SDs in the No Defender conditions final few footfalls. Error bars = 95% confidence intervals.

3.3.2.2 Absolute Step Lengths

The step length patterns were analysed across the final 11 footfalls for each

three conditions of defensive pressure. A one way ANOVA with repeated

measures with 3 levels of Defensive Pressure was conducted on the overall

mean step length adopted by the attacking players for each condition. The main

effect of Defensive Pressure was not statistically significant (F(1.52, 11.57) =

0.53, nor were there any significant planned contrasts found between groups.

The overall mean values across the three levels of defensive pressure are

summarised above in Error! Reference source not found..

101

The mean values and 95% confidence intervals of the distance between each

successive footfall for each condition of defensive pressure are summarised

below in Figure 3.6 for visual inspection.

Figure 3.6 The mean step lengths for the seven participants (participant number 2 excluded) across the three defensive pressure conditions for Study 2. Step lengths were calculated by taking the difference between the final 11 successive footfalls of the dribble to cross.

The mean step lengths at each footfall were then compared between each level

of defensive pressure. The mean values and significant planned contrasts are

summarised below in Table 3.2.

Planned contrasts between the defender-absent and defender-far conditions

showed that early in the run up the players adopted significantly larger step

lengths when undertaking the cross in the defender-absent condition between

footfalls 7-6 F(1, 6) = 8.63 (p ≤ .05). This trend was reversed however later in the

run-up with the players adopting a significantly larger step length when

undertaking the cross under the defender-far condition between footfalls 5-4,

102

F(1, 6) = 12.49 (p ≤ .05). No other significant differences between the two

conditions emerged.

Planned contrasts between the defender-absent and defender-near conditions

showed that early in the run up the players adopted shorter step lengths under

the defender-near condition between: footfalls 10-9 F(1, 6) = 6.07 (p ≤ .05) and

footfalls 8-7 F(1, 6) = 7.53 (p ≤ .05). Despite trends of an increase in step length

under the defender-near condition, specifically between footfalls 5-4, no other

differences between the two conditions emerged.

There were no significant planned contrasts in the step lengths adopted between

the defender-far and defender-near conditions over final 11 footfalls leading into

the cross.

103

Table 3.2 Planned contrasts of the distance between the final 11 successive footfalls across the three conditions of defensive pressure when players dribbled the ball.

Step Defender Condition

Absent Far Near

11-10 1.38 1.39 1.34

10-9 1.553 1.43 1.391

9-8 1.433 1.41 1.491

8-7 1.64 1.54 1.56

7-6 1.452 1.561 1.58

6-5 1.54 1.60 1.67

5-4 1.462 1.601 1.59

4-3 1.32 1.37 1.42

3-2 1.44 1.39 1.37

2-1 1.20 1.20 1.22

0-1 1.70 1.65 1.73

Pairwise significant effects numbered where different to 0.05 level (1absent/2far/3near at 0.05 level)

3.3.3 Velocity Change during the Dribble to Cross

The mean horizontal displacement velocities (m•s-1) observed over the final 11

footfall (minus footfall 0) in the run-up were analysed in a one way ANOVA with

repeated measures with three levels of Defensive Pressure. The results indicated

a non-significant main effect of Defensive Pressure on the mean horizontal

displacement velocity of the attacking players (F(2, 14) = 2.86).

Pair-wise comparisons of the average velocity between the different levels of

defensive pressure showed no significant differences between conditions. These

findings are summarised above in Error! Reference source not found..

The mean horizontal displacement velocity (m•s-1) over the final 11 footfalls

(minus footfall 0) for each condition with 95% confidence intervals are shown

below in Figure 3.7 for visual inspection.

104

Figure 3.7 Mean horizontal displacement velocity across the three conditions calculated for the final 11 footfalls (minus footfall 0). Note that because the central moving differences method was used, the final footfall (0) is unknown. m/s = metres per second. Error bars = 95% confidence intervals.

The mean horizontal displacement velocity at each footfall (10 to 1) were then

compared between each level of defensive pressure. The mean values and

significant planned contrasts are summarised below in Table 3.3.

Planned contrasts of the mean velocity at each footfall between the defender-

absent and defender-far condition revealed that in the defender-far condition,

players ran significantly faster at: footfall 7 (F(1, 7) = 6.77 (p ≤ .05)); footfall 6

(F(1, 7) = 13.12 (p ≤ .05)); and, footfall 5 (F(1, 7) = 8.79 (p ≤ .05).

Planned contrasts of the mean velocity at each footfall between the defender-

absent and defender-near condition revealed that in the defender-near condition,

players ran significantly faster at: footfall 7 (F(1, 7) = 5.14 (p ≤ .05)); footfall 6

(F(1, 7) = 7.17 (p ≤ .05); and, footfall 5 (F(1, 7) = 6.52 (p ≤ .05).

105

Finally, there were no significant differences between the defender-near

condition compared to the defender-far conditions.

Table 3.3 Planned contrasts of the mean horizontal displacement velocity (m•s-1) at each of the final 11 (minus footfall 0) footfalls for each level of defensive pressure.

Footfall Defender Condition

Absent Far Near

10 5.13 4.91 4.82

9 5.21 5.39 5.30 8 5.25 5.41 5.40

7 5.142,3 5.431 5.401

6 5.112,3 5.521 5.531

5 4.842,3 5.321 5.371

4 4.75 5.17 5.12

3 4.57 4.81 4.75

2 4.23 4.39 4.38

1 3.52 4.02 4.08

Pair‐wise significant effects numbered where different to 0.05 level (1absent/2far/3near at 0.05 level)

3.3.4 Final Player-Byline Distance at the Cross

The foot-to-by-line distance at the plant phase footfall was analysed in a 3 level

(Defensive Pressure) one-way ANOVA with repeated measures. The analysis

revealed no significant main effect between levels of defensive pressure, F(2,

14) = 3.03. Though there was a trending significance for the players to kick the

ball further from the by-line when under defensive pressure, post hoc pair-wise

comparisons between the different combinations of the 3 levels of defensive

pressure showed no significant differences between conditions. The mean

values, main effects and outcomes of the planned contrasts of the plant phase

footfall-to-by-line distance are displayed above in Error! Reference source not

found..

106

3.4 DISCUSSION

The aim of this experiment was to consider: (i) are the player-to-ball coordination

tendencies when dribbling under the same funnel shaped control as shown when

players run to kick a stationary ball?; and (ii) how are gait parameters influenced

by different levels of defensive pressure when football players are able to dribble

the ball before crossing it?

3.4.1 Funnel-Shaped Control During Dribbling

Referring above to Figure 3.5 (see section 3.3.2.1 Foot/Ball Distance Variability),

it can be seen that across all levels of defensive pressure, there is a

characteristic trend showing initially high amounts of foot/ball distance variability

and that at a given footfall, the variability systematically reduces to low levels

(beginning approximately at footfall 6 in the Defender Absent and at footfall 4 in

the defender-far and defender-near conditions). This overall player/ball distance

pattern of variability is similar to previous locomotor pointing research on long

jump and cricket bowler run-ups (Montagne, 2005) and to Study 1 of this thesis.

The similarities appear to confirm the presence of a funnel shaped control even

under conditions where the location of the position of the kick is not pre-

specified at the initiation of the task. The finding that funnel shaped control

occurs even under conditions when the location of the pass is not pre-specified

might indicate that players at some point in the dribbling process perceive and

act toward an emergent location area to perform the nested action, determined

in some part by the future arrival of the moving ball. Indeed, ubiquitous to all

players was the strategy of running with ball toward the by-line and at some

point, beginning a curved approach around the moving ball, intercepting it to

cross it whilst it was still moving.

Previous research into the volley ball pass has found that in intrinsically timed

tasks, or self-paced tasks, that funnel shaped control emerges despite the

location of the object for interception not held to a specific location in space

(Davids, Lees, & Burwitz, 2000). Players appear to generate a consistent relation

to objects for interception despite their variability in terms of a global coordinate

system. That is, players adapt readily to the position of a moving ball by

107

repositioning their own body and segmental orientations relative to the object for

interception (Davids, et al., 2000).

The lack of any distinct trends in the data sets between conditions raises doubts

as to whether this variability is indeed an indication of any specific control

strategy as was suggested in Study 1. There are limitations in the current

methods for calculating foot/ball variability when a player is dribbling a ball. It

might be for example, that the task should be reconsidered in that with each

successive touch with the ball the player is undergoing a locomotor pointing

process (i.e. running to the ball in order to kick it ahead themselves in order to

again be able to kick the ball). Future research should account of the specific

process of dribbling and undertake an individual, trial-by-trial analysis in order to

calculate each footfall relative to the balls next touch location rather than relative

to the balls final kicked position. Despite the limitations raised by the grouped

analysis used that may mask locomotor pointing strategies, the analysis in this

study can confirm that dribbling appears to undergo an acceleration phase,

characterised by high amounts of foot/kick-location variability, followed by a

zeroing-in phase, characterised by a systematic reduction to relatively low

amounts of foot/ball position variability, despite the location not being pre-

specified at the initiation of the task.

3.4.2 Effect of Defensive Pressure on Gait Parameters While

Dribbling

The effect of defensive pressure on gait parameters analysed in this study

showed some interesting results in contrast to those revealed in Study 1. The

step lengths (shown above in Figure 3.6, section 3.3.1.2) of the football players

displayed more shortening and lengthening in the acceleration phase of the

dribble process when compared with the Stationary Ball conditions in Study 1.

This ‘sawtooth’ pattern of step lengthening followed by step shortening during

the initial dribbling period (from footfalls 11 to 6 in the defender-absent

condition) occurs for several cycles of footfalls. However the pattern is

systematically reduced (or flattened) when defensive pressure was present (i.e.

the players appeared to systematically increase their step lengths without

108

intervening step length shortenings). The ‘flattening’ process under defensive

pressure might be associated with increased running velocity (see Figure 3.7 and

Table 3.3 for a summary of the mean velocity at each footfall across the three

levels of defensive pressure). This interpretation of a link between the step

length flattening and increased running velocity is supported in that the peak

running velocity significantly increased when under defensive pressure (see

Table 3.3).

The same trend in Study 1 where players appeared to delay the footfall at which

step lengths were systematically reduced under defensive pressure also

appeared to occur when players dribble a ball. This was shown by the

significantly larger step length between footfalls 5-4 in the defender-far

conditions when compared to the defender-absent condition (see Table 3.2).

Again as in Study 1, it would appear the presence of a defender results in

player’s sacrificing the number of footfalls over which they regulate the final

approach into the cross pass for the gain of an increased peak running velocity.

Delay in step length shortening occurred despite players having the ability to

pass at any point in the approach toward the by-line. Defensive pressure appears

to influence movement coordination of ball-carriers.

Whilst similar to Study 1 there was an increase in the peak running velocities of

the defender present as opposed the defender absent condition however, when

dribbling there was no dose response relationship between increased defensive

pressure and increased running velocity (i.e. there were no pair-wise significant

differences between the defender-far and defender-near conditions at any

footfall leading into the approach). As the defender was positioned closer, the

attacker did not run significantly faster. An explanation for the lack of an increase

in velocity relative to a closer defender is that the football players chose to pass

the ball earlier. Indeed, players under no defensive pressure trended toward

passing the ball significantly closer to the by-line compared to the defender

present conditions. An explanation of why there was no significant difference in

the distance of the kick at the plant phase might be that players in the defender-

near and defender-far conditions either passed early on some occasions, whilst

driving closer to the by-line on others. Future research interested in examining

109

how defensive pressure influences emergence of a pass location when players

are dribbling should take a trial-by-trial method of analysis.

The question raised in Study 1, whether players were adopting an undesirable

kicking strategy due to the requirement to run faster when under defensive

pressure, was evaluated in this study by considering the variability and absolute

distance between the plant phase foot and ball (data in Error! Reference source

not found.). Contrary to Study 1, when football players dribble the ball, there were

no significant differences in foot/ball distance variability or the absolute foot/ball

distance at the plant phase footfall. The non-significant differences suggest that

when football players have the ability to choose the pass location and have

control of the ball; they use a preferred foot/ball position at plant phase footfall

despite different levels of defensive pressure. This would suggest players are

capable of sacrificing speed without the consequences of not getting the ball

first.

Of the two hypotheses that might explain why football players do not change

plant phase strategies when dribbling (as they appeared to do when approaching

a stationary ball in Study 1) it is likely that this is related to the overall running

velocity being much lower by comparison to the stationary ball condition. Football

players’ plant phase foot positions become more variable when they are required

to run at high velocities due to needing to reach a pre-specified location prior to a

defender. However, the football players managed to be consistent between trials

in the plant phase footfall when they are able to dribble the ball prior to kicking it.

There appears to be a change in plant phase strategy when football players

travel at near maximal velocities up to 4 footfalls prior to preparing for the kick.

3.5 CONCLUSIONS AND FUTURE RESEARCH

This study has added to the current understanding of how football players control

and coordinate gait under conditions relevant to their performance context.

Methods from previous locomotor pointing research were shown to be useful in

analysing coordination during dribbling. Further analysis and research is

recommended to better capture how football players coordinate relative to each

touch of the football ball, rather than observing movement coordination relative

110

to the final ball position prior to a pass. Additionally, this study has also shown

that coordination of gait changes under the presence of defensive pressure:

football players reduce the number of footfalls over which they prepare for the

pass and increase their peak running velocity. However, in contrast to Study 1,

there appeared no evidence of a dose-response relationship in the running

velocities of the players when the initial position of the nearest defender was

scaled closer. The only explanation found for this was that players are able to

pass the ball at a self chosen position and manage velocity differently. Future

research is warranted to understand what information informs this choice of

passing position when defenders are pressuring the ball-carrier. The

interpersonal scale of analysis is needed if the influence of the defender is to be

more comprehensively understood.

111

Chapter 4: Conclusion

4. REFLECTIONS The two studies presented in this Master’s thesis have a number of theoretical

and practical implications. The contributions to the two interrelated areas of

sport science and human performance research will be summarised in the

following reflections section.

4.1 SUMMARY OF THE PRACTICAL IMPLICATIONS

This Master’s thesis has shown that there is a strong link between perception

and action during a representative passing task in football. This is evident in the

changes of intrapersonal coordination tendencies that emerge when a defender

is present to pressurise the time and space of the passing player. It is hoped that

the implications will influence future methods in sports science research that

hope to measure performance and influence its pedagogy by considering the

effect of constraints on perception and action couplings and subsequent

generalisability to the performance context.

4.2 SUMMARY OF THE THEORETICAL IMPLICATIONS

Locomotor pointing research provides an understanding into how humans are

influenced by information to support interactions with environments. This field of

research can be influenced by theoretical concepts such as affordances and

complex systems theory to provide an insight into explaining behavioural

emergence in sport and in day-to-day activities. This study goes some way in

showing that affordances can be included in generating experimental designs

that contain highly dynamic task constraints (i.e. such as other humans).

The importance of measuring both inter-personal and intra-personal variables in

this study showed how key objects and events are interacted with in a dynamic

performance context. Intrapersonal dynamics showed that lengthening and

112

shortening of footfalls is context dependent. Humans respond quantitatively

differently in how foot/object interactions are regulated when under dynamic

constraints. Differences in regulation reflect a change in how context specific

information modified movement coordination. Because of the strong link

between perception and action, the different velocities that players generated

suggest different information was being acted on. Additionally, because actions

were generated differently, for example the delay in when the players began to

decelerate and prepare for the kick, the opportunities available to undertake

regulatory behaviour become highly constrained and the room for error reduced.

Strikingly, this reduction in the room for error was shown to take effect over the

entire process of running to and approaching the football ball in Study 1. Under

dynamic constraints, representative of a participant’s performance tasks and

environment, perceptions and actions are quantitatively different experiences for

performers. Future experimental designs should consider the implications of the

environments and tasks performers are expected to reflect their perceptual-

action capabilities under.

The observation of a progressively increased velocity as the initial distances of

defender’s were scaled closer to the attacking players leave unanswered

questions for future research. The fact that players ran faster when the ball was

stationary and when dribbling supports the view that decisions in sport can occur

relative to an action-scaled boundary. However, because player interpersonal

distances were not analysed, the exact characteristics of this boundary or critical

action threshold remains unknown. The importance of measuring the

interpersonal distance of interacting players over time and throughout the

performance process might show important interrelated processes such as how

affordances are interacted with over the performance period.

The presence of critical thresholds for decision making in sport raises many

questions for future research. What might have happened to the attackers’

behaviours if, by action-scaling, reaching the ball before a defender was equi-

probable or if they were unable to reach the ball before the defender? Would the

attacking player change their approach trajectory once they no longer have time

to undergo the process of preparing for the cross. Might they instead begin to run

113

toward and shield the ball from the defender to ensure they at least gain

possession of the ball? What would the threshold be where a spontaneous

change in behaviour occur? Would it be relative to an action scaled value for

each attacker-defender dyad?

Theoretically, emergent decisional behaviour on the sporting field might be

conceptualised under a dynamical perception of affordances. The recording of

movement data from the defender was beyond the scope of this thesis, and

represents an area for further research. Future research should combine

methods of understanding affordances with measures of interpersonal dynamics

to consider whether this relatively simple rule (perception of affordances)

generates functional decisional behaviour in apparently highly complex

performance contexts. Theoretically, this idea would fulfil a gap between two

topics that have been researched separately: perceiving the action possibilities

of significant others and coordinating one’s own actions with dynamic objects.

114

Appendix A: Formulae for Action-Scaled Adversary Distance To clarify, the method of determining the initial position of the defender was

based on the manipulation of an action scaling7 equation. Whereby to calculate

the defender distance from the scheduled pass location two unknowns needed

to be established beforehand: (1) a measure of the velocity and associated

derivatives (time and displacement) of the attacking player under conditions

where they carry out the run and pass task; and (2) a measure of the velocity,

and associated derivatives, of the defender carrying out a straight run over the

same distance (that is in this case, a 20 m straight run without an additional task

nested to the end).

With these known, we may determine an action scaled distance (dDA.S.D.) (see

Dicks, et al., 2010) from the ball to position the defender which acts to equalize

the arrival time of the attacker and defender over a fixed attacker distance (in

this case 20 m). In other words both players should arrive at the ball at the same

time, despite having to cover separate distances. The following equation

exemplifies these variables:

VD.T. = dDA.S.D. / dTA.T.

Equation 4.1

Therefore to find dDA.S.D:

7 Action scaling in this case is used to cancel out the advantage that another player might have over functional and structural constraints.

115

dDA.S.D. = (dDD.T. / dTD.T.) (dDA.T. / VA.T.)

Equation 4.2

Where the attacker terms are defined as: overall attacker task velocity is VA.T.,

Attacker task time is dTA.T.,

and attacker task displacement is dDA.T.

And the defender terms are defined as: overall defender task velocity, VD.T.,

defender task time, dTD.T.,

and, defender task displacement, dDD.T..

With the action scaled distance known this may then be modified exactly by

percent variation.

116

Appendix B: Example Participant Information and Consent Forms

PARTICIPANT INFORMATION FOR QUT RESEARCH PROJECT


Pattern‐Forming Dynamics in Performer‐Ball Systems in Team Sports 


Research Team Contacts

Dominic Orth — Masters Student Professor Keith Davids — Supervisor

QUT School of Human Movement Studies QUT School of Human Movement Studies

Phone:  0434 436 736 / 3138 5835 Phone: 3138 8744

Email:  [email protected] Email:  [email protected]  

Doctor Ian Renshaw – Associate Supervisor 

QUT School of Human Movement Studies 

Phone: 3138 5825 

Email:  [email protected] 


DESCRIPTION 

This project is being undertaken as part of a Masters project for Dominic Orth. The 

project is funded by the Queensland University of Technology. The funding body will 

not have access to the data obtained during the project.  

117


The purpose of the project is to investigate influences on a football player’s ability 

to maintain possession of a ball whilst running and how this might affect successful 

passing and decision making when under defensive pressure. 


The research team requests your assistance because you are a skilled football 

player, between the ages of 14 to 17 years and currently involved in ongoing 

training to improve your performance in competitive football. 


PARTICIPATION 

Your participation in this project is voluntary. If you do agree to participate, you can 

withdraw from participation at any time during the project without comment or 

penalty. Your decision to participate will in no way impact upon your current or 

future relationship with QUT or with Kelvin Grove State College. 


Your participation will involve information being gathered about your age, leg 

lengths, height and practice history. You will then be filmed on your football field 

whilst wearing small sensors that can measure your legs movements (positioned o 

of each of your thighs and back and with a total additional weight of 450 grams) as 

you undertake tasks similar to those you would normally perform during training or 

match situations.  Specifically, these tasks will ask you to take the role of an 

attacking and defending player. As the attacker your role will be to run as fast as 

you can in order to beat a defender and make a pass toward another player. The 

experiments will take place during your teams existing training session under the 

supervision of your coach and will vary in terms of how far you will be expected to 

run (which will be between 30 to 40 metres each time). They will occur over five 

118

separate occasions and require you to perform a total four to six sprints, taking 

approximately 10‐15 minutes of your time on each occasion. 


EXPECTED BENEFITS 

It is expected that this project will benefit you by providing you information that can 

lead to better decision making on a task that often occurs during football matches. 

Also, the information you make available through participation will indirectly 

benefit the football community – helping to progress our ability to improve learning 

environments and player performance analysis in the future. 


RISKS 

There are no risks beyond your normal day‐to‐day football skills based training 

requirements associated with your participation in this project. You will be required 

to wear shin protection and studded football boots to minimise leg‐to‐leg contact 

injuries and the incidence of slips or falls respectively. A group warm up routine 

including stretching and games based activities will be completed prior to any 

testing under the supervision of your usual coach team. Also, you will also be 

ensured a warm up period to adjust to the added weight of the sensors. 

Appropriate first aid precautions are in place.  


CONFIDENTIALITY All comments and responses are anonymous and will be treated confidentially.  The names of individual persons are not required in any of the responses.  

CONSENT TO PARTICIPATE We would  like  to  ask  you  to  sign  a written  consent  form  (enclosed)  to  confirm  your  agreement  to participate.  

QUESTIONS / FURTHER INFORMATION ABOUT THE PROJECT Please contact the researcher team members named above  to have any questions answered or  if you require further information about the project.  

CONCERNS / COMPLAINTS REGARDING THE CONDUCT OF THE PROJECT QUT is committed to researcher integrity and the ethical conduct of research projects.  However, if you do have any  concerns or  complaints  about  the ethical  conduct of  the project  you may  contact  the QUT 

119

Research Ethics Unit on +61 7 3138 5123 or email [email protected]. The Research Ethics Unit is not connected with the research project and can  facilitate a resolution to your concern  in an  impartial manner. 

Thank you for helping with this research project.  Please keep this sheet for your information. 

CONSENT FORM FOR QUT RESEARCH PROJECT


120


Pattern‐Forming Dynamics in Performer‐Ball Systems in Team Sports 


Research Team Contacts

Dominic Orth — Masters Student Professor Keith Davids — Supervisor

QUT School of Human Movement Studies QUT School of Human Movement Studies

Phone:  0434 436 736 / 3138 5835 Phone: 3138 8744

Email:  [email protected] Email:  [email protected]  

Doctor Ian Renshaw – Associate Supervisor 

QUT School of Human Movement Studies 

Phone: 3138 5825 

Email:  [email protected] 

STATEMENT OF CONSENT 

By signing below, you are indicating that you: 

have read and understood the information document regarding this project 

have had any questions answered to your satisfaction 

understand that if you have any additional questions you can contact the research team 

understand that you are free to withdraw at any time, without comment or penalty 

understand that you can contact the Research Ethics Unit on +61 7 3138 5123 or email [email protected] if you have concerns about the ethical conduct of the project 

for projects involving minors:  have discussed the project with your child and their requirements if participating 

understand that the project will include audio and/or video recording 

agree to participate in the project 

Name   

121

Signature   

Date    /    /     

 STATEMENT OF CHILD CONSENT 

Your parent or guardian has given their permission for you to be involved in 

this research project. 

This form is to seek your agreement to be involved. 

By signing below, you are indicating that the project has been discussed with you and you agree to participate in the project. 
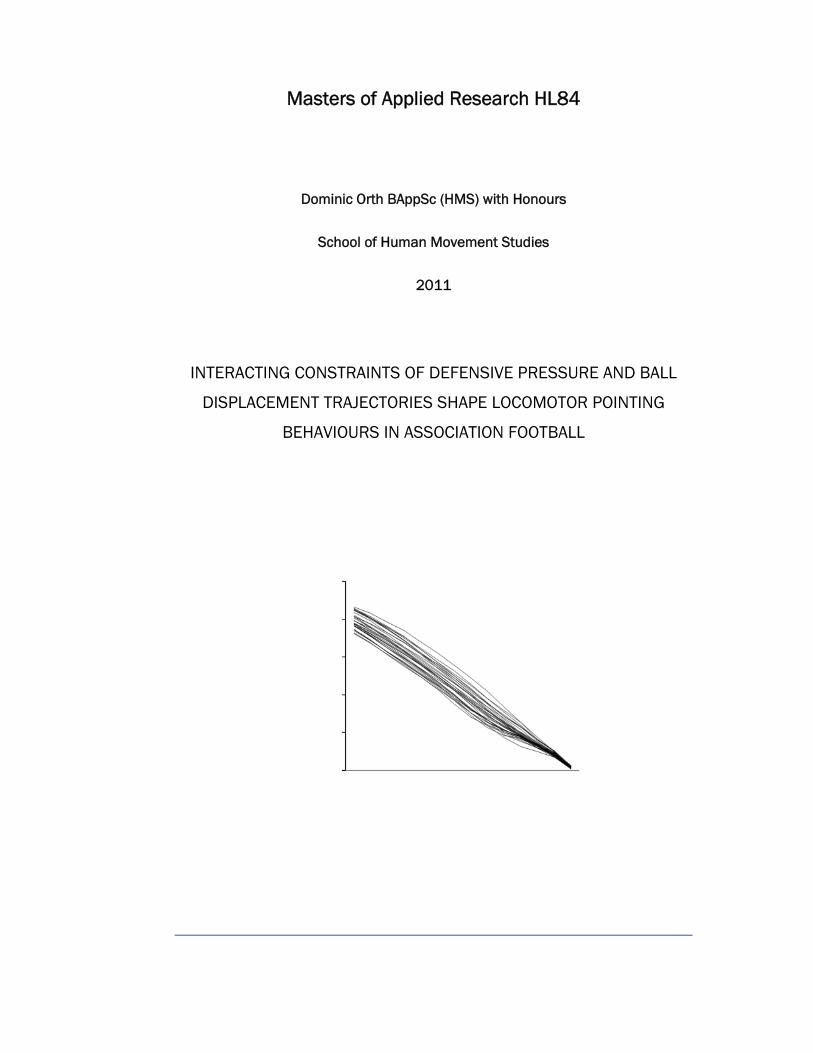
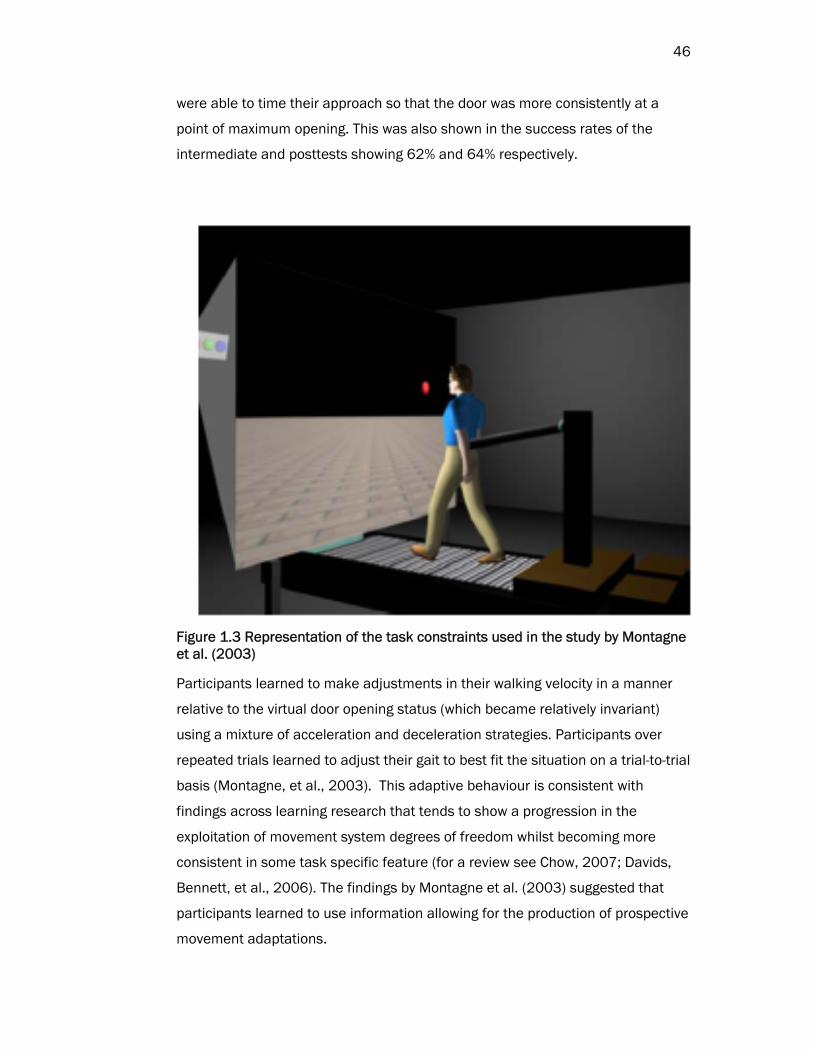
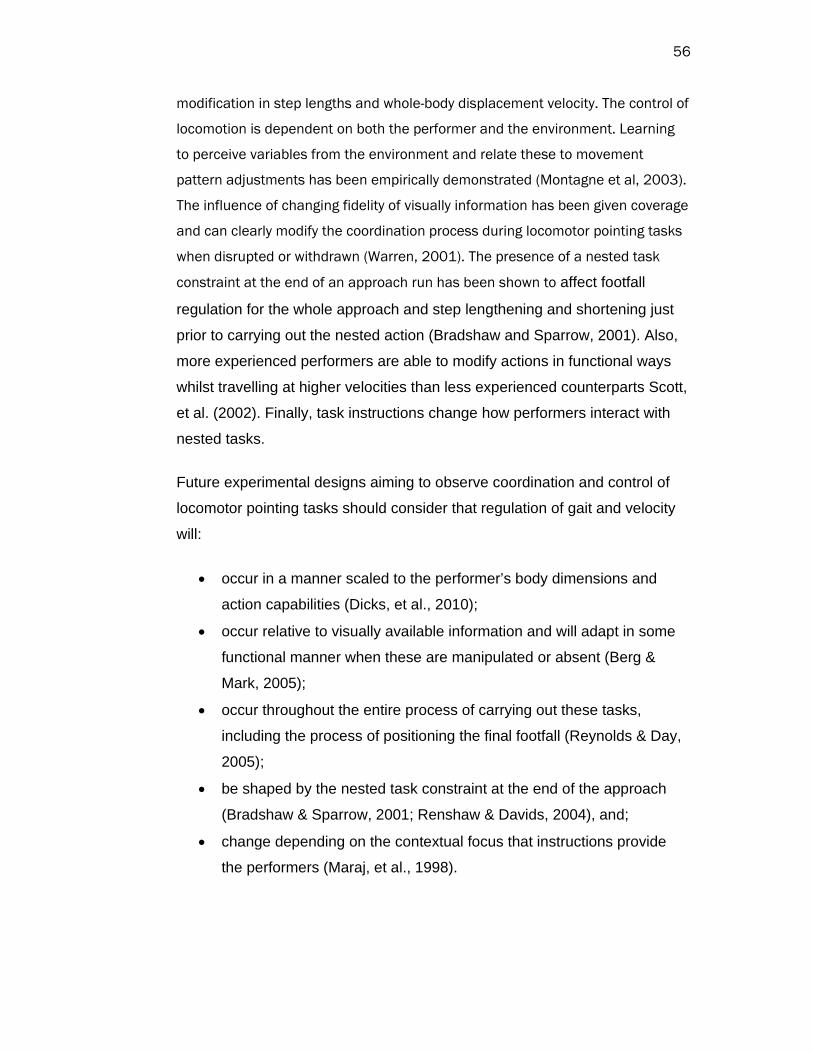
Name   

Signature   

Date    /    /     

Please return this sheet to the investigator. 

122

References Abdel‐Aziz,Y.I.,&Karara,H.M.(1971).Directlineartransformationfromcomparator

coordinatesintoobjectspacecoordinatesinclose‐rangephotogrammetry.PaperpresentedattheProceedingsoftheSymposiumonClose‐RangePhotogrammetry.

Araújo,D.,Davids,K.,&Hristovski,R.(2006).Theecologicaldynamicsofdecisionmakinginsport.PsychologyofSportandExercise,7(6),653‐676.

Araújo,D.,Davids,K.,&Serpa,S.(2005).Anecologicalapproachtoexpertiseeffectsindecision‐makinginasimulatedsailingregatta.PsychologyofSportandExercise,6,671‐692.

Bak,P.,&Paczuski,M.(1995).Complexity,contingency,andcriticality.ProceedingsoftheNationalAcademyofSciencesoftheUnitedStatesofAmerica,92(15),6689‐6696.

Bastin,J.,Craig,C.,&Montagne,G.(2006).Prospectivestrategiesunderliethecontrolofinterceptiveactions.HumanMovementScience,25,718‐732.

Bastin,J.,&Montagne,G.(2005).Theperceptualsupportofgoal‐directeddisplacementiscontext‐dependent.NeuroscienceLetters,376,121‐126.

Berg,W.P.,&Mark,L.S.(2005).Informationforsteplengthadjustmentinrunning.HumanMovementScience,24,496‐531.

Berg,W.P.,Wade,M.G.,&Greer,N.L.(1994).Visualregulationofgaitinbipedallocomotion:RevisitingLee,Lishman,andThomson(1982).JournalofExperientialPsychology:HumanPerceptionandPerformance,20(4),854‐863.

Bootsma,R.J.,&vanWieringen,P.C.W.(1990).Timinganattackingforehanddriveintabletennis.JournalofExerimentalPsychology:HumanPerceptionandPerformance,16(1),21‐29.

Bradshaw,E.J.,&Sparrow,W.A.(2000).Thespeed‐accuracytrade‐offinhumangaitcontrolwhenrunningtowardstargets.JournalofAppliedBiomechanics,16(4),331‐342.

Bradshaw,E.J.,&Sparrow,W.A.(2001).Effectsofapproachvelocityandfoot‐targetcharacteristicsonthevisualregulationofsteplength.HumanMovementScience,20(4‐5),401‐426.

Bristow,K.L.,&Holt,J.A.(1987).Cantermitescreatelocalenergysinkstoregulatemoundtemperature?JournalofThermalBiology,12,19‐21.

Camazine,S.,Deneubourg,J.,Franks,N.R.,Sneyd,J.,Theraulaz,G.,&Bonabeau,E.(2001).Self‐organizationinbiologicalsystems:Princetonstudiesincomplexity.PrincetonNewJersey:PrincetonUniversityPress.

123

Chow,J.Y.(2007).Coordinationanditsacquisitioninalowerlimbmulti‐articular

interceptivetask.UniversityofOtago,Otago,NZ.

Chow,J.Y.,Davids,K.,Button,C.,&Koh,M.(2008).Coordinationchangesinadiscretemulti‐articularactionasafunctionofpractice.ActaPsychologica,127(1),163‐176.

Chow,J.Y.,Davids,K.,Button,C.,Shuttleworth,R.,Renshaw,I.,&Araújo,D.(2006).Nonlinearpedagogy:Aconstraints‐ledframeworkforunderstandingemergenceofgameplayandmovementskills.NonlinearDynamics,Psychology,andLifeSciences,10(1),71‐103.

Chow,J.Y.,Davids,K.,Button,C.,Shuttleworth,R.,Renshaw,I.,&Araújo,D.(2007).Theroleofnonlinearpedagogyinphysicaleducation.ReviewofEducationalResearch,77(3),251‐278.

Chow,J.Y.,Davids,K.,Hristovski,R.,Araújo,D.,&Passos,P.(2011).Nonlinearpedagogy:Learningdesignforself‐organizingneurobiologicalsystems.NewIdeasinPsychology,29(2),189‐200.

Cordovil,R.,Araújo,D.,Davids,K.,Gouveia,L.,Barreiros,J.,Fernandes,O.,etal.(2009).Theinfluenceofinstructionsandbody‐scalingasconstraintsondecisionmakingprocessesinteamsports.EuropeanJournalofSportSciences,9(3),169‐179.

Davids,K.,&Araújo,D.(2010).Theconceptof‘OrganismicAsymmetry’insportscience.JournalofScienceandMedicineinSport,13(6),633‐640.

Davids,K.,Bennett,S.,&Newell,K.M.(Eds.).(2006).MovementSystemVariability.Champaign,IL:HumanKinetics.

Davids,K.,Button,C.,Araújo,D.,Renshaw,I.,&Hristovski,R.(2006).Movementmodelsfromsportsproviderepresentativetaskconstraintsforstudyingadaptivebehaviorinhumanmovementsystems.AdaptiveBehaviour,14(1),73‐95.

Davids,K.,Button,C.,&Bennett,S.(2008).Dynamicsofskillacquisition:Aconstraints‐ledapproach.Champaign,IL:HumanKinetics.

Davids,K.,Glazier,P.,Araújo,D.,&Bartlett,R.(2003).Movementsystemsasdynamicalsystems:Thefunctionalroleofvariabilityanditsimplicationsforsportsmedicine.SportsMedicine,33(4),245‐260.

Davids,K.,Kingsbury,D.,Bennett,S.,&Handford,C.(2001).Information‐movementcoupling:Implicationsfortheorganizationofresearchandpracticeduringacqusitionofself‐pacedextrinsictimingskills.JournalofSportsSciences,19(2),117‐127.

Davids,K.,Lees,A.,&Burwitz,L.(2000).Understandingandmeasuringcoordinationandcontrolinkickingskillsinsoccer:Implicationsfortalentidentificationandskillacquisition.JournalofSportsSciences,18(9),703‐714.

124

Davids,K.,Renshaw,I.,&Glazier,P.(2005).Movementmodelsfromsportsreveal

fundamentalinsightsintocoordinationprocesses.ExerciseandSportSciencesReviews,33(1),36‐42.

Davids,K.,Savelsbergh,G.J.P.,Bennett,S.J.,&vanderKamp,J.(2002).Interceptiveactionsinsport:Theoreticalperspectivesandpracticalapplications.InK.Davids,G.J.P.Savelsberg,S.J.Bennett&J.VanderKamp(Eds.),InterceptiveActionsinSport:InformationandMovement.London:Routledge.

deRugy,A.,Montagne,G.,Buekers,M.J.,&Laurent,M.(2000).Thecontrolofhumanlocomotorpointingunderrestrictedinformationalconditions.NeuroscienceLetters,281,87‐90.

deRugy,A.,Montagne,G.,Buekers,M.J.,&Laurent,M.(2001).Spatiallyconstrainedlocomotionunderinformationalconflict.BehaviouralBrainResearch,123(1),11‐15.

deRugy,A.,Montagne,G.,Taga,G.,Buekers,M.J.,&Luerent,M.(2002).Perception‐actioncouplingmodelforhumanlocomotorpointing.BiologicalCybernetics,87(3),141‐150.

DiSalvo,V.,Baron,R.,Hschan,H.,Montero,F.J.C.,Bachl,N.,&Pigozzi,F.(2007).Performancecharacteristicsaccordingtoplayingpositioninelitesoccer.InternationalJournalofSportsMedicine,28,222‐227.

Dicks,M.,Davids,K.,&Button.(2010).Individualdifferencesinthevisualcontrolofinterceptingapenaltykickinassociationfootball.HumanMovementScience,29(3),401‐411.

Duarte,R.,Araújo,D.,Fernandes,O.,Fonseca,C.,Correia,V.,&Gazimba,V.(2010).Capturingcomplexhumanbehaviorsinrepresentativesportscontextswithasinglecamera.Medicina(Kaunas),46(6),408‐414.

Edelman,G.M.,&Gally,J.A.(2001).Degeneracyandcomplexityinbiologicalsystems.PaperpresentedattheProceedingsoftheNationalAcademyofSciencesoftheUSA.

Fajen,B.R.(2005).Perceivingpossibilitiesforaction:Onthenecessityofcalibrationandperceptuallearningforthevisualguidanceofaction.Perception,34,717‐740.

Fajen,B.R.,&Devaney,M.C.(2006).Learningtocontrolcollisions:Theroleofperceptualattunementandactionboundaries.JournalofExperimentalPsychology:HumanPerceptionandPerformance,32,300‐313.

Fajen,B.R.,Riley,M.A.,&Turvey,M.T.(2009).Information,affordances,andthecontrolofactioninsport.InternationalJournalofSportPsychology,40,79‐107.

Gibson,J.J.(1979).Theecologicalapproachtovisualperception.Boston:HoughtonMifflin.

125

Glazier,P.,&Davids,K.(2009).Constraintsonthecompleteoptimizationofhuman

motion.SportsMedicine,39(1),15‐28.

Glize,D.,&Laurent,M.(1997).Controllinglocomotionduringtheaccelerationphaseinsprintingandlongjumping.JournalofSportsSciences,15,181‐189.

Gréhaigne,J.‐F.,Bouthier,D.,&David,B.(1997).Dynamic‐systemanalysisofopponentrelationshipsincollectiveactionsinsoccer.JournalofSportsSciences,15,137‐149.

Guerin,S.,&Kunkle,D.(2004).Emergenceofconstraintinself‐organizingsystems.NonlinearDynamics,Psychology,andLifeSciences,8(2),131‐146.

Hamill,J.,&Knutzen,K.M.(2003).BiomechanicalBasisofHumanMovement.NewYork:LippincottWilliams&Wilkins.

Hristovski,R.,Davids,K.,&Araújo,D.(2006).Affordance‐controlledbifurcationsofactionpatternsinmartialarts.NonlinearDynamics,Psychology,andLifeSciences10(4),409‐444.

Hristovski,R.,Davids,K.,Araújo,D.,&Button,C.(2006).Howboxersdecidetopunchatarget:Emergentbehaviourinnonlineardynamicalmovementsystems.JournalofSportsScienceandMedicine,CSSI,60‐73.

Hughes,M.,Dawkins,N.,David,R.,&Mills,J.(1998).Theperurbationeffectandgoalopportunitiesinsoccer.JournalofSportsSciences,16,20.

Jacobs,D.M.,&Michaels,C.F.(2007).Directlearning.EcologicalPsychology,19(4),321‐349.

Kauffman,S.A.(1993).Theoriginsoforder:Self‐organizationandselectioninevolution.NewYork:OxfordUniversityPress.

Kellis,E.,&Katis,A.(2007).Biomechanicalcharacteristicsanddeterminantsofinstepsoccerkick.JournalofSportsScienceandMedicine,6(2),154‐165.

Kelso,J.A.S.(1995).Dynamicpatterns:Theself‐organizationofbrainandbehaviour.Cambridge,MA:MITPress.

Kelso,J.A.S.,&Engstrom,D.A.(2006).TheComplimentaryNature.Cambridge,London:MITPress.

Laurent,M.,&Thomson,J.A.(1988).Theroleofvisualinformationincontrolofaconstrainedlocomotortask.JournalofMotorBehavior,20(1),17‐37.

Lee,D.N.,Lishman,J.R.,&Thomson,J.A.(1982).Regulationofgaitinlongjumping.JournalofExperimentalPsychology:HumanPerceptionandPerformance,8(3),448‐459.

Lees,A.,Asai,T.,Andersen,T.B.,Nunome,H.,&Sterzing,T.(2010).Thebiomechanicsofkickinginsoccer:Areview.JournalofSportsSciences,28(8),805‐817.

126

Lees,A.,&Nolan,L.(1998).Thebiomechanicsofsoccer:Areview.JournalofSports

Sciences,16(3),211‐234.

Maraj,B.K.(2002).Controlandco‐ordinationinthetriplejump.InK.Davids,G.Savelsbergh&S.Bennett(Eds.),Interceptiveactionsinsport:Informationandmovement.London:Routledge.

Maraj,B.K.,Allard,F.,&Elliott,D.(1998).Theeffectofnon‐regulatorystimuliontheapproachrunofthetripplejump.ResearchQuarterlyforExerciseandSport,69,404‐412.

Marsh,K.,L.,Richardson,J.R.,Baron,R.M.,&Schmidt,R.C.(2006).Contrastingapproachestoperceivingandactingwithothers.EcologicalPsychology,18(1),1‐38.

McGarry,T.(2005).Soccerasadynamicalsystem:Sometheoreticalconsiderations.PaperpresentedattheScienceandFootballV:Proceedingsofthe5thWorldCongressonScienceandFootball.

McGarry,T.,Anderson,D.,Wallace,S.,Hughes,M.,&Franks,I.(2002).Sportcompetitionasadynamicalself‐organizingsystem.JournalofSportSciences,20(10),771‐781.

Miller,J.H.,&Page,S.E.(2007).Complexadaptivesystems:Anintroductiontocomputationalmodelsofsociallife.Princeton:PrincetonUniversityPress.

Montagne,G.(2005).Prospectivecontrolinsport.InternationalJournalofSportPsychology,36(2),127‐150.

Montagne,G.,Buekers,M.J.,Camachon,C.,deRugy,A.,&Laurent,M.(2003).Thelearningofgoal‐directedlocomotion:Aperception‐actionperspective.TheQuarterlyJournalofExperimentalPsychology,56A(3),551‐567.

Montagne,G.,Cornus,S.,Glize,D.,Quaine,F.,&Laurent,M.(2000).Aperception‐actioncouplingtypecontrolinlongjump.JournalofMotorBehaviour,32(1),37‐42.

Nevill,A.,Atkinson,G.,&Hughes,M.(2008).Twenty‐fiveyearsofsportperformanceresearchintheJournalofSportsSciences.JournalofSportsSciences,26(4),413‐426.

Newell,K.M.(1986).Constraintsofthedevelopmentofcoordination.InM.G.Wade&H.T.A.Whiting(Eds.),MotorDevelopmentinChildren:AspectsofCoordinationandControl.Dordrecht:MartinusNijhoffPublishers.

Newell,K.M.,&Liu,Y.(2001).Timescalesinmotorlearninganddevelopment.PsychologicalReview,108(1),57‐82.

Newell,K.M.,&Ranganathan,R.(2010).Instructionsasconstraintsinmotorskillacquisition.InI.Renshaw,G.J.P.Savelsbergh&K.Davids(Eds.),MotorLearninginPractice.London,NewYork:Routledge.

127

Norman,J.(2002).Twovisualsystemsandtwotheoriesofperception:Anattemptto

reconciletheconstructivistandecologicalapproaches.BehaviouralandBrainSciences,25,73‐144.

Oullier,O.,deGuzman,G.C.,Jantzen,K.J.,Lagarde,J.,&Kelso,J.A.S.(2008).Socialcoordinationdynamics:Measuringhumanbonding.SocialNeuroscience,3(2),178‐192.

Passos,P.,&Araújo,D.(2008).Manipulatingconstraintstotraindecisionmakinginrugbyunion.InternationalJournalofSportsScience&Coaching,3(1),125‐140.

Passos,P.,Araújo,D.,Davids,K.,Gouveia,L.,Milho,J.,&Serpa,S.(2008).Information‐governingdynamicsofattacker–defenderinteractionsinyouthrugbyunion.JournalofSportsSciences,26(13),1421‐1429.

Passos,P.,Araújo,D.,Davids,K.,Milho,J.,&Gouveia,L.(2009).Powerlawdistributioninpatterndynamicsofattacker‐defenderdyadsintheteamsportofrugbyunion:Phenomenainaregionofself‐organizedcriticality?E:CO,11(2),37‐45.

Passos,P.,Araújo,D.,Davids,K.,Serpa,S.,Milho,J.,&Fonseca,S.(2009).Interpersonalpatterndynamicsandadaptivebehaviourinmultiagentneurobiologicalsystems:Conceptualmodelanddata.JournalofMotorBehaviour,41(5),445‐459.

Phillips,E.,Davids,K.,Renshaw,I.,&Portus,M.(2010).Expertperformanceinsportandthedynamicsoftalentdevelopment.SportsMedicine,40(4),271‐283.

Pinder,R.A.,Renshaw,I.,&Davids,K.(2009).Information–movementcouplingindevelopingcricketersunderchangingecologicalpracticeconstraints.HumanMovementScience,28(4),468‐479.

Ramenzoni,V.,Riley,M.A.,Davis,T.,Shockley,K.,&Armstrong,R.(2008).Tuningtoanotherperson'sactioncapabilities:Perceivingmaximaljumping‐reachheightfromkinematics.JournalofExperimentalPsychology:HumanPerceptionandPerformance,34(4),919‐928.

Reilly,T.,&Ball,D.(1984).Thenetphysiologicalcostofdribblingasoccerball.ResearchQuarterlyforExerciseandSport,55,267‐271.

Reilly,T.,&Williams,A.M.(Eds.).(2003).ScienceandSoccer.LondonNewYork:Routledge.

Renshaw,I.(2010).BuildingtheFoundations:SkillAcquisitioninChildren.InI.Renshaw,G.J.P.Savelsbergh&K.Davids(Eds.),MotorLearninginPractice.London,NewYork:Routledge.

Renshaw,I.,&Davids,K.(2004).Nestedtaskconstraintsshapecontinuousperception–actioncouplingcontrolduringhumanlocomotorpointing.NeuroscienceLetters,369,93‐98.

128

Renshaw,I.,&Davids,K.(2006).Acomparisonoflocomotorpointingstrategiesin

cricketbowlingandlongjumping.InternationalJournalofSportPsychology,37(1),1‐20.

Reynolds,R.F.,&Day,B.L.(2005).Visualguidanceofthehumanfootduringastep.JournalofPhysiology,569(2),677‐684.

Rouland,C.,Lenoir,F.,&Lepage,M.(1991).Theroleofthesymbioticfungusinthedigestivemetabolismofseveralspeciesoffungus‐growingtermites.ComparativeBiochemistryandPhysiology(A),99,657‐663.

Schöner,G.,&Kelso,J.A.S.(1988).Dynamicpatterngenerationinbehavioralandneauralsystems.Science,239(1513‐1520).

Scott,M.A.(2002).Visualregulationofthelongjumpapproachphase.InK.Davids,G.J.P.Savelsberg&S.Bennett(Eds.),InterceptiveActionsinSport:InformationandMovement.London:Routledge.

Scott,M.A.,Li,F.‐X.,&Davids,K.(1997).Expertiseandtheregulationofgaitintheapproachphaseofthelongjump.JournalofSportsSciences,15,597‐605.

Shutz,R.W.,&Gessaroli,M.E.(1987).Theanalysisofrepeatedmeasuresdesignsinvolvingmultipledependentvariables.ResearchQuarterlyforExerciseandSport,58(2),132‐149.

Sumpter,D.J.T.(2006).Theprinciplesofcollectiveanimalbehaviour.PhilisophicalTransactions:BiologicalSciences,361(1465),5‐22.

Thomas,J.R.,Nelson,J.K.,&Silverman,S.J.(2005).ResearchMethodsinPhysicalActivity(5ed.).Champaign,IL:HumanKinetics.

Turvey,M.T.(1992).Affordancesandprospectivecontrol:Anoutlineoftheontology.EcologicalPsychology,4(3),173‐187.

Verlard,M.G.,&Normand,C.(1980).Convection.ScientificAmerican,243(1),92‐108.

Warren,W.H.(1984).Perceivingaffordances:Visualguidanceofstairclimbing.JournalofExerimentalPsychology:HumanPerceptionandPerformance,10(5),683‐703.

Warren,W.H.(1998).Visuallycontrolledlocomotion:40yearslater.EcologicalPsychology,10(3‐4),177‐219.

Warren,W.H.(2006).Thedynamicsofperceptionandaction.PsychologicalReview,113(2),358‐389.

Warren,W.H.,Kay,B.A.,Zosh,W.D.,Duchon,A.P.,&Sahuc,S.(2001).Opticflowisusedtocontrolhumanwalking.NatureNeuroscience,4,213‐216.

Warren,W.H.,Young,D.S.,&Lee,D.N.(1986).Visualcontrolofsteplengthduringrunningoverirregularterrain.JournalofExperimentalPsychology:HumanIViu.ptiouandPerformance,12(3),259‐286.

129

Williams,A.M.,Davids,K.,&Williams,J.G.(1999).DirectperceptionandactionVisual

perceptionandactioninsport(pp.189‐248).London:E&FNSPON.

Zago,M.,McIntyre,J.,Senot,P.,&Lacquaniti,F.(2009).Visuo‐motorcoordinationandinternalmodelsforobjectinterception.ExperimentalBrainResearch,192,571‐604.


Recommended