Compact and sensitive spectrometers are essentialfor biological and environmental sensing applica-tions. In a conventional spectrometer the wavelengthchannels are separated by using gratings, cavities,and interferometers. A scanning system, a large ar-ray CCD detector, and a complicated digital proces-sing system are needed to achieve high spectralresolution and to cover the desired spectral range.Various types of spectroscopy, such as absorption,emission, scattering, and Raman spectroscopies,can be used to detect and identify the analyte sincethe unique spectrum of each analyte can be regardedas its molecular fingerprint. A typical spectrum, e.g.,an emission or a Raman spectrum, usually consists ofa set of characteristic spectral lines radiated or scat-tered by the atoms or molecules. The identificationprocess includes the acquisition of the entire spec-
trum, the extraction of the spectral peaks, and thecomparison of the spectral peaks of the analyte withthose of a known substance database. In somepractical applications, a mobile, fast, and repeatablemeasurement is in great need. Multiple line filterscan be fabricated based on volume holographic grat-ings [1–5]. By designing a filter with a set of spectrallines that are the same as those of a known sub-stance, the filter can integrate spectral signals atall the peak wavelengths and suppress the noiseat other wavelengths. The filter set can also simplifythe detection system and the identification process.There needs to be only a photodiode to detect the fil-tered optical intensity and a microprocessor to iden-tify the analyte from the correlation intensities.
These filters require certain variation of index ofrefraction in amedium.Holography is one of themostpractical methods to generate any desired indexvariation in a medium. Volume holographic Bragggratings are widely adopted in spectroscopy due totheir advantageous properties of high diffraction ef-ficiency, high angular and wavelength selectivity,
and capabilities of imaging and multiplexing [6–14].Furthermore, if the volume holograms have beenmodified to have the spectral curve match that ofthe analyte, the output can be the correlation be-tween the two spectral curves, known as the autocor-relation intensity. For certain types of spectra such asabsorption and Raman spectra, separated peaks inthe curve can make the autocorrelation intensitymuch stronger than that of the cross correlation. Inthis paper, we demonstrate a matched spectral filterbased onmultiple volumeholographic Bragg gratingsin a photorefractive crystal of Fe : LiNbO3. Thematched spectral filter is recorded to have itsreflection spectrum match the Raman spectrum ofRhodamine 6G (R6G).
2. Design and Analysis of the Matched Spectral Filter
Consider a medium consisting of a set of N holo-graphic gratings. The total index of refraction canbe written as
nðzÞ ¼ n0 þXNp¼1
npðzÞ cos�2πΛp
ð1þ εpz=LÞzþ φp
�; ð1Þ
where
npðzÞ ¼ nð0Þp þ nð1Þ
pzLþ nð2Þ
pz2
L2 ð2Þ
is the amplitude of the pth grating that is taperedduring manufacturing, L is the thickness of themedium, Λp is the grating period of the pth grating,εp is the chirp factor, and φp is the phase. A planewave incident upon the medium along the z directionwill be reflected. The total electric field inside themedium is
E ¼ AðzÞeiðωt−kzÞ þ BðzÞeiðωtþkzÞ; ð3Þwhere AðzÞ and BðzÞ represent the amplitudes ofthe forward and backward propagating plane waves,respectively. Under the approximation of slow vary-ing envelopes, the coupled-mode equations can bewritten as
dAdz
¼ iXp
πnpðzÞλ ei½ð2k−KpÞz−φp�B; ð4Þ
dBdz
¼ −iXp
πnpðzÞλ ei½ðKp−2kÞzþφp�A; ð5Þ
where Kp ¼ ð2π=λÞ½1þ εpz=L� is the grating wavevector of the pth chirped grating.Equations (4) and (5) can be solved numerically. By
calculating the reflectivity for plane waves with var-ious wavelengths, we can obtain the reflection spec-trum [15]. Figure 1 shows the reflection spectrum ofa designed filter with its reflection spectrum match-ing the surface enhanced Raman scattering (SERS)
spectrum of R6G. The upper curve shows the SERSsignal obtained experimentally with the excitationwavelength of 514nm [16]. The lower curve showsthe reflection spectrum of the designed filter.
The shape of the reflection spectrum of a set ofchirped and tapered gratings depends on their grat-ing wavelengths, grating amplitudes, chirping rates,tapering coefficients, thickness of the medium, andrelative phases. These parameters can be adjustedto design a filter with the desired reflection spec-trum. By increasing the grating amplitude, we canincrease the peak reflectivity and the bandwidth ofthe reflection spectrum. However, since the dynamicrange of the gratings is usually limited, sometimesthe required reflectivity cannot be reached by in-creasing the amplitude of the gratings. Anotherway to increase the reflectivity is to increase thethickness of the medium. A thicker medium can leadto a higher reflectivity with relatively small gratingamplitude. In addition, a thicker medium will alsoresult in a smaller bandwidth. However, as we in-crease the thickness, we will have more sidelobes.These sidelobes can be suppressed by tapering andchirping the grating. On the other hand, taperingor chirping the grating will also increase the band-width of the spectrum. Sometimes, a large chirpingrate will produce two peaks in the reflection spec-trum. When we use more than one grating, the rela-tive phases of the gratings will also affect thespectrum in the region where they overlap. In orderto fit a required reflection spectrum, we need to con-sider the effect due to all these parameters. A sys-tematic approach for the design and fabrication ofmatched spectral filters is needed.
3. Holographic Recording
According to the angular andwavelength dependenceof the Bragg condition [17], a grating with the gratingperiod of Λ recorded at one wavelength (λ1) and oneBragg angle (θ1, see Fig. 2) can be read out by a differ-ent wavelength (λ2) at the corresponding Bragg angle
Fig. 1. (Color online) Comparison between the SERS spectrum ofR6G (upper) and the reflection spectrum of a filter (lower) designedusing multiple chirped and tapered gratings.
(θ2). The Bragg matching condition in this case is
1Λ ¼ 2n1
λ1
�1 −
�sin θ1n1
�2�1
2 ¼ 2n2
λ2
�1 −
�sin θ2n2
�2�1
2
;
ð6Þ
where n1 and n2 are the ordinary refractive indices atthe wavelength λ1 and λ2, respectively. In the abovecalculation, we have made the assumption that onlyordinary waves are used in the recording and recon-struction processes. By properly choosing the anglebetween the recording beams (2θ1) we can design a re-flection grating for a normally incident (θ2 ¼ 0) planewave with wavelength (λ2). Chirping and taperingmethods can be used to control the bandwidth andshape of the reflection spectral peak.An ideal matched spectral filter, which contains
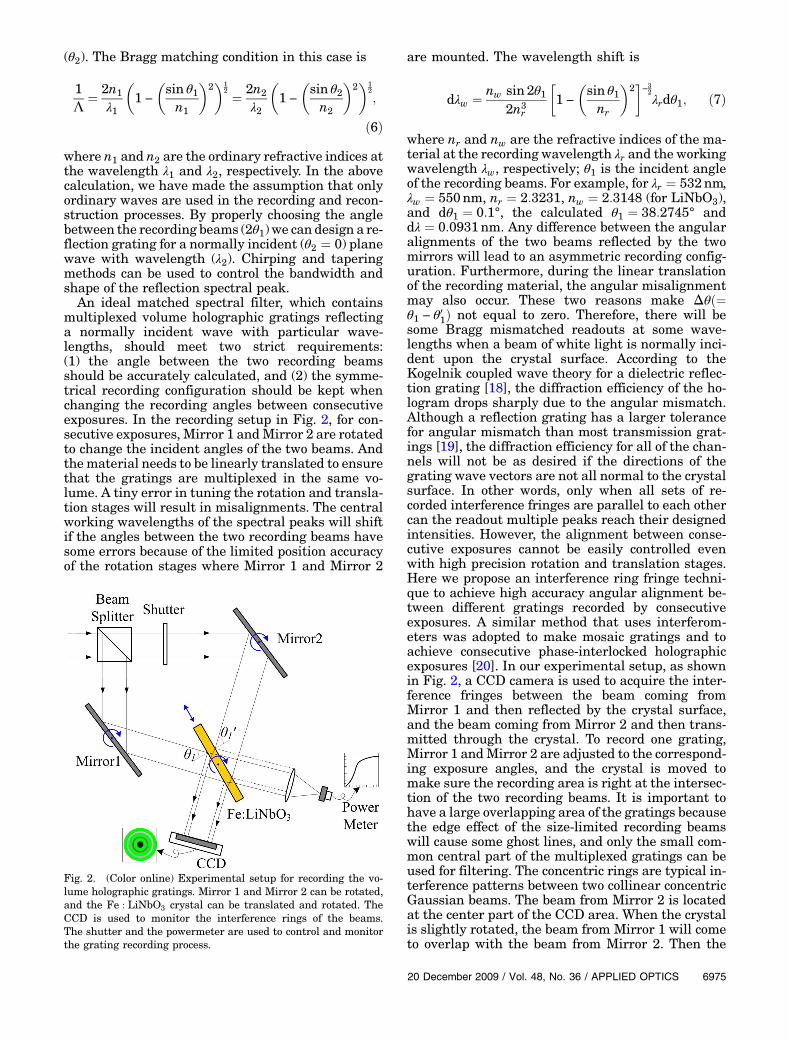
multiplexed volume holographic gratings reflectinga normally incident wave with particular wave-lengths, should meet two strict requirements:(1) the angle between the two recording beamsshould be accurately calculated, and (2) the symme-trical recording configuration should be kept whenchanging the recording angles between consecutiveexposures. In the recording setup in Fig. 2, for con-secutive exposures, Mirror 1 andMirror 2 are rotatedto change the incident angles of the two beams. Andthematerial needs to be linearly translated to ensurethat the gratings are multiplexed in the same vo-lume. A tiny error in tuning the rotation and transla-tion stages will result in misalignments. The centralworking wavelengths of the spectral peaks will shiftif the angles between the two recording beams havesome errors because of the limited position accuracyof the rotation stages where Mirror 1 and Mirror 2
are mounted. The wavelength shift is
dλw ¼ nw sin 2θ12n3
r
�1 −
�sin θ1nr
�2�−32λrdθ1; ð7Þ
where nr and nw are the refractive indices of the ma-terial at the recording wavelength λr and the workingwavelength λw, respectively; θ1 is the incident angleof the recording beams. For example, for λr ¼ 532nm,λw ¼ 550nm, nr ¼ 2:3231, nw ¼ 2:3148 (for LiNbO3),and dθ1 ¼ 0:1°, the calculated θ1 ¼ 38:2745° anddλ ¼ 0:0931nm. Any difference between the angularalignments of the two beams reflected by the twomirrors will lead to an asymmetric recording config-uration. Furthermore, during the linear translationof the recording material, the angular misalignmentmay also occur. These two reasons make Δθð¼θ1 − θ01Þ not equal to zero. Therefore, there will besome Bragg mismatched readouts at some wave-lengths when a beam of white light is normally inci-dent upon the crystal surface. According to theKogelnik coupled wave theory for a dielectric reflec-tion grating [18], the diffraction efficiency of the ho-logram drops sharply due to the angular mismatch.Although a reflection grating has a larger tolerancefor angular mismatch than most transmission grat-ings [19], the diffraction efficiency for all of the chan-nels will not be as desired if the directions of thegrating wave vectors are not all normal to the crystalsurface. In other words, only when all sets of re-corded interference fringes are parallel to each othercan the readout multiple peaks reach their designedintensities. However, the alignment between conse-cutive exposures cannot be easily controlled evenwith high precision rotation and translation stages.Here we propose an interference ring fringe techni-que to achieve high accuracy angular alignment be-tween different gratings recorded by consecutiveexposures. A similar method that uses interferom-eters was adopted to make mosaic gratings and toachieve consecutive phase-interlocked holographicexposures [20]. In our experimental setup, as shownin Fig. 2, a CCD camera is used to acquire the inter-ference fringes between the beam coming fromMirror 1 and then reflected by the crystal surface,and the beam coming from Mirror 2 and then trans-mitted through the crystal. To record one grating,Mirror 1 andMirror 2 are adjusted to the correspond-ing exposure angles, and the crystal is moved tomake sure the recording area is right at the intersec-tion of the two recording beams. It is important tohave a large overlapping area of the gratings becausethe edge effect of the size-limited recording beamswill cause some ghost lines, and only the small com-mon central part of the multiplexed gratings can beused for filtering. The concentric rings are typical in-terference patterns between two collinear concentricGaussian beams. The beam from Mirror 2 is locatedat the center part of the CCD area. When the crystalis slightly rotated, the beam from Mirror 1 will cometo overlap with the beam from Mirror 2. Then the
Fig. 2. (Color online) Experimental setup for recording the vo-lume holographic gratings. Mirror 1 and Mirror 2 can be rotated,and the Fe : LiNbO3 crystal can be translated and rotated. TheCCD is used to monitor the interference rings of the beams.The shutter and the powermeter are used to control and monitorthe grating recording process.
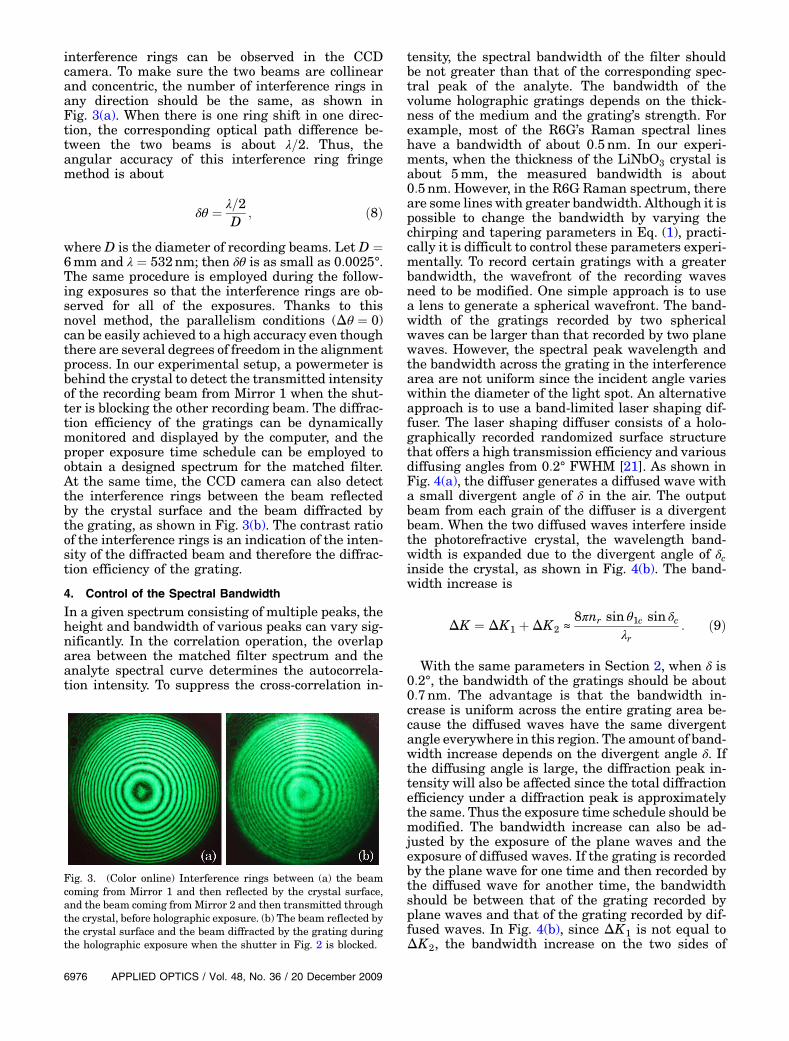
interference rings can be observed in the CCDcamera. To make sure the two beams are collinearand concentric, the number of interference rings inany direction should be the same, as shown inFig. 3(a). When there is one ring shift in one direc-tion, the corresponding optical path difference be-tween the two beams is about λ=2. Thus, theangular accuracy of this interference ring fringemethod is about
δθ ¼ λ=2D
; ð8Þ
where D is the diameter of recording beams. Let D ¼6mm and λ ¼ 532nm; then δθ is as small as 0:0025°.The same procedure is employed during the follow-ing exposures so that the interference rings are ob-served for all of the exposures. Thanks to thisnovel method, the parallelism conditions (Δθ ¼ 0)can be easily achieved to a high accuracy even thoughthere are several degrees of freedom in the alignmentprocess. In our experimental setup, a powermeter isbehind the crystal to detect the transmitted intensityof the recording beam from Mirror 1 when the shut-ter is blocking the other recording beam. The diffrac-tion efficiency of the gratings can be dynamicallymonitored and displayed by the computer, and theproper exposure time schedule can be employed toobtain a designed spectrum for the matched filter.At the same time, the CCD camera can also detectthe interference rings between the beam reflectedby the crystal surface and the beam diffracted bythe grating, as shown in Fig. 3(b). The contrast ratioof the interference rings is an indication of the inten-sity of the diffracted beam and therefore the diffrac-tion efficiency of the grating.
4. Control of the Spectral Bandwidth
In a given spectrum consisting of multiple peaks, theheight and bandwidth of various peaks can vary sig-nificantly. In the correlation operation, the overlaparea between the matched filter spectrum and theanalyte spectral curve determines the autocorrela-tion intensity. To suppress the cross-correlation in-
tensity, the spectral bandwidth of the filter shouldbe not greater than that of the corresponding spec-tral peak of the analyte. The bandwidth of thevolume holographic gratings depends on the thick-ness of the medium and the grating’s strength. Forexample, most of the R6G’s Raman spectral lineshave a bandwidth of about 0:5nm. In our experi-ments, when the thickness of the LiNbO3 crystal isabout 5mm, the measured bandwidth is about0:5nm. However, in the R6G Raman spectrum, thereare some lines with greater bandwidth. Although it ispossible to change the bandwidth by varying thechirping and tapering parameters in Eq. (1), practi-cally it is difficult to control these parameters experi-mentally. To record certain gratings with a greaterbandwidth, the wavefront of the recording wavesneed to be modified. One simple approach is to usea lens to generate a spherical wavefront. The band-width of the gratings recorded by two sphericalwaves can be larger than that recorded by two planewaves. However, the spectral peak wavelength andthe bandwidth across the grating in the interferencearea are not uniform since the incident angle varieswithin the diameter of the light spot. An alternativeapproach is to use a band-limited laser shaping dif-fuser. The laser shaping diffuser consists of a holo-graphically recorded randomized surface structurethat offers a high transmission efficiency and variousdiffusing angles from 0:2° FWHM [21]. As shown inFig. 4(a), the diffuser generates a diffused wave witha small divergent angle of δ in the air. The outputbeam from each grain of the diffuser is a divergentbeam. When the two diffused waves interfere insidethe photorefractive crystal, the wavelength band-width is expanded due to the divergent angle of δcinside the crystal, as shown in Fig. 4(b). The band-width increase is
ΔK ¼ ΔK1 þΔK2 ≈
8πnr sin θ1c sin δcλr
: ð9Þ
With the same parameters in Section 2, when δ is0:2°, the bandwidth of the gratings should be about0:7nm. The advantage is that the bandwidth in-crease is uniform across the entire grating area be-cause the diffused waves have the same divergentangle everywhere in this region. The amount of band-width increase depends on the divergent angle δ. Ifthe diffusing angle is large, the diffraction peak in-tensity will also be affected since the total diffractionefficiency under a diffraction peak is approximatelythe same. Thus the exposure time schedule should bemodified. The bandwidth increase can also be ad-justed by the exposure of the plane waves and theexposure of diffused waves. If the grating is recordedby the plane wave for one time and then recorded bythe diffused wave for another time, the bandwidthshould be between that of the grating recorded byplane waves and that of the grating recorded by dif-fused waves. In Fig. 4(b), since ΔK1 is not equal toΔK2, the bandwidth increase on the two sides of
Fig. 3. (Color online) Interference rings between (a) the beamcoming from Mirror 1 and then reflected by the crystal surface,and the beam coming fromMirror 2 and then transmitted throughthe crystal, before holographic exposure. (b) The beam reflected bythe crystal surface and the beam diffracted by the grating duringthe holographic exposure when the shutter in Fig. 2 is blocked.
the spectral peak may not be equal. Figure 5 showsthe experimental results of the gratings recorded byplane-wave recording beams and by diffused-waverecording beams, respectively. It is shown that thebandwidth can be increased by the use of theband-limited diffuser.
5. Characterization of the Matched Spectral Filter
The matched spectral filter in our experimental de-monstration consists of seven spectral peaks corre-sponding to the peaks in the R6G SERS spectrum.The wavelengths, corresponding refractive indices,grating strengths, and calculated incident angles ofthe recording beams are shown in Table 1. Thelithium niobate crystal used in the experimentswas doped with approximately 0:03wt:% of iron inthe melt. The sample is disk-shaped with a diameterof 45mm and a thickness of 5mm. The optical axis isnormal to the surface of the crystal. As shown inFig. 2, the holograms are recorded by multiple expo-sures of the crystal from two sides and reconstructedas reflection gratings by white light illumination.During the recording procedure, the vertically polar-ized beam from a Verdi solid state laser (λr ¼ 532nm,
2W power) is collimated, expanded, and split. Thediameter of each beam is 6mm, and the intensityis about 3mW=cm2. A laser shaping diffuser is usedto generate the diffused wave to increase the band-width of the spectral peak at 550:8nm. The mea-sured maximum diffraction efficiencies of thegratings at 557:1nm are about 35%.
To characterize the matched spectral filter, a whitecollimated light source is normally incident upon thecrystal surface to illuminate the gratings. The ex-perimental setup for the characterization is shownin Fig. 6, which makes use of the microscope systemand the spectrometer system of a Raman spectro-meter (RENISHAW RE02). The white light fromthe microscope lamp is collimated and incident nor-mally into the crystal disk, which is placed on an XYZstage. The objective lens of the microscope built inthe Raman spectrometer is removed, and a polarizeris inserted in the optical path. The reflected signal isdirected into the input slit of the spectrometer. Thewidth of the input Slit 2 is adjusted to 20 μm. Thegrating inside the spectrometer scans the wave-length automatically, and the spectrum is acquiredby the computer. Since the sample used in our experi-ments is not antireflection coated, the surface reflec-tion signal intensity is as strong as the reflectionsignal intensity from the gratings due to the high re-fractive index of the crystal. To separate surface re-flection from the grating diffraction, the surfacereflection signal is measured in the no-grating areafirst and then subtracted from the acquired reflectionsignal from the grating area. The reflection spectrumof the matched spectral filter is shown in Fig. 7. By
Fig. 4. (Color online) Diffusedrecordingwavesareusedtoincreasethebandwidthoftherecordedholographicgratings:(a)generationofdiffusedwaveswithaband-limiteddiffuser; (b)correspondingwave-vector space diagram for the diffused waves.
Fig. 5. (Color online) Spectral response of gratings recorded byplane waves and by diffused waves, respectively.
Table 1. Parameters of the Seven Spectral Peaks in the R6G SERS Spectrum and the Corresponding Recording Angles of the RecordingBeams
using the interference rings method in the recordingprocess, seven gratings are reconstructed simulta-neously, and they all coincide with the peakwavelengths of the R6G SERS spectrum. The band-width of the grating at 557:1nm is about 0:6nm. Thegrating at 550:8nm is weaker than the grating at557:1nm and therefore would have a narrower band-width. However, by using the method of diffusedwaves, the bandwidth of the 550:8nm peak is in-creased to about 0:6nm, which nearly matches thecorresponding peak in the R6G SERS spectrum.The small errors in the wavelength of the peaksare attributed to the impurity of the crystal andthe limited resolution of the stages.
6. Discussion
The matched spectral filter for analyte identificationis based on the correlation of the analyte’s Ramanspectral function and the spectral function of the fil-ter. To enhance the signal to noise ratio (SNR), theoptical intensities from the peaks should be as largeas possible, while the background light should be low.However, the spectrum often comes with some strongbackground noise, which includes other substances’
spectra and the fluorescence spectrum. An effectivepolarization manipulation method was proposed,and it can reduce the background noise [2]. To reducethe noise, only some main peaks of high intensitiesshould be selected as the filtered wavelengths.
The recording geometry in Fig. 2 has a limitedwavelength range due to the high refractive indexof the photorefractive crystal. By using a refractiveindex matched glass prism, the possible wavelengthrange can be extended to a wider wavelength range[6]. Here the interference rings method can still beapplied to help with the angular alignments.
7. Conclusions
In this paper, we have proposed and demonstrated amatched spectral filter consisting of multiple volumeholographic gratings for preliminary analyte identi-fication. To ensure all of the recorded gratings havetheir grating wave vectors in the same direction, aninterference alignment method is proposed. It canachieve a high accuracy of 0:0025° in angular align-ment, and all of the recorded gratings can be recon-structed simultaneously under Bragg matchingconditions. The bandwidth of the gratings can bechanged by using band-limited diffusers. Sevengratings are recorded in an Fe : LiNbO3 crystal,and the reflection spectrum matches the R6G SERSspectrum.
Further investigations should focus on the im-provements of the diffraction efficiency of the multi-plexed gratings and the antireflection coating of thecrystal, which can help to achieve higher energy effi-ciency and increase theSNR.Different spectral filterscan be recorded at different spatial locations on thephotorefractive crystal disk leading to a library ofmo-lecule spectra. Nonvolatile recording technologiesand a proper recording schedule of the multiplexedholographic gratings will be considered for the entirelibrary. Correlation between the output SERS signaland each spectrum in the library can be obtained byrotating the disk and detecting the output sequen-tially. Such an approach can provide a preliminaryidentification of the analyte molecule and is particu-larly useful for nonspectroscopists. In addition, thisapproach also provides compactness to the entire sen-sor system since it does not include a spectrometer.
We acknowledge the support from the NationalScience Foundation (NSF), ECCS-0823921, the UCMICRO grant, and the UCSC Special ResearchGrant. We thank Dr. Bin Chen at NASA AmesResearch Center for technical assistance.
References1. D. Psaltis, “Holographic filters for spectroscopic identification
of substances,” U.S. patent 6,934,060 (23 August 2005).2. J. Lipson, “Measuring spectral lines from an analyte using
multiplexed holograms and polarization manipulation,” U.S.patent 7,277,210 (2 October 2007).
3. I. Nee, O. Beyer, M. Müller, and K. Buse, “Multichannelwavelength-division multiplexing with thermally fixed Bragggratings in photorefractive lithium niobate crystals,” J. Opt.Soc. Am. B 20, 1593–1602 (2003).
Fig. 7. (Color online) Measured reflection spectrum of thematched spectral filter. The R6G SERS spectrum is shown as areference.
Fig. 6. (Color online) Experimental setup for measuring thereflection spectrum of the matched spectral filter.
4. O. Beyer, I. Nee, F. Havermeyer, and K. Buse, “Holographicrecording of Bragg gratings for wavelength divisionmultiplex-ing in doped and partially polymerized poly (methyl meth-acrylate),” Appl. Opt. 42, 30–37 (2003).
5. R. De Vre and L. Hesselink, “Dynamic multiple wavelengthfilter using a stratified volume holographic optical element,”U.S. patent 5,640,256 (17 June 1997).
6. C. Moser, L. Ho, E.Maye, and F. Havermeyer, “Fabrication andapplications of volume holographic optical filters in glass,” J.Phys. D 41, 224003 (2008).
7. K. Buse, F. Havermeyer, W. Liu, C. Moser, and D. Psaltis,“Holographic filters,” in Photorefractive Materials and TheirApplications 3, P. Günter and J.-P. Huignard, eds. (Springer,2007), pp. 295–319.
8. R. Müller, M. T. Santos, L. Arizmendi, and J. M. Cabrera, “Anarrowband interference filter with photorefractive LiNbO3,”J. Phys. D 27, 241–246 (1994).
9. G. Zhang, G. Montemezzani, and P. Günter, “Narrow-bandwidth holographic reflection filters with photopolymerfilms,” Appl. Opt. 40, 2423–2427 (2001).
10. H.-T. Hsieh, Z. Li, and D. Psaltis, “Holographic filters,” Proc.SPIE 5521, 24–28 (2004).
11. Z. Li, D. Psaltis, W. Liu, W. R. Johnson, and G. Bearman,“Volume holographic spectral imaging,” Proc. SPIE 5694,33–40 (2005).
12. R. K. Kostuk, W. Maeda, C.-H. Chen, I. Djordjevic, andB. Vasic, “Cascaded holographic polymer reflection gratings
filters for optical-code-division multiple-access applications,”Appl. Opt. 44, 7581–7586 (2005).
13. S. Riehemann, G. von Bally, B. I. Sturman, and S. G. Odoulov,“Reflection holograms in iron-doped lithium niobate,” Appl.Phys. B 65, 535–539 (1997).
14. G. J. Steckman, W. Liu, R. Platz, D. Schroeder, C. Moser, andF. Havermeyer, “Volume holographic grating wavelengthstabilized laser diodes,” IEEE J. Sel. Top. Quantum Electron.13, 672–678 (2007).
15. P. Ye, Introduction to Photorefractive Nonlinear Optics(Wiley, 1993).
16. C. Shi, C. Lu, C. Gu, L. Tian, R. Newhouse, S. Chen, and J. Z.Zhang, “Compliance properties study of carbon nanofibers(CNFs) array as thermal interface material,” J. Phys. D 41,155105 (2008).
17. L. Cao, X. Ma, Q. He, H. Long, M. Wu, and G. Jin, “Imagingspectral device based on multiple volume holographic grat-ings,” Opt. Eng. 43, 2009–2016 (2004).
18. H. Kogelnik, “Coupled wave theory for thick hologramgratings,” Bell Syst. Tech. J. 48, 2909–2946 (1969).
19. G. A. Rakuljic and V. Leyva, “Volume holographic narrow-band optical filter,” Opt. Lett. 18, 459–461 (1993).
20. L. Zeng and L. Li, “Optical mosaic gratings made byconsecutive, phase-interlocked, holographic exposures usingdiffraction from latent fringes,” Opt. Lett. 32, 1081–1083(2007).