2 Material Analysis Using Characteristic Gamma Rays Induced by Neutrons Alexander P. Barzilov, Ivan S. Novikov and Phillip C. Womble Western Kentucky University USA 1. Introduction Neutron interrogation based methods of non-destructive analysis are well established techniques employed in the field of bulk material analysis. These methods utilize a source of neutrons (a neutron probe) to irradiate objects under scrutiny. Nuclear reactions initiated by neutrons in the volume of the irradiated sample include the following: inelastic neutron scattering, thermal neutron capture, and neutron activation. As a result of nuclear reactions with the material inside the object, the “fingerprint” -rays are emitted with characteristic energies. These characteristic gamma rays are used for the elemental identification. By measuring and counting the number of -rays emitted with a specific energy, one can deduce the amount of the associated chemical element in the sample. The amounts of chemical elements measured allow specifying the chemical composition of the analyzed sample. Neutron technique is an excellent choice to rapidly determine elemental content of the sample in situ in non-intrusive manner. It is a great fit for in situ applications that involve samples that are hard to reach or unsafe to handle, and that require the analysis to be performed rapidly, in real time. Accelerator based neutron sources such as deuterium – deuterium (d-d) and deuterium – tritium (d-t) fusion neutron generators provide the electronic control of neutron emission including its time structure. The pulse mode of neutron production allows the use of coincidence methods to segregate prompt and delayed gamma ray signatures emitted from neutron induced nuclear reactions. The kinematics of fusion reactions allows “tagging” of outgoing neutrons using the associated particles. The pulse neutron systems are used in industry for analysis of coal (Dep et al., 1998; Sowerby, 2009), cement (Womble et al., 2005), metal alloys (James & Fuerst, 2000), in geological and soil analysis (Wielopolski et al., 2008), and oil well logging (Nikitin & Bliven, 2010). Security applications of neutron based systems are for chemical and explosive threats detection (Vourvopoulos & Womble, 2001; Aleksandrov et al., 2005; Lanza, 2006), including the search for threats in cargo containers (Barzilov & Womble, 2003) and vehicles (Reber et al., 2005; Koltick et al., 2007), humanitarian demining and confirmation of unexploded ordinance (Womble et al., 2002; Holslin et al., 2006). Such technologies are considered in astrochemistry applications for in situ analysis of planetary samples (Parsons et al., 2011). www.intechopen.com
Transcript
2
Material Analysis Using Characteristic Gamma Rays Induced by Neutrons
Alexander P. Barzilov, Ivan S. Novikov and Phillip C. Womble Western Kentucky University
USA
1. Introduction
Neutron interrogation based methods of non-destructive analysis are well established
techniques employed in the field of bulk material analysis. These methods utilize a source of
neutrons (a neutron probe) to irradiate objects under scrutiny. Nuclear reactions initiated by
neutrons in the volume of the irradiated sample include the following: inelastic neutron
scattering, thermal neutron capture, and neutron activation. As a result of nuclear reactions
with the material inside the object, the “fingerprint” -rays are emitted with characteristic
energies. These characteristic gamma rays are used for the elemental identification. By
measuring and counting the number of -rays emitted with a specific energy, one can
deduce the amount of the associated chemical element in the sample. The amounts of
chemical elements measured allow specifying the chemical composition of the analyzed
sample.
Neutron technique is an excellent choice to rapidly determine elemental content of the sample in situ in non-intrusive manner. It is a great fit for in situ applications that involve samples that are hard to reach or unsafe to handle, and that require the analysis to be performed rapidly, in real time.
Accelerator based neutron sources such as deuterium – deuterium (d-d) and deuterium – tritium (d-t) fusion neutron generators provide the electronic control of neutron emission including its time structure. The pulse mode of neutron production allows the use of coincidence methods to segregate prompt and delayed gamma ray signatures emitted from neutron induced nuclear reactions. The kinematics of fusion reactions allows “tagging” of outgoing neutrons using the associated particles.
The pulse neutron systems are used in industry for analysis of coal (Dep et al., 1998; Sowerby, 2009), cement (Womble et al., 2005), metal alloys (James & Fuerst, 2000), in geological and soil analysis (Wielopolski et al., 2008), and oil well logging (Nikitin & Bliven, 2010). Security applications of neutron based systems are for chemical and explosive threats detection (Vourvopoulos & Womble, 2001; Aleksandrov et al., 2005; Lanza, 2006), including the search for threats in cargo containers (Barzilov & Womble, 2003) and vehicles (Reber et al., 2005; Koltick et al., 2007), humanitarian demining and confirmation of unexploded ordinance (Womble et al., 2002; Holslin et al., 2006). Such technologies are considered in astrochemistry applications for in situ analysis of planetary samples (Parsons et al., 2011).
www.intechopen.com
Gamma Radiation
18
The use of the pulse neutron based analysis of nitrogen and oxygen content in vivo is discussed in nutrition research (Shypailo & Ellis, 2005) and in cancer diagnostics (Maglich & Nalcioglu, 2010).
In the presented chapter we discuss the components of pulse neutron based material analysis systems, nuclear reactions induced by neutrons, characteristic gamma radiation emitted in these nuclear reactions, gamma ray spectral analysis methods for elemental characterization, and “neutrons in – photons out” methods that utilize the characteristic gamma radiation.
2. Pulse neutron sources and system components
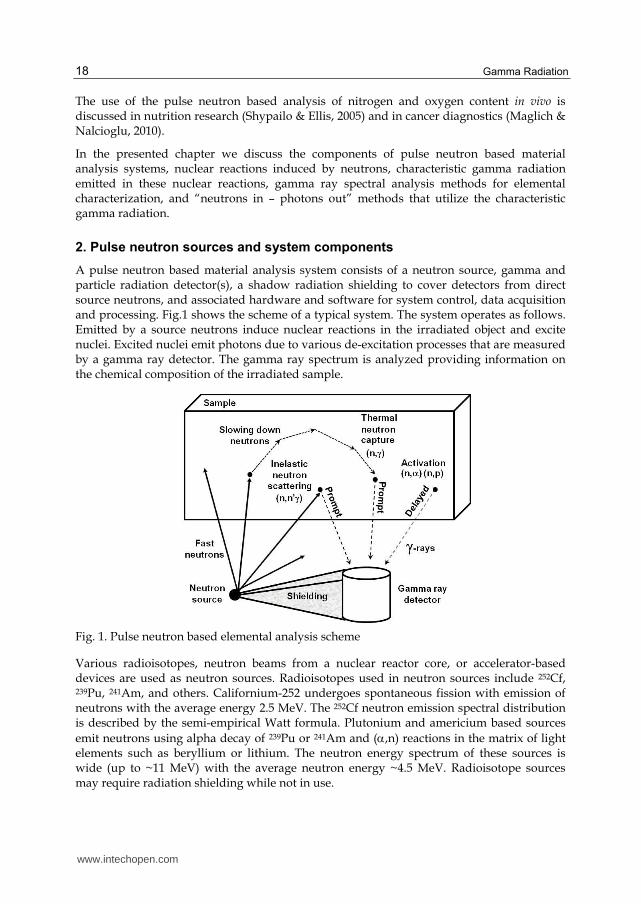
A pulse neutron based material analysis system consists of a neutron source, gamma and particle radiation detector(s), a shadow radiation shielding to cover detectors from direct source neutrons, and associated hardware and software for system control, data acquisition and processing. Fig.1 shows the scheme of a typical system. The system operates as follows. Emitted by a source neutrons induce nuclear reactions in the irradiated object and excite nuclei. Excited nuclei emit photons due to various de-excitation processes that are measured by a gamma ray detector. The gamma ray spectrum is analyzed providing information on the chemical composition of the irradiated sample.
Fig. 1. Pulse neutron based elemental analysis scheme
Various radioisotopes, neutron beams from a nuclear reactor core, or accelerator-based devices are used as neutron sources. Radioisotopes used in neutron sources include 252Cf, 239Pu, 241Am, and others. Californium-252 undergoes spontaneous fission with emission of neutrons with the average energy 2.5 MeV. The 252Cf neutron emission spectral distribution is described by the semi-empirical Watt formula. Plutonium and americium based sources
emit neutrons using alpha decay of 239Pu or 241Am and (,n) reactions in the matrix of light elements such as beryllium or lithium. The neutron energy spectrum of these sources is wide (up to ~11 MeV) with the average neutron energy ~4.5 MeV. Radioisotope sources may require radiation shielding while not in use.
www.intechopen.com
Material Analysis Using Characteristic Gamma Rays Induced by Neutrons
19
Pulse structure of neutron emission from isotopic source or reactor is usually controlled with a chopper system. Some reactors provide the pulse periodic operation mode. The neutron beam’s energy follows 235U fission spectrum distribution, or depends on the moderator type used inside the core or in neutron beam optics. Nuclear reactors are bulky, expensive, and require significant radiation shielding. That makes them impossible for use as a neutron source for portable material analysis systems.
Accelerator-based neutron sources are widely used in material analysis. These sources utilize charged particle beams to create fast neutrons in nuclear reactions induced in various targets. Some examples of such neutron producing reactions are the following: T(d,n)4H, D(d,n)3He, 9Be(d,n)10Be, 7Li(d,n)8Be, 7Li(p,n)7Be, 7Be(p,n)7B. The pulse neutron emission scheme allowing high repetition rates is provided by controlling acceleration parameters electronically. Such sources can be turned off thus simplifying radiation shielding requirements. The neutron sources based on fusion reactions are compact systems due to a large reaction resonance at low deuteron energy (approximately 3.4 barn for 100 keV for d-t fusion). The d-t fusion neutron generators are widely used as sources of neutrons for portable probe and industrial applications. These isotropic neutron sources are rugged, low maintenance, and relatively inexpensive systems.
2.1 Accelerator based fusion neutron generators
Neutron generators utilize d-t and d-d fusion reactions that produce mono energetic neutrons. The d-t reaction shows greater energy release. At the incident particle’s small energies, 4He and neutron share 17.59 MeV with conservation of linear momentum, and mono energetic 14.1 MeV neutrons are emitted out of reaction
With 50% probability, 3T and proton may be also produced in d-d reaction (Q=4.03 MeV, Ep=3.02 MeV, ET=1.01 MeV).
Neutrons produced in the d-t reaction are emitted isotropically. Neutron emission in d-d reaction is slightly peaked forward along the direction of ion beam. The yield of d-d reaction at low energies of deuterons (reaction cross section is 3.3×10⁻² barn at 100 keV) is approximately two orders of magnitude lower than in d-t fusion. Therefore, higher deuteron current is required to achieve d-d neutron yields comparable to a d-t source. Because of that d-t neutron generators are more common in applications requiring small size neutron sources of higher energy neutrons. The d-d systems may be preferable in applications where only the lower energy neutrons are required and where 14.1-MeV neutrons may cause unnecessary interference in the analysis due to many reactions channels open for high energy neutrons.
Another reaction which can be used for neutron production is the t-t fusion
3H + 3H 4He + n + n (Q=11.3 MeV) (3)
www.intechopen.com
Gamma Radiation
20
The reaction cross section is 3.4×10⁻² barn at 100 keV, which is similar to the cross section of the d-d reaction. The distribution of energy between reaction products varies producing the wide neutron spectrum with maximum energy up to ~11 MeV. Wide neutron spectrum may be useful for material analysis applications that require both low and high energy neutrons.
The compact “sealed tube” neutron generator design includes an ion source, a positive ion
accelerator, and a target. Commonly used source to generate positive ions is the cold
cathode Penning source. This source has a cylindrical anode under ~1-2 kV potential
applied to it, and grounded cathodes on the ends of the anode. The magnet surrounds the
anode cylinder setting up the coaxial magnetic field inside it. The tritium or deuterium gas
is introduced into the volume of the anode cylinder. The electric field between anode and
cathodes causes ionization of gas molecules creating the cold plasma. Trapped inside the
anode electrons are moving in the volume and ionizing gas molecules which helps to
maintain the plasma quality. Ions are transferred into the acceleration region through the
exit port of the cathode. This region supplies the electric field (up to ~100-120 kV) to
accelerate the positive ions. Neutron generator target is a metal hydride loaded with
deuterium or tritium or the mixture of both. The ions interact with a target, producing
neutrons in fusion reactions. Typical neutron output levels of sealed tube neutron
generators are ~108-109 n/s (d-t) and ~106 n/s (d-d). Higher output usually shortens the
sealed tube’s life time. Sealed tube neutron generators are produced by Thermo Fisher
Scientific, Schlumberger, Baker Hughes, EADS SODERN in France, and VNIIA in Russia.
Other designs of neutron generators utilize ion sources such as hot cathode source, radiofrequency ion source, or inertial electrostatic confinement (IEC) based source. For example, the pulse d-d system produced by Adelphi Technology Inc. (Williams et al., 2008) using the microwave driven plasma source technique provides the 2.45-MeV neutron output up to 8×10⁹ n/s. The similar technique using tritium provides the yield of 14.1-MeV neutrons ~1011 n/s. The d-t neutron generator developed by NSD-Fusion GmbH for irradiation of extended samples uses the IEC technique producing ~1010 n/s. These neutron generator designs have the longer life time compared to sealed tube sources.
2.2 Gamma ray detectors
Physical parameters and limitations of the gamma ray detectors used in the system govern
parameters of the entire system. The choice of gamma ray detectors is important for neutron
based system to be effective. Improper solution can generate both false positive and false
negative results.
The gamma ray detectors must be suitable for operation in mixed radiation fields where neutrons and gamma rays present. The detector material must have a high Z value to effectively detect characteristic photons with energies up to 10.8 MeV. The detection medium must also provide the energy resolution that allows resolving peaks of interest. Ideally, the detector should provide minimum interference with the signal emitted from a sample when the detector material is irradiated with neutrons. Thus, if possible the detector material should avoid isotopes that are anticipated in the analyzed samples. The neutron induced gamma ray peaks for elements of the detector material should not interfere with the sample's spectral signatures. In addition, neutrons may produce radioactive activation products with the time delayed decay inside the detector volume. These decays (for
www.intechopen.com
Material Analysis Using Characteristic Gamma Rays Induced by Neutrons
21
example, the beta decay) may produce photons or charged particles that interfere with the characteristic gamma ray spectra adding the noise and overloading the data acquisition electronics. It is a complicated task to satisfy all these requirements, especially with added cost limitations. Usually, the trade-off between various detector parameters including its cost is considered for a particular application (Barzilov & Womble, 2006).
Standard gamma ray detector solutions for spectroscopy are high purity germanium detectors (HPGe) with liquid nitrogen dewar or mechanical cooling subsystems (Sangsingkeow et al., 2003), and scintillation detectors such as NaI(Tl), Bi4Ge3O12, LaBr3(Ce) (van Loef et al., 2001), etc. Noble gas scintillation or ionization detectors and gamma ray telescopes can also be used for neutron induced photon measurements in the MeV energy range (April et al., 2006).
The NaI(Tl) scintillator material has the light yield 38 photons/keV, 1/e decay time 250 ns, and density 3.67 g/cc. Atomic numbers are 53 and 11 for iodine and sodium, respectively. Under neutron irradiation, the NaI(Tl) scintillator is activated by neutrons showing the delayed beta decay spectral continuum with the endpoint energy ~2 MeV.
The BGO scintillator has the light yield 9 photons/keV, and 1/e decay time 300 ns. Due to
the high atomic number of bismuth, 83, and the crystal’s high density of 7.13 g/cc, the BGO
scintillator is very effective for detection of high energy photons. Its energy resolution is
lower than NaI(Tl) resolution: ~10% FWHM versus ~7% FWHM for 662-keV -rays. The
BGO demonstrates excellent behaviour under neutron irradiation without delayed decay
issues. Significant downside of the BGO detector is its sensitivity to the environmental
temperature (Womble et al., 2002).
The LaBr3(Ce) scintillator has the ~3%-resolution of the 662-keV peak, and density 5.08 g/cc. The lanthanum atomic number is 57. This scintillator has high light yield 63 photons/keV, fast 1/e decay time 16 ns, and better timing properties than NaI(Tl). The LaBr3(Ce) material contains small quantities of the radioactive lanthanum-138 isotope (t1/2=1.02×1011 years) producing the 1.47-MeV gamma ray peak that is always visible in the spectrum; it can be used for calibration purposes. The LaBr3(Ce) is affected by neutrons showing the delayed beta decay spectral continuum with endpoint energy ~3 MeV when irradiated with a d-t neutron source. The measured β-decay curve exhibits cumulative nature: two isotopes decay at the same time. The 80Br decays with a half-life 17.68 minutes. The 82Br isotope decays with the half-life approximately 35 hours. Lanthanum halide demonstrates stable gamma ray spectrum parameters in the mixed field under d-t neutron irradiation, when properly shielded. The good energy resolution under the room temperature, the high brightness, and the high scintillation decay speed pose this material as a promising candidate for active neutron interrogation applications, if the crystal’s neutron activation issues are properly addressed.
The HPGe detector has superior energy resolution comparing to scintillation detectors. The atomic number of germanium is 32. The HPGe crystal density is 5.35 g/cc. HPGe crystal is sensitive to the high energy neutrons, which cause detector damage (Tsoulfanidis & Landsberger, 2010). High energy neutrons produce charges in the germanium crystal which are adding noise to the collected gamma ray spectrum (Ljungvall & Nyberg, 2005). Neutron collisions with the crystal cause atom displacements into interstitial positions creating a vacancy pair. These crystal defects behave as trapping
www.intechopen.com
Gamma Radiation
22
centers for holes and electrons, and may create new donor and acceptor states, thus gradually changing the charge collection efficiency, the resolution, and the pulse timing characteristics of the detector. The n-type HPGe detectors are preferable in applications that involve neutron irradiation. They have been shown to be more resistant to damage by fast neutrons (Pehl et al., 1979). The neutron damage problem requires special attention and treatment (Fourches et al., 1991). The speed of the HPGe charge collection is another parameter to be considered in high count rate conditions and applications that require good timing resolution (Cooper & Koltick, 2001).
The comparison of selected gamma ray detectors used in neutron-based material analysis applications is shown in Table 1.
The shielding is required to protect the gamma ray detector from direct hit by the
neutrons. Shielding size defines the geometry of the system since a neutron source and a
gamma ray detector are separated by the shielding column. The combination of materials
with large scattering cross sections for fast neutrons and large low energy neutron capture
cross sections, and high Z materials with high stopping power for gamma rays is used.
The goal is to keep fast neutrons away from the detector volume either by redirecting
their path or moderating them with the subsequent capture. The d-d or d-t targets are in
general of the “point source” type, thus the shielding may have a conical shape to
minimize the weight. For 108-n/s d-t source, the simplest “shadow” shielding is a layered
conical structure of ~50 cm length; the 30-40 cm borated polyethylene layer near the
source, and the 10-20 cm lead layer near the gamma ray detector (Womble et al., 2003).
The more complex shielding designs are possible using layers of other materials, but the
size / weight / cost considerations add design limitations. In addition, the detector may
be also shielded from lower energy neutrons scattered from surrounding materials. The
two-layer shielding can reduce spectral noise due to low energy neutron interactions with
the detector crystal. The outer layer of borated resin is effective as a thermal neutron
shielding; the inner lead layer attenuates photons emitted from thermal neutron capture
reactions in the outer layer. The lead also attenuates low energy photons that are not of
interest in material analysis thus helping to reduce dead time of the gamma ray
spectroscopy system.
Detector Energy resolution, %FWHM @ 662 keV
Efficiency Cooling Neutron activation issues
NaI(Tl) ~7% Fair Medium No Activated, beta-decay
Bi4Ge3O12 ~10% Fair High No, temp. shifts
No
LaBr3(Ce) 2.8% Good Medium No Activated, beta-decay
HPGe 0.4% Excellent Medium LN2 Temp. No
Table 1. Gamma ray detectors used in neutron-based material analysis applications
Data acquisition electronics used with the gamma ray detectors in such systems should be appropriate for the detector’s signal processing and count rates attainable in neutron interrogation. Standard analog and digital spectroscopy solutions are typically used.
www.intechopen.com
Material Analysis Using Characteristic Gamma Rays Induced by Neutrons
23
3. Nuclear reactions induced by neutrons
Neutrons emitted in d-d (En=2.45 MeV) and d-t (En=14.1 MeV) fusion reactions are highly penetrating particles. The typical range is several feet into materials commonly utilized in industry and commerce. Nuclear reactions energetically possible under 14.1-MeV fusion neutron’s action in the volume of the irradiated object are the following: (n,n’), (n,), (n,), (n,p), (n,d), (n,t), (n,2p), (n,n’p), (n,n’), (n,3He), and (n,2n). If the sample contains heavy nuclei, (n,3n) and nuclear fission reactions may be induced with the low probability. Production of charged particles is prevailing for light nuclei; neutron production is favourable for heavier nuclei. The reactions (n,d) and (n,t) have noticeable cross-section for light mass isotopes, but products produced in such reactions are stable. The (n,d) and (n,t) reaction cross sections for medium and heavier mass nuclei are low.
Widely used in material analysis neutron induced nuclear reactions are inelastic neutron
scattering (n,n’), thermal neutron capture (n,), and neutron activation (n,) and (n,p). The only source of fast neutrons is a fusion neutron source. Thermal neutrons are created by slowing down the fast source neutrons in collisions with low Z materials within the sample itself or within the environment around the sample, or by using neutron moderating materials.
Table 4. Thermal neutron capture reaction cross sections at En=0.025 eV (in millibarns)
The representative set of elements (H, C, N, O, F, P, S, Cl, and As) is selected as an example of isotopes found in explosive, chemical threats, coal and other materials. The parameters of the d-t neutron induced nuclear reactions are shown in Table 2. Table 3 shows the d-d
neutron induced nuclear reactions at En=2.45 MeV for the same set of elements. The (n,) thermal neutron capture reaction’s cross-section at En=0.025 eV are shown in Table 4. The
total neutron cross-sections tot for C, N, O, F, P, S, Cl, and As are shown in Fig.2. The neutron data for other isotopes are available from website of the Nuclear Information Service of the Los Alamos National Laboratory at http://t2.lanl.gov/data/data.html.
The (n,2n) reaction is also utilized to produce the excited energy states causing the delayed
beta decay with associated photon emission that may be non-fingerprint in nature, but it
may assist to identify the amount of a parent isotope in the sample. The fast neutron
activation of this type can be used for example to measure amount of nitrogen in a sample
via reaction 14N(n,2n)13N. The produced 13N isotope has t1/2=10.1 minutes emitting
positrons. They annihilate immediately with electrons in the sample matrix emitting 511
keV gamma rays. Although it is not characteristic photon energy, it indicates the presence of
a positron emitter. If measured correctly in time and associated with t1/2 of 13N isotope, this
signature can be used in material analysis. The issue of such approach is the possibility of
the beta annihilation photon’s emission by other 13N-producing parent nuclei. For example,
elements that may cause neutron based production of 13N are boron and oxygen. The 1.47-
MeV alpha particles may be initiated by thermal neutrons via 10B(n,)7Li reaction,
producing 511-keV photons through the 10B(,n)13N reaction. Knockout protons of high
energy produced by fast neutrons may initiate the 5.5-MeV-threshold 16O(p,)13N reaction.
The 63Cu(n,2n)62Cu reaction can produce the positron emitter 62Cu → 62Ni + e+ (t1/2=9.8
minutes). So, the 511-keV annihilation photons emitted from copper and nitrogen nuclei
have a close half-life values. Thus the use of other gamma ray signatures utilizing other
reactions in conjunction with the positron annihilation would be beneficial in the material
analysis.
4. Characteristic gamma radiation
As a result of nuclear reactions involving the isotopes contained in the object under scrutiny, exited nuclei emit gamma rays with specific energies in the de-excitation
process. They act as the “fingerprints” of these isotopes. Most -rays are emitted promptly after the reaction. The “prompt” photon emission from excited nucleus occurs within approximately 10-9 seconds after initial excitation. However, in some cases, a nucleus with a half-life of a few seconds to a couple of minutes is formed. This radioactive nucleus
decays to a daughter nucleus emitting various particles (, β+, β-, etc.) and delayed photons. The prompt gamma ray emission occurs either in the single transition as it happens in the case of hydrogen 2.223-MeV gamma rays, or through several transitions
emitting many prompt -rays of lower energy. The examples of energy level schemes for 12C and 16O nuclei are shown in Fig.3.
www.intechopen.com
Gamma Radiation
26
Fig. 3. Energy level schemes for 12C and 16O
Isotope Reaction E, keV 1H (n,) 2223 12C (n,n’) 4438
14N (n,n’) (n,)
730, 1634, 2313 1885, 5269, 5298, 10829, 10318
16O (n,n’) 5618, 6129
19F (n,n’) (n,)
197, 1236, 1348, 1357 582, 2453, 3589
31P (n,n’) (n,)
1266, 2028, 2233 636, 2154, 3900, 6785
32S (n,n’) (n,)
1273, 2230 841, 2380, 3221, 5420
35Cl (n,) 788, 1165, 1951, 1959, 6111, 7414
75As (n,n’) (n,)
199, 265, 280, 573 165, 472, 1534, 6810
Table 5. Characteristic gamma rays
The intensities of the obtained specific gamma rays provide information about the number
of atoms in the sample. Hence, the information on its chemical composition can be extracted
from the measured gamma ray spectrum. The list of isotopes, nuclear reactions, and
energies of most prominent characteristic gamma rays are shown in Table 5. Emitted due to
neutron induced reactions photons are highly penetrating. For example, energy of gamma
rays emitted from nuclear reactions on nuclei of carbon, oxygen, and nitrogen isotopes is
between 4 and 11 MeV. Table 5 is not inclusive. The prompt gamma rays for other elements
can be found in the following libraries. The prompt gamma rays from thermal neutron
captures (n,) are catalogued in the library for natural elements (Lone et al., 1981). It lists the
prompt gamma ray energies in the range from 23 keV to 10829 keV for all isotopes, in terms
of gamma rays emitted per 100 neutron radiative captures. These data are also available
online from the National Nuclear Data Center (Brookhaven National Laboratory) at
http://www.nndc.bnl.gov/capgam/. Zhou Chunmei compiled the thermal neutron capture
data for nuclides with A>190 (Chunmei, 2001) and new evaluation data for thermal neutron
capture for elements A=1-25: level properties, prompt gamma rays, and decay scheme
properties (Chunmei, 2000). The experimental data on the (n,n’) photons are compiled by
www.intechopen.com
Material Analysis Using Characteristic Gamma Rays Induced by Neutrons
27
Demidov and colleagues in the IAEA document INDC-CCP-120 (Demidov et al., 1978). The
gamma ray spectra from inelastic scattering were measured for all elements except unstable
isotopes and noble gases.
The gamma spectrum obtained from ammonium nitrate sample irradiated with a d-t source
is shown in Fig.4. Spectrum was measured using HPGe detector. We would like to note the
spectral feature of Doppler broadening that is specific for photons induced by 14.1-MeV
neutrons on light nuclei. The two inset expanded spectra in Fig.4 show the gamma ray from 12C(n,n’)12C, 4.438 MeV and 16O(n,n’)16O, 6.13 MeV. It is readily apparent that the gamma
ray peak from 12C is much wider than the gamma ray peak from 16O. Other causes of this
widening such as electronic noise, crystal damage due to neutron irradiation can be
dismissed since 16O does not have any evidence of the broadening. The broadening of the
gamma ray peaks for light nuclei was studied in (Womble et al., 2009). The energy levels of
the nucleus have different spins and parities, and the state’s life times. For example, in 16O,
the 2nd excited state with the energy of 6.13 MeV has a half-life of 18.4 ps (see Fig.3). The
3rd excited state has a half-life nearly 2000 times shorter (8.3 fs). Energies of these two states
are close to each other, but the 2nd excited state to ground state transition is 3-0+ and the
3rd excited state to ground state transition is 2+0+. Thus the difference in half-life is due to
the transition probability of producing E3 radiation versus E2 radiation. The half-life time of
4.43-MeV level in 12C is 42 fs. Carbon and oxygen nuclei recoiling in inelastic neutron
scattering reactions under 14.1-MeV neutrons have similar stopping times moving in the
matrix of the sample; for example, approximately 1800 fs for the NH4NO3 sample. Therefore 12C nucleus may emit photon while in motion exhibiting the Doppler broadening effect for
the 4.43-MeV peak, but 16O nucleus is stopped before the emission of the 6.13-MeV gamma
ray and therefore does not experience the peak broadening in the measured spectrum.
Fig. 4. d-t neutron induced gamma ray spectrum for ammonium nitrate
www.intechopen.com
Gamma Radiation
28
5. Methods and applications
This section covers a number of systems that perform bulk material analysis using neutron induced gamma spectroscopy. Although this is by no means a complete list, it represents systems and techniques that have been utilized in the past twenty years. Some of these systems are still in the market and some never made it to market. Some of the systems have different acronyms or different trade names but rely on the same physical principles:
PGNAA - Prompt Gamma Neutron Activation Analysis
PFNA - Pulsed Fast Neutron Analysis
PFTNA - Pulsed Fast/Thermal Neutron Analysis
PFNTS - Pulsed Fast Neutron Transmission Spectroscopy
API – Associated Particle Imaging
5.1 Prompt gamma neutron activation analysis
Admittedly, Prompt Gamma Neutron Activation Analysis (PGNAA) is usually thought of
as a continuous (or DC) source technique. In this technique, fast neutrons from a
radioisotope, a neutron generator or a reactor impinge upon a sample. The sample then
emits gamma rays through (1) prompt gamma ray emission from gamma decay, (2) gamma
ray emission through short-lived beta decay, or (3) prompt gamma ray emission due to
exoergic nuclear reactions. By the latter, we mean gamma ray emission to satisfy
conservation of energy (or mass) in a nuclear reaction. The most well-known gamma rays
from this type of reaction are the 2.22 MeV gamma ray from the 1H(n,) reaction and the 10.8
MeV gamma ray from the 14N(n,) reaction.
Pulsed neutron sources can be used in PGNAA systems. However, using pulsing neutron generators without taking advantage of the pulsing mechanism is not efficient.
5.2 Pulse fast neutron analysis
Tsahi Gozani, Peter Sawa, and Peter Ryge conceived of Pulsed Fast Neutron Analysis
(PFNA) in 1987 while they were working at SAIC (Gozani, 1995). In PFNA, a large
accelerator creates a deuteron beam which is directed at a deuterium gas target. A chopper,
which consists of strong electric field that periodically sweeps the deuteron beam away from
the target, creates neutron pulses of a few nanoseconds duration. In described system, user
has control of the chopper, so moment when neutrons are created and duration of the
neutron pulse are known precisely. The PFNA uses time-of-flight (TOF) methods to obtain a
favourable signal-to-noise ratio (SNR) to detect various chemicals. The accelerator used in
PFNA is typically an 8 MV Van de Graff accelerator. The D(d,n) reaction has a low Q-value
(approximately 100 keV). Thus any energy above the Q-value is mostly transferred to the
kinetic energy of the neutron, producing a neutron with a maximum kinetic energy of 8
MeV. The velocity of 8 MeV neutrons is about 6 cm/ns. The user, then, knows exactly when
the neutron pulse is made and now can estimate its position at any time after its creation.
Furthermore, due to the high kinetic energy of the deuteron beam, the neutron's momentum is parallel to the momentum of the deuteron. The developers took advantage of this fact and used a sophisticated system to “raster” the neutron beam across the object of interest. The
www.intechopen.com
Material Analysis Using Characteristic Gamma Rays Induced by Neutrons
29
neutron beam also has a small angular divergence and estimates (Strellis, 2009) are that the beam is 9 cm × 12 cm in the center of the object of interest.
PFNA systems can be used to screen very large cargo shipments such as tractor-trailer shipping containers and airport shipping containers. A large, 2-dimensional array of NaI gamma ray detectors covers the cross-section area of the object under scrutiny.
The energies of the gamma rays emitted from the object are plotted against the TOF of the
neutron. This creates a two-dimensional array of data that looks similar to a spectrogram in
that the intensity of the gamma ray at a particular TOF is represented by a color using the
RGB color scheme. In this array of data, color bands parallel to the TOF axis indicate
constant gamma ray background such as from normally occurring radioactive materials
(NORM). Color bands parallel to the energy axis represent the gamma ray spectra of volume
elements (“voxels”) within the object of interest. The volume element size is based on the
time resolution of the system so the voxels are approximately 5-cm thick. For example, in
the center of the container the voxel is 9 cm × 12 cm × 5 cm. The small voxel size increases
the SNR of the system. Another benefit is that the lifetime of certain activation products can
be measured and this gives more data upon which to identify the material.
At early development stage, price and size were the drawbacks of using PFNA. However, since the 9/11 attacks the main challenge is the system cost. The cost includes installation and maintenance of this complex system. In 2009, there was a single system working at the George Bush Intercontinental Airport (Strellis, 2009). As of this writing, we are aware of no other installations.
5.3 Pulsed fast / thermal neutron analysis
The Pulsed Fast/Thermal Neutron Analysis (PFTNA) is a technique used in conjunction
with small, portable electronic neutron generators. It was originally developed by George
Vourvopoulos, Phillip Womble, and Frederick Schultz and presented in (Womble et al.,
1995). Unlike PFNA, which has pulse duration of approximately 2 ns, PFTNA employs
pulses with a minimum duration of 5 s. Longer pulse duration significantly reduces cost of
PFTNA systems. The PFNA system can be used in a “macro-pulse” mode, in which the
neutron beam is turned off for a period of 100 s. This “macro-pulse” mode mimics the
PFTNA system’s mode.
The advantage of the PFTNA systems is an ability to separate the gamma ray spectrum of
inelastic scattering reactions (n,n') from thermal neutron capture (n,) and activation reactions (e.g. (n,p)) gamma-ray spectra. The data acquisition system collects data during the neutron pulse at one memory address and then switches to another memory address to
acquire data between pulses. The data collected during the pulse is primarily from (n,n') reactions and the data collected between pulses is primarily from (n, reactions. Often systems are designed to be shut off for a few minutes to collect short-lived activation products such as 16O(n,p) (t1/2 ≈ 16 s). It is a common misconception that the frequency and
duration of the neutron pulses is chosen to maximize the data from the (n,n') reactions. In
fact these parameters are chosen to maximize the (n,) reactions or more precisely the thermal neutron flux. The neutron pulse frequency determines whether the thermal neutron flux is kept near constant or if it is allowed to diffuse. Applications such as differential die-
www.intechopen.com
Gamma Radiation
30
away analysis (DDA), a method of measuring fissile content, allow the thermal neutron flux to completely diffuse and use pulse frequencies less than 1 kHz. PFTNA systems use pulse frequencies greater than 5 kHz to ensure that the thermal neutron flux is nearly constant for the entire period of measurement (Vourvopoulos & Womble, 2001). Our personal experience in this area has shown that frequencies higher than 10 KHz may be desirable as well.
For a d-t or d-d neutron generator, the typical pulsing method is to clamp the so-called
source voltage using “clamping circuits”. The source voltage causes ionization of the
deuterium gas before the ions are accelerated. A consequence of the higher pulse frequency
is the shorter pulse duration. This is due to the fact that these clamping circuits operate at a
constant duty cycle. The source voltage duration must be a few microseconds
(approximately 4 s) for the deuterium gas to reach a pressure where ionization occurs (the
“fill time”). With this condition along with the constant duty cycle, the maximum neutron
pulse frequency is about 20 kHz since higher frequencies (>25 kHz) will not have a
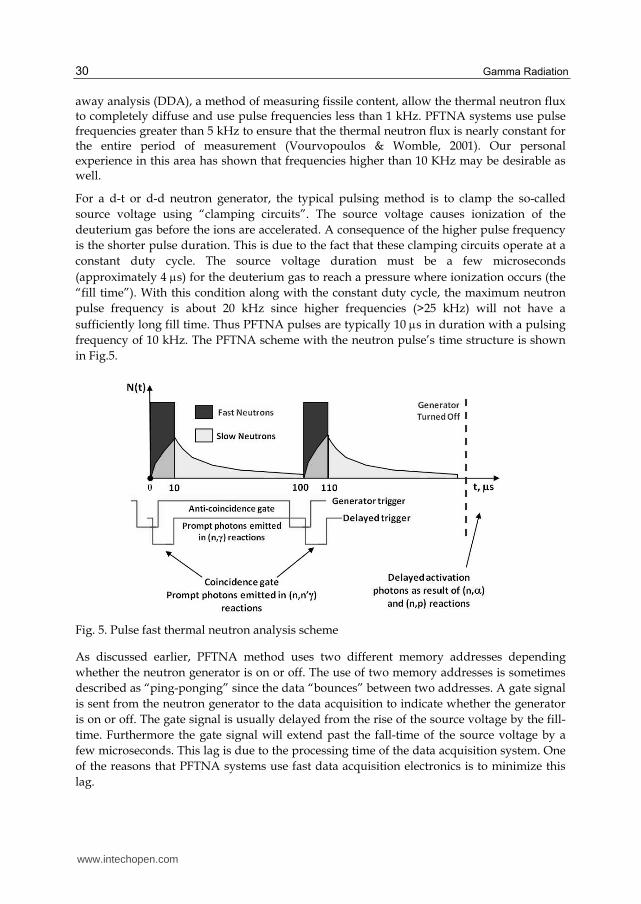
sufficiently long fill time. Thus PFTNA pulses are typically 10 s in duration with a pulsing
frequency of 10 kHz. The PFTNA scheme with the neutron pulse’s time structure is shown
in Fig.5.
Fig. 5. Pulse fast thermal neutron analysis scheme
As discussed earlier, PFTNA method uses two different memory addresses depending
whether the neutron generator is on or off. The use of two memory addresses is sometimes
described as “ping-ponging” since the data “bounces” between two addresses. A gate signal
is sent from the neutron generator to the data acquisition to indicate whether the generator
is on or off. The gate signal is usually delayed from the rise of the source voltage by the fill-
time. Furthermore the gate signal will extend past the fall-time of the source voltage by a
few microseconds. This lag is due to the processing time of the data acquisition system. One
of the reasons that PFTNA systems use fast data acquisition electronics is to minimize this
lag.
www.intechopen.com
Material Analysis Using Characteristic Gamma Rays Induced by Neutrons
31
Another reason to use fast data acquisition electronics in PFTNA systems is high counting rate in the detector when the neutron generator is producing neutrons. Data acquisition rates in the system during this period can exceed 100 kcps. High rates such as these can overwhelm HPGe detectors and analog amplifies. Modern digital electronics can cope with these rates but as rates approach 1 Mcps, scintillation detectors such as sodium iodide or bismuth germanate can be overwhelmed. Count rate limitations force PFTNA system designers to place shielding material between the detector and the neutron generator that adds to system weight.
The d-d and d-t fusion reactions take place at low momentum which means that the neutrons are emitted isotropically. These systems typically consume about 100 W during operation. The average neutron outputs for PFTNA systems are 108 n/s for d-t based systems and 106 n/s for d-d based systems. For d-t systems, this leads to radiological concerns to personnel which can be mitigated by distance (approximately 8 meters stand-off for unshielded operation) or shielding (approximately 30-50 cm shielding).
The benefits of PFTNA systems are their smaller size and relatively low cost. However, these features lead to a lower SNR compared to PFNA systems. Some research teams have suggested combining PFTNA method with the associated particle imaging technique to improve the SNR.
5.4 Associated particle imaging
In associated particle imaging (API), the recoiling residual nucleus, e.g. the alpha particle for
d-t reaction, is used to perform time-of-flight and direction selectivity. SNR could be greatly
improved for (n,n’) gamma ray spectra by measuring gamma ray signals that are emitted
only from the selected volume. However, application of this technique would have no effect
on the SNR of the (n,) or the time delayed activation gamma ray spectra.
The scheme of API technique is shown in Fig.6. The d-t fusion reaction produces alpha
particle and 14.1-MeV fast neutron that are emitted in opposite directions due to linear
momentum conservation. The segmented alpha detector installed inside the sealed neutron
generator tube is used for detection of the -particle event’s position and time to “tag” the
direction of the 14.1-MeV neutron (Koltick et al., 2009). The geometry of segments of the
alpha detector and the neutron’s times-of-flight define the geometry of “voxels” for the 3D
analysis. ZnO(Ga) detector was used as an alpha detector. It was found that detector’s
efficiency is about 90% for 3.49-MeV alpha particles. The phosphor coating emits ~15
photoelectrons / alpha; its scintillation emission peaks at 390 nm with ~3.3-ns decay time,
allowing up to ~21010 n/s output for 2% tagged solid angle without significant pile-up
(Cooper et al., 2003).
The alpha particle detection event and gamma ray detection event are both stamped with the timing signals. The DAQ system is set up to produce the logic signal when both events (the alpha particle and the photon detection) are recorded within a short time interval – the “coincidence window”. This logic signal is used to select those gamma ray signals in the energy spectrum that arrive from the tagged voxel. The 14.1-MeV neutron travels in air with
the velocity ~5 cm/ns. The 3.49-MeV -particle has the velocity ~1.3 cm/ns. Thus the coincidence window should be in the order of nanoseconds. The quality of the timing
www.intechopen.com
Gamma Radiation
32
signals for both detectors should be very high, without jitter. The width of the coincidence window and the neutron flux are interconnected: the random coincidence rate increases with the higher neutron flux thus limiting neutron yield of the generator.
The API technique was used in such systems as SENNA (Vakhtin et al., 2006), EURITRACK
(Perret et al., 2006), and UNCOSS (Eleon et al., 2010).
Fig. 6. Associated particle imaging technique
5.5 Pulsed fast neutron transmission spectroscopy
Pulsed fast neutron transmission spectroscopy (PFTNS) is the only technique in this section,
which examines the resulting neutron spectrum, instead of the gamma ray spectrum. In this
technique, a broad energy beam of neutrons is directed at an array of neutron detectors. The
object under interrogation is passed through the beam and the resulting attenuated neutron
spectrum is measured using the neutron detectors. This method is the same method that
researchers use to perform neutron cross-section measurements.
The pulsing in PFTNS allows the system to perform neutron TOF measurements. These TOF
measurements are used to determine the energy of the neutrons with flight paths of 4 to 10
m. The resulting neutron spectrum is used to estimate the attenuation of neutrons as
function of energy. Light elements such as H, C, N, and O have high cross-sections for
neutron attenuation at these energies. Thus the relative amounts of H, C, N, and O can be
determined, and the “imaging” of elements is possible. The voxel sizes would be similar to
those of PFNA due to the limits of the speed of the neutrons.
Due to the high neutron fluences and precise timing required for PFTNS, this system needs
an accelerator similar to the one utilized by PFNA. The TOF path means that the systems
take a large amount of space. These are two of the reasons that these systems were not
widely adopted by the security community.
www.intechopen.com
Material Analysis Using Characteristic Gamma Rays Induced by Neutrons
33
PFTNS was proposed as a primary or secondary screening system for airline security. Designs were proposed which would handle a large number of bags per minute. This would be achieved by having the bags ride a carousel around accelerator. The neutron detectors would be placed in a “wall configuration” and the neutron beam would raster through a number of bags. The National Academy report (NNMAB-482-6, 1999), written in 1999, was extremely critical of the utilization of PFTNS for airport security. However, Overley suggests that detection rates of 93% and false alarm rates of 4% are possible with this technique (Overley et al., 2006).
6. Gamma radiation spectral analysis
Neutron based material analysis methods generally require a skilled analyst to interpret the gamma ray spectral data collected, and to classify the interrogated object using the elemental parameters extracted from the spectral data. Automatic spectral analysis algorithms and the object’s classification algorithms are required for real world applications where access to nuclear spectroscopy expertise is limited, or the autonomous and/or the robotic operation is necessary.
6.1 Analysis of neutron induced gamma ray spectra
The first step in the data analysis process is to extract the sample’s elemental information
from the measured gamma ray spectra. The spectrum analysis algorithms that are used for
that purpose should simultaneously provide quick, accurate, and objective analysis of
gamma ray spectra by evaluating the intensities of the characteristic photon peaks. For
spectra measured with high resolution detectors such as HPGe, the approach can be based
on the peak finding algorithm using the regions of interest (ROIs). Usually, the “blank”
spectrum (measured with no sample present) is subtracted from the “sample” spectrum
(measured with the sample) before the spectral analysis. It takes into account the signatures
of the same elements that are present in surrounding materials, and in the sample. The
“nuclear” ROI parameters such as the net peak area in counts /second units are
proportional to the number of isotopes in the sample that emitted the fingerprint gamma
rays. The “nuclear” parameters may be converted into other appropriate units, if needed,
using the elemental calibration library (for example, “chemical” parameters accepted in the
coal or the cement analysis industry, etc.). These libraries are created for the system using
calibration measurements using known samples.
The simple ROI-based method may be appropriate for non-complicated spectra with the peaks that are well resolved. For spectra with many closely positioned peaks, or low resolution spectra with overlapping peaks, the peak-shape fitting algorithms are required. The mathematical method of measured spectrum fitting as the linear combination of single element’s detector responses, that are measured experimentally, was developed by George Vourvopoulos and Phillip Womble (Vourvopoulos & Womble, 2001). To use this method,
one must first measure the response of the low resolution detector to -rays from pure elements. For example, a block of pure graphite is used to determine the detector’s
elemental response to the carbon -rays. To determine the detector’s elemental response to hydrogen, a response is measured from a water sample, and so on. The counts in i-th channel of the spectrum of a sample S can be represented by the equation:
www.intechopen.com
Gamma Radiation
34
1
m
i i j i , jj
S K BL A RF
(4)
Here: BLi is the blank spectrum at the i-th channel and K is its coefficient; RFi,j is the detector’s elemental response of the j-th element at the i-th channel and Aj is its coefficient, and m is the total number of elements used for this spectrum decomposition procedure. The
coefficients K and Aj are found by the least squares algorithm minimizing the 2 to find the “best fit”. As the result of this decomposition procedure, the intensities of peaks of j elements used in this fitting are found in counts /second.
Another spectral decomposition technique developed by Robin Gardner and colleagues (Shyu et al., 1993) utilizes the detector’s elemental responses that are calculated using Monte Carlo methods. The experimental method of detector’s elemental response generation provides detailed realistic spectral features (i.e. electronics noise, peak broadening, neutron activation effects, etc.), but it is time intensive, and the set of pure element samples may be limited. The computational method allows generation of responses for the larger set of elements, but it may be problematic to represent detailed spectral features because not all processes in a Monte Carlo code may be taken into account.
Bruce Kessler applied the original mathematical method based on multi-wavelets to analyze the neutron induced photon spectra (Kessler, 2010). In this approach, the set of special scaling vector components was developed for spectrum fitting. Wavelet decompositions ignore signal components up to the approximation space of the basis, so the wavelet analysis is used to look for patterns over the top of spectral “noise”. The measured sample spectrum wavelets are decomposed using a variable linear combination of the wavelets from the decompositions of detector’s elemental responses providing the intensities of characteristic gamma ray peaks. The algorithm was shown to be effective for both high resolution and low resolution spectra.
6.2 Classification algorithms
The object’s classification algorithms are responsible for material identification using the
characteristic gamma ray peak data that are produced by the spectral analysis algorithms.
The classification uses the fact that the amount of particular isotopes varies for different
materials (i.e. based on their chemical formula, taking the reaction cross sections into
account).
The suitable approach is to represent the measurement result as a “point” in the space of
several parameters (elemental intensities). Different materials containing the same isotopes
but in different ratios are represented by points that are segregated in such “elemental”
space. The dimension of this space is determined by the number of isotopes.
In general, the “nuclear” data obtained with neutron based systems differ from elemental
composition evaluations based on chemical formula due to several reasons such as statistical
nature of nuclear reactions, short measurement times, presence of radiation shielding, and
other environmental conditions. Thus, the chemical compound measured in various
conditions is represented not by the single “point” in the elemental space, but rather by a
cloud-like set of points, where each point corresponds to one measurement.
www.intechopen.com
Material Analysis Using Characteristic Gamma Rays Induced by Neutrons
35
Clouds have circular structure, and create specific patterns for classes of different materials. Fig. 7 shows a two-dimensional slice of the elemental space. It represents two isotopes: oxygen and nitrogen. Four materials that contain different amounts of oxygen and nitrogen were used as samples for measurements in various environmental conditions. The (nitrogen, oxygen) points from many measurements shape the 2D clouds on the figure.
The classification decision is made using the boundaries calculated to separate these classes. For the well separated clouds, the boundaries can be found easily, and simple decision making logic “trees” can be constructed. But in many cases, the patterns for threats and innocuous materials are overlapped in the multidimensional space of parameters making the differentiation task challenging for classical decision-tree algorithms.
Fig. 7. Data points for four different substances
The decision-tree algorithm for the identification of the particular threat material (“ANFO”)
amongst four classes of materials is shown in Fig.8. It can be described as the following: if
detected oxygen signal lies between lower and higher thresholds, then nitrogen signal is
checked. If nitrogen signal lies between lower and higher thresholds, then substance can be
identified as “ANFO”. The thresholds in the decision tree (Nlow, Nhigh, Ohigh) can be varied in
order to achieve better results. Each threshold value can be represented as a horizontal
(oxygen threshold) or vertical (nitrogen threshold) line. In order to pick best low and high
thresholds, parameters of the decision making tree were varied and Receiver Operating
Characteristics (ROC) curves were plotted. In signal detection theory, a ROC curve is a
graphical plot of true positive rate (or sensitivity) versus false positive rate for a binary
classifier system as its discrimination threshold is varied. The ROC-analysis provides tools
to select possibly optimal decision boundaries. The ROC curve methodologies are discussed
elsewhere (Fawcett, 2006).
www.intechopen.com
Gamma Radiation
36
Fig. 8. Example of the decision tree used to analyze data from Fig. 7
Each set of parameters of the decision-making algorithm corresponds to the point on the ROC curve (or ROC surface). Therefore, we define the optimal parameters for the decision-making algorithm as a set of parameters, which allow the minimum “decision” vector magnitude from (0,1) point (left-upper corner of the ROC graph) to the corresponding point on the ROC curve (see Fig.9). The best low and high thresholds were selected by variation of parameters of the decision making tree aimed to determine the ROC curve with the minimal decision vector length. The optimal decision boundaries for identifying the ANFO material are shown as black lines in Fig.7.
Fig. 9. ROC curve
It is clear that this algorithm does not satisfactory identify substances when classes are
overlapping. For example, True Positive rate of the classification between ANFO and urea is
only 75%, which is unacceptable for the field deployable system. To improve performance of
the classifier, the linear boundary was used. In the case of general linear boundary, the
decision making algorithm can be described as the following: if point with experimentally
measured nitrogen and oxygen counts (Nex, Oex) lies below the line that is defined as O =
k·N + ℓ, then this point belongs to the class A, if it lies above that line, then it belongs to the
class B. The parameters for the linear boundary (the slope and the offset) were varied, and
the ROC curves were generated. The optimal pair of parameters corresponds to the minimal
decision vector magnitude. This approach tested with the same data set as shown in Fig. 7
produced better results: true positive rates for all classifiers are better than 95%. Optimal
linear boundaries are shown in Fig.10 as black lines.
www.intechopen.com
Material Analysis Using Characteristic Gamma Rays Induced by Neutrons
37
Fig. 10. Linear boundaries between four classes
The use of linear boundaries is significantly improving the material identification capabilities of the neutron based system. The use of polynomial functions is a natural generalization of this approach. Other pattern recognition methods can also be used to construct the decision boundaries of complex shapes and can be applied to analyze the detector signals - for example, methods based on R-functions (Bougaev & Urmanov, 2005).
7. Conclusion
This chapter provided an overview of several material analysis methods using different nuclear reactions induced by pulse neutrons: PGNAA, PFNA, PFTNA, PFTNS, and API. These methods utilize the characteristic gamma radiation and other radiation signatures, prompt and delayed in time, to measure the elemental content of unknown bulk samples. The pulse neutron based elemental analysis is the non-intrusive, non-destructive technique that has yielded the development of in situ material characterization systems in many areas: process control in industry, medicine, security, geological and environmental studies, and others. These applications require automatic, rapid spectra analysis and sample classification algorithms to be effective for the real world use. The methods of spectral decomposition using the combination of single element’s detector responses proved to be effective. The pattern recognition methods shown true positive rates ~95% in the material classification.
Generators for High Explosives, Toxic Agents and Fissile Material Detection, Applied Radiation and Isotopes, Vol. 63, pp. 537-543, ISSN 0969-8043
April, E.; Bolotnikov, A.E.; Bolozdynya, A.I & Doke, T. (2006). Noble Gas Detectors, Wiley-VCH, 1st Edition, ISBN 978-3527405978
Barzilov, A. & Womble, P.C. (2006). Comparison of Gamma-Ray Detectors for Neutron-Based Explosives Detection Systems, Transactions of American Nuclear Society, Vol. 94, p. 543, ISSN 0003-018X
Barzilov, A. & Womble, P.C. (2003). NELIS - a Neutron Inspection System for Detection of Illicit Drugs, AIP Conference Proceedings, Vol. 680, pp. 939-942, ISSN 1551-7616
Bougaev, A. & Urmanov, A. (2005). R-functions Based Classification for Abnormal Software Process Detection, In: Computational Intelligence and Security, J. Carbonell and J. Siekmann, (Eds.), 991-996, Lecture Notes in Computer Science, Vol. 3801/2005, Springer, ISBN 3-540-30818-0, Berlin / Heidelberg, Germany
Chunmei, Z. (2001). Thermal-Neutron Capture Data Update and Revision for Some Nuclides with A>190, INDC-CPR-0055, Nuclear Data Services, International Atomic Energy Agency, Vienna, Austria
Chunmei, Z. (2000). Thermal Neutron Capture Data for A=1-25, INDC-CPR-0051, Nuclear Data Services, International Atomic Energy Agency, Vienna, Austria
Cooper, J.C.; Koltick, D.S.; Mihalczo, J.T. & Neal, J.S. (2003). Evaluation of ZnO(Ga) Coatings as Alpha Particle Transducers within a Neutron Generator, Nuclear Instruments and Methods in Physics Research A, Vol. 505, Issues 1-2, pp. 498-501, ISSN 0168-9002
Cooper, J.C. & Koltick, D.S. (2001). Optimization of Time and Energy Resolution at High Count Rates with a Large Volume Coaxial High Purity Germanium Detector, Nuclear Science Symposium Conference Record, IEEE, Vol.4, pp. 2420-2423, ISBN 0-7803-7324-3
Demidov, A.M.; Govor, L.I. & Cherepantsev, Yu.K. (1978). Atlas of Gamma-Ray Spectra from Inelastic Scattering of Reactor Fast Neutrons, INDC-CCP-120, Nuclear Data Services, International Atomic Energy Agency, Vienna, Austria
Dep, L.; Belbot, M.; Vourvopoulos, G. & Sudar, S. (1998). Pulsed Neutron-Based On-Line Coal Analysis, Journal of Radioanalytical and Nuclear Chemistry, Vol. 234, No.1-2, pp. 107-112, ISSN 0236-5731
Eleon, C.; Perot, B.; Carasco, C.; Sudac, D.; Obhodas, J. & Valcovic, V. (2010). Experimental and MCNP Simulated Gamma-Ray Spectra for the UNCOSS Neutron-Based Explosive Detector, Nuclear Instruments and Methods in Physics Research A, Vol. 629, pp. 220-229, ISSN 0168-9002
Fawcett, T. (2006). An introduction to ROC analysis, Pattern Recognition Letters, Vol. 27, pp. 861–874, ISSN 0167-8655
Fourches, N.; Walter, G. & Bourgoin, J.C. (1991). Neutron-Induced Defects in High-Purity Germanium, Journal of Applied Physics, Vol. 69, pp. 2033-2043, ISSN 0021-8979
Gozani, T. (1995). Understanding the Physics Limitations of PFNA - the Nanosecond Pulsed Fast Neutron Analysis, Nuclear Instruments and Methods in Physics Research B, Vol. 99, pp. 743-747, ISSN 0168-583X
Holslin, D.T.; Shyu, C.M.; Sullivan, R.A. & Vourvopoulos, G. (2006). PELAN for Non-Intrusive Inspection of Ordnance, Containers, and Vehicles, Proceedings of SPIE, Vol. 6213, p. 621307, ISSN 0277-786X
James, W.D. & Fuerst, C.D. (2000). Overcoming Matrix Effects in the 14-MeV Fast Neutron Activation Analysis of Metals, Journal of Radioanalytical and Nuclear Chemistry, Vol. 244, No.2, pp. 429-434, ISSN 0236-5731
www.intechopen.com
Material Analysis Using Characteristic Gamma Rays Induced by Neutrons
39
Kessler, B. (2010). An Algorithm for Wavelet–Based Elemental Spectrum Analysis, 13th International Conference on Approximation Theory, San Antonio, TX, March 7-10, 2010. Available at: http://works.bepress.com/bruce_kessler/65
Koltick, D.S.; Kane, S.Z.; Lvovsky, M.; Mace, E.K.; McConchie, S.M. & Mihalczo, J.T. (2009). Characterization of an Associated Particle Neutron Generator With ZnO:Ga Alpha-Detector and Active Focusing, IEEE Transactions on Nuclear Science, Vol. 56, pp. 1301-1305, ISSN 0018-9499
Koltick, D.S; Kim, Y.; McConchie, S.; Novikov, I.; Belbot, M. & Gardner, G. (2007). A Neutron Based Vehicle-Borne Improvised Explosive Device Detection System, Nuclear Instruments and Methods in Physics Research B, Vol. 261, pp. 277-280, ISSN 0168-583X
Lanza, R. (2007). Nuclear Techniques for Explosive Detection: Current Prospects and Requirements for Future Development, In: Combined Devices for Humanitarian Demining and Explosive Detection, International Atomic Energy Agency, ISBN 978-92-0-157007-9, Vienna, Austria
Ljungvall, J. & Nyberg, J. (2005). A Study of Fast Neutron Interactions in High-Purity Germanium Detectors, Nuclear Instruments and Methods in Physics Research A, Vol. 546, pp. 553–573, ISSN 0168-9002
Lone, M.A.; Leavitt, R.A. & Harrison, D.A. (1981). Prompt Gamma Rays from Thermal-Neutron Capture, Atomic Data and Nuclear Data Tables, Vol. 26, Issue 6, pp. 511-559, ISSN 0092-640X
Maglich, B.C. & Nalcioglu, O. (2010). ONCOSENSOR for Noninvasive High-Specificity Breast Cancer Diagnosis by Carbogen-Enhanced Neutron Femto-Oximetry, ASME Conference Proceedings: Congress on NanoEngineering for Medicine and Biology, pp. 57-58, ISBN 978-0-7918-4392-5
Nikitin, A. & Bliven, S. (2010). Needs of Well Logging Industry in New Nuclear Detectors, Nuclear Science Symposium Proceedings, pp. 1214-1219, Knoxville, TN, Oct. 30 – Nov. 6, 2010, ISSN 1082-3654
NNMAB-482-6 (1999). The Practicality of Pulsed Fast Neutron Transmission Spectroscopy for Aviation Security, National Academies Press, ISBN 0-309-07367-7
Overley, J.C.; Chmelik, M.S.; Rasmussen, R.J.; Schofield, R.M.S.; Sieger, G.E. & Lefevre, H.W. (2006). Explosives Detection via Fast Neutron Transmission Spectroscopy, Nuclear Instruments and Methods in Physics Research Section B, Vol. 251, pp. 470-478, ISSN 0168-583X
Parsons, A.; Bodnarik, J.; Evans, L.; Floyd, S.; Lim, L.; McClanahan, T.; Namkung, M.; Nowicki, S.; Schweitzer, J.; Starr, R. & Trombka, J. (2011). Active Neutron and Gamma-Ray Instrumentation for In-Situ Planetary Science Applications, Nuclear Instruments and Methods in Physics Research A, Vol. 652, pp. 674-679, ISSN 0168-9002
Pehl, R.H.; Madden, N.W.; Elliott, J.H.; Raudorf, T.W.; Trammel, R.C & Darken, L.S. (1979). Radiation Damage Resistance of Reverse Electrode Ge Coaxial Detectors, IEEE Transactions on Nuclear Science, Vol. 26, pp. 321-323, ISSN 0018-9499
Perret, G.; Perot, B.; Artaud, J-L. & Mariani, A. (2006). EURITRACK Tagged Neutron Inspection System, Journal of Physics: Conference Series, Vol. 41, pp. 375-383, ISSN 1742-6596
Reber, E.L.; Blackwood, L.G.; Edwards, A.J.; Jewell, J.K.; Rohde, K.W.; Seabury, E.H. & Klinger, J.B. (2005). Idaho Explosives Detection System, Nuclear Instruments and Methods in Physics Research B, Vol. 241, Issue 1-4, pp. 738-742, ISSN 0168-583X
Sangsingkeow, P.; Berry, K.D.; Dumas, E.J.; Raudorf, T.W. & Underwood, T.A. (2003). Advances in Germanium Detector Technology, Nuclear Instruments and Methods in Physics Research A, Vol. 505, pp. 183-186, ISSN 0168-9002
www.intechopen.com
Gamma Radiation
40
Shypailo, R.J. & Ellis, K.J. (2005). Design Considerations for a Neutron Generator-Based Total-Body Irradiator, Journal of Radioanalytical and Nuclear Chemistry, Vol. 263, No. 3, pp. 759-765, ISSN 0236-5731
Shyu, C. M.; Gardner, R.P. & Verghese, K. (1993). Development of the Monte Carlo Library Least-Squares Method of Analysis for Neutron Capture Prompt Gamma-Ray Analyzers, Nuclear Geophysics, Vol. 7, No. 2, pp. 241-268, ISSN 0969-8086
Sowerby, B.D. (2009). Nuclear techniques for the On-Line Bulk Analysis of Carbon in Cola-Fired Power Stations, Applied Radiation and Isotopes, Vol. 67, pp. 1638-1643, ISSN 0969-8043
Strellis, D. A.; Gozani, T. & Stevenson, J. (2009). Air Cargo Inspection Using Pulsed Fast Neutron Analysis, In: IAEA Proceedings Series: Topical Meeting on Nuclear Research - Applications and Utilization of Accelerators, Paper SM/EN-05, International Atomic Energy Agency, ISBN 978-92-0-150410-4, Vienna, Austria
Tsoulfanidis, N. & Landsberger, S. (2010). Measurement and Detection of Radiation, 3rd Edition, CRC Press, ISBN 1420091859
Vakhtin, D.N.; Gorshkov, I.Yu.; Evsenin, A.V.; Kuznetsov, A.V. & Osetrov, O.I. (2006). Senna – Portable Sensor for Explosives Detection Based on Nanosecond Neutron Analysis, In: Detection and Disposal of Improvised Explosives, H. Schubert and A. Kuznetsov, (Eds.), 87-96, NATO Security through Science Series B: Physics and Biophysics, Vol. 6, Springer, ISBN 1-4020-4886-6, Dordrecht, The Netherlands
Vourvopoulos, G. & Womble, P. (2001). Pulsed Fast Thermal Neutron Analysis: A Technique for Explosives Detection, Talanta, Vol. 54, pp. 459-468, ISSN 0039-9140
Wielopolski, L.; Hendrey, G.; Johnsen, K.; Mitra, S.; Prior, S.; Rogers, H. & Tolbert, H. (2008). Nondestructive System for Analyzing Carbon in the Soil, Soil Science Society of America Journal, Vol. 72, pp. 1269-1277, ISSN 0361-5995
Williams, D. L.; Vainionpaa, J. H.; Jones, G.; Piestrup, M. A.; Gary, C. K.; Harris, J. L.; Fuller, M. J.; Cremer, J. T.; Ludewigt, B. A.; Kwan, J. W.; Reijonen, J.; Leung, K.-N. & Gough, R. A. (2008). High Intensity, Pulsed, D-D Neutron Generator, AIP Conference Proceedings, Vol. 1099, pp. 936-939, ISSN 1551-7616
Womble, P.C.; Barzilov, A.; Novikov, I.; Howard, J. & Musser, J. (2009). Evaluation of the Doppler-Broadening of Gamma-Ray Spectra from Neutron Inelastic Scattering on Light Nuclei, AIP Conference Proceedings, Vol. 1099, pp. 624-627, ISSN 1551-7616
Womble, P.C.; Paschal, J. & Moore, R. (2005). Cement Analysis Using d + D neutrons, Nuclear Instruments and Methods in Physics Research B, Vol. 241, No.1-4, pp. 765-769, ISSN 0168-583X
Womble, P.C.; Vourvopoulos, G.; Paschal, J.; Novikov, I. & Chen, G. (2003). Optimizing the Signal-to-Noise Ratio for the PELAN System, Nuclear Instruments and Methods in Physics Research A, Vol. 505, Issue 1-2, pp. 470-473, ISSN 0168-9002
Womble, P.C.; Vourvopoulos, G.; Paschal, J.; Novikov, I. & Barzilov, A. (2002). Results of Field Trials for the PELAN System, Proceedings of SPIE, Vol. 4786, pp. 52-57, ISSN 0277-786X
Womble, P.C.; Schultz, F.J. & Vourvopoulos, G. (1995). Non-Destructive Characterization Using Pulsed Fast-Thermal Neutrons, Nuclear Instruments and Methods in Physics Research B, Vol. 99, pp. 757-760, ISSN 0168-583X
www.intechopen.com
Gamma RadiationEdited by Prof. Feriz Adrovic
ISBN 978-953-51-0316-5Hard cover, 320 pagesPublisher InTechPublished online 21, March, 2012Published in print edition March, 2012
InTech ChinaUnit 405, Office Block, Hotel Equatorial Shanghai No.65, Yan An Road (West), Shanghai, 200040, China
Phone: +86-21-62489820 Fax: +86-21-62489821
This book brings new research insights on the properties and behavior of gamma radiation, studies from awide range of options of gamma radiation applications in Nuclear Physics, industrial processes, EnvironmentalScience, Radiation Biology, Radiation Chemistry, Agriculture and Forestry, sterilization, food industry, as wellas the review of both advantages and problems that are present in these applications. The book is primarilyintended for scientific workers who have contacts with gamma radiation, such as staff working in nuclear powerplants, manufacturing industries and civil engineers, medical equipment manufacturers, oncologists, radiationtherapists, dental professionals, universities and the military, as well as those who intend to enter the world ofapplications and problems of gamma radiation. Because of the global importance of gamma radiation, thecontent of this book will be interesting for the wider audience as well.
How to referenceIn order to correctly reference this scholarly work, feel free to copy and paste the following:
Alexander P. Barzilov, Ivan S. Novikov and Phillip C. Womble (2012). Material Analysis Using CharacteristicGamma Rays Induced by Neutrons, Gamma Radiation, Prof. Feriz Adrovic (Ed.), ISBN: 978-953-51-0316-5,InTech, Available from: http://www.intechopen.com/books/gamma-radiation/material-analysis-using-characteristic-gamma-rays-induced-by-pulse-neutrons


![TERRESTRIAL GAMMA-RAY FLASHES · the satellite-detected gamma rays. 4. Gamma Ray Survival From Thunderstorm to Satellite [20] The interaction of gamma rays with atmospheric air and](https://static.documents.pub/doc/80x56/5ca8857e88c993e47d8bc64f/terrestrial-gamma-ray-flashes-the-satellite-detected-gamma-rays-4-gamma-ray.jpg)


