- 1 - Draft paper for the conference “Comparative EU Statistics on Income and Living conditions: issues and Challenges” (Helsinki, November 2006) “Material deprivation and poor housing” What can be learned from the EU-SILC 2004 data? How can EU-SILC be improved in this matter? Anne-Catherine Guio 1 Isabelle Engsted Maquet 2 Summary European Union (EU) Heads of State and Government endorsed common statistical indicators of social exclusion, that are an essential element in the Open Method of Co-ordination to monitor progress of Member States in the fight against poverty and social exclusion. This list of common indicators has a primary focus on indicators of relative income poverty. This paper aims to compare poverty picture that can be drawn on the basis on this relative monetary approach, with an alternative view based on material deprivation measures, more “absolute” and multidimensional. Material deprivation is defined as the enforced lack of a combination of items depicting material living conditions, such as housing conditions, possession of durables, capacity to afford basic requirements. It is worth highlighting that the proposed indicators are not indices of social exclusion that take account of all the dimensions of the phenomenon (i.e. health, education, social participation, etc). They are simply intended to offer synthetic information on material living conditions in an enlarged Union. The use of such complementary measures is indeed particularly meaningful in the context of the enlarged union as questions are raised concerning the ability of the existing portfolio of common indicators to satisfactorily reflect the situation in New Member States, Acceding and Candidate countries, as well as differences between them and the ‘old’ Member states. This paper discusses the methodological options for the construction of this type of indicators, drawing from the existing literature, and presents some results on the basis on the new harmonised micro data 2004 EU-SILC. Furthermore, a methodology to assess the EU-SILC target variables on material deprivation will be proposed in order to make survey variables able to give a better overview on material deprivation in the enlarged Europe. 1 IWEPS (Institut wallon de l’évaluation, de la prospective et de la statistique) - Belgium, Eurostat Seconded National Expert (15/02/2002 – 31/07/2005). 2 DG employment and social affairs, European Commission.
Transcript
- 1 -
Draft paper for the conference “Comparative EU Statistics on Income and Livingconditions: issues and Challenges” (Helsinki, November 2006)
“Material deprivation and poor housing”
What can be learned from the EU-SILC 2004 data?
How can EU-SILC be improved in this matter?
Anne-Catherine Guio1
Isabelle Engsted Maquet2
Summary
European Union (EU) Heads of State and Government endorsed common statistical indicators ofsocial exclusion, that are an essential element in the Open Method of Co-ordination to monitorprogress of Member States in the fight against poverty and social exclusion. This list of commonindicators has a primary focus on indicators of relative income poverty.
This paper aims to compare poverty picture that can be drawn on the basis on this relative monetaryapproach, with an alternative view based on material deprivation measures, more “absolute” andmultidimensional. Material deprivation is defined as the enforced lack of a combination of itemsdepicting material living conditions, such as housing conditions, possession of durables, capacity toafford basic requirements. It is worth highlighting that the proposed indicators are not indices of socialexclusion that take account of all the dimensions of the phenomenon (i.e. health, education, socialparticipation, etc). They are simply intended to offer synthetic information on material living conditionsin an enlarged Union. The use of such complementary measures is indeed particularly meaningful inthe context of the enlarged union as questions are raised concerning the ability of the existing portfolioof common indicators to satisfactorily reflect the situation in New Member States, Acceding andCandidate countries, as well as differences between them and the ‘old’ Member states.
This paper discusses the methodological options for the construction of this type of indicators, drawingfrom the existing literature, and presents some results on the basis on the new harmonised micro data2004 EU-SILC. Furthermore, a methodology to assess the EU-SILC target variables on materialdeprivation will be proposed in order to make survey variables able to give a better overview onmaterial deprivation in the enlarged Europe.
1 IWEPS (Institut wallon de l’évaluation, de la prospective et de la statistique) - Belgium, Eurostat Seconded National Expert (15/02/2002 –31/07/2005).2 DG employment and social affairs, European Commission.
A new Source on Income, Poverty & Social Exclusion…
During the reference period 1994-2001 the European Community Household Panel (ECHP)3 hastraditionally been the primary source of data used for the calculation of these indicators in the field ofIncome, Poverty & Social Exclusion. Given the need to update the content of the ECHP in order tosatisfy new political demands, to reflect evolving best practice and to improve operational quality, i.e.mainly the timely publication of the data which is produced, it was decided to replace the ECHP and tointroduce a legal act for its replacement, the EU-SILC (Community Statistics on Income and livingConditions, see annex C). The EU-SILC project was launched in 2003 on the basis of a 'gentleman’sagreement' in six Member States (Belgium, Denmark, Greece, Ireland, Luxembourg, and Austria) aswell as in Norway. The starting date for the EU-SILC instrument under the Framework Regulation ofthe European Parliament and of the Council was 2004 for the EU-15 (with the exception of Germany,Netherlands and the UK who have derogations until 2005) as well as for Estonia, Norway. The NewMember States with the exception of Estonia are allowed to start in 20054.
This means that, for the first time, SILC-2004 is available on a larger basis (13 Member States +Norway) and makes it possible to test whether the results on poverty and deprivation that werepreviously highlighted on the ECHP data are confirmed by the new instrument. Furthermore, for thefirst time, comparable and harmonised data are available for one of the new Members States (Estonia)
3 See annex A1.
4 The implications of this means that the first set of micro data and cross-sectional indicators from EU-SILC which covers all the EU25 MemberStates will only be available in December 2006.
- 3 -
and will permit to study and compare living conditions information with the information usuallypresented for EU15 Member States.
What can be learned from material deprivation measures?
At the Laeken European Council in December 2001, European Union (EU) Heads of State andGovernment endorsed a first set of 18 common statistical indicators of social exclusion and povertythat were later refined by the Indicators Sub-Group of the Social Protection Committee. Theseindicators are an essential element in the Open Method of Co-ordination to monitor progress ofMember States in the fight against poverty and social exclusion.
In the current list of common (EU) indicators of poverty and social exclusion to be used in the context ofthe Open Method of Coordination on social inclusion, there is a primary focus on indicators of relativeincome poverty, defined in relation to the distribution of income within each country. “An absolute notion isconsidered as less relevant for the EU for two basic reasons. First, the key challenge for Europe is tomake the whole population share the benefits of high average prosperity, and not to reach basicstandards of living, as in less developed parts of the world. Secondly, what is regarded as minimalacceptable living standards depends largely on the general level of social and economic development,which tends to vary considerably across countries”5.
Nonetheless, questions are raised concerning the ability of the existing portfolio of indicators tosatisfactorily reflect the situation in New Member States, Acceding and Candidate countries, as well asdifferences between them and the ‘old’ Member states. When comparing national situations in anenlarged Union, the performance in terms of exposure to relative monetary poverty is very similarbetween old and new Member States even though standards of living are extremely different, as canbe seen for example from a comparison of the levels of the national at-risk-of poverty thresholdvalues. An illustration of this diversity of living conditions can also be given by some partial evidenceavailable about material deprivation in the New Member States and the Acceding and CandidateCountries6. Around 30% of people would like to have a car but cannot afford it (referred below as‘enforced lack’) in most of the New Member States and Acceding and Candidate Countries, except inthe Czech Republic (19%) and Cyprus, Malta, Slovenia that are close to the EU15 average (5%). Thediversity of deprivation across the EU25 is even more striking in the access to basic necessities, asthe proportion of people that cannot afford a meal with meat, chicken or fish every second day (if theyso wished) is close or above 30% in five out of the ten New Member States and is even morewidespread in the Acceding and Candidate Countries (the EU15 average being 4%). The proportion ofpeople lacking an indoor flushing toilet is around 20% in Baltic Countries, i.e. more than 4 times themost deprived EU15 country (Portugal).
These figures highlight the need to complement the information provided by indicators of relativemonetary poverty, in order to give a more complete picture of the living conditions of people indifferent national contexts, but this is not the only reason. Even at national level, it is now wellrecognized that different approaches to poverty measurement, including the material deprivation one,are useful to take into account the different aspects of poverty.
It could be argued that figures concerning material living conditions solely reflect differential access toresources and/or subjective consumer tastes and preferences – and that monetary income measuresare consequently a better proxy for measuring living standards, while being easier to collect. However,income and resources, whilst clearly linked, are not the same thing: other individual resources matterin addition to income (eg. assets/debts, previous labour positions or non-cash transfers). In addition, itis not always possible to measure income accurately, especially for some groups of the population likefor example the self-employed or for people working in the grey economy. In this case, the jointanalysis of relative income poverty measures and material deprivation indicators can be useful.Furthermore, in the (current) absence of longitudinal data on income (due to the launch of a newsurvey), lack of essential durables or difficulties in payments provides a good proxy of persistentpoverty since they reflect absence of sufficient (permanent) resources rather than of adequate currentincome.
5 European Commission (2004).6 Data from European Quality of Life Survey, 2003 (European Foundation for the improvement of living and working conditions.
- 4 -
This paper discusses the methodological options for the construction of this type of indicators, drawingfrom the existing literature, and presents some results on the basis on the new harmonised micro data2004 EU-SILC. Furthermore, a methodology to assess the EU-SILC target variables on materialdeprivation will be proposed in order to make survey variables able to give a better overview onmaterial deprivation in the enlarged Europe.
The development and use of material deprivation indicators is currently being discussed by theIndicators Sub-Group of the Social Protection Committee, with a view to further refining andconsolidating the original list of common indicators adopted at Laeken. No clear agreement has yetbeen reached on them although a lot of progress has been made.
How to define material deprivation?
In this paper, material deprivation is defined as the enforced lack of a combination of items depictingmaterial living conditions, such as housing conditions, possession of durables, and capacity to afford basicrequirements. It is worth highlighting that the proposed indicators are not indices of social exclusion thattake account of all the dimensions of the phenomenon (i.e., access to the labour market, health,education, social participation, etc). They are simply intended to offer synthetic information on materialliving conditions in an enlarged Union.
To be chosen as a ‘lifestyle deprivation’ item, an item should ideally meet the following requirements7:
(1) it reflects the lack of an ordinary living pattern common to a majority or large part of the populationin the European Union and most of its Member States;
(2) it allows international comparisons (i.e., it should have the same information value in the variouscountries, and not relate specifically to a ‘national’ context);
(3) it allows comparisons over time
(4) it is responsive to changes in the level of living of people.
Obviously, the availability and quality of the data is another important constraint that needs to be takeninto account.
The first criterion relates to the degree of penetration of the item in the society. Townsend (1979) defineddeprivation as the lack of socially-perceived necessities. Ideally, information on social perceptions aboutwhich items are considered as essential by the majority of the population should guide our choice. In theabsence of such information, frequency controls on existing data that inform us about the degree ofpenetration of the items within a given country are taken as an indication of that country's preferences andsocial values.
The second criterion relating to comparability between countries is key to our methodological choices, asit can be applied more or less stringently. It can be argued that comparison of deprivation betweencountries does not require that each item has the same social value in each country. We could evenimagine that different items are chosen in each country, as far as the information value contained globallyin the basket of retained items measures the same thing, as is done in temporal consumer price indices8.However, the use of a harmonised database with a limited set of variables prevents the feasibility of thisapproach. A country-specific weighting applied to the same set of items allows to take into accountspecific national hierarchy between items and specific behaviours or situations (see below).
The question of the temporal adequacy of the choices of the items is an essential one and can be linkedto the fourth criterion as well. It is important to have in mind that the list of material deprivation items willneed to be assessed regularly in order to ensure that they are representative of up-to-date consumptionpatterns in all Member States. On the occasion of the next revision of the EU-SILC regulation, there willbe an opportunity to review some of the target variables and thus to adjust the list of deprivation items.
7 These criteria are a revised version of those proposed in Eurostat (2000). Some of them show clear filiations with the seminalwork on material deprivation of Townsend (1979) and Mack and Lansley (1985).8 This approach is for example followed in INSEE (2005).
- 5 -
What can be learned on material deprivation from the EU-SILC 2004 data?
On the basis of items available in EU-SILC, and applying as far as possible, the criteria explained inthe previous section, a list of items was chosen in order to illustrate material deprivation and poorhousing in EU (see Figure 1).
Once this list of items chosen, a detailed presentation of deprivation shares for each single item couldbe considered as illustrative (see in statistical appendix Table A) but remains too detailed, making ithard to draw a comprehensive picture of deprivation in each country. To simplify the interpretation ofthe information available in the list of items and also to highlight any different patterns of deprivationdeterminants in different countries, it is useful to cluster the items in a limited number of dimensions oflifestyle deprivation. The logic of this approach is that the items should be used as indicative of theirunderlying dimension, more than measures of themselves. The information will therefore beaggregated by dimension, but the aggregation process will be stopped at the dimension level, as theconstruction of one single composite multidimensional indicator would lack transparency andhomogeneity.
To do so, some technical choices have to be made. We can group items together according to the'meaning' of their underlying characteristics on the basis of subjective criteria (for example all housingitems together) or empirically through data analysis. Factor analysis is one technique that can be usedto regroup a wide range of variables into a smaller number of dimensions. However, this technique issometimes criticised (see for example McKay and Collard, 2003) as there is a certain degree ofarbitrariness in the choice of items and the number of factors. Furthermore, as it is data driven,different solutions can be obtained from different samples or from the same sample over time. Despitesuch limitations, factor analysis remains a useful tool for exploring the underlying structure of data andwas widely used, for example in ECHP data.
A first advantage of having access to the results of the new survey (EU-SILC) for 12 EU-15 MemberStates (plus Estonia and Norway) is to check the consistency of the results obtained through factoranalysis between the new survey and the old one (ECHP). This can be done through confirmatory factoranalysis (CFA) on the SILC-2004 data.
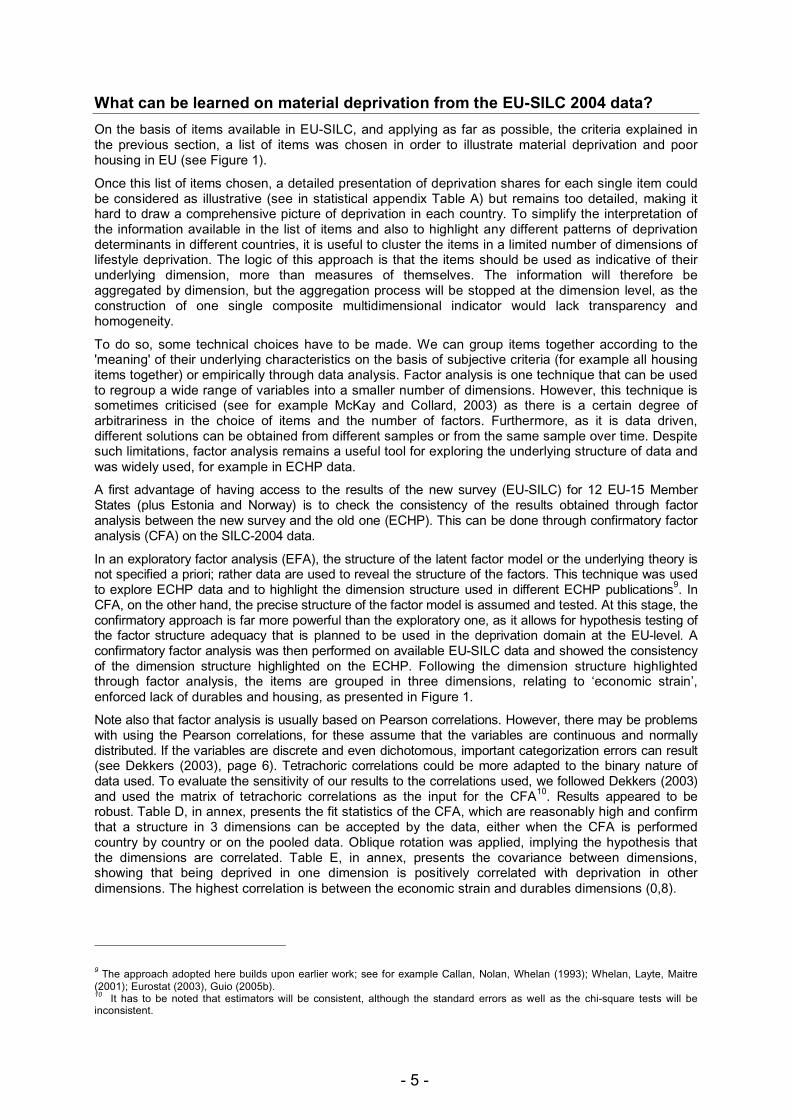
In an exploratory factor analysis (EFA), the structure of the latent factor model or the underlying theory isnot specified a priori; rather data are used to reveal the structure of the factors. This technique was usedto explore ECHP data and to highlight the dimension structure used in different ECHP publications9. InCFA, on the other hand, the precise structure of the factor model is assumed and tested. At this stage, theconfirmatory approach is far more powerful than the exploratory one, as it allows for hypothesis testing ofthe factor structure adequacy that is planned to be used in the deprivation domain at the EU-level. Aconfirmatory factor analysis was then performed on available EU-SILC data and showed the consistencyof the dimension structure highlighted on the ECHP. Following the dimension structure highlightedthrough factor analysis, the items are grouped in three dimensions, relating to ‘economic strain’,enforced lack of durables and housing, as presented in Figure 1.
Note also that factor analysis is usually based on Pearson correlations. However, there may be problemswith using the Pearson correlations, for these assume that the variables are continuous and normallydistributed. If the variables are discrete and even dichotomous, important categorization errors can result(see Dekkers (2003), page 6). Tetrachoric correlations could be more adapted to the binary nature ofdata used. To evaluate the sensitivity of our results to the correlations used, we followed Dekkers (2003)and used the matrix of tetrachoric correlations as the input for the CFA10. Results appeared to berobust. Table D, in annex, presents the fit statistics of the CFA, which are reasonably high and confirmthat a structure in 3 dimensions can be accepted by the data, either when the CFA is performedcountry by country or on the pooled data. Oblique rotation was applied, implying the hypothesis thatthe dimensions are correlated. Table E, in annex, presents the covariance between dimensions,showing that being deprived in one dimension is positively correlated with deprivation in otherdimensions. The highest correlation is between the economic strain and durables dimensions (0,8).
9 The approach adopted here builds upon earlier work; see for example Callan, Nolan, Whelan (1993); Whelan, Layte, Maitre(2001); Eurostat (2003), Guio (2005b).10 It has to be noted that estimators will be consistent, although the standard errors as well as the chi-square tests will beinconsistent.
- 6 -
As also presented in Annex D, information on economic strain and durables could also be combinedwith little loss of information and gain in simplicity11. This solution can not be rejected by the dataanalysis and offers the advantage in an EU context of presenting only two aggregations, one based ona larger set of commodities and activities whose access is linked to the financial strain encountered bythe household, the other depicting the housing conditions (housing comfort and housing facilities).
The two- and three-factors solutions are alternatively used in this document.
Figure 1: dimension structure
Notes: Similar items are not fully identical between the ECHP and EU-SILC. For example, the housing conditions items (Leaking roof or damp walls/floors/foundations or rot in window frames or floor) initially surveyed in three separate questions in the ECHP are now surveyed in a single question. The questions on difficulties of payments are surveyed in 3 questions in EU-SILC instead of 4 in the ECHP. The enforced lack of a telephone takes into account the mobile phone in EU-SILC.
Note that the dimension structure is not directly comparable to the one used in Guio (2005), due to the inclusion of two new EU-SILC variables (Capacity to face unexpected expenses and washing machine).
Could not afford (if wanted to): - One week annual holiday away from home- Arrears (mortgage or rent, utility bills or hire purchase instalments)- Afford a meal with meat, chicken or fish every second day - Afford to keep home adequately warm- Capacity to face unexpected expenses
Enforce d lack of : - Colour TV - Telephone - Personal car - W ashing machine
Characteristics of dwelling: - Leaking roof, damp walls/floors/foundations, or rot in window frames or floor - Accommodation t oo dark - Bath or shower in dwelling - Indoor flushing toilet for sole use of the household
Dimension 1Economic
strain
Dimension 2Durables
Dimension 3Housing
Strain+
Durables
The economic strain dimension focuses mainly on affordability of some aspects of living standards(meal, home warm and holidays). Note specifically that, even if it can be discussed whether theenforced lack of holidays has to be considered as a social necessity in Europe, this item is highlycorrelated with the other constitutive items of the ‘economic strain’ dimension and appears as a goodproxy of financial constraints. The items relating to the affordability to keep the home adequately warmis not perfectly comparable between countries in the 2004 survey. Some countries focused more onthe capacity to keep the home warm instead of the affordability to do so.
For durables, the surveys permit to distinguish between lack of items (due to choice) or enforced lackof items (people would like to possess the items but cannot afford them). Only this latter group wasconsidered as reflecting “deprivation”, in order to exclude lifestyle preferences from the concept ofdeprivation. In doing so, we focus on items whose absence is attributed to limited resources ratherthan differences in taste and constraints such as ill health, location etc. It must however be kept inmind that individuals' expectations as to their material well-being tend to increase with income and todecrease with long term poverty (the so-called “adaptive preferences”) and as a consequence poorpeople may declare not to need the goods they lack more often than wealthier individuals.
11 As proposed in Atkinson, Cantillon, Marlier, Nolan (2005).
- 7 -
Furthermore, people may not want to admit not being able to afford buying certain items. Therefore, itcannot be excluded that psychological phenomena or measurement issues introduce ‘noise’ in themeasure of enforced lack of item. However, when possible, restricting our analysis to the enforcedlack of items appeared crucial to focus on material deprivation. These questions are related to themore general question of choices and preferences. It cannot be excluded that people might choose inpriority a pattern of consumption not considered as essential by the analysis and can not afford the listof items retained12.
Some items available in the surveys are based on subjective information of the respondent. On theone hand, subjective questions can be culturally influenced and require caution in internationalcomparison; and the aforementioned “adaptive preferences” also need to be kept in mind. On theother hand, social exclusion influences and is influenced by the perceptions of people, not only by“objective” rules or external judgement on a person’s situation. Dropping the subjective items, as achoice of principle, might lead to a measure disconnected with the reality as lived and perceived bypeople. This could especially be the case if the list of “concrete” items that we think people should beable to afford is not well adapted to the social preferences of the society and their evolution.
The potential criticisms of including subjective items holds true, to a certain extent, for the majority ofdeprivation items presented in this paper, but the subjective element is probably predominant in somevariable like the subjective assessment of the people own economic situation (as the item related tothe ability “to make ends meet”). It was therefore decided not to use such item, but to test the inclusionof a new EU-SILC variable on the “Capacity of the household to face unexpected required expenses”(as this variable does not depend on the consumption goals, even in case of adaptive preferences, andis only weakly influenced by the psychological state and the cultural background of individuals).From SILC 2005, this variable is based on a harmonised definition, however, the adequate definitioncould not be applied from 2004. Specially, in Estonia, for the first survey year, instead of defining theamount of the unexpected expense as the monthly poverty threshold (1600 kroons), a lower amount(1000 kroons) was chosen as a reference. This therefore underestimates the proportion of peopledeprived in Estonia and will be corrected in next data collections.
A shortage of space item was constructed on the basis of the ratio between the number of people inthe household and the number of rooms in the dwelling. As in the ECHP, the factor analysis showsthat this item is poorly correlated with the other items in the list (and tends to be weakly loaded to theeconomic strain dimension). This item is therefore not included in the set of housing items discussedin this paper but will eventually be included in the next versions of the indicators, as most of theMember States consider this information as a crucial one.
Among deprivation items available in the database, environmental information (like reports ofvandalism, crime or pollution) could have been integrated in the analysis. The factor analysis showedclearly that these items are grouped together in one separate dimension, not mixed with the housingone. However, data analysis revealed no systematic relationship between poverty and these items orbetween other dimensions and the environmental one, as such problems can reflect urban socialproblems that can affect the whole society rather than just the poorest groups.
12 See for example INSEE (2005) and Willitts M. (2006).
- 8 -
1. Some simple results:
On the basis of deprivation proportions (see Table A and B in statistical appendix), we can consider aperson as deprived in each dimension if he/she lacks at least a minimal number of items. Althougharbitrary, this approach permits the computation of deprivation rates in each dimension. This type ofindicator has the advantage of transparency and furthermore takes into account the accumulation ofdeprivations at individual level. Note also that the value of these measures depends on the totalnumber of items taken into account in the dimension. The larger the number of items, the higher theprobability to be deprived.
Table 1 presents the share of the population affected by at least 2 problems in the economic straindimension, lacking at least 1 durable, suffering from at least 2 problems in the combinedstrain/durables dimension and from at least one housing problems13.
Table 1: Share of people affected by material deprivation in each dimension People lacking : AT BE DK EE ES FI FR GR IE IT LU NO PT SE Economic strain (at least 2 out of 5 items) 16 22 11 28 32 18 33 39 16 27 8 10 44 11 Durables (at least 1 out of 4 items) 6 9 10 34 7 10 11 13 11 5 1 6 16 6 Econ. Str. + dur. (at least 2 out of 9 items) 17 24 14 44 33 21 34 42 19 28 9 12 46 13 Housing (at least 1 out of 4 items) 14 23 12 46 29 9 22 24 17 27 20 11 39 9
Source: Eurostat, EU-SILC survey year 2004. Reference population: people aged 0+. Figures are rounded.
The figures presented in Table 1 show large variations across countries in terms of the share ofpeople affected by problems of material deprivation, depending on the dimension:
In the economic strain dimension, around 10% of the population suffers from at least two problems inDenmark, Luxembourg, Norway and Sweden, whereas the share is much higher –40% and over - inPortugal or Greece.
In the durables dimension, the enforced lack affects a smaller proportion of the population ranges from1% in Luxembourg to 34% in Estonia. The deprivation in the durables dimension is mainly influencedby the enforced lack of a car (see Table A in statistical appendix).
In terms of housing deprivation, the proportion of people facing at least one housing problems rangesfrom 9% (FI, SE) to 46% in Estonia; it is 39% in Portugal.
2. Comparison between income poverty and material deprivation
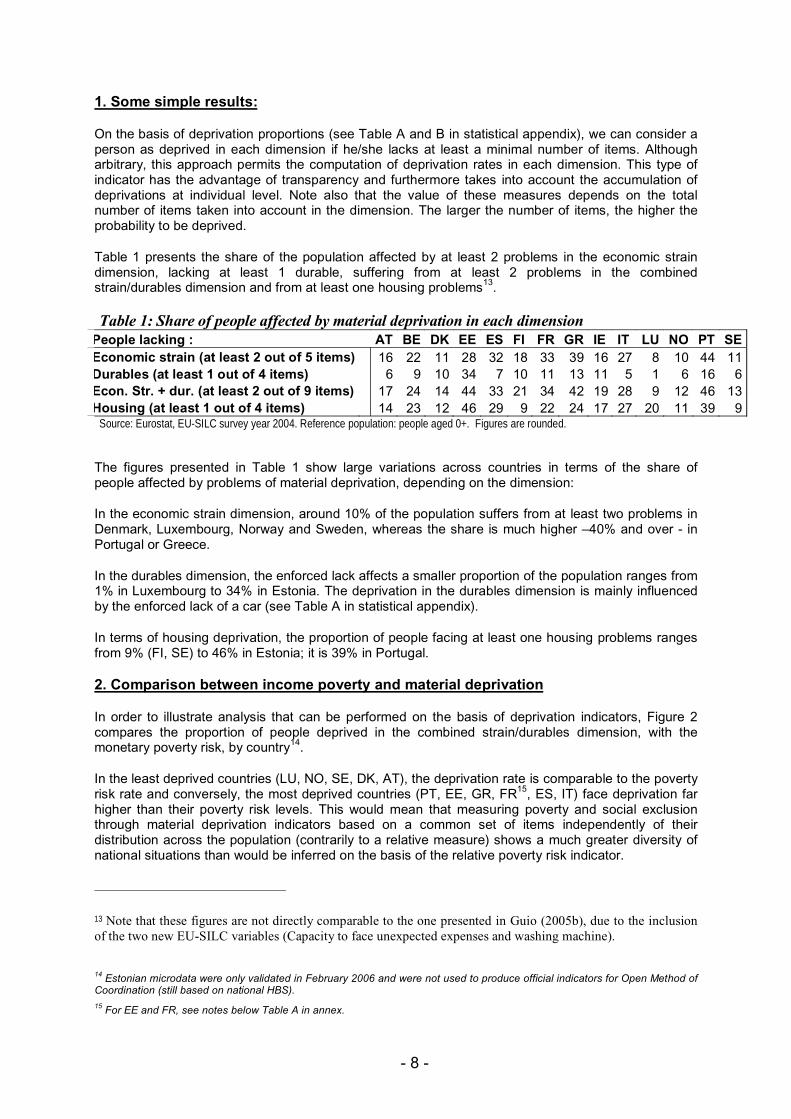
In order to illustrate analysis that can be performed on the basis of deprivation indicators, Figure 2compares the proportion of people deprived in the combined strain/durables dimension, with themonetary poverty risk, by country14.
In the least deprived countries (LU, NO, SE, DK, AT), the deprivation rate is comparable to the povertyrisk rate and conversely, the most deprived countries (PT, EE, GR, FR15, ES, IT) face deprivation farhigher than their poverty risk levels. This would mean that measuring poverty and social exclusionthrough material deprivation indicators based on a common set of items independently of theirdistribution across the population (contrarily to a relative measure) shows a much greater diversity ofnational situations than would be inferred on the basis of the relative poverty risk indicator.
13 Note that these figures are not directly comparable to the one presented in Guio (2005b), due to the inclusionof the two new EU-SILC variables (Capacity to face unexpected expenses and washing machine).
14 Estonian microdata were only validated in February 2006 and were not used to produce official indicators for Open Method ofCoordination (still based on national HBS).15 For EE and FR, see notes below Table A in annex.
- 9 -
In Figure 2, note also the case of Ireland where the deprivation level (this is true for all the dimensions,see Table 1) is lower than could be expected on the basis on the poverty risk rate. This would tend toconfirm that the economic situation in Ireland impacts positively on the material living conditions ofpeople, even if, in relative terms, the income situation of some individuals has not kept up with theoverall rapid growth in the country and is still below the at-risk of poverty threshold.
The countries ranking according to the two approaches also differ for France, Finland and Belgium(where there is more deprivation than monetary poverty).
% of people lacking 2+ items
0
5
10
15
20
25
30
35
40
45
50
LU NO SE DK AT IE FI BE IT ES FR GR EE PT
2+ items poverty
%
Source: Eurostat, EU-SILC survey year 2004. Reference population: people aged 0+.
The overlap between poverty and deprivation can also be deepened through consistent povertymeasures, i.e. by focusing on people facing deprivation and relative income poverty (intersectionapproach). This could help to exclude from the “poor” population those people for whom there aredeprivation or income mis-measurements, people receiving low income but avoiding deprivation orpeople facing deprivation but receiving income above the threshold. Table 2 presents these figures, aswell as the at-risk-of poverty rate of the people considered as ‘deprived’, and the deprivation rate of‘poor’ people (these two figures can be easily deducted by the ratio between the consistent povertyrate and either the poverty rate or the deprivation rate).
Table 2: Proportion of the population ‘poor’, lacking at least 2 items in the strain + durablesdimension, and suffering from both problem, %
AT BE DK EE ES FI FR GR IE IT LU NO PT SEConsistent poverty 5 8 3 13 11 5 9 14 8 11 4 3 14 3Poverty rate among the 'deprived' 31 32 24 30 34 26 27 33 45 40 45 28 32 24Deprivation rate among the 'poor' 41 53 31 67 56 50 69 68 41 59 35 31 69 31
Source: Eurostat, EU-SILC survey year 2004. Reference population: people aged 0+.
The consistent poverty share (consistent poverty in proportion of poverty rate) varies between 30% (inDK, SE, NO) to more than 60% (PT, EE, GR). This means that in the most deprived countries, themajority of the ‘poor’ are also ‘deprived’. However, the opposite is far from being true. A non negligible
Figure 2: % of people lacking at least two items in the economic strain + durables dimension, compared tothe proportion of people at risk of poverty
- 10 -
proportion of the population deprived is not ‘consistently poor’. Indeed, in proportion of the deprivationrate, the consistent poverty share attains around 20-30%, except in Ireland, Luxembourg or Italy (40%or more). In the other New Member States, one can expect that the consistent poverty approachwould also focus on only a limited subset of the population facing deprivation, as the level of relativemonetary poverty is close to the EU average in these countries. However, in the enlarged Union, thefigures show that the deprivation level is far from being comparable between countries, with even the‘poorest’ in ‘rich’ countries facing a lower deprivation level than the ‘richest’ in ‘poor’ countries16.Therefore, restricting the use of a deprivation measure by combining it with a monetary relativecriterion risks to hide the diversity of social and economic development levels among EU25 Countries.It seems therefore preferable, at this stage, to present the monetary and non-monetary measuresseparately.
3. A focus on children: are they more at-risk of deprivation than the total population?
Table 3: Deprivation rate, in each dimension, children and total population
ALL 0-15 ALL 0-15 ALL 0-15 ALL 0-15 ALL 0-15 ALL 0-15 ALL 0-15 ALL 0-15 ALL 0-15 ALL 0-15 ALL 0-15 ALL 0-15 ALL 0-15 ALL 0-15Economic strain
Source: Eurostat, EU-SILC survey year 2004. Reference population: people aged 0+ and aged 0-15.
On the basis of the indicators breakdowns, it can also be evaluated whether deprivation and monetaryrelative poverty offer a similar diagnosis on the relative position of different risk groups. An example isprovided in Table 3 where figures for children and the total population are compared.
On this basis, it seems that the different approaches may offer a different assessment on childrenrelative risk, depending on the country and the dimension (the three dimensions structure is used inorder to eventually highlight different age patterns in the durables and strain dimensions). Significantdifference between children and the total population are coloured (confidence intervals were computedby linearization of the difference between the deprivation/poverty rates by age). The darker colourhighlights differences at the children advantage
In the strain dimension, children are generally more at risk than the total population (except in Greeceand Spain), indicating that the presence of children in the household can increase financialconstraints. Not only have children higher probability of deprivation, but they often also have higherprobability of cumulating these deprivations17.
In the durables dimension, children tend to be equally or even less deprived (EE, FI, GR) than the totalpopulation. In the housing dimension, differences are rarely significant, except in Greece and Portugal(where children face less deprivation than the total population) and in Luxembourg (and to a lesserextent in Denmark and Norway) where the reverse situation is true. This would mean that, despitepotentially higher financial difficulties, households with children try to guard their family againsthousing discomfort and enforced lack of durables.
In terms of comparison of the children relative performance between deprivation and monetaryapproaches, Table 3 also indicates that:
• In Denmark, Finland, Ireland, Sweden and Norway the children are more deprived (at least inthe strain dimension) than the whole population although they were considered as less or
16 This is confirmed by data presented in European Foundation for the Improvement of Living and Working Conditions (2004).17 See for similar conclusions Hussain M.A. (2002).
- 11 -
identically poor. In these countries, the deprivation approach therefore highlights childrenrelative risks, which were not apparent in the relative monetary poverty approach.
• In Luxembourg, the higher risk faced by children is confirmed by the monetary poverty andthe economic strain and housing deprivation.
• In Italy, Belgium, Austria, the gap is significant in the deprivation dimension and in themonetary approach.
• In Portugal, children slightly higher risk than the whole population in the economic strain andpoverty dimension, but face better housing conditions
• In Spain, although children have more probability of being monetarily poor than the wholepopulation, they have slightly less risk of deprivation than the total population.
• In Greece, children face less deprivation risk than the whole population (whatever thedimension), although there are considered as equally poor. Note however that, even if Greekchildren face less risk than the whole population, one third of them live in family with at leasttwo economic strain difficulties, against 13% in Denmark, Luxembourg or Norway.
4. Does each deprivation item have the same importance?
The above figures result from a simple count of the items of deprivation over the population. The mainadvantage of this approach is to facilitate the interpretation of the results and to avoid having to makedecisions about which items are more relevant for measuring individuals' material deprivation.However, this makes the implicit assumption that each item has the same importance in terms ofdeprivation. This can be questioned, which is why the use of weights could be considered.
These weights could be established on the basis of social views on what is more desirable or evennecessary, i.e. goods considered as necessary by a larger proportion of the population should receivegreater weights. However such information is not easy to collect and is not always available insurveys.
An alternative method for constructing weights is to weight each item by a function of the proportion ofpersons who do possess the item in the country18. The idea is that the higher the proportion of peoplewho have the item, the more likely a person not being able to afford the item (but wanting it) will feeldeprived.
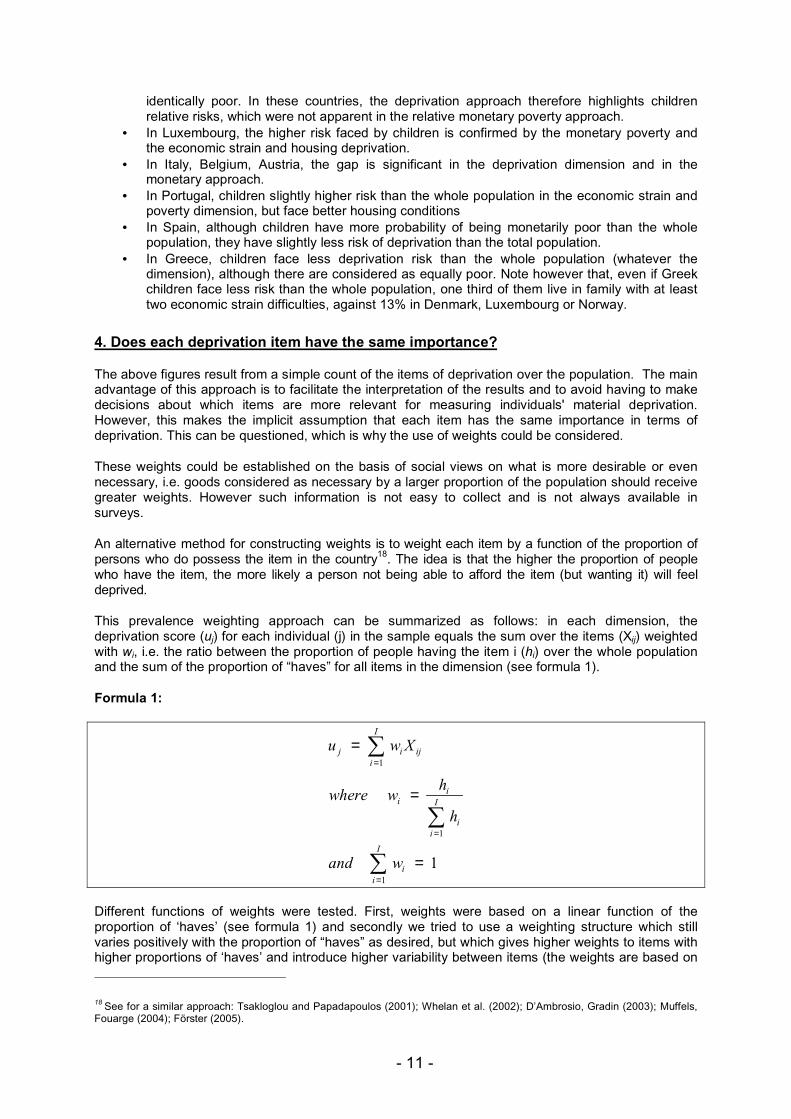
This prevalence weighting approach can be summarized as follows: in each dimension, thedeprivation score (uj) for each individual (j) in the sample equals the sum over the items (Xij) weightedwith wi, i.e. the ratio between the proportion of people having the item i (hi) over the whole populationand the sum of the proportion of “haves” for all items in the dimension (see formula 1).
Formula 1:
∑
∑
∑
=
=
=
=
=
=
I
ii
I
ii
ii
I
iijij
wand
h
hwwhere
Xwu
1
1
1
1
Different functions of weights were tested. First, weights were based on a linear function of theproportion of ‘haves’ (see formula 1) and secondly we tried to use a weighting structure which stillvaries positively with the proportion of “haves” as desired, but which gives higher weights to items withhigher proportions of ‘haves’ and introduce higher variability between items (the weights are based on
18 See for a similar approach: Tsakloglou and Papadapoulos (2001); Whelan et al. (2002); D’Ambrosio, Gradin (2003); Muffels,Fouarge (2004); Förster (2005).
- 12 -
the coefficient of variation of each deprivation item)19. However, as both types of weights gave similarresults, we preferred to use the simplest (non linear) form of weights, which give results more easilyunderstandable.
Like for the indicator of relative monetary poverty, one important question is related to the choice ofthe reference population. We made the hypothesis that, in evaluating their material situation,respondents are influenced most by their perceptions of how they are doing compared to others intheir own country, even if it might be argued that, in the European Union, comparisons would extendbeyond national border lines20. The set of different weights is common to all individuals in the country(see annex F).
The question of weighting or not can also receive a different answer depending on whether we only focuson basic needs or on a larger set of items. It can be easily argued that access to some items has thesame normative value, whatever the country and whatever the proportion of ‘haves’ in the country, if theseitems are considered as essential. For such items, the unweighted approach could be preferable. It couldbe argued, for example, that (most of) the items in the housing dimension are in this case21.
Figure 3 presents the mean indices by country, either weighted or unweighted, for the economic straindimension. Each mean index is constructed as a (simple/weighted) average of the deprivation sharesin the dimension, normalised by one. The mean score can be interpreted as the mean percentage ofdeprivation suffered by people. The nearer the index is to 0, the less deprived people are (onaverage). The figures can be read as follows: in Portugal on average, people miss almost 17 percentof the 9 items of the strain+durables dimension. When we take into account the weights, the averageweighted score indicates that people miss 13 percent of the weighted sum of items in the dimension.
The introduction of weights decreases the national values of the aggregated index for the mostdeprived countries. This is due to the fact that weights give less importance to the most frequentlydeprived items. The highest difference concerns Estonia, Greece and Portugal, where the importanceof the less possessed items (not having a week holiday, not keeping the home adequately warm, theenforced lack of a car) is decreased a lot in the weighted approach, as a majority of people lack theseitems (see Annex F). The weighted approach can therefore modify the ranking order of the countries.
0,00%
2,00%
4,00%
6,00%
8,00%
10,00%
12,00%
14,00%
16,00%
18,00%
20,00%
LU SE NO DK AT IE FI BE ES IT EE FR PT GR
weighted index unweighted index
Figure 3: Mean weighted/unweighted composite index of the economic strain + durablesdimension
Source: Eurostat, EU-SILC survey year 2004. Reference population: people aged 0+. Indexes were normalised to 1.
19 For proportion, the coefficient of variation is the square root of the ratio of proportion of “haves” and the proportion of “havesnot”. See Eurostat (2003) for a similar proposal20 Whelan C, Layte R, Maitre B, Nolan B (2001).21 As suggested for instance by Atkinson, Cantillon, Marlier, Nolan (2005).
- 13 -
If we accept the assumption that expectations about how much an item constitutes a (social/national)“necessity” depends on the extent to which the item is possessed in the country, a weighted approachis the right way to take into account national differences in the hierarchy of items in the enlargedunion. This attenuates the “absolute” aspect of the measures of deprivation used so far, by taking intoaccount the national differences in the relative importance of items. It is however less transparent,more difficult to interpret than an ‘absolute’ un-weighted measure. Both measures could therefore beused jointly and offer useful information on both aspects (“absolute” and relative) of deprivation.
This interpretation is however not as transparent as the information provided by a headcount and isnot easily communicable. This could however be the object of deepened punctual studies.
How can EU-SILC be improved to better measure material deprivation in theEU?
The current list of items in EU-SILC is mainly a (limited) subset of ECHP items22, chosen by nationalstatistician among items considered as better reflecting living conditions in Europe. This limitednumber of items available in SILC is the main constraint hampering the further development ofindicators of material deprivation to be used at EU level. A too small number of items may lead toselecting which part of the deprived population will be monitored, and this selection might impactdifferently on results country by country. In addition, in the context of the EU enlargement, questionson the adequacy of the current list of EU-SILC variables to depict correctly material deprivation in theenlarged Europe are regularly put on the table. Therefore we would ideally need a choice of items foreach dimension that is large enough and captures all key material deprivation situations that we wantto monitor in a comparable way across countries. This selection of items might be partly based on a"reasoned" choice that would clarify the meaning of the dimensions identified through the factoranalysis.
Such a reasoned choice, as opposed to a choice of items based on prevalence, could in particulardraw on
• the in-depth analysis (of the kind presented in the first part of the document) of the EU-SILCresults for all EU Member States(available early 2007),
• a consensus survey run across all EU member States. Such a survey, run through theEurobarometer tool, will inform us on what items are considered by EU citizens as necessitiesin their country (a Eurobarometer survey is planned for the beginning of 2007).
• relevant national expertise, since it is necessary to assess the normative value of items ineach national context. Such expertise could also usefully bring about the views of those EUcitizens that have experienced poverty and/or social exclusion23.
At its 23 October 2006 meeting, the Indicators Sub-Group of the Social Protection Committee (ISG)has validated such an approach and welcomes the Commission's proposal to set up a task forcegathering both members of the Income and Living Conditions Statistics working group and of the ISG.
The Task Force will
• Propose an indicator for the “economic strain + durables” dimension based on the currentlyavailable items before the summer 2007 (for possible inclusion in the next OMC reportingexercise)
22 Only two new items were introduced in the list (the affordability to possess a washing machine and the capacity to faceunexpected expenses).23 The conclusions of the June 2006 Austrian presidency meeting: "Fifth European meeting of people experiencing poverty,Brussels, 12-13 May 2006: 'How do we cope with everyday life?"' could usefully feed into the reflection.
- 14 -
• Test the possibility to build an indicator using the current housing items available and makeconcrete proposals to better exploit the existing SILC information on housing (including dataon housing costs and from the 2007 SILC module that will be available at the end of 2008).
• Propose a reasoned choice of deprivation items that will be tested in the SILC 2009 moduleon material deprivation (a draft list of variables should be ready by the end of 2007).
• Propose indicators based on this choice of items, and ways to regroup them by dimension. Inthat exercise the methodology presented in the first part of the paper could be very useful.
• Finally the Task Force might test the feasibility and impact on comparability of a differentselection of items depending on the country. A common indicator could for instance be basedon a corpus of common items that would identify situations of deprivation across the wholeEU, supplemented by a small number of items specific to each country.
The following issues will be addressed in particular:
1. The need to ensure maximal comparability in survey questions
The first thing that can be done to improve the measurement of material deprivation in SILC is toincrease the comparability of the survey questions across countries. Eurostat is currently reviewing theactual phrasing of the questions used in the national questionnaire to collect the data for the targetvariables and has found divergences that are likely to affect the comparability of the results. Eurostatwill work with MS in the coming months in order to clarify the definitions of the target variables and fixthe main sources of discrepancies affecting comparability.
2. Are current items considered as social necessities by the overall population?
The current choice of items available in SILC is based on experts' knowledge. This choice mightusefully be confronted with information on social perceptions about which items are considered asessential by the majority of the population, i.e. a consensus control. So far, in the absence of suchinformation, frequency controls on existing data that inform us about the degree of penetration of theitems in a country were taken as an indication of social values..In order to assess the current list andtest other items to eventually complement it with items better fit to reflect living patterns which arecustomary or at least widely encouraged in EU Member States, additional information is needed.
One way of collecting this additional information is to run consensus surveys in order to identify whichdeprivation items are actually directly associated with poverty and social exclusion in the perception ofpeople in their country. This approach is in line with the EU definition of social exclusion that definesthe poor and socially excluded as "those with resources (material, cultural and social) that are solimited as to exclude them from the minimum acceptable way of life in the Member States in whichpeople live". In this definition, the standard is set in relation to the perception of the members of agiven society. The reference to a "minimum acceptable way of life" can therefore in practice betranslated into a list of items that are viewed as "necessities" by the society.
To do so, an EU wide Eurobarometer survey on the perception of poverty will be run in January orFebruary 2007. The results will be available during the spring 2007 and analysed. The results will beused to select a number of deprivation items that will be tested in the SILC module 2009, on the basisof which a number of items will be proposed as additional variables in SILC. This will also be theoccasion to fill important gaps in the background knowledge useful for to implement (or possiblyadapt) the methodology presented in previous sections. Indeed, additional questions on whether thesame basket of items has to be considered as social necessities in all EU Member States could alsobe addressed. A common indicator could for instance be based on a corpus of common items thatwould identify situations of deprivation across the whole EU, supplemented by a small number ofitems specific to each country.
The following principles have been applied to the design of the draft Eurobarometer questionnaire.
• The target population is the whole population aged 15 years and over.
- 15 -
• The survey should be designed to understand better what people have in mind when theythink about what are the "necessities of life" with regards to different aspects of every day life.
• It should refer to situations in the reference country, and not about poverty as it can beexperienced in other parts of the world.
• The survey will not cover the most extreme aspects of poverty, such as starvation,homelessness, but rather be restricted to situations that are less obvious.
• The survey should refer to the situation of individuals in the general population, but also coversome child specific items (see point 3 below).
• One of the assets of the material deprivation approach is that it can grasp better the multi-dimensionality of social exclusion. As mentioned above, the definition of poverty adopted bythe EU, as long ago as 1984 is the following: "people are said to be living in poverty if theirincome and resources are so inadequate as to preclude them from having a standard of livingconsidered acceptable in the Society in which they live". Because of their poverty they mayexperience multiple disadvantages through unemployment, low income, poor housing,inadequate health care and barriers to lifelong learning, culture, sport and recreation. They areoften excluded and marginalised from participating in activities (economic, social and cultural)that are the norm for other people and their access to fundamental rights may be restricted.Following this definition, we should aim at covering a broad range of dimensions which can bedescribed as follows: financial stress, poor housing, enforced lack of durables, poorquality food and clothing, exclusion from essential social and leisure activities.
• In an international perspective, we believe that we should leave out items relating to access tosocial services, and in particular access to health services and to education since these aretoo dependant on the way the welfare system is organised.
A copy of the current draft questionnaire that has been sent for consultation and is presented in annexG of the paper.
3. The need for child specific items
For the specific group of children, the use of deprivation indicators was so far exploratory andpermitted to confront monetary results usually used to assess children specific risk with alternativeindicators. One more reason can be advanced to use jointly monetary measures and materialdeprivation indicators for the children group. Indeed, it is well known that the equivalence scale usedto compare income of different household types is not neutral in terms of composition of the poorpopulation and of relative risk of families versus other households. This limitation particularly applies tothe case of children since the use of a standard equivalence scale unevenly reflects the actual relative"cost" of a child within a household across all EU countries. The use of deprivation measures whichare independent on any equivalence scale could give a different view of child poverty.
Finally, studies have highlighted that resources are not necessarily equally shared among members ofa given household. In some families with a tight budget, the redistribution of resources could be infavour of the child, since the parents are trying to alleviate the impact of economic strain on the livingstandard of the child. In other cases, the household income can be unevenly spent on adultconsumption (alcohol, gaming, etc). However, both income and material deprivation measures can nottackle the issues associated with the hypothesis of equal intra household sharing of resources. Bothincome and deprivation items used so far are based on household variables which are assigned toeach household member, as specific items for children are not yet included in the EU-SILC variables.
Even if most of the items already available are relevant for the children group, as they can beconsidered as social necessities, in terms of access to adequate eating, comfortable housing,customary durables etc., it is very important that focused material deprivation measures depictingspecific children conditions of life, which can be different from their parents, are included in the EU-SILC instrument. To do so, the Eurobarometer will include children items.
The Eurobarometer survey can only reflect the views of all adults concerning the situation of children,and probably the views of adults, in particular those adults with children, is relevant to determine whatthe society considers as a necessity for children. However, it cannot take into account of the fact that
- 16 -
children's sense of full participation in society may refer to norms and values that are to a great extentdetermined by peers, e.g. the children themselves. In the Eurobarometer results, it might therefore beworth looking specifically at the results for the lower age groups e.g. 15-21 as a proxy for what wouldbe important for teen-agers.
Finally it is worth noting that some Member States have experience in including children aged 11 ormore in their household survey samples as a way to collect information that are child specific and thatwould be difficult to collect from the parents. The Task Force might learn from these examples.
4. A detailed focus on poor housing: what could we learn from the SILC module 2007
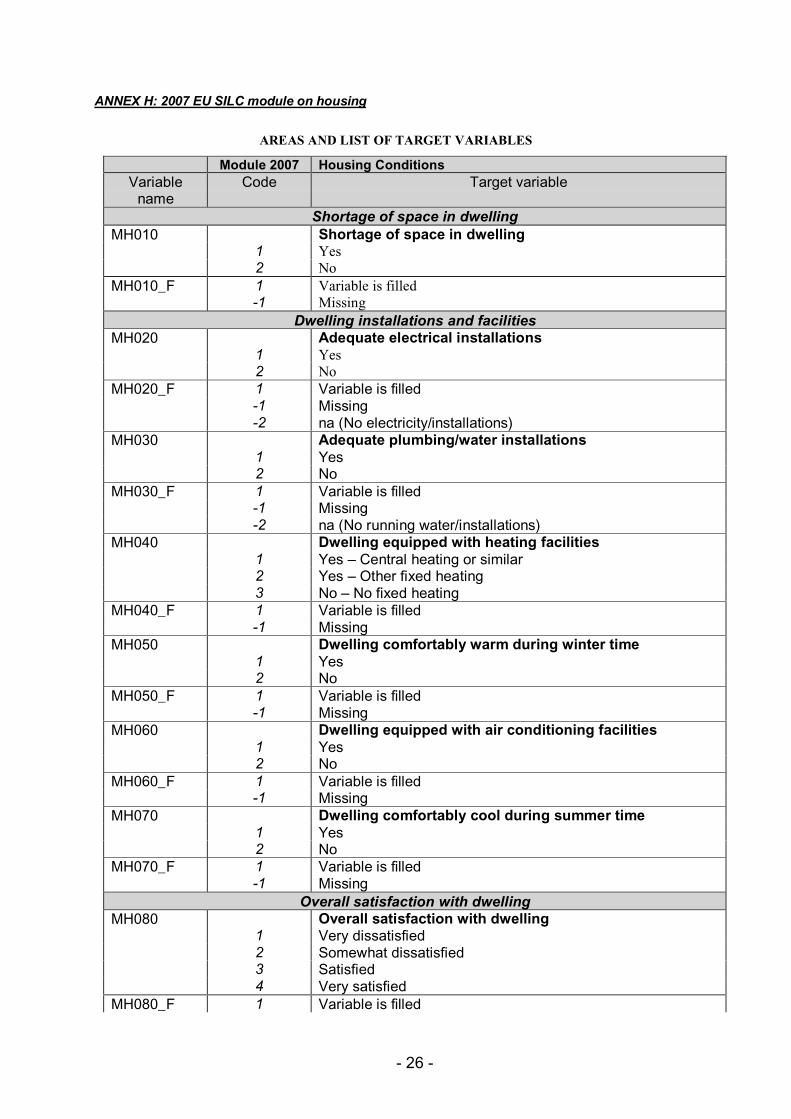
In the context the monitoring of the fight against poverty and social exclusion at EU level, indicatorscovering the housing dimension are still missing even though poor housing has been identified as oneof the key dimension of social exclusion that most usefully complement the picture given by incomepoverty. The 2007 SILC module will provide an insight in housing conditions in Europe. Results will beavailable by the end of 2008 and could be used in the reflection on the choice of items for a possibleindicator of housing deprivation. The areas covered by the module are: self-perceived shortage ofspace, adequacy of main facilities (electricity, water, heating, air conditioning), overall satisfaction withthe dwelling, accessibility of basic services in the local area, and reasons for moving.
5. The need for a regular assessment
Even when the reworked list of items will be included in EU-SILC, it is important to keep in mind thatthis list will need to be assessed regularly in order to ensure that they continue to properly reflectconsumption patterns in all Member States.
Preliminary Conclusions
At EU level, the most frequently used commonly agreed indicators in the field of poverty and socialexclusion are based on a monetary approach to poverty which is relative. Nonetheless, questions areraised concerning the ability of the existing portfolio of indicators to satisfactorily reflect the situation inNew Member States, Acceding and Candidate countries, as well as differences between them and the‘old’ Member states. The approach proposed in this paper aims at complementing the informationsummarised in the current list of indicators, by looking at more “absolute” material deprivationmeasures, in order to give a more complete picture of the living conditions of people in differentnational contexts. But this is not the only reason: even at national level, it is now well recognized thatdifferent approaches to poverty measurement, including the material deprivation one, are useful totake into account the other aspects of poverty.
The first part of the paper discusses the methodological options for the construction of this type ofindicators. Drawing from the existing literature, it illustrates the potential of the new EU-SILCinstrument in this field by using the 2004 harmonised micro-data for thirteen Member states (andNorway). Material deprivation is defined as the enforced lack of a combination of items depictingmaterial living conditions in the EU, such as housing conditions, possession of durables, and capacityto afford basic requirements.
The main methodological questions that are raised in the paper relate to the choice of the constitutiveitems, their eventual regrouping in dimension and the aggregation of the information contained in eachitem in a composite index (weighted or not).
The second part of the paper proposes a short and mid-term approach to improve the materialdeprivation data that can be derived from EU-SILC. The main aims are to improve in the short termthe comparability of the existing items and, ultimately, to dispose of an adequate and reasoned choiceof items on the basis of which comparable indicators of material deprivation could be adopted forpolicy monitoring at EU level.
- 17 -
References
Atkinson A.B., Cantillon B., Marlier E., Nolan B. (2005), Taking forward the EU Social InclusionProcess, Final report, August 2005, http://www.ceps.lu/eu2005_lu/inclusion.
Callan T., Nolan B., Whelan C. (1993), “Resources, deprivation and the measurement of poverty”,Journal Soc. Pol., 22, 2.
D’Ambrosio C., Gradin C (2003) “Income Distribution and social exclusion of children. Evidence fromItaly and Spain in the 1990s”, Journal of comparative family studies, special issue Family and Childreninequalities.
Dekkers G. (2003) “Financial and multidimensional poverty in European Countries: Can the former beused as a proxy of the latter?” CEPS/INSTEAD IRISS Working paper series, N° 2003-13.
European Commission (2004), Joint Report on Social inclusion, Office for Official Publications of theEuropean Communities, Luxembourg.
European Foundation for the Improvement of Living and Working Conditions (2004), Low income anddeprivation in an enlarged Europe.
Eurostat (2000), European Social Statistics: Income Poverty & Social Exclusion (1st Report), KS-29-00-181-EN-C.
Eurostat (2003), European Social Statistics: Income Poverty & Social Exclusion (2nd Report), KS-BP-02-008-EN-C.
Förster M. (2005), "The European union social space Revisited. Comparing poverty in the enlargedEuropean union”, Journal of Comparative Policy Analysis, Vol 7, N°1.
Guio AC. (2005a), “Income poverty and social exclusion in the EU25”, Eurostat, Statistics in Focus.
Guio A-C (2005b) “Material deprivation in the EU”, Eurostat Statistics in Focus, 21/05.
Hoelsher P. (2004), "A thematic study using transnational comparisons to analyse and identify whatcombination of policy responses are most successful in preventing and reducing high levels of childpoverty", European Commission, DG Employment and Social affairs.
Hussain M.A. (2002), “Child deprivation in the European Union”, EPAG Working Paper N° 38.
INSEE (2005), “Les approches de la pauvreté à l’épreuve des comparaisons internationales”,Economie et Statistique, N°383-384-385.
Layte R., Nolan B., Whelan C.T. (2001), "Reassessing Income and Deprivation Approaches to themeasurement of poverty in the Republic of Ireland", The Economic and Social research Institute, Vol32, N°3.
Mac J. and Lansley S. (1985). Poor Britain. Allen and Unwin.
McKay and Collard (2003), “Developing deprivation questions for the family resources survey”,Working paper N°13, December.
Muffels, R.J.A., Fouarge, D.J.A.G. (2004). “The role of European welfare states in explainingresources deprivation”. Social Indicators Research, 68(3).
Townsend P. (1979), Poverty in United Kingdom.
Tsakloglou, P. and Papadapoulos, F. (2001), "Identifying population groups at high risk of socialexclusion: evidence from the ECHP" in Muffels and Tsakloglou Social exclusion in European Welfarestates: an empirical study of labour market integration and social exclusion in panel perspective,Edward Edgar, Cheltenham.
Wen-Hao C. and Corak M. (2005), “Child poverty and changes in child poverty in rich countries since1990), Innocenti Working paper 2005-02, Unicef Innocenti research Centre.
Whelan C.T., Layte, R., Maître, B., Nolan, N. (2001), “Income, deprivation and economic strain: ananalysis of the European Community Panel”, European Sociological review, 17(4).
Whelan C.T., Layte R, Maître B. (2002), “Multiple deprivation and persistent poverty in the EuropeanUnion”, Journal of European Social Policy, Vol.12, N°2.
- 18 -
Willitts M. (2006) “Measuring child poverty using material deprivation : Possible approaches”,Depatment for Work and Pensions, London, Working paper, n° 28, February, 70 p.
- 19 -
Statistical annex
Annex A: proportion of people deprived, for each item, total population
Percentage of individuals deprived AT BE DK EE ES FI FR GR IE IT LU NO PT SE
Economic strain
HAS THE HOUSEHOLD BEEN UNABLE :TO PAY SCHEDULED RENT, UTILITY BILLS OR HIRE PURCHASE INSTALMENTS? 3% 7% 5% 15% 7% 12% 13% 30% 9% 13% 5% 12% 8% 10%
WHO CANNOT THE HOUSEHOLD AFFORD:PAYING FOR A WEEK'S ANNUAL HOLIDAY AWAY FROM HOME? 25% 29% 9% 71% 44% 20% 33% 47% 23% 39% 12% 9% 61% 14%
KEEPING ITS HOME ADEQUATELY WARM? 2% 6% 10% 5% 9% 3% 24% 17% 3% 11% 1% 2% 41% 1%
EATING MEAT, CHICKEN OR FISH EVERY SECOND DAY, IF WANTED? 9% 4% 2% 16% 2% 4% 8% 8% 4% 7% 2% 3% 4% 3%
CAPACITY TO FACE UNEXPECTED EXPENSES 20% 28% 18% 8% 38% 25% 34% 35% 21% 27% 13% 21% 20% 13%
Notes: In France, the variable measuring the affordability to keep the home adequately warm is not comparable with the other EUcountries as it focus on the capacity to keep the house warm instead on the affordability (this overestimates the deprivation rate inFrance). In Estonia, the variable about the capacity to face unexpected expenses could not be surveyed in 2004 according to theharmonised definition (defining the amount of the unexpected expense as the monthly poverty threshold). A lower amount (1000 insteadof 1600 kroons) was chosen as a reference, this underestimates the proportion of people deprived.
- 20 -
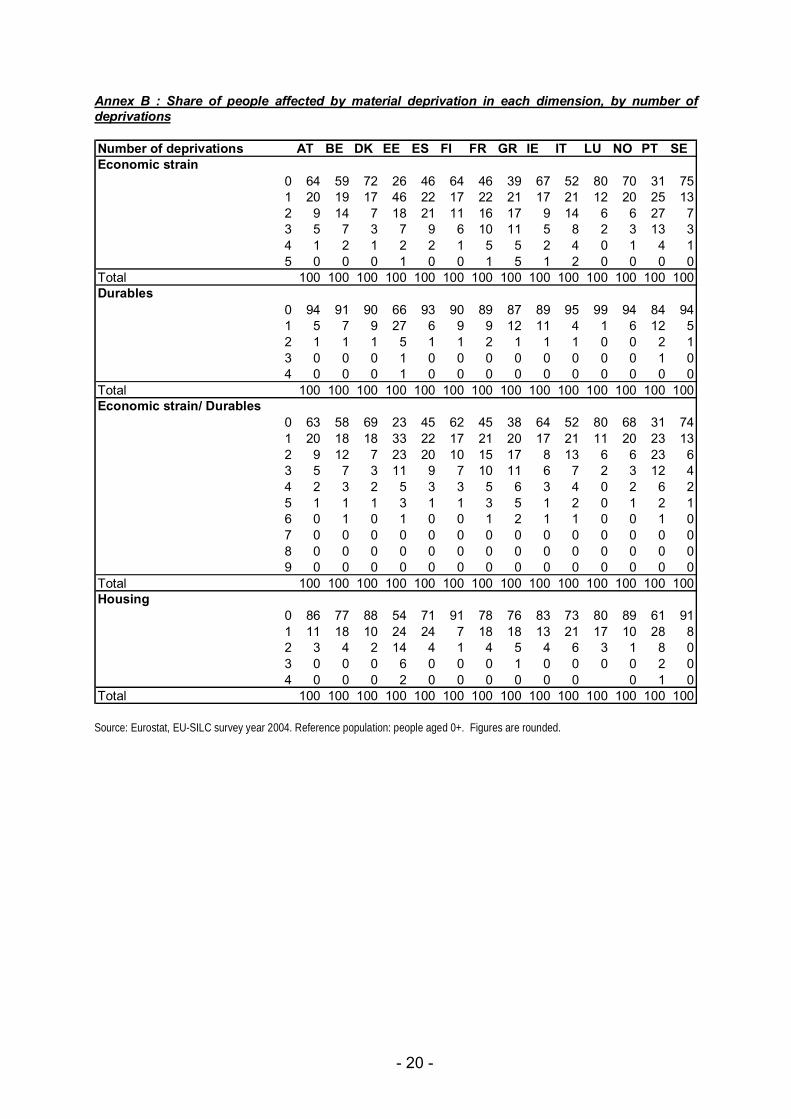
Annex B : Share of people affected by material deprivation in each dimension, by number ofdeprivations
Number of deprivations AT BE DK EE ES FI FR GR IE IT LU NO PT SEEconomic strain
Source: Eurostat, EU-SILC survey year 2004. Reference population: people aged 0+. Figures are rounded.
- 21 -
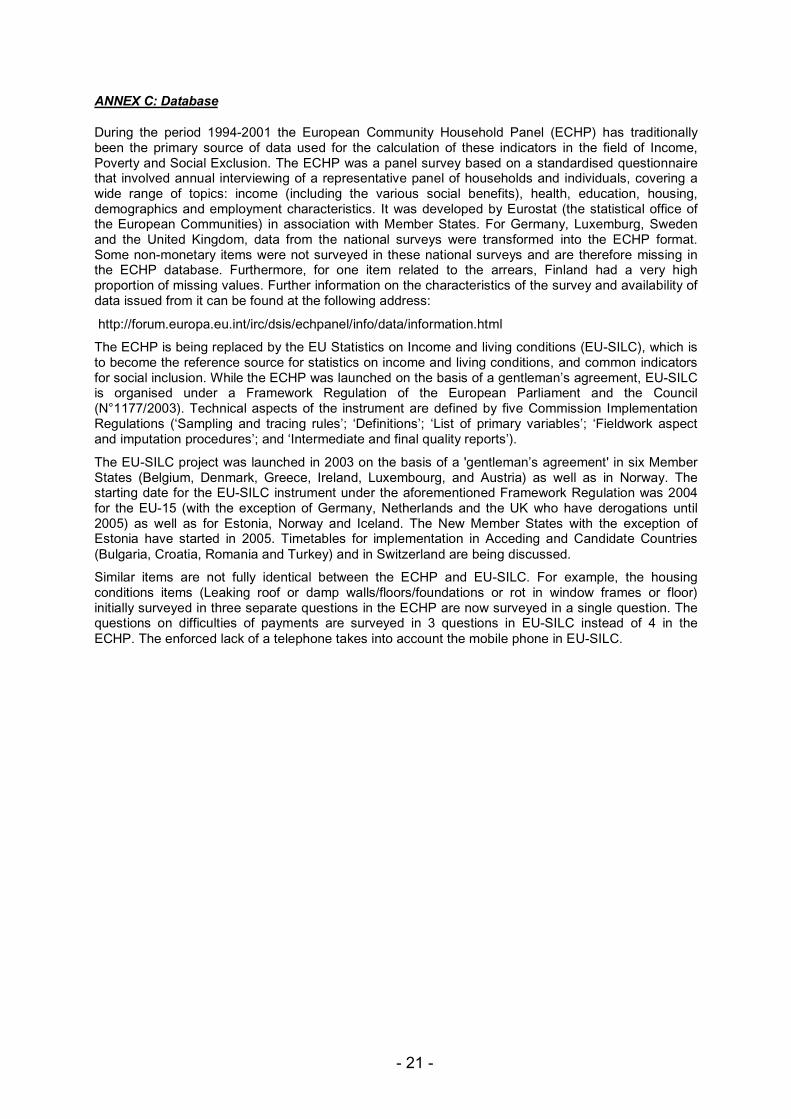
ANNEX C: Database
During the period 1994-2001 the European Community Household Panel (ECHP) has traditionallybeen the primary source of data used for the calculation of these indicators in the field of Income,Poverty and Social Exclusion. The ECHP was a panel survey based on a standardised questionnairethat involved annual interviewing of a representative panel of households and individuals, covering awide range of topics: income (including the various social benefits), health, education, housing,demographics and employment characteristics. It was developed by Eurostat (the statistical office ofthe European Communities) in association with Member States. For Germany, Luxemburg, Swedenand the United Kingdom, data from the national surveys were transformed into the ECHP format.Some non-monetary items were not surveyed in these national surveys and are therefore missing inthe ECHP database. Furthermore, for one item related to the arrears, Finland had a very highproportion of missing values. Further information on the characteristics of the survey and availability ofdata issued from it can be found at the following address:
The ECHP is being replaced by the EU Statistics on Income and living conditions (EU-SILC), which isto become the reference source for statistics on income and living conditions, and common indicatorsfor social inclusion. While the ECHP was launched on the basis of a gentleman’s agreement, EU-SILCis organised under a Framework Regulation of the European Parliament and the Council(N°1177/2003). Technical aspects of the instrument are defined by five Commission ImplementationRegulations (‘Sampling and tracing rules’; ‘Definitions’; ‘List of primary variables’; ‘Fieldwork aspectand imputation procedures’; and ‘Intermediate and final quality reports’).
The EU-SILC project was launched in 2003 on the basis of a 'gentleman’s agreement' in six MemberStates (Belgium, Denmark, Greece, Ireland, Luxembourg, and Austria) as well as in Norway. Thestarting date for the EU-SILC instrument under the aforementioned Framework Regulation was 2004for the EU-15 (with the exception of Germany, Netherlands and the UK who have derogations until2005) as well as for Estonia, Norway and Iceland. The New Member States with the exception ofEstonia have started in 2005. Timetables for implementation in Acceding and Candidate Countries(Bulgaria, Croatia, Romania and Turkey) and in Switzerland are being discussed.
Similar items are not fully identical between the ECHP and EU-SILC. For example, the housingconditions items (Leaking roof or damp walls/floors/foundations or rot in window frames or floor)initially surveyed in three separate questions in the ECHP are now surveyed in a single question. Thequestions on difficulties of payments are surveyed in 3 questions in EU-SILC instead of 4 in theECHP. The enforced lack of a telephone takes into account the mobile phone in EU-SILC.
- 22 -
ANNEX D: fit of the confirmatory factor analysis, pooled data24
Goodness of Fit Index (GFI) 0.9787
GFI Adjusted for Degrees of Freedom (AGFI) 0.9688
Root Mean Square Residual (RMRS) 0.0669
Parsimonious GFI (Mulaik, 1989) 0.7780
GFI, goodness of fit index, represents the amount of variances and covariances in thesample covariance matrix that are predicted by the model. Theoretically, its maximal value is1. However, as GFI is affected by the sample size and the number of indicators, its upperbound can be lower than one, even in the case of perfect fit. One rule of thumb is that the GFIfor good fitting model should be greater than 0.9.
AGFI, adjusted goodness of fit index, is the GFI adjusted for degrees of freedom. A valuesuperior of 0.8 is more often used as a cut-off value to consider the model as good fitting.
RMSR, root mean square residual, is the square root of the average of the square of theresiduals between the sample and modelised covariance matrix. The less is the fit betweenthe model and the data, the larger the RMSR.
PGFI, Parsimonious goodness of fit index, is a modification of the GFI that takes theparsimony of the model into account.
ANNEX E: Covariance between factors, pooled data
Economic strain Durables Housing
Economic strain 1 0,82 0,51
Durables 0,82 1 0,68
Housing 0,51 0,68 1
ANNEX F: value of the weights, by dimension and by country
Unweighted AT BE DK EE ES FI FR GR IE IT LU NO PT SEEconomic strainSCHEDULED RENT, UTILITY BILLS OR HIRE PURCHASE INSTALMENTS 0,200 0,220 0,218 0,208 0,222 0,232 0,201 0,225 0,193 0,206 0,216 0,203 0,194 0,251 0,197PAYING FOR A WEEK'S ANNUAL HOLIDAY AWAY FROM HOME? 0,200 0,170 0,168 0,200 0,074 0,141 0,184 0,172 0,146 0,176 0,152 0,189 0,200 0,106 0,187KEEPING ITS HOME ADEQUATELY WARM? 0,200 0,223 0,220 0,197 0,247 0,227 0,222 0,197 0,230 0,220 0,221 0,212 0,217 0,162 0,215EATING MEAT, CHICKEN OR FISH EVERY SECOND DAY, IF WANTED? 0,200 0,206 0,225 0,215 0,217 0,245 0,221 0,237 0,253 0,219 0,230 0,209 0,214 0,261 0,211CAPACITY TO FACE UNEXPECTED EXPENSES 0,200 0,181 0,168 0,180 0,240 0,155 0,173 0,169 0,178 0,179 0,182 0,187 0,175 0,219 0,189DurablesCOLOUR TV 0,250 0,257 0,262 0,271 0,292 0,263 0,258 0,290 0,267 0,261 0,260 0,255 0,257 0,271 0,273A TELEPHONE 0,250 0,261 0,264 0,278 0,280 0,257 0,265 0,293 0,266 0,262 0,249 0,256 0,262 0,258 0,276A CAR OR VAN (FOR PRIVATE USE) 0,250 0,226 0,224 0,219 0,166 0,218 0,224 0,261 0,209 0,221 0,230 0,238 0,224 0,212 0,236WASHING MACHINE 0,250 0,256 0,250 0,233 0,262 0,262 0,254 0,156 0,259 0,256 0,261 0,251 0,256 0,259 0,214HousingINDOOR FLUSHING TOILET ? 0,250 0,257 0,265 0,257 0,252 0,272 0,255 0,265 0,262 0,262 0,272 0,265 0,257 0,277 0,256BATH OR SHOWER ? 0,250 0,259 0,265 0,256 0,246 0,272 0,253 0,265 0,266 0,261 0,271 0,264 0,258 0,276 0,255ACCOMODATION TOO DARK 0,250 0,248 0,238 0,250 0,283 0,237 0,248 0,243 0,253 0,248 0,247 0,248 0,248 0,226 0,248LEAKY ROOF, ROT IN WINDOW FRAMES, DAMP WALLS, ETC. ? 0,250 0,236 0,232 0,237 0,219 0,219 0,245 0,227 0,218 0,228 0,210 0,224 0,238 0,221 0,242
Note: The weights are normalised to 1 over items in each dimension.
24 Following Knol and Berger (1991) quoted by Dekkers (2003), the optimisation process suggested in the case of tetratchoriccorrelations is the unweighted least square (ULS). The Fit of the confirmatory analysis performed country by country is availableon demand.
- 23 -
Source: Eurostat, EU-SILC survey year 2004
ANNEX G: Draft Eurobarometer questionnaire on material deprivation
Proposed drafting of the main question:
A. For each of the following living standards listed below I would like you to indicate whether(A) this item is necessary, all adults should be able to afford and which they should not haveto do without(B) this item may be desirable but is not necessary
List of items
a. Financial stress
Level ofrelevance
(high/low /NR:not relevant)
A To be able to pay mortgage or rent payments regularly (SILC)B To be able to pay utility bills (electricity, water, gas) regularly (SILC)C To be able to pay arrears on hire purchase instalments or other loan
payments (non housing-related debts) regularly (SILC)D Capacity to afford a meal with meat, chicken, fish (or vegetarian
equivalent) every second day (SILC)E Capacity to face unexpected financial expenses (SILC)F Capacity to make regular savings, even if small amountsG Capacity to make ends meet (SILC)H Capacity to pay for all mandatory insuranceI
b. Poor housing, and environment
Level ofpriority
(high/low /NR:not relevant)
A To afford a dwelling that is not too dark, with enough light (SILC)B To afford a dwelling without too much noise from neighbours or noise
from the street (traffic, business, factories, etc.) (SILC)C To afford a dwelling without too much pollution, grime or other
environmental problems in area caused by traffic or industry (SILC)D To afford a dwelling without crime, violence or vandalism in the area
(SILC)E To afford a dwelling without a leaking roof, damp
walls/floors/foundation, or rot in window frames or floor (SILC)F Affordability to keep home adequately warm (SILC)G Bath or shower in dwelling (SILC)H Indoor flushing toilet for sole use of household (SILC)I Afford to maintain/repair dwelling when paint goes of the walls and/or
there are cracks in the wallsJ Enough space to have children above 5 sleeping in a separate room
from the parentsK Enough space and privacy to read or write, or..L Hot waterM Public space and equipment (street lights, roads, road signs, bus
stops) are not (well) maintainedN Enough space to invite friends or family for a drink or a meal at home
at least once a month
- 24 -
O
c. Enforced lack of durables,
Level ofpriority
(high/low /NR:not relevant)
A A telephone (SILC)B To afford paying for the basic telephone feeC Colour TV (SILC)D To afford paying for the basic feeE A computer (SILC)F To afford paying for the internet connectionG Washing machine (SILC)H A car (SILC)I To afford paying for the car insuranceJ A refrigeratorK To repair or replace major electrical goods such as refrigerator, or
washing machine, when brokenL Furniture in good conditionM To replace worn out furnitureN A cooker adapted to the size of the familyO Bed and bedding for everyone in the familyP
d. poor quality food and clothing,
Level ofpriority
(high/low /NR:not relevant)
A A warm coat for the winterB 2 pairs of all weather shoes (suited to climate)C Some new, not second hand, clothesD Appropriate clothes for job interviews or other special occasionsE Some clothes that are fashionableF A meal with meat, chicken, fish (or vegetarian equivalent) at least
once every 2 daysG Fresh fruits and vegetables once a dayH Go to the hair dresser regularlyI
e. Exclusion from essential social and leisure activities
Level ofpriority
(high/low /NR:not relevant)
A Paying for one week annual holiday away from home (SILC)B Buying presents for family or friends at least once a yearC Enough money to keep home decoratedD An evening out once a month (restaurant, cinema, disco, concert,
etc.)E Capacity to afford own home (owned or rented) past 30 yearsF Inviting people for diner at home once a monthG A hobby or leisure activity
- 25 -
f. Children specific items
Level ofpriority
(high/low /NR:not relevant)
A A family holiday away from home for at least one week a yearB Enough space and privacy to study or do homeworkC Basic leisure equipment (e.g. bicycle)D Educational games and books at homeE 3 meals a dayF Inviting friends at homeG Celebrations on special occasions (birthday, Xmas or other religiousH Fresh fruits and vegetables once a dayI A meal with meat, chicken, fish (or vegetarian equivalent) at least
once a dayJ An outdoor space where they can play safelyK New properly fitted shoesL Some new, not second hand clothesM Participating regularly in a leisure activityN Participating in school tripsO A bed and bedding for her/himselfP
- 26 -
ANNEX H: 2007 EU SILC module on housing
AREAS AND LIST OF TARGET VARIABLES
Module 2007 Housing ConditionsVariable
nameCode Target variable
Shortage of space in dwellingMH010 Shortage of space in dwelling
1 Yes2 No
MH010_F 1 Variable is filled-1 Missing
Dwelling installations and facilitiesMH020 Adequate electrical installations
1 Yes2 No
MH020_F 1 Variable is filled-1 Missing-2 na (No electricity/installations)
MH030 Adequate plumbing/water installations1 Yes2 No
MH030_F 1 Variable is filled-1 Missing-2 na (No running water/installations)
MH040 Dwelling equipped with heating facilities1 Yes – Central heating or similar2 Yes – Other fixed heating3 No – No fixed heating
MH040_F 1 Variable is filled-1 Missing
MH050 Dwelling comfortably warm during winter time1 Yes2 No
MH050_F 1 Variable is filled-1 Missing
MH060 Dwelling equipped with air conditioning facilities1 Yes2 No
MH060_F 1 Variable is filled-1 Missing
MH070 Dwelling comfortably cool during summer time1 Yes2 No
MH070_F 1 Variable is filled-1 Missing
Overall satisfaction with dwellingMH080 Overall satisfaction with dwelling
1 Very dissatisfied2 Somewhat dissatisfied3 Satisfied4 Very satisfied
MH080_F 1 Variable is filled
- 27 -
-1 MissingAccessibility of Basic Services
MH090 Accessibility of grocery services1 With great difficulty2 With some difficulty3 Easily4 Very easily
MH090_F 1 Variable is filled-1 Missing-2 na (Not used by household)
MH100 Accessibility of banking services1 With great difficulty2 With some difficulty3 Easily4 Very easily
MH100_F 1 Variable is filled-1 Missing-2 na (Not used by household)
MH110 Accessibility of postal services1 With great difficulty2 With some difficulty3 Easily4 Very easily
MH110_F 1 Variable is filled-1 Missing-2 na (Not used by household)
MH120 Accessibility of public transport1 With great difficulty2 With some difficulty3 Easily4 Very easily
MH120_F 1 Variable is filled-1 Missing-2 na (Not used by household)
Variablename
Code Target variable
Accessibility of basic servicesMH130 Accessibility of primary heath care services
1 With great difficulty2 With some difficulty3 Easily4 Very easily
MH130_F 1 Variable is filled-1 Missing-2 na (Not used by household)
MH140 Accessibility of compulsory school1 With great difficulty2 With some difficulty3 Easily4 Very easily
MH140_F 1 Variable is filled-1 Missing
- 28 -
-2 na (No child in compulsory school)Change of dwelling
MH150 Change of dwelling1 Yes2 No
MH150_F 1 Variable is filled-1 Missing
MH160 Main reason for change of dwelling1 Family related reasons2 Employment related reasons3 Housing related reasons4 Eviction/distrain5 Landlord did not prolong the contract6 Financial reasons7 Other
MH160_F 1 Variable is filled-1 Missing-2 na (MH150 not = 1)