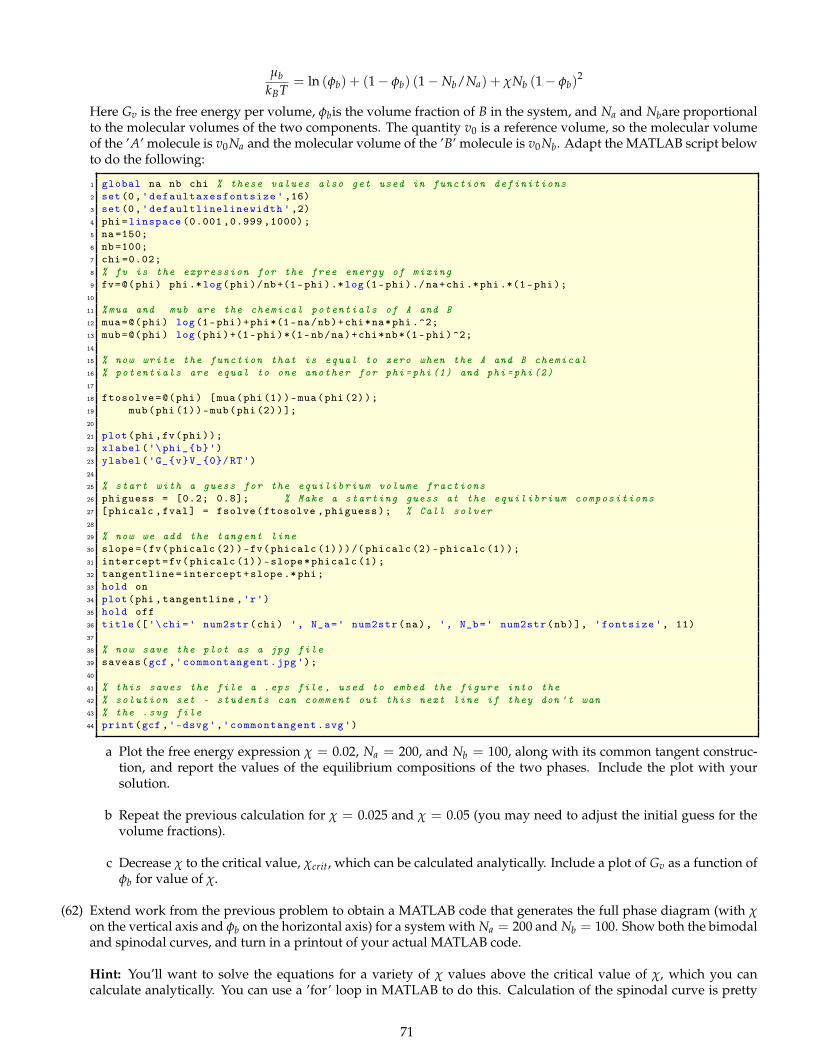
1. (2014) For each of the following thermodynamic systems, indicate the number of components, the number ofphases, and whether the system is open or closed.
(a) An open jar of water at room temperature (assume that the jar defines the boundaries of the system). Assumethat the water molecules do not dissociate.
(b) A sealed jar of water at room temperature.(c) A sealed jar of water with ice.(d) An open jar of water with NaCl entirely dissolved within.(e) If the jar is left open, in what ways might your description change?(f) How would your answer to (a) change if you take into account equilibrium between water, protons, and
hydroxyl ions?Intensive and Extensive Properties
2. (2014) Classify the following thermodynamic properties are intensive or extensive:(a) The mass of an iron magnet.(b) The mass density of an iron magnet.(c) The concentration of phosphorous atoms in a piece of doped silicon.(d) The volume of the piece of silicon.(e) The fraction by weight of copper in a penny.(f) The temperature of the penny in your pocket.(g) The volume of gas in a hot air balloon.
Differential Quantities and State Functions3. (2014) Consider the function z = 6x2y3 cos2 u.
(a) Write down the total differential of z. Identify the coefficients of the three differentials in this expression aspartial derivatives.
(b) Demonstrate that three Maxwell relations (see section 2.3) hold between the coefficients identified under (a).4. (2014) Why are state functions so useful in calculating the changes in a thermodynamic system?5. (2014) Derive equation 4.41 starting from 4.34 and 4.31. Note that other equations listed in table 4.5 can be derived
in a similar fashion.Entropy
6. (2015) Following Section 3.6, compute the change in entropy in the formation of one mole of SiO2 from Si and O atroom temperature.
7. (2015) Consider an isolated system consisting of three compartments A, B, and C. Each compartment has the samevolume V, and they are separated by partitions that have about. Initially, the valves are closed and volume A isfilled with an ideal gas to a pressure P0 at 298 K. Volumes B and C are under vacuum.
(a) Calculate the change in entropy when the valve between compartment A and B is opened.(b) Calculate the change in entropy when the valve between compartment B and compartment C is opened.(c) Without considering the calculations above, how would you know that the overall change in entropy is posi-
tive?(d) What would you need to do to the system to restore the initial condition?
Thermodynamic Data8. (2015) This problem requires you to find sources to look up the values of important materials parameters that will
be used to compute thermodynamic functions.(a) Find values of the coefficient of thermal expansion for a metal, a semiconductor, an insulator, and a polymer.
Provide the information below in your answer.
Material Type Specific Material α Source (include page or link info)Elemental Metal e.g. GoldSemiconductor
InsulatorPolymer
(b) What is a common material with a negative α?(c) How is the coefficient of compressibility related to the bulk modulus?(d) Which metal has the highest bulk modulus at room temperature, and what is the value?(e) The heat capacity is an extensive quantity. Define the related intensive quantity.(f) What trend do you observe in elemental solids?
3
(g) What is the smallest value you can find for a solid material? (Explain your search method, and cite yoursources.)
9. (2014) The density of silicon carbide at 298 K and 1 atm is ~3.2 g/cm3. Estimate the molar volume at 800 K and apressure of 1000 atm. See tables 4.1 and 4.2 on page 61 of DeHoff for useful materials parameters.
10. (2015) The density of aluminum at 298 K and 1 atm (or “bar”) is 2.7 g/cm3. Estimate the molar volume at 1000K and a pressure of 1000 atm. See tables 4.1 and 4.2 on page 61 of DeHoff, and Appendix B, for useful materialsparameters. Hint: break the problem into two steps, each corresponding to a path.
11. (2015) Use the car mileage dataset provided to do the following:(h) Create a second order polynomial fit to determine the coefficients for the mileage dataset online. Use the
systems of equations we developed during discussion to help you solve for the coefficients. Write your poly-nomial coefficients down in your submitted assignment.
(i) Using your curve of best fit, determine the optimal speed for driving that maximizes your mileage.(j) Identify an obvious failure of your model and comment on it below.
12. (2015) Answer the following questions using the heat capacity dataset and the following model:
Cp = a + bT + c/T2 + dT2
(k) Use the system of equations derived in class to determine the coefficients a, b, c, d.(l) Give a possible Gibbs free energy function for bulk silicon using your heat capacity fit. The Gibbs free energy
is related to the heat capacity through the following equation:
Cp = −T(
∂2G∂T2
)P
13. (2015) Compare the change in entropy for the specific examples below of isothermal compression and isobaricheating of gases and solids.(m) One mole of nitrogen (N2) at 1000 K is compressed isothermally from 1 to 105 bar.(n) One mole of silicon at 300 K is compressed isothermally from 1 to 105 bar.(o) One mole of oxygen (O2) at 300 K is heated isobarically from 300 to 1200 K.(p) One mole of tungsten at 300 K is heated isobarically from 300 to 1200 K.
14. (2015) For each of the following processes carried out on one mole of a monatomic ideal gas, calculate the workdone by the gas, the heat absorbed by the gas, and the changes in internal energy, enthalpy, and entropy (of thegas). The processes are carried out in the specified order.(q) Free expansion into the vacuum to twice the volume, starting from 300 K and 4 bar. Then,(r) Heating to 600 K reversibly with the volume held constant. Then,(s) Reversible expansion at constant temperature to twice the volume of the previous state. Then,(t) Reversible cooling to 300 K at constant pressure.
15. (2015) Consider one mole of a monatomic ideal gas that undergoes a reversible expansion one of two ways.(u) Under isobaric conditions, the gas absorbs 5000 J of heat in the entropy of the gas increases by 12.0 J/K. What
are the initial and final temperatures of the gas?(v) Under isothermal conditions, 1600 J of work is performed, resulting in an entropy increase of 5.76 J/K and a
doubling of the volume. At what temperature was this expansion performed?16. (2015) In class we learned that the change in entropy of a material with temperature is given by:
S2 − S1 =∫ T2
T1
Cp (T)T
dT (1.1)
In a prior homework, we fit the heat capacity to a polynomial, which we could then integrate. Now, we willnumerically integrate the data points using the Trapezoid Rule discussed in class:∫ T2
T1
f (x) ≈ (T2 − T1)
[f (T1 + f (T2))
2
](1.2)
where the function f (T) in our case is the right hand side of Equation , is simply the right hand side of Equation1.1. Do this by creating a “FOR” loop in MATLAB that sums up all the trapezoids in the temperature range. Emailyour MATLAB script to the TA by the due date.(w) What is the difference in entropy at 300 K and 1300 K?(x) Previously, we determined that the heat capacity is given by:
Cp = 22.83 + 3.826x10⁻³T − 3.533x10⁵
T2 + 2.131x10⁻⁸T2 (1.3)
Use Equation 1.1 to analytically solve for the change in entropy using Equation 1.3. Which method do you think ismore accurate? Explain your reasoning.
4
Temperature Equilibration17. (2015) 100 g of ice at 250 K is added to 100 g of water at 300 K, and the mixture is allowed to come to equilibrium
in an isolated container at constant pressure. You may assume that Cp is constant for this problem (though it is notthe same for water and ice) and that the melting point is 273 K.
(a) What is the final temperature?(b) How much liquid is present?(c) How would your answer change if the initial liquid was 40% ethanol?
18. (2015) A square block of Al, initially at a uniform temperature of 300 K, is brought into contact with another blockof aluminum, initially at a uniform temperature of 600K. Both blocks are of equal mass, and they are isolated atconstant pressure while they come to equilibrium. The questions below assume equilibrium has been reached.(d) What do you know about the final temperatures of the Al blocks?(e) Will the final temperature(s) be 450 K? Justify your answer.(f) Find the final temperature.
Statistical Thermodynamics19. (2015) DeHoff 6.3: Consider a system of two particles (A and B) that may each occupy any of the four energy levels
(ε1, ε2, ε3, ε4).(a) How many distinct microstates are there for this system?(b) List each of the microstates and indicate which microstates have the same energy.(c) How many macrostates are there?(d) List the most probable macrostates.
20. (2015) DeHoff 6.5 Variant: Consider the system consisting of 9 identical but distinguishable particles, each of whichcan be in any of three states. The respective energy levels of the states are ε0 = 0, ε1 = ε, ε2 = 2ε. The system has atemperature T.
(e) Write the partition function for a single particle.(f) Calculate the average number of particles in each state.(g) Determine the number of configurations that have the following occupation numbers for the three states:
n0 = 4, n1 = 3, n2 = 2.(h) Calculate the entropy of the macrostate described by the occupation numbers above.(i) Calculate the internal energy.(j) Choose a different set of occupation numbers to give the same internal energy (e.g. (3,5,1)) and repeat your
calculation of the entropy. Which macrostate is more likely?21. (2015) DeHoff 6.7 variant: A System containing 500 particles and 15 energy levels is in the following macrostate:
14, 18, 27, 38, 51, 78, 67, 54, 32, 27, 23, 20, 19, 17, 15. Estimate the change in entropyu when the system undergoesa process leading to the following changes in occupation numbers: 0, 0, -1, -1, -2, 0, 1, 0, 3, 2, -1, 1, -1, 0, -1.
Single Component Thermodynamics22. (2015) DeHoff 6.10: Compute the change in entropy when one mole of a monatomic ideal gas is compressed from
an initial condition at 273K and 1 bar to 500K at 3.5 bar.(a) Calculate using the phenomenological thermodynamics of Chapter 4.(b) Calculate using the results of statistical thermodynamics. Hint: first calculate the initial and final volumes.
23. (2015) DeHoff 7.5: Sketch G(T) for an element that the pressure corresponding to the triple point. Repeat the sketchfor a pressure slightly above and slightly below the triple point.
P
T
24. (2015) DeHoff 7.6 See Lecture 17, last page.25. (2015) DeHoff 7.7 variant: At what pressure will ice melt at -2°C?26. (2015) DeHoff 7.8: At 1 atm pressure and below 1155 K, the ε form of titanium is stable; above 1155 K, the β form is
the stable phase (ε becomes metastable). Given the following data:• ∆Sε→β = 3.43 J/mol ·K (This is the difference in molar entropy 3 between the phases).
5
• The change in molar entropy upon melting is 9.02 J/mol ·K.• Tβ
m=1940 K.(c) Sketch Gε, Gβ and G` in the temperature range of interest.(d) What is Tε
m?(e) There is a database of the Gibbs free energy of 78 pure elements as a function of temperature. The database
can be found here: http://www.crct.polymtl.ca/sgte/unary50.tdbFind the ε phase of titanium (labeled as GHSERTI), the β phase (labeled as GBCCTI), and the liquid phase(labeled as GLIQTI) and repeat a and b using the empirical formulas. Compare your answers and commenton the accuracy of your assumptions.NOTE: The formula is written so that a program called Thermocalc can read them. Each free energy curve is apiecewise formula. The “;” separates the parts of the function over different temperature ranges. In addition,a “**” is the same as an exponent or “^”.
Mulitcomponent Thermodynamics27. (2015) DeHoff 8.1: Titanium metal is capable of dissolving up to 30 atomic percent oxygen. Consider a solid
solution in the system Ti–O containing an atom fraction, X0 = 0.12. The molar volume of this alloy is 10.68 cc/mol.Calculate the following:
(a) The weight percent of O in the solution.(b) The molar concentration (mol/cc) of O in the solution.(c) The mass concentration (gm/cc) of O in the solution.(d) Use these calculations to deduce general expressions for weight percent, molar, and mass concentrations of
a component in a binary solution in terms of the atom fraction, X2, the molar volume, V, and the molecularweights, MW1 and MW2, of the elements involved.
28. (2015) DeHoff 8.4: Use the partial molal volumes computed in Problem 8.3 (worked out in class) to demonstratethat the Gibbs – Duhem equation holds for these properties in this system.
29. (2015) DeHoff 8.6: For an ideal solution it is known that, for component 2, ∆G2 = RT ln X2. Use the Gibbs – Duhemintegration to derive corresponding relation for component 1.
30. (2015) One mole of solid Cr2O3 at 2500 K is dissolved in a large volume of a liquid Raoultian solution (also at 2500K) of Al2O3 and Cr2O3 with XCr2O3= 0.2. Calculate the resulting changes in the total enthalpy and entropy giventhe following:
314 Computational Exercises31. (2015) For this problem, you will be using MATLAB’s symbolic solver (fzero) and function handles to find the zero
of an equation. On last week’s quiz we found that 89.1 grams of ice were necessary to cool a 1 kg block of Pb downto 300 K from 600 K. We will be plotting the change in temperature for both the Pb and ice. You will need thefollowing parameters:
CPbp = 0.1169 + 4.2x10⁻⁵T kg
kg·KCH2O
p = 4.2 kJkg·K
∆HH2Of us = 344 kJ
kgdHdt = a∆T
Here a is a coefficient that controls the heat transfer in conduction, which we will assume to be 3.33x10⁻³ kJ/K · s,and∆T is the temperature difference between the two materials.
(a) Use the equations derived in class to plot the change in temperature for H2O and Pb. Assume dt=1 s andcalculate the first 200 time steps. How do you know when the system is at equilibrium?
(b) Create a plot that shows the amount of water in the system as a function of time. At what time is all the icegone?
(c) Create a plot that shows the total heat transfer occurring between the Pb and H2O. How can you tell whenequilibrium is reached from this plot?
32. (2015) We will be putting together a program to help calculate phase diagrams of all sorts piece by piece. The firststep is to create a MATLAB script that solves a system of two equations. The system is below:
Here Gs is the Gibbs energy of the solid phase, G` the Gibbs free energy of the liquid phase, R the gas constant(8.314 J/K), T the absolute temperature, Xs and X` are the compositions of the solid and liquid phase respectively,and Ωs, Ω` are parameters to be defined later. We can rewrite Eqs. 2.1 and 2.2 as follows:
Gs − XsdGs
dXs− G` + X`
dG`
dX`= 0 (2.3)
dGs
dXs− dG`
dX`= 0 (2.4)
Create a MATLAB function that takes Xs, X`, T, Ωs and Ω` as inputs and then create a script that uses the MATLABcommand fsolve to calculate Xs and X` for T=700K, Ω` = 1500 cal/mol and Ωs = 3000 cal/mol.
33. (2015) Now that we are able to solve for the composition of the solid and liquid at one point, we will improve ourscript to calculate it over a range of temperatures. Start with an initial guess for both the solid and liquid near zeroand a temperature of 900 K. Determine the composition of the liquid and solid down to 1 K for each temperatureusing a for loop. Make sure to update your guess with the correct answer for the previous temperature to helpyour program converge. Repeat again starting from 600 down to 1 K, this time starting with an initial guess near 1,and plot your results. Use the following parameters to make the Gibbs energy more physical:
Tαm = 900 K
Tβm = 600 K
∆Hαf = 2000
calmol
∆Hβf = 1300
calmol
The liquid and solid free energies are given by the following expressions. (Note that the Gibbs energy for the solidphase has changed slightly and should be adjusted in your code. In these units R = 1.987 cal/mol ·K
As a reminder, the free energy change for the melting transition can be written in terms of the enthalpic and entropiccontributions to the free energy:
∆Gs→` = ∆Hs→` − T∆Ss→`
34. (2015) Our phase diagram calculation is almost complete! We only have to find the equilibrium between the twosolid phases left. To do that, we simply take the derivative of the Gibbs free energy of the solid phase and set itequal to zero. The equation becomes:
RT ln(
Xs
1− Xs
)−Ωs (2Xs − 1)
Again, assume that Ωs= 3000 cal/mol. This is easily done by creating a for loop that solves for the temperature ateach composition between .01 and .99. Plot your results on the same figure from the previous homework and voila,your first phase diagram!Now with your working code, replot the diagrams for the following interaction coefficients. You will have tochange the range of temperatures for one of the sets below. You can figure out which one it is, if you think of thephysical significance of the parameters.
For each phase diagram, plot your results and describe how the changing interaction parameters changed the shapeof the plot.
8
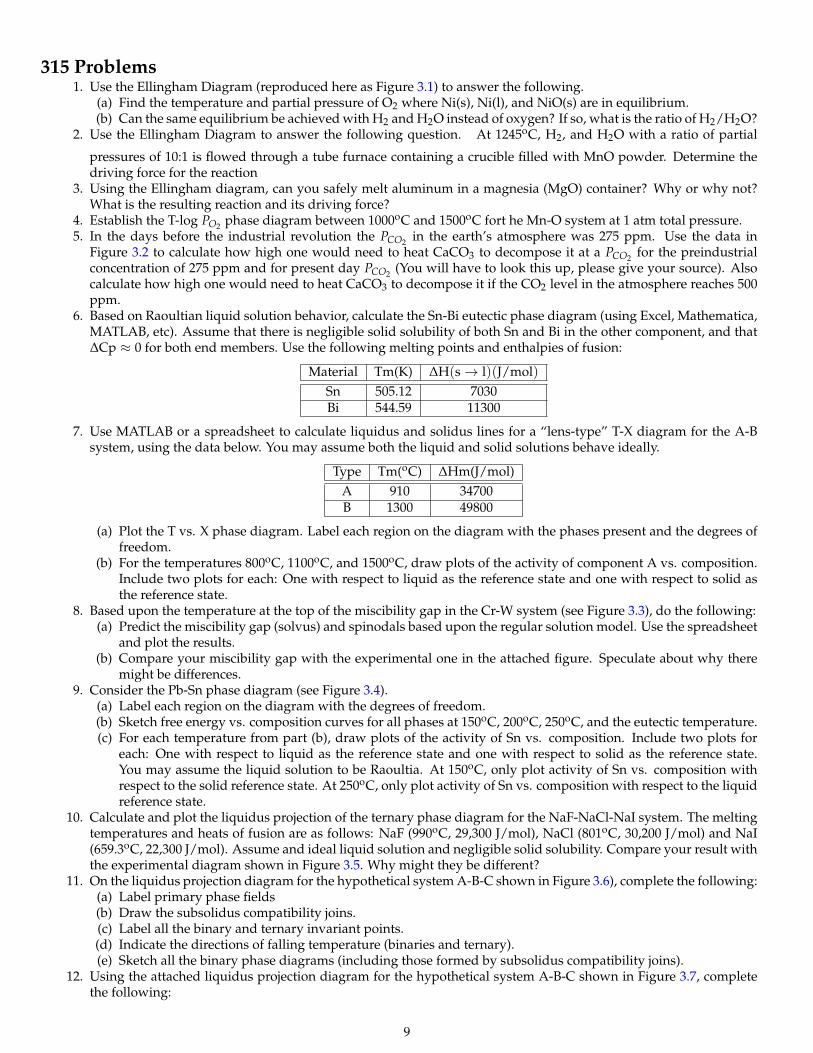
315 Problems1. Use the Ellingham Diagram (reproduced here as Figure 3.1) to answer the following.
(a) Find the temperature and partial pressure of O2 where Ni(s), Ni(l), and NiO(s) are in equilibrium.(b) Can the same equilibrium be achieved with H2 and H2O instead of oxygen? If so, what is the ratio of H2/H2O?
2. Use the Ellingham Diagram to answer the following question. At 1245oC, H2, and H2O with a ratio of partial
pressures of 10:1 is flowed through a tube furnace containing a crucible filled with MnO powder. Determine thedriving force for the reaction
3. Using the Ellingham diagram, can you safely melt aluminum in a magnesia (MgO) container? Why or why not?What is the resulting reaction and its driving force?
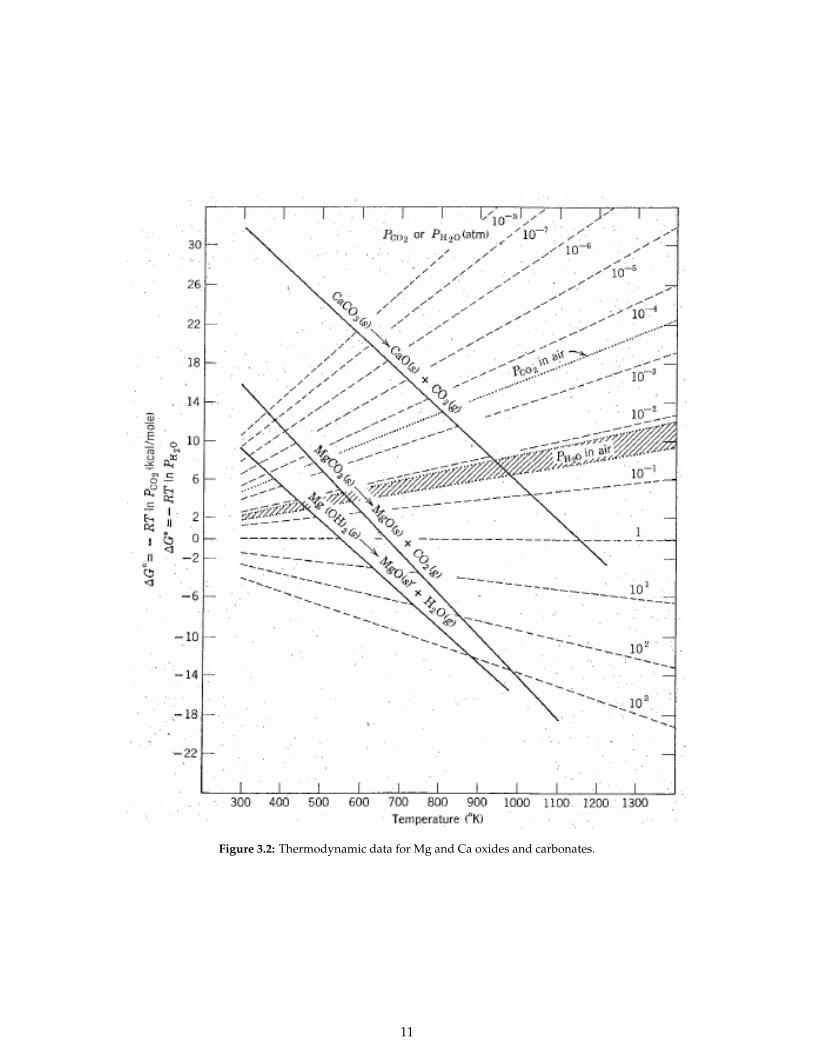
4. Establish the T-log PO2 phase diagram between 1000oC and 1500oC fort he Mn-O system at 1 atm total pressure.5. In the days before the industrial revolution the PCO2 in the earth’s atmosphere was 275 ppm. Use the data in
Figure 3.2 to calculate how high one would need to heat CaCO3 to decompose it at a PCO2 for the preindustrialconcentration of 275 ppm and for present day PCO2 (You will have to look this up, please give your source). Alsocalculate how high one would need to heat CaCO3 to decompose it if the CO2 level in the atmosphere reaches 500ppm.
6. Based on Raoultian liquid solution behavior, calculate the Sn-Bi eutectic phase diagram (using Excel, Mathematica,MATLAB, etc). Assume that there is negligible solid solubility of both Sn and Bi in the other component, and that∆Cp ≈ 0 for both end members. Use the following melting points and enthalpies of fusion:
Material Tm(K) ∆H(s→ l)(J/mol)Sn 505.12 7030Bi 544.59 11300
7. Use MATLAB or a spreadsheet to calculate liquidus and solidus lines for a “lens-type” T-X diagram for the A-Bsystem, using the data below. You may assume both the liquid and solid solutions behave ideally.
Type Tm(oC) ∆Hm(J/mol)A 910 34700B 1300 49800
(a) Plot the T vs. X phase diagram. Label each region on the diagram with the phases present and the degrees offreedom.
(b) For the temperatures 800oC, 1100oC, and 1500oC, draw plots of the activity of component A vs. composition.Include two plots for each: One with respect to liquid as the reference state and one with respect to solid asthe reference state.
8. Based upon the temperature at the top of the miscibility gap in the Cr-W system (see Figure 3.3), do the following:(a) Predict the miscibility gap (solvus) and spinodals based upon the regular solution model. Use the spreadsheet
and plot the results.(b) Compare your miscibility gap with the experimental one in the attached figure. Speculate about why there
might be differences.9. Consider the Pb-Sn phase diagram (see Figure 3.4).
(a) Label each region on the diagram with the degrees of freedom.(b) Sketch free energy vs. composition curves for all phases at 150oC, 200oC, 250oC, and the eutectic temperature.(c) For each temperature from part (b), draw plots of the activity of Sn vs. composition. Include two plots for
each: One with respect to liquid as the reference state and one with respect to solid as the reference state.You may assume the liquid solution to be Raoultia. At 150oC, only plot activity of Sn vs. composition withrespect to the solid reference state. At 250oC, only plot activity of Sn vs. composition with respect to the liquidreference state.
10. Calculate and plot the liquidus projection of the ternary phase diagram for the NaF-NaCl-NaI system. The meltingtemperatures and heats of fusion are as follows: NaF (990oC, 29,300 J/mol), NaCl (801oC, 30,200 J/mol) and NaI(659.3oC, 22,300 J/mol). Assume and ideal liquid solution and negligible solid solubility. Compare your result withthe experimental diagram shown in Figure 3.5. Why might they be different?
11. On the liquidus projection diagram for the hypothetical system A-B-C shown in Figure 3.6), complete the following:(a) Label primary phase fields(b) Draw the subsolidus compatibility joins.(c) Label all the binary and ternary invariant points.(d) Indicate the directions of falling temperature (binaries and ternary).(e) Sketch all the binary phase diagrams (including those formed by subsolidus compatibility joins).
12. Using the attached liquidus projection diagram for the hypothetical system A-B-C shown in Figure 3.7, completethe following:
9
Metal Oxide
Melting PointBoiling Point
Figure 3.1: Ellingham diagram.
10
Figure 3.2: Thermodynamic data for Mg and Ca oxides and carbonates.
11
Figure 3.3: Cr-W Phase diagram.
Figure 3.4: Pb-Sn phase diagram.
12
Figure 3.5: NaF-NaCl-NaI phase diagram. From ref. [1].
Figure 3.6: Liquidus projection diagram.
13
Figure 3.7: Liquidus projection diagram.
(a) Determine the equilibrium crystallization path for the composition marked with the star.(b) Determine the microstructural constituents:
i. Just prior tot he liquid striking the phase boundary (liquid + solid 1 + solid 2).ii. At the eutectic but just prior to eutectic crystallization.
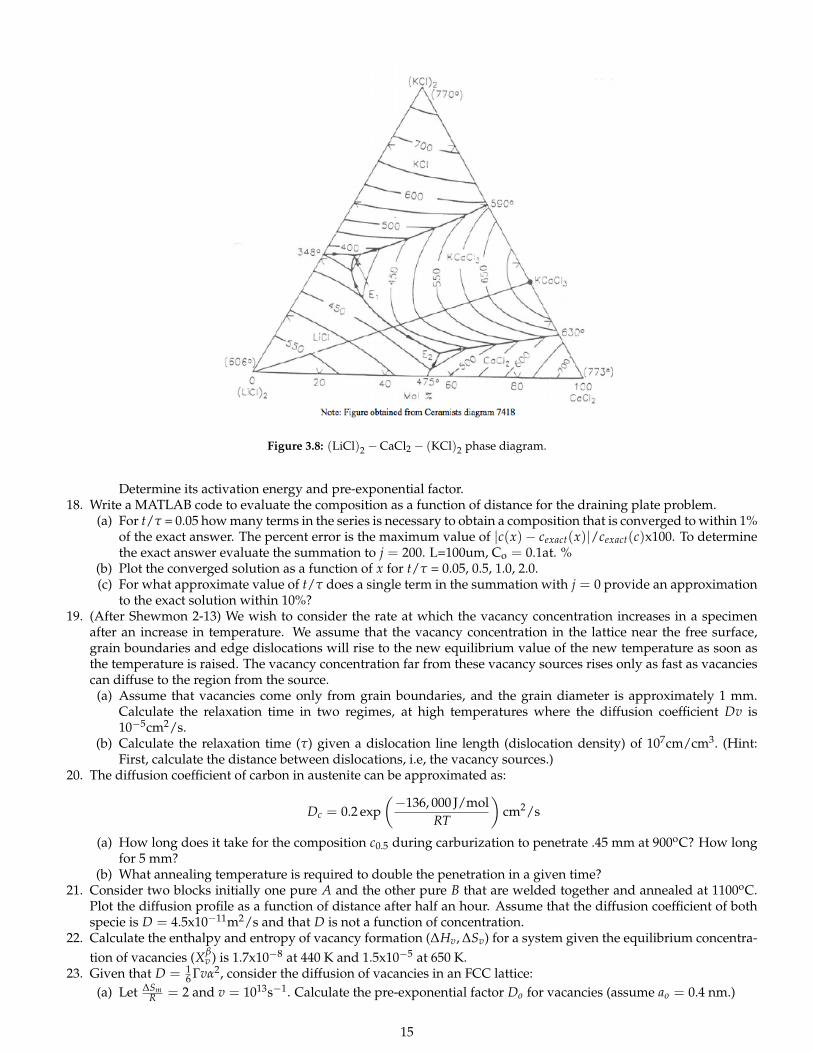
iii. After crystallization is complete.13. On the (LiCl)2 −CaCl2 − (KCl)2 phase diagram shown in Figure 3.8, draw isothermal sections at the following
temperatures: (note- Ternary eutectic E1 is at 332oC and ternary eutectic E2 is at 412oC)(a) 600oC(b) 450oC(c) 400oC(d) 300oC(e) Also determine the precise (not schematic!) (LiCl)2 −KCaCl3 phase diagram.
14. (Bonus question - 10% of problem set value) Starting with the regular solution model, prove that regardless of howpositive the interaction parameter (or heat of mixing) might be, the inital slope on any free energy vs. compositioncurve must be infinitely negative on the left side (XB → 0) and infinitely positive on the right side (XB → 1).
15. A steel tank contains hydrogen at 15 atm pressure. If the solubility of hydrogen in steel is 1x10⁻² g/cm3 under15 atm pressure, the diffusion coefficient is 8x10⁻⁵cm2/s at room temperature and the tank is placed in a vacuum,calculate the flux of hydrogen through a 3.5 mm thick wall.
16. Austenite (γ−Fe) with .85 wt% carbon has a diffusion coefficient of 1.9x10⁻¹¹m2/s at 900oC.(a) Determine the jump distance in terms of the lattice parameter ao and the coordination number for carbon
diffusion in this structure.(b) How many jumps does a carbon interstitial make each second? Assuming a lattice vibration frequency of
1013s−1, what fraction of jumps is successful?(c) Calculate and compare the random walk distance with the total distance (back and forth) traveled by an
interstitial carbon atom in one second.17. Ferrite (α−Fe) (BCC structure) dissolves carbon to a lesser extent than austenite (FCC structure).
(a) Determine the jump distance in terms of the lattice parameter ao and the coordination number for carbondiffusion in this structure.
(b) Given the data in Table 2.1 of Porter, Easterling & Sherif, make an Arrhenius plot of diffusion coefficients ofcarbon and nitrogen from room temperature to 800oC.
(c) A different interstitial solute diffuses at a rate of 4.1x10⁻²mm2/s at 300oC and 7.3x10⁻²mm2/s at 600oC.
Determine its activation energy and pre-exponential factor.18. Write a MATLAB code to evaluate the composition as a function of distance for the draining plate problem.
(a) For t/τ = 0.05 how many terms in the series is necessary to obtain a composition that is converged to within 1%of the exact answer. The percent error is the maximum value of |c(x)− cexact(x)|/cexact(c)x100. To determinethe exact answer evaluate the summation to j = 200. L=100um, Co = 0.1at. %
(b) Plot the converged solution as a function of x for t/τ = 0.05, 0.5, 1.0, 2.0.(c) For what approximate value of t/τ does a single term in the summation with j = 0 provide an approximation
to the exact solution within 10%?19. (After Shewmon 2-13) We wish to consider the rate at which the vacancy concentration increases in a specimen
after an increase in temperature. We assume that the vacancy concentration in the lattice near the free surface,grain boundaries and edge dislocations will rise to the new equilibrium value of the new temperature as soon asthe temperature is raised. The vacancy concentration far from these vacancy sources rises only as fast as vacanciescan diffuse to the region from the source.
(a) Assume that vacancies come only from grain boundaries, and the grain diameter is approximately 1 mm.Calculate the relaxation time in two regimes, at high temperatures where the diffusion coefficient Dv is10−5cm2/s.
(b) Calculate the relaxation time (τ) given a dislocation line length (dislocation density) of 107cm/cm3. (Hint:First, calculate the distance between dislocations, i.e, the vacancy sources.)
20. The diffusion coefficient of carbon in austenite can be approximated as:
Dc = 0.2 exp(−136, 000 J/mol
RT
)cm2/s
(a) How long does it take for the composition c0.5 during carburization to penetrate .45 mm at 900oC? How longfor 5 mm?
(b) What annealing temperature is required to double the penetration in a given time?21. Consider two blocks initially one pure A and the other pure B that are welded together and annealed at 1100oC.
Plot the diffusion profile as a function of distance after half an hour. Assume that the diffusion coefficient of bothspecie is D = 4.5x10⁻¹¹m2/s and that D is not a function of concentration.
22. Calculate the enthalpy and entropy of vacancy formation (∆Hv, ∆Sv) for a system given the equilibrium concentra-tion of vacancies (Xβ
v ) is 1.7x10⁻⁸ at 440 K and 1.5x10⁻⁵ at 650 K.23. Given that D = 1
6 Γvα2, consider the diffusion of vacancies in an FCC lattice:(a) Let ∆Sm
R = 2 and v = 1013s−1. Calculate the pre-exponential factor Do for vacancies (assume ao = 0.4 nm.)
15
(b) If ∆Hm = 6.5 kJ/mol, calculate Dv for vacancies at 750oC24. Below are the linear thermal expansion (∆L/Lo) and X-ray lattice parameter (∆a/ao) results at different tempera-
tures for aluminum. Calculate and plot lnXv from this data versus T−1 and determine the enthalpy and entropy ofvacancy formation in aluminum. Show all equations used.
25. Below is a table of linear thermal expansion (∆L/L) and lattice parameter expansion (∆a/a) vs. temperature foraluminum. Calculate and plot lnXv form this data versus 1/T and determine the enthalpy and entropy of vacancyformation in this material. Show all equations used.
26. A gold specimen is quenched from 700oC to room temperature (25oC). An identical specimen is air cooled from700oC to room temperature. The difference in their resistances is ∆ρo. The quenched specimen is annealed at 40oCfor 120 hours and then annealed at 60oC. Resistivity measurements were taken periodically by quenching thesample to room temperature. From the two slopes shown in attached Figure 2-16, find ∆Hmotion.
27. Write balanced Kröger-Vink reactions for the following reactions, assuming full ionic charge for all ionic species.(a) Schottky defect formation in Li2O(b) Anion Frenkel defect formation in Nb2O5(c) Oxidation of CdO to yield Cd/O < 1/1 (write both possible reactions)(d) Doping Al2O3 with ZnO to produce oxygen vacancies.
28. Pure ZnO is an n-type semiconductor dominated by oxygen vacancies, but it can be further donor-doped by sub-stituting Al3+ for Zn2+ sites.
(a) Draw a schematic Brouwer diagram as a function of pO2 at fixed Al content.(b) Draw a schematic Brouwer diagram at fixed pO2 as a function of Al content. Include all relevant point defect
reactions and mass-action relationships.29. Given the following oxygen ion diffusivities for calcia-stabilized zirconia (CSZ) of composition (ZrO2)0.85(CaO)0.15
and density 5.5 g/cm3, calculate a) the ionic conductivity at each temperature, and b) the enthalpy of motion.Assume oxygen vacancies are the dominant defect.
16
301 Computational Exercises(Nothing yet to include)
1. Anything about yourself (why you are interested in MSE, previous work experience, etc., outside interests apartfrom MSE) that will help me get to know you a bit (feel free to be brief - any info here is fine).
2. Your level of experience and comfort level with MATLAB. Be honest about your assessment (love it, hate it, don’tunderstand it, etc.).
3. Let us know if you have NOT taken 314 or 315 for some reason.Diffusion
1) Consider a diffusion couple with composition C1 as z→ −∞ and C2 as z→ ∞. The solution to the diffusion equationis:
C (z, t) =C1 + C2
2− C1 − C2
2erf(
z2√
Dt
)where erf (y) = 2
π
∫ y0 e−t2
dt. Note that in the definition of the error function t is a dummy variable of integration, thusthe error function is a function of y. Also, erf(0)=0, and erf(∞)=1. You will determine if these boundary conditions arecorrect.
1. Show that the boundary conditions at z = ±∞ are satisfied by the solution.2. Does the composition at z = 0 vary with time? If not, what is its value? Why do you think this is the case?3. Write the solution in terms of η = z/t1/2.4. Show that the solution in terms of satisfies the following diffusion equation that is written in terms of η:
Dd2Cdη2 +
η
2dCdη
= 0
You will needed to take a derivative of the error function. Leibniz’s formula for the differentiation of integrals willbe helpful:
ddz
∫ g(z)
h(z)f (t) dt =
dg (z)dz
f (g (z))− dh (z)dz
f (h (z))
2) A diffusion couple including inert wires was made by plating pure copper on to a block of α-brass with XZn = 0.3,as shown in Figure 4.1. After 56 days at 785 C the marker velocity was 2.6x10⁻⁸ mm/s, with a composition at themarkers of XZn = 0.22, and a composition gradient, ∂XZn/∂z of 0.089 mm−1. A detailed analysis of the data givesD = 4.5x10⁻¹³ m2/s for XZn = 0.22. Use these data to calculate DZn and DCu for XZn = 0.22. How would you expectDZn, DCu and D to vary as a function of composition?
Figure 4.1: Experimental Geometry for the Kirkendall experiment.
3) In class we developed an expressions for J′a. Show that J′a = −J′b. (Recall that these primed fluxes correspond tofluxes in the laboratory frame of reference).
4) Consider two binary alloys with compositions Xb = X1 and Xb = X2, shown in Figure 4.2 along with the free energycurves for α and β phases formed by this alloy. Draw the composition profile across the interface shortly after the twoalloys are brought into contact with one another, assuming that the interface is in “local equilibrium”, i.e. the interfacecompositions are given by the equilibrium phase diagram. Describe the direction in which you expect the B atoms todiffuse on each side of the interface.
Figure 4.2: Free energy curves for a model A/B alloy.
5) The following MATLAB script runs the vacancy simulation shown in class. It saves the data into a ’structure’ calledoutput, which can be loaded into MATLAB later. The file can be downloaded from this link:http://msecore.northwestern.edu/316-1/matlab/vacancydiffusion.m
1 tic % start a time so that we can see how long the program takes to run2 n=30; % set the number of boxes across the square grid3 vfrac =0.01; % vacancy fraction4 matrix=ones(n);5 map =[1,1 ,1;1,0,0;0,0 ,1]; % define 3 colors: white , red , blue6 figure7 colormap(map) % set the mapping of values in 'matrix ' to a specific color8 caxis ([0 2]) % range of values in matrix goes from 0 (vacancy) to 29 % the previous three commands set things up so a 0 will be white , a 1 will
10 % be red and a 2 sill be blue11 matrix(:,n/2+1:n)=2; % set the right half of the matrix to 'blue '12 i=round(n/2); % put one vacancy in the middle13 j=round(n/2);14 matrix(i,j)=0;15 imagesc(matrix); % this is the command that takes the matrix and turns it into a plot16 t=0;17 times =[1e4 ,2e4 ,5e4 ,1e5];18 showallimages =1; % set to zero if you want to speed things up by not showing images , set to 1 if you
want to show all the images during the simulation19
20 %% now we start to move things around21 vacancydiff.matrices =; % makea blank cell array22 while t<max(times);23 t=t+1;24 dir=round (4* rand +0.5);25 if dir==126 in=i+1;27 jn=j;28 if in==n+1; in=1; end29 elseif dir==230 in=i-1;31 jn=j;32 if in==0; in=n; end33 elseif dir==334 in=i;35 jn=j+1;36 if jn >n; jn=n; end37 elseif dir==438 in=i;39 jn=j-1;40 if jn==0; jn=1; end41 end42 % now we need to make switch43 neighborix=sub2ind ([n n],in,jn);
44 vacix=sub2ind ([n n],i,j);45 matrix ([vacix neighborix ])=matrix ([ neighborix vacix ]);46 if showallimages47 imagesc(matrix);48 drawnow49 end50 if ismember(t,times)51 vacancydiff.matrices =[ vacancydiff.matrices matrix ]; % append matrix to output file52 imagesc(matrix);53 set(gcf ,'paperposition ' ,[0 0 5 5])54 set(gcf ,'papersize ' ,[5 5])55 print(gcf ,['vacdiff ' num2str(t) '.eps'],'-depsc2 ')56 end57 i=in;58 j=jn;59 end60 vacancydiff.times=times;61 vacancydiff.n=n;62 save('vacancydiff.mat','vacancydiff ') % writes the vacancydiff structure to a .mat file that we can
read in later63 toc
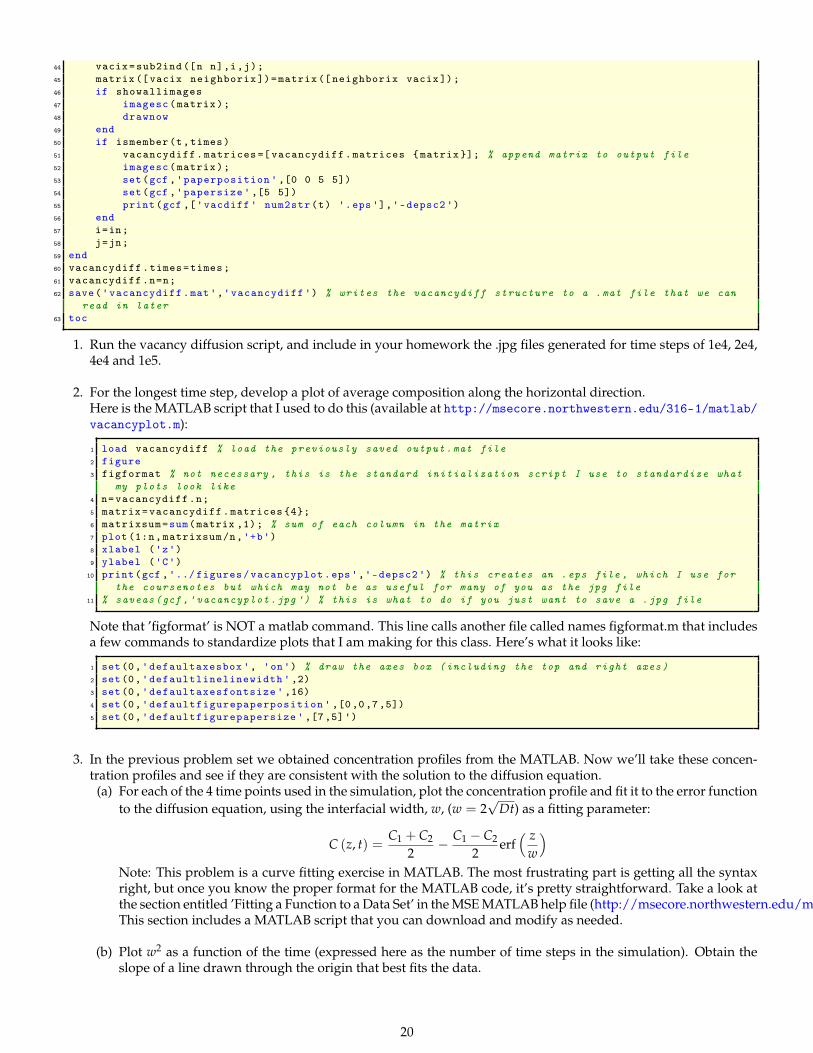
1. Run the vacancy diffusion script, and include in your homework the .jpg files generated for time steps of 1e4, 2e4,4e4 and 1e5.
2. For the longest time step, develop a plot of average composition along the horizontal direction.Here is the MATLAB script that I used to do this (available at http://msecore.northwestern.edu/316-1/matlab/vacancyplot.m):
1 load vacancydiff % load the previously saved output.mat file2 figure3 figformat % not necessary , this is the standard initialization script I use to standardize what
my plots look like4 n=vacancydiff.n;5 matrix=vacancydiff.matrices 4;6 matrixsum=sum(matrix ,1); % sum of each column in the matrix7 plot (1:n,matrixsum/n,'+b')8 xlabel ('z')9 ylabel ('C')10 print(gcf ,'../ figures/vacancyplot.eps','-depsc2 ') % this creates an .eps file , which I use for
the coursenotes but which may not be as useful for many of you as the jpg file11 % saveas(gcf ,'vacancyplot.jpg ') % this is what to do if you just want to save a .jpg file
Note that ’figformat’ is NOT a matlab command. This line calls another file called names figformat.m that includesa few commands to standardize plots that I am making for this class. Here’s what it looks like:
1 set(0,'defaultaxesbox ', 'on') % draw the axes box (including the top and right axes)2 set(0,'defaultlinelinewidth ' ,2)3 set(0,'defaultaxesfontsize ' ,16)4 set(0,'defaultfigurepaperposition ' ,[0,0,7,5])5 set(0,'defaultfigurepapersize ' ,[7,5]')
3. In the previous problem set we obtained concentration profiles from the MATLAB. Now we’ll take these concen-tration profiles and see if they are consistent with the solution to the diffusion equation.
(a) For each of the 4 time points used in the simulation, plot the concentration profile and fit it to the error functionto the diffusion equation, using the interfacial width, w, (w = 2
√Dt) as a fitting parameter:
C (z, t) =C1 + C2
2− C1 − C2
2erf( z
w
)Note: This problem is a curve fitting exercise in MATLAB. The most frustrating part is getting all the syntaxright, but once you know the proper format for the MATLAB code, it’s pretty straightforward. Take a look atthe section entitled ’Fitting a Function to a Data Set’ in the MSE MATLAB help file (http://msecore.northwestern.edu/matlab.pdf).This section includes a MATLAB script that you can download and modify as needed.
(b) Plot w2 as a function of the time (expressed here as the number of time steps in the simulation). Obtain theslope of a line drawn through the origin that best fits the data.
(c) When diffusion occurs by a vacancy hopping mechanism in a 2-dimensional system like the one used in oursimulation, the diffusion coefficient is given by the following expression:
D = KXvΓa2
Here is the average hop frequency for any given vacancy and a is the hopping distance. From the the slope of thecurve of w vs. the total number of jumps, extract an estimated value for K.
6) A region of material with a different composition is created in an infinitely long bar. The following plot shows themole fraction of component A as a function of position. Assume that the intrinsic diffusion coefficient of the A atoms istwice as large as the intrinsic diffusion coefficient for the B atoms.
z
Xa,
Xb
0
0.2
0.4
0.6
0.8
1
1.2
Xa
Xb
1. Plot the flux of A and the flux of B relative to the lattice as a function of position in the graph above.
2. Plot the vacancy creation rate as a function of position in the graph above.
3. Plot the flux of A and B in the lab frame as a function of position in the graph above.
4. Plot the lattice velocity as a function of position in the graph below. What are the physical implications of this plot?
7) The values for the intrinsic diffusion coefficients for Cu and Ni in a binary Cu/Ni alloy are shown below on the left(note that Cu and Ni are completely miscible in the solid state). A diffusion couple is made with the geometry shownbelow on the right.
XCu
0 0.2 0.4 0.6 0.8 1
DC
u, D
Ni (
cm2/s
)
10-12
10-11
10-10
10-9
10-8
DCu
DNi
Copper Nickel
Inert Markers
1. What is the value of the interdiffusion coefficient D, for an alloy consisting of nearly pure Nickel?
2. Will the markers placed initially at the Cu/Ni interface move toward the copper end of the sample, the nickel endof the sample, or stay at exactly the same location during the diffusion experiment.
3. The copper concentration across the sample is sketched below after diffusion has occurred for some time.
21
4. Sketch the fluxes of Copper, Nickel and vacancies, defining positive fluxes as those moving to the right.
5. Now sketch the rate at which vacancies are created or destroyed within the sample in order to maintain a constantoverall vacancy concentration throughout.
8) An experiment is performed to determine the tracer diffusion coefficient of metal A in a matrix of metal B. This isdone by depositing a very thin film of metal A onto the surface of metal B and measuring the concentration profile ofmetal A into the depth of the material at different times. The concentration profiles in the left figure below are obtainedat two times, t1 and t2:
z0
1
2
3
4
5
6
XA
×10-3
t1
t2
z0
0.01
0.02
0.03
0.04
0.05
0.06
XA o
r X
B
tracer A in Matrix A
Tracer B in Matrix B
1. Estimate the ratio t2/t12. Now suppose we measure the self diffusion coefficients of A and B. Performing measurements at the same time
and temperature gives the concentration profiles shown in the figure above to the right. Which element (A or B) doyou expect has the highest melting temperature, and why?
3. Now we’ll make a diffusion couple with element A on the right half and element B on the left half. Assume thatA and B are miscible at the diffusion temperature, and form a one phase alloy. Mark up the following diagram asdirected on the next page:
B BA
A
22
(a) Put an arrow labeled ’M’ on the diagram indicating the direction that inert markers placed originally at theinterface will move.
(b) Put an arrow labeled ’V’ on the diagram indicating the the net vacancy flux due to diffusion in the sample.(c) Put a ’C’ on the region of the sample where you expect vacancies to be created, and a ’D’ on the sample
where you expect vacancies to be destroyed, assuming that the total vacancy concentration must remain atequilibrium.
(d) Two edge dislocations are also indicated in the diagram. Place arrows on top of each dislocation to illustratehe directions you expect these dislocations to move in order to create or destroy the vacancies from part iii.
Stress and Strain1) A tensile stress, σ, is applied to a single crystal of zinc, which has an HCP structure. The close packed planes ofatoms (the slip plane for an HCP material) is oriented with its surface normal in the plane of the paper, inclined to thetensile axis by an angle φ as shown below, with φ = 30. Assume that the critical resolved shear stress for motion of thedislocation is 50 MPa (5x10⁷ Pa). The shear modulus of Zn is 43 GPa (4.3x10¹⁰ Pa) and its atomic radius is 0.13 nm.
directed out of paper
1. Is this an edge dislocation, a screw dislocation, or a mixed dislocation, and how do you know?2. Put an arrow on the drawing above to indicate the direction in which the dislocation moves under an applied
tensile stress.3. Calculate the tensile yield stress for this sample.4. Suppose that the slip plane is oriented so that~b is still in the plane of the paper, but that φ is increased to 60. Will
the yield stress increase, decrease or stay the same.5. Suppose that the dislocation is impeded by pinning points (precipitates, for example), that are uniformly spaced
and separated by 1 µm (10−6 m). The resolved shear stress is determined by the stress required to move thedislocation around these pinning points. Use the information given in this problem to determine the energy perlength of the dislocation. Compare this to the expressions given for the energies of edge and screw dislocations tosee if it makes sense.
Dislocation Structure1) A right handed screw dislocation initially located in the middle of the front face of the sample shown below movestoward the back of the sample in response to an applied shear stress on the sample.
dislocation
slip plane
1. Sketch the shape of the sample after the dislocation has propagated halfway through the sample, and again whenit has propagated all the way through the sample. Use arrows to specify the shear force that is being applied.
2. Repeat part a for a left-handed screw dislocation.
2) Draw an edge dislocation and on the same figure dot in the positions of the atoms after the dislocation has shiftedby~b.
23
3) How can two edge dislocations with opposite Burgers vectors meet to form a row of vacancies? How can they meetto form a row of interstitials? Draw pictures of both situations.
4) Given a crystal containing a dislocation loop as shown in the following figure:
final location of dislocation loop
Let the loop be moved (at constant radius) toward a corner until three-fourths of the loop runs out of the crystal. Thisleaves a loop segment that goes in one face and comes out the orthogonal face. Sketch the resultant shape of the crystal,both above and below the slip plane.
5) Given a loop with a Burger’s vector that is perpendicular everywhere to the dislocation line, determine the resultingsurface morphology after the loop propagates out of the crystal. Assume that the loop moves only by glide.
6) Show that it is impossible to make a dislocation loop all of whose segments are pure screw dislocations, but that it ispossible with edge dislocations. For the case of the pure edge dislocation loop, describe the orientation of the extra halfplane with respect to the dislocation loop.
7) Draw the compressive and tensile regions surrounding an edge dislocation.
8) Consider the dislocation loop shown below:
1. Circle the drawing below that corresponds to the shape of the material after the dislocation has expanded andmoved out outside the crystal.
2. Indicate in the spaces below the locations (a, b, c, or d) where the dislocation has the following characteristics:(a) It is a right handed screw dislocation:_____
(b) It is a left handed screw dislocation:_____
(c) It is an edge dislocation with the extra half plane above the plane of the loop:_____(d) It is an edge dislocation with the extra half plane below the plane of the loop:_____
3. Add arrows to the illustration of the dislocation loop to show the orientation of the shear stress that will mostefficiently cause the dislocation to loop to grow.
24
Dislocation Interactions1) If edge dislocations with opposite signs of the Burger’s vectors meet, does the energy of the crystal increase ordecrease? Defend your answer.
2) A nanowire is grown such that it is free of dislocations. Why would the stress required to deform the nanowire belarger than a bulk material?
3) If an anisotropic alloy system has a nearly zero dislocation line tension, would you expect the precipitate spacing tohave a large effect on the yield stress of the alloy? Explain your reasoning
4) Given an edge dislocation in a crystal, whose top two-thirds is under a compressive stress σ acting along the glideplane (see figure below):
1. If diffusion occurs, which way will thee dislocation move? Explain why and tell where the atoms go that leave thedislocation.
2. Derive an equation relating the stress, σ to b and the force tending to make the dislocation move in the verticalplane.
3. If the edge dislocation is replaced by a screw dislocation, which which way will the dislocation tend to move?
5) Construct a plot of the interaction energy vs. dislocation separation distance for two identical parallel edge disloca-tions that continue to lie one above the other as climb occurs. Justify your plot qualitatively by explaining how the strainenergy changes with vertical separation.
6) Repeat the previous problem for edge dislocations of opposite sign.
7) On the following sketch of a dislocation, indicate the direction that it must move in order for vacancies to be created.
8) Consider the two edge dislocations shown below. Suppose dislocation 1 remains fixed in place, but that dislocation2 is able to move on its glide plane.
1. Assume that the sense vector,~s, for each dislocation is defined so that~s points into the page. Indicate the directionof~b for each of the to dislocations.
25
1
2
2. Indicate the glide plane for dislocation 2 with a dotted line.3. Indicate with an X the location of dislocation 2 at the position within its glide plane that minimizes the total strain
energy of the system.
4. Now suppose that dislocation 1 is a fixed, left-handed screw dislocation and dislocation 2 is a mobile right-handedscrew dislocation.
(a) Use a dotted line to indicate the plane on which you expect dislocation 2 to move in order to minimize theoverall strain energy of the system.
(b) Plot the overall strain energy of the system as a function of the distance between the two screw dislocations.
9) Consider an isolated right-handed screw dislocation. Suppose a shear force is applied parallel to the dislocation line,as illustrated below.
Stress into plane of paper on this surface
Stress out of plane of paper on this surface Stress out of plane of paper on this surface
Front View Top View
screw dislocation
screw dislocation
direction ofshear force
1. What is the direction of the force, Fτs , that is applied to the dislocation as a result of the applied stress.
2. Suppose the screw dislocation is replaced by a dislocation loop with the same Burgers vector as the dislocationfrom part a, as shown below. Use arrows to indicate the direction Fτ
s at different points along the dislocation loop.(The direction of Fτ
s has already been indicated at the right edge of the dislocation).
26
Stress into plane of paper on this surface
Stress out of plane of paper on this surface
Front ViewTop View
dislocation loop
direction ofshear force
dislocation loop
3. Describe how the magnitude of Fτs changes (if at all) for different locations along the dislocation loop.
4. What to you expect to happen to the dislocation loop if you remove the external applied stress (will the loop grow,shrink or stay the same size)?
5. Suppose the straight screw dislocation from is pinned by obstacles that are separated by a distance d, as illustratedin the following figure. Sketch the shape of the dislocation for an applied shear stress that is just large enough fordislocation to pass around the obstacles.
Stress into plane of paper on this surface
Stress out of plane of paper on this surface Stress out of plane of paper on this surface
Front View Top View
screw dislocation
screw dislocation
direction ofshear forced
6. What do you expect to happen to the critical resolved shear stress of the material if d is decreased by a factor of 2.(Will the critical resolved shear stress increase, decrease or stay the same).
10) Consider the two red dislocations at the center of the two diagrams shown below: (All of the dislocations areperpendicular to the plane of the paper.) We are interested in the effect that the central dislocation has on each case onthe 4 surrounding black dislocations.
27
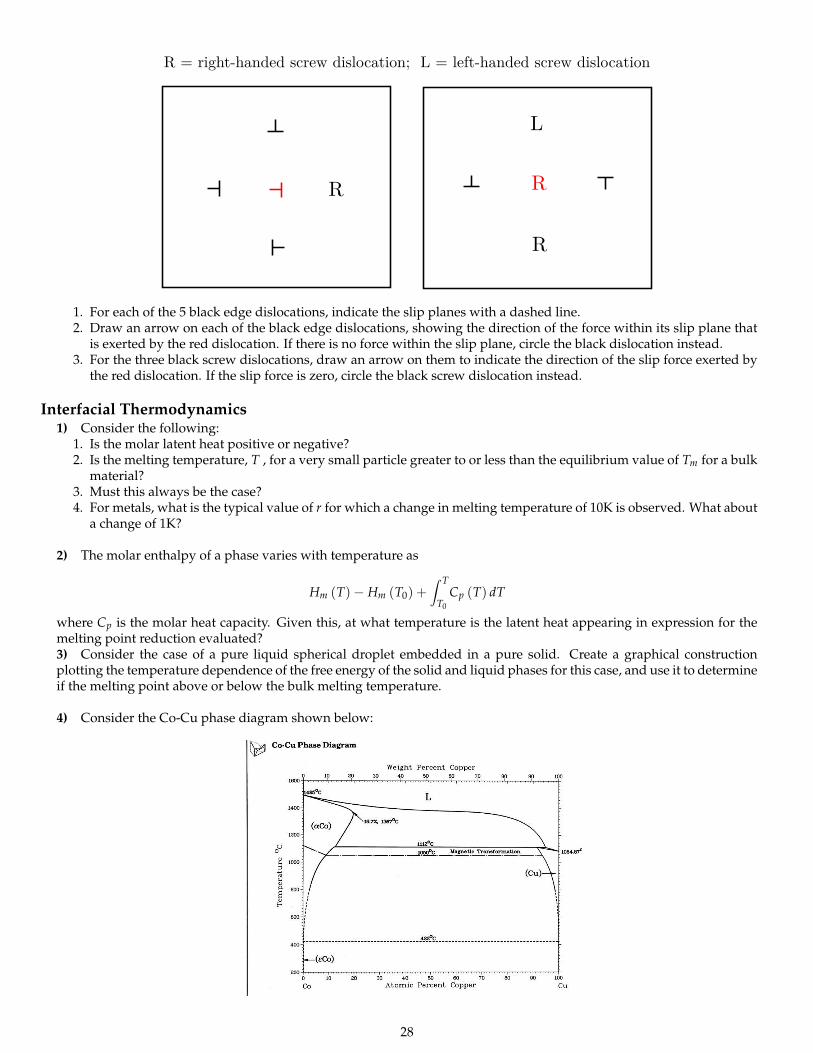
R = right-handed screw dislocation; L = left-handed screw dislocation
RR
R
L
1. For each of the 5 black edge dislocations, indicate the slip planes with a dashed line.2. Draw an arrow on each of the black edge dislocations, showing the direction of the force within its slip plane that
is exerted by the red dislocation. If there is no force within the slip plane, circle the black dislocation instead.3. For the three black screw dislocations, draw an arrow on them to indicate the direction of the slip force exerted by
the red dislocation. If the slip force is zero, circle the black screw dislocation instead.
Interfacial Thermodynamics1) Consider the following:
1. Is the molar latent heat positive or negative?2. Is the melting temperature, T , for a very small particle greater to or less than the equilibrium value of Tm for a bulk
material?3. Must this always be the case?4. For metals, what is the typical value of r for which a change in melting temperature of 10K is observed. What about
a change of 1K?
2) The molar enthalpy of a phase varies with temperature as
Hm (T)− Hm (T0) +∫ T
T0
Cp (T) dT
where Cp is the molar heat capacity. Given this, at what temperature is the latent heat appearing in expression for themelting point reduction evaluated?3) Consider the case of a pure liquid spherical droplet embedded in a pure solid. Create a graphical constructionplotting the temperature dependence of the free energy of the solid and liquid phases for this case, and use it to determineif the melting point above or below the bulk melting temperature.
4) Consider the Co-Cu phase diagram shown below:
28
1. Plot the equilibrium activity of Cobalt as a function of composition across the entire phase diagram at 900ºC.
2. From the phase diagram, estimate the solubility limit of Co in Cu at 900 C. Suppose the interfacial free energyfor the Cu/Co interface is 300 mJ/m2. For what radius of a Co precipitate will this solubility limit be increased by10%?
Surface and Interface Structure1) Look up values for heats of sublimation for any of the materials in Table 8.1 that have close-packed crystal structures(FCC or HCP). Compare the estimated values of the surface free energy that you obtain from these heats of sublimationto the tabulated values in Table 8.1.
2) Determine the equilibrium shape of a crystal. This should be done using a computer and your favorite program orlanguage (most likely MATLAB). The equation of a straight line in polar coordinates drawn from the origin of the polarcoordinate system is r cos (θ − α) = d, where (r, θ) locate the points on the line, d is the perpendicular distance from theorigin to the line and α is the angle between the perpendicular to the line and the x-axis (see Figure 4.3).
Figure 4.3: Representation of a line drawn a distance d from the origin.
1. Determine the equilibrium shape of a crystal where the surface energy is given by γ = 1 J/m2 (independent of α).2. Determine the equilibrium shape of a crystal where the surface energy is given by γ = 1 + 0.05 cos (4α) J/m2 (α in
radians). Are there any corners on the equilibrium shape?3. Determine the equilibrium shape of a crystal where the surface energy is given by γ = 1 + 0.07 cos (4α) J/m2. Are
there any corners on the equilibrium shape?4. Determine the equilibrium shape of a crystal where the surface energy is given by γ = 1 + 0.6 cos (4α) J/m2. Are
there any corners on the equilibrium shape? How is the shape shown in (c) different from that in (d), and why(argue on the basis of the physics of the problem)?As a headstart on this problem, here’s a MATLAB script that generates polar plots of the γ as defined in the problem:
1 close all2 A=[0 ,0.05 ,0.07 ,0.6]; % these are the 4 values of A defined in the problem3 % define a function where the radius d is the surface energy and alpha4 % is the angle5 d=@(A,alpha) 1+A*cos (4* alpha);6 figure7 for k=1:48 alpha=linspace (0,2*pi ,200);9 subplot(2,2,k) % this makes a 2 by 2 grid of plots10 polar(alpha ,d(A(k),alpha),'r-'); % poloar is the command to make a polar plot11 title (['A=' num2str(A(k))],'fontsize ' ,20) % label each subplot12 end13 % adjust the print command as necessary to change the format , filename ,14 % etc.15 print(gcf ,'../ figures/matlabwulffenergy.eps', '-depsc2 ') % save the eps file
This generates the following polar plots for the four different functions that are given (with A defined so thatγ = 1 + A cos (4α)).
29
0.5
1
30
210
60
240
90
270
120
300
150
330
180 0
A=0
1
2
30
210
60
240
90
270
120
300
150
330
180 0
A=0.05
1
2
30
210
60
240
90
270
120
300
150
330
180 0
A=0.07
1
2
30
210
60
240
90
270
120
300
150
330
180 0
A=0.6
3) Assume a simple cubic crystal structure with nearest neighbor interactions. Calculate the ratio ofthe surface energies for 110 and 100 surfaces.
Wetting and Contact Angles1) Consider the an oil droplet that forms on the surface of water, as shown schematically in the following Figure:
Determine θ1 and θ2 if the air/water interfacial free energy is 72 mJ/m2, the air/oil interfacial free energy is 30 mJ/m2
and the oil/water interfacial free energy is 50 mJ/m2.
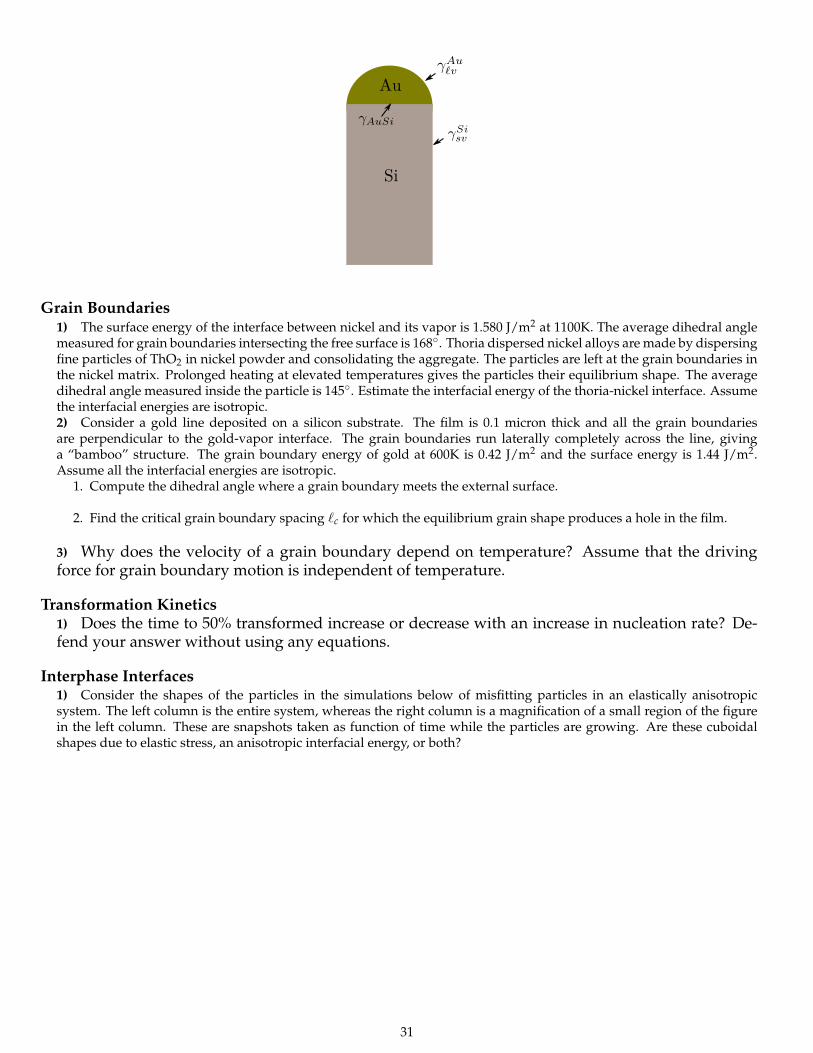
2) Suppose a, hemispherical liquid Au droplet with a radius of curvature of r is in contact with solid Si cylinder withthe same radius as shown below. Derive a relationship between the three interfacial energies that must be valid in orderfor the equilibrium shape of the Au/Si interface to be flat, as drawn in the picture.
30
Au
Si
Grain Boundaries1) The surface energy of the interface between nickel and its vapor is 1.580 J/m2 at 1100K. The average dihedral anglemeasured for grain boundaries intersecting the free surface is 168. Thoria dispersed nickel alloys are made by dispersingfine particles of ThO2 in nickel powder and consolidating the aggregate. The particles are left at the grain boundaries inthe nickel matrix. Prolonged heating at elevated temperatures gives the particles their equilibrium shape. The averagedihedral angle measured inside the particle is 145. Estimate the interfacial energy of the thoria-nickel interface. Assumethe interfacial energies are isotropic.2) Consider a gold line deposited on a silicon substrate. The film is 0.1 micron thick and all the grain boundariesare perpendicular to the gold-vapor interface. The grain boundaries run laterally completely across the line, givinga “bamboo” structure. The grain boundary energy of gold at 600K is 0.42 J/m2 and the surface energy is 1.44 J/m2.Assume all the interfacial energies are isotropic.
1. Compute the dihedral angle where a grain boundary meets the external surface.
2. Find the critical grain boundary spacing `c for which the equilibrium grain shape produces a hole in the film.
3) Why does the velocity of a grain boundary depend on temperature? Assume that the drivingforce for grain boundary motion is independent of temperature.
Transformation Kinetics1) Does the time to 50% transformed increase or decrease with an increase in nucleation rate? De-fend your answer without using any equations.
Interphase Interfaces1) Consider the shapes of the particles in the simulations below of misfitting particles in an elastically anisotropicsystem. The left column is the entire system, whereas the right column is a magnification of a small region of the figurein the left column. These are snapshots taken as function of time while the particles are growing. Are these cuboidalshapes due to elastic stress, an anisotropic interfacial energy, or both?
31
2) Explain the structure and energies of coherent, semicoherent and incoherent interfaces, paying particular attentionto the role of orientation relationships and misfit.3) Explain why fully coherent precipitates tend to lose coherency as they grow.4) The relationship between the the interfacial energy between α and β phases and the pressure difference across acurved interface is obtained from the following expression:
−PαδVα − PβδVβ + γαβδAΣ = 0
1. Use this expression to obtain the pressure difference between a cylinder of β phase with a radius r and a surround-ing α phase.
2. Repeat the calculation for a cube where the length of each side is a. Assume that the surface energy of each of thecube faces is the same.
5) Why do very small precipitates tend to have coherent interfaces?
6) A thin film of Zn with an HCP crystal structure is deposited on a Ni FCC substrate with a 111 orientation. Whichplane of the HCP crystal would you expect to contact the 111 Ni surface?
7) Given an example of an interface between two crystals that that displays a very large change in free energy with achange in the orientation of the interface.
8) Consider the following junction between three grains. Suppose that the grain boundary free energy between grains1 and 2, and between 1 and 3, is 0.5 J/m2. What is the grain boundary energy between grains 2 and 3?
32
grain 1
grain 2 grain 3Solution: The force balance is as shown below:
grain 1
grain 2 grain 3
The force balance in the vertical direction in this case can be written in the following way:
(γ12 + γ13) sin (15) = γ23
with γ12 = γ13 = 0.5 J/m2 we get γ23 =0.26 J/m2.Consider a material with the orientational dependence of the surface energy shown in each of the 3 plots below. For eachof these three materials, sketch the equilibrium shape that you would expect to obtain. On each drawing, indicate anyinterfaces that you expect to be coherent.
9) Consider an FCC metal (metal A) with a surface energy of 1 J/m2. An HCP metal (metal B) with a surface energy of0.7 J/m2 is deposited onto the 111 surface of metal A. Assume that the atomic diameter of the HCP metal is 3% largerthan the atomic diameter of the FCC metal, and that the chemical component of the interfacial energy between the twometals is 0.2 J/m2.
1. For B layers that are sufficiently thin, do you expect that a coherent interface will form between the A and Bmaterials? Justify your answer.
2. How do you expect the interface between the A and B metals to change as the thickness of the B layer increases?3. Do you expect thick films to remain continuous, or will isolated drops of B be formed on the surface. Describe any
assumptions that you make.10) The octahedral particles of FCC gold shown below were created by controlling the growth rates of the differentcrystal facets. For these crystals, were the growth rates fastest in the 〈100〉 directions or in the 〈111〉 directions?
33
11) Consider the vacancy shown below, for a simulation of ’red’ and ’blue’ atoms that are undergoing phase separation.Is the vacancy more likely to move to the right or to the left? Justify your answer.
12) Consider the following image from the grain growth simulation:
x12
1. The boundary marked with an ’X’ separates grains 1 and 2. Do you expect this boundary to move toward grain 1or grain 2 during the process of grain growth?
2. Suppose that the interface marked above is the cross section through a grain boundary in aluminum, and that thissection of the grain boundary has a spherical shape with a radius of curvature of 1µm. Assuming a grain boundaryenergy of 0.25 J/m2, calculate the chemical potential difference, ∆µ between Al atoms on the ’1’ and ’2’ sides of thegrain boundary.
3. On the schematic below, indicate which grain is grain 1 and which one is grain 2.
34
(Grain __)(Grain __)
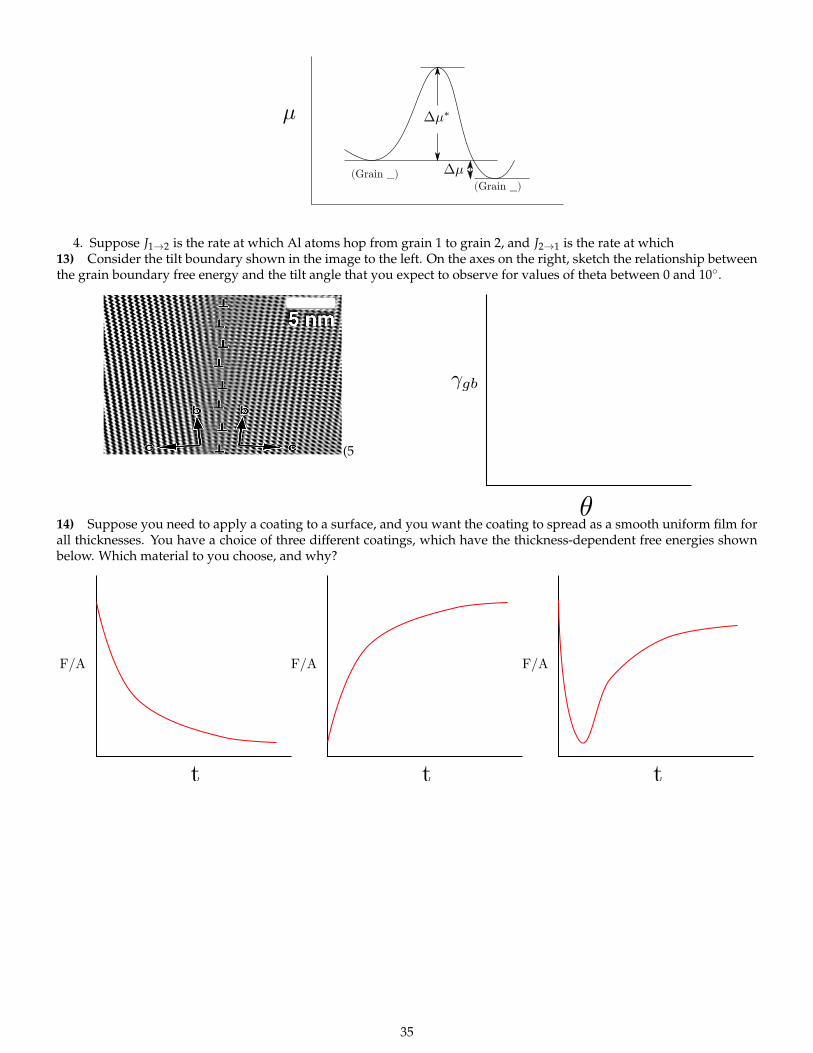
4. Suppose J1→2 is the rate at which Al atoms hop from grain 1 to grain 2, and J2→1 is the rate at which13) Consider the tilt boundary shown in the image to the left. On the axes on the right, sketch the relationship betweenthe grain boundary free energy and the tilt angle that you expect to observe for values of theta between 0 and 10.
(5
14) Suppose you need to apply a coating to a surface, and you want the coating to spread as a smooth uniform film forall thicknesses. You have a choice of three different coatings, which have the thickness-dependent free energies shownbelow. Which material to you choose, and why?
F/A
t
F/A
t
F/A
t
35
316-2 ProblemsGeneral
(1) Write a paragraph discussing the relevance of phase transformations in your daily life.Laplace Pressure Derivation
(2) Derive the expression for the Laplace pressure inside a long cylinder of radius R.
Homogeneous Nucleation(3) Consider the following data for nickel:
Melting point 1452 CMolar entropy of solid at Tm 56.07 J/KMolar entropy of liquid at Tm 66.27 J/KSolid density 8.9 g/cm3
Molar mass 58.7
In their classic experiment Turnbull and Cech studied the undercooling of small droplets for a number of differentmetals . Assuming that nucleation in the droplets occurs homogeneously and using the data given below calculatethe following at 1100 °C and 1200 °C:
a The molar volume of nickel.
b The work of nucleation (W∗R).
c The dimensionless ratio, W∗R/kBT.
d The radius of the critical nucleus.
e The pressure of the critical nucleus in pascals (assume the surrounding liquid is at atmospheric pressure).
f The molar enthalpy of melting at Tm.
g Suppose a Ni droplet with a volume of about 100 µm3 is solidified. Approximate the temperature to whichthe droplet must be cooled in order for solidification to occur by homogeneous nucleation.
(4) Import the file labeled ElementData.mat that includes the required data for various elements on the periodic tableinto Matlab and:
a Derive the expressions for ∆P, R∗, W∗R, and W∗R/kBT in terms of Tm, ∆T, Vm, ∆S f , and γ.
b Plot Vm, ∆S f , γ, ∆P, R∗, W∗R, and W∗R/kBT using ∆T = 100K versus atomic number (Z) and label all axesincluding units and each data point with the chemical symbol corresponding to the element. Hint: Youshould only consider those elements for which the values of γ are included in the ElementData.mat file. Forboth W∗R and W∗R/kBT plot the y axis on a log scale. Also, in order to label the data points with the chemicalsymbol you will need to use the text(x, y, ’string’) function. You may want to use subplots.
The ElementData.mat file has the following format:
c Discuss the plots from part (b) with respect to trends in the periodic table, which variables are reallyimportant, outliers, and rules of thumb i.e. typical range of values or average value. Does homogeneousnucleation ever really happen?
36
d Now replot the data for both ∆T = 352K and ∆T = 252K and compare the R∗ and W∗R values obtained for Nito those you calculated in question (3).
(5) Derive expressions for R∗ and W∗R for a cuboidal nucleus.
(6) In the derivations for nucleation in this course we assume that the nucleus is incompressible. Show that this is avalid assumption for solidification of Ni with γ = 2.38J/m2 and R∗ = 1nm. Hint: Assume that the material islinearly elastic and isotropic. Therefore, you can calculate the bulk modulus using a simple relationship which is afunction of Young’s modulus and Poisson’s ratio. Please cite your source for the values of E and ν that you use.
Surface and Interface Effects(7) The surface free energy of solid gold at its melting point (1063ºC) is 1.400J/m2. The surface energy of liquid gold
at this temperature is 1.128J/m2, and the interfacial energy for the gold solid/liquid interface is = 0.132J/m2. Thelatent heat of fusion for gold is 1.2x10⁹ J/m3.
a What is the contact angle for liquid gold on a solid gold surface at 1063ºC ?
b Is there thermodynamic barrier for the melting of a gold surface?
c Suppose a thin liquid gold layer of thickness δ exists at the surface of gold at 1058 C (5 below the equilibriummelting point). By comparing to the free energy of a gold surface that does not have this liquid layer, estimatethe maximum thickness of the liquid layer that will be thermodynamically stable at this temperature.
d Very small gold particles have melting points that differ from the melting point of bulk gold. From the analysisgiven above, do you expect the melting point of a particle with a diameter of 2 nm to be higher or lower thanthe melting point of bulk gold? Give a brief explanation for your answer.
(8) Suppose precipitates form at grain boundaries within the matrix phase, with geometries that look like the following:
PrecipitateGrain boundary
What is the ratio of the grain boundary free energy to the interfacial energy between the precipitate and the matrixphase?
(9) Water beads up on a freshly waxed car to form droplets with a contract angle of 80. What is the interfacial freeenergy for the wax/water interface, if the surface energy of the wax is 0.025 J/m2? (Note: you’ll need to look upthe surface energy of water to do this problem).
(10) An oil droplet (δ phase) is placed on the water surface (phase β) in contact with air (phase α). The schematic of thecross section of the droplet is as describe in class (and repeated below). The surface free energy of water (againstair) is 0.072 J/m2. If the measured values of θ1 and θ2 in the figure below are 37 and 23, respectively, what are thevalues of the oil surface energy and the oil/water interfacial energy.
37
Heterogeneous Nucleation(11) Derive the structure factor, S(θ).
(12) Suppose that nucleation of a solid, single component metal occurs heterogeneously at a wall. Based on the valuesgiven for Ni in problem (3), what contact angle for the critical nucleus must be obtained in order to increase theminimum temperature required for solidification by 50°C?
Nucleation in a Binary System(13) 3. Consider the formation of a nucleus β∗ with composition Xβ∗ from metastable α with composition Xα
0 .Attemperature T, the composition of stable α is Xα
eq, that of stable β is Xβeq (all X refer to X1). In class we derived an
expression for the molar Gibbs free energy of formation for the nucleus:
∆Gα→β∗m = Gβ
m(Xβ∗)− Gαm(Xα
0 )−∂Gα
∂X
∣∣∣∣∣Xα
0
(Xβ∗ − Xα0 ) (5.1)
Show that for Xα0 − Xα
eq → 0 and Xβ∗ − Xβeq → 0, Eq. (1) can be rewritten in the following form:
∆Gα→β∗m = − δ2Gα
δX2
∣∣∣∣∣Xα
0
(Xα0 − Xα
eq)(Xβeq − Xα
eq)
Hint: Express Gβm(Xβ∗) in terms of Gα
m. Approximate all terms at non-equilibrium compositions as Taylorexpansions around suitable equilibrium values.
(14) In class we used the definition of the misfit parameter for a β nucleus in an α matrix as
ε =13
(Vβ
m −Vαm
Vαm
)i.e. one third of the volume strain. Show that for cubic systems, the misfit parameter can be approximated as
εcubic =aβ − aα
aα
where a is the lattice parameter. Hint: Write ∆V in terms of εcubic and look at the behavior asεcubic → 0.
(15) A coherent precipitate nucleates much more easily than does an incoherent particle of the same precipitate. Toillustrate this:
a What is the ratio of W∗R for the two types of precipitate if γcoherent = 30 ergs/cm2 and γincoherent = 300 ergs/cm2?Assume that the precipitate is unstrained.
38
b If the chemical driving force (∆Gv) is given by−50∆T/Te cal/cm3, Te = 1000 K, the misfit strain is 0.001 forthe coherent precipitate and zero for the incoherent precipitate, at what ∆T are the W∗R’s for the two equal?Assume a shear modulus of the matrix of 5.46x10¹⁰ Pa and bulk modulus of the precipitate of 15x1010 Pa.
c Repeat the previous calculation using a misfit strains of 0.01 and 0.1.
d If the number of nuclei formed per cubic centimeter per second is given by N = 1027\exp(−W∗R/kT), what isthe rate of coherent nucleation at ∆T = 25K and 250K with a misfit of 0.01? What is it for incoherent nucleationat these same values of ∆T?
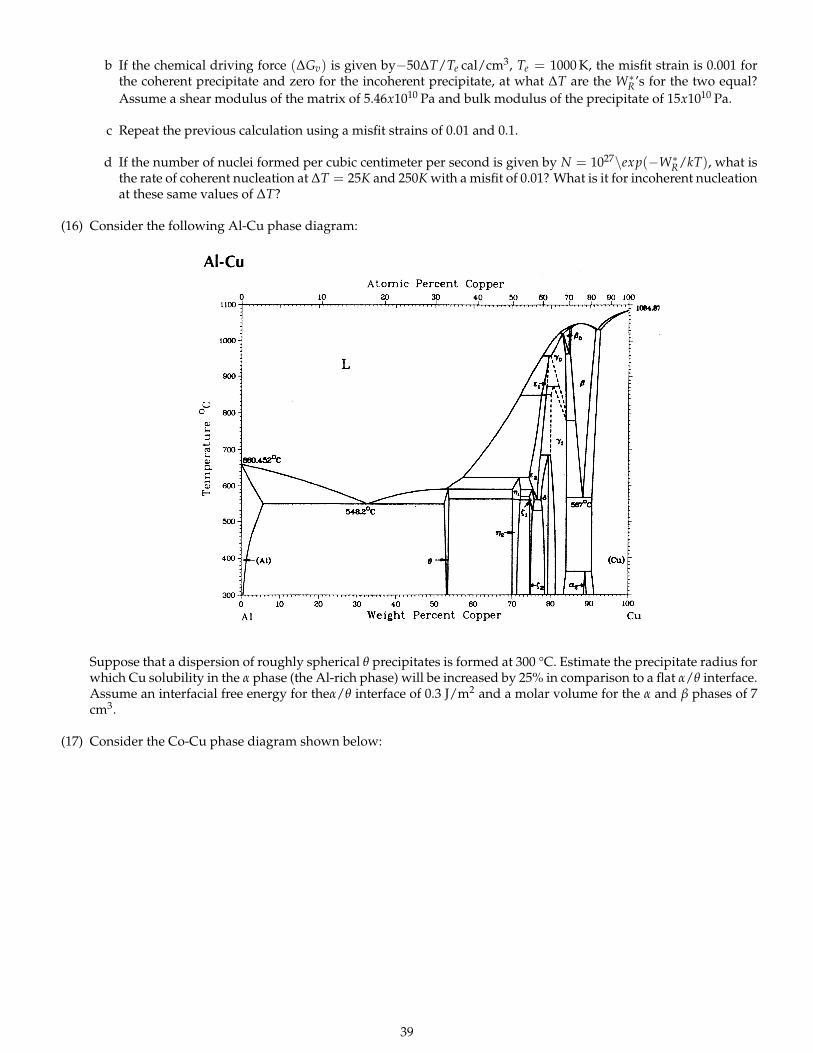
(16) Consider the following Al-Cu phase diagram:
Suppose that a dispersion of roughly spherical θ precipitates is formed at 300 °C. Estimate the precipitate radius forwhich Cu solubility in the α phase (the Al-rich phase) will be increased by 25% in comparison to a flat α/θ interface.Assume an interfacial free energy for theα/θ interface of 0.3 J/m2 and a molar volume for the α and β phases of 7cm3.
(17) Consider the Co-Cu phase diagram shown below:
39
a Plot the equilibrium activity of Cobalt as a function of composition across the entire phase diagram at 900ºC.
b Suppose the interfacial free energy for the Cu/Co interface is 300 mJ/m2. Develop an expression for r∗, thecritical radius for a cobalt precipitate, as function of the atomic % cobalt in the alloy.
c Calculate W∗r for a Copper rich alloy at 900ºC with a cobalt composition that exceeds the equilibrium compo-sition by a factor of 1.15.
Spinodal Decomposition(18) A and B form a regular solution with a positive heat of mixing so that the A-B phase diagram contains a
miscibility gap.a Starting from G = XAGA + XBGB + ΩXAXB + RT (XAlnXA + XBlnXB), derive an equation for d2G/dX2
B,assuming GA = GB = 0.
b Use the above equation to calculate the temperature at the top of the miscibility gap Tc in terms of Ω.
c Using MATLAB plot the miscibility gap for this system.
d On the same diagram plot the chemical spinodal.
(19) For a homogeneous alloy of composition X0 decomposes into two parts, one with composition X0 + ∆X and theother with composition X0 − ∆X, show that the total chemical free energy will change by an amount ∆Gc given by
∆Gc =12
d2GdX2 (∆X)2
Hint: Express G(X0 + ∆X) and G(X0 − ∆X) as Taylor series.
(20) Describe the effect of each of the following, and briefly explain your answer.a The effect of coherent strains on the characteristic wavelength of the two-phase structure formed by spinodal
decomposition.
b The effect of a reduction of the surface free energy on the nucleation rate.
c The effect of a decrease in the contact angle of a precipitate on its heterogeneous nucleation rate.
d Can a diffusion coefficient ever be negative? If so, when is this the case?
Constitutional Undercooling and the ’Mushy Zone’(21) In our classroom discussion of interface stability, we considered the case where impurities decrease the melting
point. Suppose that the impurities increase the melting point, so that the phase diagram looks like this:
40
Liquid
Solid
Suppose sample with the composition indicated by the arrow is solidified, so that the front moves forward with acertain velocity.
a Sketch the behavior of the impurity concentration in the liquid phase just ahead of the solidification front.Reference any specific compositions to the corresponding compositions on the phase diagram.
b On a separate figure, sketch the liquidus temperature in the liquid phase just ahead of the solidification front.Reference any specific temperatures to the corresponding temperatures on the phase diagram.
c Comment on the types of temperature profiles that can lead to the formation of a dendritic microstructurefor this type of phase diagram. Is the criterion for interface stability qualitatively different from the criteriondiscussed in class?
(22) Consider the Al/Si phase diagram shown below, along with the following thermodynamic and kinetic data:Heat of fusion for Al: 10.790 kJ/molDiffusion coefficient for impurities in liquid Al: ∼ 5x10⁻⁹ m2/s
41
Suppose an alloy with 0.8 wt. % Si is solidified at a rate of 5µm/s. (This is the velocity at which the solid/liquidinterface is moving.)
a What is the interface temperature in the steady state?
b What is the thickness of the diffusion layer (i.e. the distance into the liquid phase, measured from the solid/liq-uid interface, over which the liquid composition differs from the average bulk composition far from the inter-face?
c Estimate the temperature gradient required to eliminate the appearance of a ’mushy zone’.
Coarsening(23) The size of Co clusters in Cu vs. aging time at several temperatures was measured using a magnetic technique. At
600 C the data indicate the following: 10 minute aging, average particle radius = 18 Å, 100 minutes, 35 Å, 1,000minutes, 70 Å.
a Assuming that the coarsening kinetics are consistent with Lifshitz-Slyozov-Wagner theory that was discussedin class, estimate the size of particles at t = 0, the end of the precipitation stage, where the cobalt supersatura-tion was first in equilibrium with the average size of the cobalt clusters.
b Using the data for the Co/Cu system given in the previous homework, determine the difference in the averagemole fraction of Co in the Cu phase at aging times of 100 minutes and 1,000 minutes.
c Use the data given to estimate the diffusion coefficient for Co in Cu at 600 °C.
(24) Assume the following "law" for the kinetics of precipitation:
X (t) = 1− exp[− (t/τ)m]
Consider the following experimental data for the formation of Gunier-Preston zones in Al-2 wt.% Cu at 0˚C forX(t) less than 0.25. .
Time in hours X (t)0.4 0.080.7 0.101 0.142 0.174 0.236 0.28
a Determine the value of the exponent m in the above equation by plotting this equation in an appropriatefashion. (Hint: you need to rearrange the equation and take logarithms so that m is the slope of the plot).
b Plot the qualitative temperature dependence that you would expect for the time constant, τ. Note that youcannot obtain this from the data provided – you need to make some assumptions about what you expect thisto look like) Comment on the factors that cause τ to become very large at high and low temperatures. FromFig. 5.25 in Porter and Easterling, what can you say about the behavior of τ in the high temperature regime(i.e., at what temperature must τ diverge to infinity)?
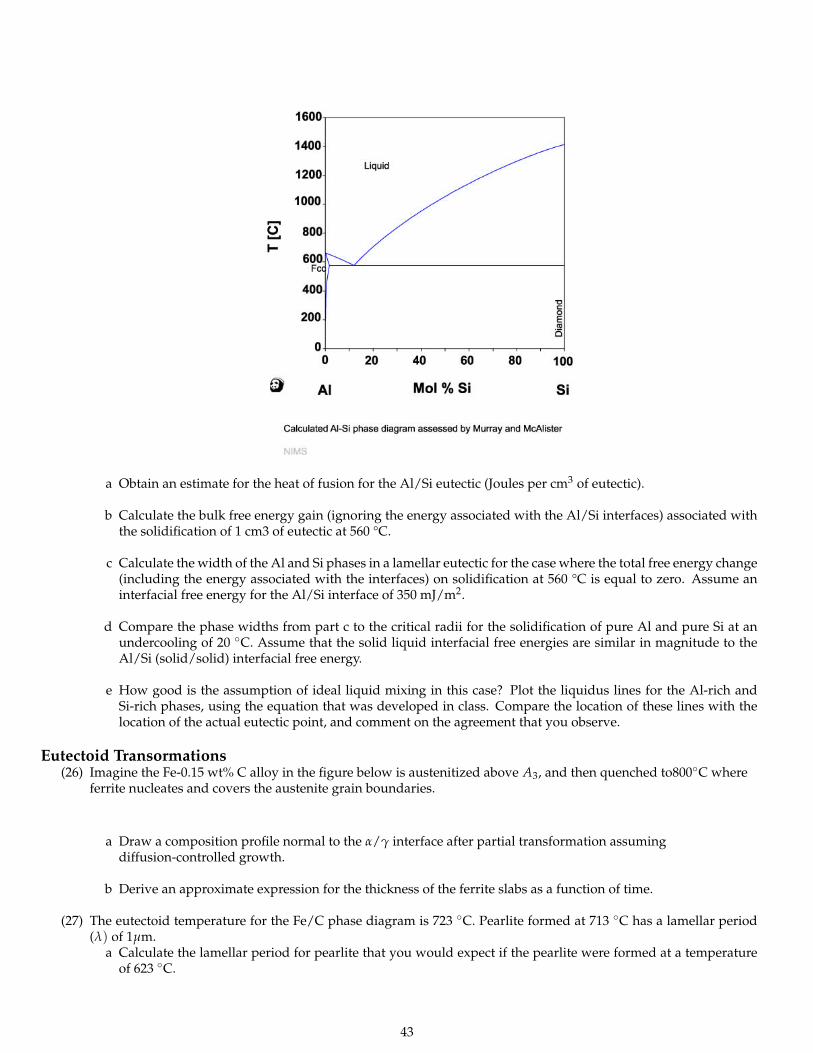
Eutectic Solidification(25) Refer to the Al/Si phase diagram and thermodynamic data below to answer the following questions.
Heat of fusion for Al: 395 J/gHeat of fusion for Si: 1408 J/g
42
a Obtain an estimate for the heat of fusion for the Al/Si eutectic (Joules per cm3 of eutectic).
b Calculate the bulk free energy gain (ignoring the energy associated with the Al/Si interfaces) associated withthe solidification of 1 cm3 of eutectic at 560 °C.
c Calculate the width of the Al and Si phases in a lamellar eutectic for the case where the total free energy change(including the energy associated with the interfaces) on solidification at 560 °C is equal to zero. Assume aninterfacial free energy for the Al/Si interface of 350 mJ/m2.
d Compare the phase widths from part c to the critical radii for the solidification of pure Al and pure Si at anundercooling of 20 C. Assume that the solid liquid interfacial free energies are similar in magnitude to theAl/Si (solid/solid) interfacial free energy.
e How good is the assumption of ideal liquid mixing in this case? Plot the liquidus lines for the Al-rich andSi-rich phases, using the equation that was developed in class. Compare the location of these lines with thelocation of the actual eutectic point, and comment on the agreement that you observe.
Eutectoid Transormations(26) Imagine the Fe-0.15 wt% C alloy in the figure below is austenitized above A3, and then quenched to800C where
ferrite nucleates and covers the austenite grain boundaries.
a Draw a composition profile normal to the α/γ interface after partial transformation assumingdiffusion-controlled growth.
b Derive an approximate expression for the thickness of the ferrite slabs as a function of time.
(27) The eutectoid temperature for the Fe/C phase diagram is 723 C. Pearlite formed at 713 C has a lamellar period(λ) of 1µm.
a Calculate the lamellar period for pearlite that you would expect if the pearlite were formed at a temperatureof 623 C.
43
b Pearlite forms initially at grain boundaries within the parent austenite phase. Briefly describe why this is so.
c Describe what happens to the microstructure of the steel and to the hardness as increasingly large cooling ratesare used. Discuss the role of carbon diffusion, and the role of both equilibrium and non-equilibrium phases.
(28) In the reading about the Wright Flyer Crankcase, the authors assert “In an Al-Cu alloy with significantsupersaturation, GP zones develop by spinodal decomposition. The spacing between zones (before coarsening) isdetermined by the fastest growing wavelength during decomposition. The favored wavelength is inverselyrelated to the second derivative of the free energy versus composition function,which is zero at the spinodal line(located inside but near the GP zone solvus curve) and increases(negatively) with an increase in Cu or a decreasein temperature. Thus, the favored wavelength in the region with a large amount of Cu is smaller than in theregions with small amounts of Cu, and the resulting spacing between zones is smaller.”
d Support their argument using the equations derived in class for spinodal decomposition. A good way toapproach this is to postulate a spinodal line and then consider two cases, i.e. Xo = 2.5 wt.% Cu and Xo = 4.5wt.% Cu, in detail, based on this spinodal. Be sure to also explain why the authors made the parentheticalstatement “(before coarsening)”.
e Is their argument entirely valid or do certain conditions need to be met? If so, what qualifications should bemade to make it more accurate?
f The authors claim that “The growth of [GP] zones is ultimately limited by solute depletion in the matrix.Despite its high solute concentration, the region with a large amount of Cu is depleted of solute by the timethe zones have grown to about 10 nm.” Let’s assume with them the GP zones grow at 100C from a matrixwith 4.5 wt.% Cu. How do the authors arrive at this statement, what evidence did they likely use, and whatcalculations did they perform to arrive at this statement?
Transitional Phases(29) Suppose an alloy containing 97 wt. % aluminum and 3 wt. % copper is poured into a mold and solidified by
extracting heat from the external surfaces of the mold.
a What phase (or phases) do you expect to be present in the solid immediately after the solidification reaction?
b What phase (or phases) will be present at equilibrium?
c A variety of non-equilibrium phases are observed at intermediate stages in the transformation process. Whyare these phases observed?
d Once the equilibrium phase is formed, its rate of growth is found to decrease with time. Why is this? What isthe rate limiting step in the transformation?
(30) Porter and Easterling, prob. 5.6
44
(31) Suppose that in the system of interest, χ is inversely proportional to the absolute temperature, and the criticaltemperature for this system is 350 K. Replot the phase diagram from part a with temperature on the vertical axis.
TTT diagrams(32) Consider the following blowup of the low concentration region of a phase diagram similar to the Co-Cu diagram
shown above:
T
Solubility limit for phase
Solubility limit for phase
a At an average alloy composition φ0 shown on this plot, it is determined that only β precipitates form (no γ isever observed) at two temperatures, T1 and T2. The time dependence of the appearance of β is plotted at thesetwo temperatures as shown below. On the plot above, indicate locations of T1and T2 that are consistent withthese curves, and briefly describe your reasoning.
time (log scale)
relativefraction of
b Draw TTT curves for the precipitation of both β and γ for an alloy with the composition of φ0, making con-nections to specific temperatures from the phase diagram where possible.
Mineralization(33) Calculate the CO2−
3 concentration in equilibrium with seawater and with each of the following three forms ofcalcium carbonate: calcite, aragonite, vaterite. You’ll need to use the solubility products provided in class, and lookup the calcium concentration in seawater.
45
Review Questions• What does the liquid composition look like in front of an advancing solid phase?• What controls length scale of the composition variation?• What is the criteria for interface stability with respect to the formation of dendrites?• Under what conditions are dendrites formed during the solidification of a pure material?• What is the qualitative behavior of S(θ) for nucleation at a flat interface, and at grain boundary surfaces, edges and
corners?• How are equilibrium contact angles related to surface and interfacial free energies?• What is meant by complete wetting?
– What is the effect on nucleation for the complete wetting case?• What are the characteristic frequencies and concentrations (C0, ν0) that determine the homogeneous and heteroge-
neous nucleation rates?• Why is coherent nucleation generally the favored homogeneous nucleation mechanism?• How is the work to form the critical nucleus calculated?• What is the ’incoherent solvus’, and how does it relate to the expressions listed above?• Where does the Laplace pressure come from?• How do you know that kinetic factors must be controlling complex morphologies (dendrite formation, shapes of
snowflakes, etc.)?• What controls the size of the depletion zone in front of a flat or curved precipitate that is growing?• How does it evolve with time?• What limits the growth velocity of a precipitate phase boundary at high and low temperatures?
– Which of these limits are connected to the phase diagram?• Why are flat, plate-like precipitates sometimes formed?• How does the molar free energy depend on the radius of curvature of a precipitate?• How does curvature effect the equilibrium concentration of solute that is in equilibrium with a precipitate?• What does the concentration dependence look like for precipitates that are larger than r*?
– What if the precipitate is smaller than r*?• What are transition phases, and why do they form?
– What is the mechanism by which transition phases shrink at the expense of equilibrium phases?• How are TTT curves for transition phases related to the phase diagram?• What are the basic physical assumptions of the Lifshitz/Slyosov coarsening theory discussed in class?
– What do the depletion zones look like?– What determines the average solute concentration in the matrix phase?
• What does the distribution of precipitates look like if coarsening occurs by the Lifshitz/Slyosov mechanism?• What do the binodal and spinodal curves look like for the regular solution model?
– What is the critical temperature?• What determines the size of the characteristic phase size when phase separation occurs by spinodal decomposition?• What is meant by uphill diffusion?
– When is it observed?• How is this phase size modified (in qualitative terms) by coherent strains?• How do these strains modify the phase diagram to give coherent spinodal and binodal curves?• How can the liquidus lines be estimated for an ideal eutectic system?
– What are the assumptions made in the approximation?• What determines the size of the individual phases for eutectic solidification?• What determines the size of the individual phases for a eutectoid transformation?• What is the physical significance of the squared gradient term in the free energy expression?• How can the shapes and sizes of metallic nanoparticles be controlled?• What is the growth mechanism of Si nanowires catalyzed by Gold?
– What is the importance of the Au/Si phase diagram.• How does the solubility of calcite compare to the solubility of aragonite or vaterite, and why?
– How is the concept of the solubility product used?• In the two-phase mixture of n-type and p-type materials used to form an organic solar cell, what sort of phase
morphology is desired, and why?
46
332 ProblemsCourse Organization
1) Send and email to Prof. Shull ([email protected]), Dr. Emery ([email protected]) andCharlotte ([email protected]). If you did not take CE 216 or of if you did not take MSE 316-1 lastquarter, let us know why. If you were in 316-1 last quarter, let us know what classes you are taking this quarter.
The Stress Tensor2) Consider the following stress tensor:
σij =
4 3 03 1 20 2 6
x106 Pa
(1) Calculate the stress tensor for coordinate axes rotated by 30 about the z axis (the 3 axis).
(2) Repeat the calculation for a 30 rotation around the x axis (the 1 axis).(3) Calculate the three principal stresses for the stress tensor from the .(4) Calculate the maximum shear stress in the sample.
3) Consider the following stress tensor:
σij =
−2 1.4 01.4 6 00 0 2
x106 Pa
(1) Draw a Mohr circle representation of the stress contributions in the xy plane(2) What are the three principal stresses?
Strains4) An engineering shear strain of 1 (100%) is applied to a rubber cube with dimensions of 1cm×1cm×1cm. Young’smodulus for the rubber sample is 106 Pa, and you can assume it is incompressible.
(3) Sketch the shape of the object after the strain is applied, indicating the dimensions quantitatively.(4) On your sketch, indicate the magnitude and directions of the forces that are applied to the object in order to reach
the desired strain.(5) Calculate the 3 principal extension ratios characterizing the final strain state.
Typical Moduli5) Calculate the sound velocities for shear and longitudinal waves traveling through the materials listed in the table inthe course notes.
Matrix Representation of Stress and Strains6) For an isotropic system there are only two independent elastic constants,s12 ands11. This is because if properties areanisotropic in the 1-2 plane, the compliance coefficient describing shear in this plane,s44, is equal to2 (s11 − s12). We canuse the Mohr’s circle construction to figure out why this equality must exist.
(1) Start with the following pure shear stress and strain states:
σ =
0 σ12 0σ12 0 00 0 0
; e =
0 e12 0e12 0 00 0 0
Use the matrix formulation to obtain a relationship betweenσ12 ande12 in this coordinate system.
(2) Rotate the coordinate system by 45 so that the stress state looks like this:
σ =
σp1 0 00 σ
p2 0
0 0 0
; e =
ep1 0 00 ep
2 00 0 0
Use the Mohr’s circle construction to write these principal stresses and strains in terms ofσ12 ande12. Then use thematrix formulation to obtain an expression betweenσ12 ande12 in this rotated coordinate system.
(3) For an isotropic system, the relationship betweenσ12 ande12 should not depend on the orientation of the coordinateaxes. Show that the only to reconcile the results from parts a and b is fors44to be equal to2 (s11 − s12).
Contact Mechanics7) Consider the contact of a flat rigid punch with a thin elastic layer, as shown schematically below:
2a
rigid substrate
rigidcylinder
compliantlayerh
Suppose the compliant layer is incompressible gel (ν = 0.5), with a Young’s modulus,E, of 104 Pa. The critical energyrelease rate for failure at the gel/punch interface is 0.1 J/m2. The punch radius,a, is 3 mm.
(1) What is the tensile force required to separate the punch from the layer if the layer is infinitely thick?(2) What is the stress intensity factor,KI , just prior to detachment of the punch from the surface?(3) How close to the punch edge to you need to be for the tensile stress at the punch/layer interface to be equal to the
modulus of the layer?(4) Describe in qualitative terms what happens to the following quantities as the thickness,h, of the compliant layer
decreases:a The overall compliance of the system.b The load required to detach the indenter from the substrate.c The displacement at which the indenter detaches from the substrate.d The shape of the tensile stress distribution at the punch/substrate interface.
Fracture Mechanics8) The stress fields in the vicinity of a crack tip in a material are determined by the distance,d, from the crack, and thepolar angleθ, defined in the following diagram.
y
x
σ0
σ0
(1) For a fixed value ofd, plot the behavior ofσxx,σyy andσxy for a mode I crack as a function ofθ.(2) What happens to the stresses forθ = 180? Why does this make sense?(3) A mode I crack will travel in the direction for which the normal stress acting across the crack surfaces is maximized.
What direction is this?
9) Look up the fracture toughness (KIC) and Young’s modulus(E) for window glass. Assuming that the maximum localstress is≈ E/10, estimate the crack tip radius of curvature for a crack propagating through window glass.10) As a crack advances, what happens to the stiffness of the cracked body? What happens to the compliance?
48
11) A set of double cantilever beam adhesion test specimens was fabricated from a set of aluminum alloy samples. Thegeometry as as shown below:
Suppose each of the two beams has a thickness (t) of 10 mm, a width(w) of 20 mm and a length of 80 mm. The doublecantilever beam sample was produced by using an adhesive to glue the two beams together. Assume the precrack witha length,a, of 10 mm. The critical energy release rate for the adhesive is 65J/m2.
(1) Calculate the values of the tensile load,P, and the displacement,∆, where the crack starts to propagate.(2) In a load-controlled experiment,P is held constant once the crack starts to propagate, and in a displacement con-
trolled test∆ is held constant once the crack starts to propagate. From the relationship betweenG andP,∆ anda,describe why the load controlled experiment results in unstable crack growth, but the displacement controlledexperiment results in stable crack growth.
(3) From your answer to part b, describe how you would design an experiment where you measured the energy releaserate required to propagate the crack at a specified velocity.
12) The following data were obtained for the fracture stress of a series of silica glass fibers used for optical communica-tions:
The graph shows the distribution of failure probabilities as a function of the applied tensile stress. None of the sampleshad fractured at a stress of 4.5 GPa, but they had all fractured at a stress of 6 GPa. From these data, and from fracturetoughnesses given for inorganic glass in class (and in the course notes), estimate the intrinsic flaw sizes that are presentat the surface of the glass fibers. Comment on these sizes, and if you think the fracture mechanics analysis makes senseto use in this case.13) Silicones containing resin fillers are used as an encapsulant materials in light emitting diodes (LEDs) in order toprotect the electronics from harsh environments and to aid in heat dissipation. Near the surface of the electronic compo-nents, temperatures can go as high as200 C for extended time periods.
Figure 6.1: High dynamic mechanical contrast is important
49
(1) Given that a high dynamic mechanical contrast is desirable in creating a soft material with high fracture tough-ness, what would you suggest as a design criteria in order to maintain high dynamic mechanical contrast at hightemperatures? (Hint: think about the role of the Tg of the matrix and filler content.)
(2) Thermal mismatch at the interface between the encapsulant and electronic can lead to residual stresses that promotecrack propagation. In assessing the performance of the encapsulant at the interface, should a failure stress or afailure strain criteria be used? Why?
(3) From a thermal management and mechanics perspective, why do you think a soft encapsulant (e.g. silicone) willbe more preferable over a hard encapsulant (e.g. glass)?
Yield CriteriaA cube of material is loaded triaxially resulting in the following principal stresses at the pointof plastic yielding:σp
1 =140 MPa,σp2 =20 MPa, andσ
p3 =35 MPa.
(4) What is the shear strength of the material according to the Tresca yield criterion?(5) If the the value ofσp
3 were increased to 70 MPa, how does this change your result? Explain.14) From the work of D. C. Jillson, Trans. AIME 188, 1129 (1950), the following data were taken relating to the defor-mation of zinc single crystals:
Table 6.1: Applied tensile force for slip of single crystal Zn.
In this tableφ is the angle between the loading axis and the normal to the slip plane,λ is the angle between the loadingaxis and the slip direction andP is the force acting on the crystal when yielding begins. The crystals have a cross-sectionalarea,A0, of 122x10−6m2.
(1) What is the slip system for this material.(2) For each combination ofP,φ andλ, calculate the resolved shear stress,τRSS and normal stress,σN acting on the slip
plane when yielding begins.(3) From your calculations, doesτRSS orσN control yielding?(4) Plot the Schmid factor versus the normal stress,P/A0, acting on the rod. At what Schmid factor value are these
experimentally-measured yield loads at a minimum? Does this make sense?15) What is the effect of the resolved normal stress on the yield behavior of crystalline metals and ceramics? Whatabout polymers? Describe any differences between the two cases.16) A sample of pure iron has a uniaxial tensile yield strength of 100 MPa. Assume that the yield behavior is describedby the Von Mises yield criterion.
(1) What do you expect for the yield strength of the material in a state of uniaxial compression?(2) What will the yield strength be under a stress state of shear hydrostatic pressure?(3) What is the shear yield strength of the material.
Strengthening Mechanisms17)
(4) Explain which has a larger effect on solid solution strengthening — symmetrical or asymmetrical point defects —and identify which specific defects lead to symmetrical or asymmetrical stress fields. List at least one example ofan engineering material in which this factor comes into play.
18) The lower yield point for a certain plain carbon steel bar is found to be 135 MPa, while a second bar of the samecomposition yields at 260 MPa. Metallographic analysis shows that the average grain diameter is 50 μm in the first barand 8 μm in the second bar.
(5) Predict the grain diameter needed to cause a lower yield point of 205 MPa.(6) If the steel could be fabricated to form a stable grain structure of 500 nm grains, what strength would be predicted?(7) Why might you expect the upper yield point to be more alike in the first two bars than the lower yield point?
19) The lattice parameters of Ni and Ni3Al are 3.52×10⁻¹⁰ m and 3.567 × 10⁻¹⁰ m, respectively. The addition of 50 at%Cr to a Ni-Ni3Al superalloy increases the lattice parameter of the Ni matrix to 3.525 × 10⁻¹⁰ m. Calculate the fractionalchange in alloy strength associated with the Cr addition, all other things being equal.
50
Viscoelasticity20) Consider a cylindrical metal bar with a density of 7.6 g/cm3, a diameter of 1 cm and a length of 10 cm. It issuspended from a polymer fiber with a length,`, 30 cm and a diameter of 1 mm.
(8) Suppose the fiber is perfectly elastic, with a shear modulus 109 Pa. Calculate the natural frequency of the system ifthe bar is rotating back and forth, causing the fiber to twist.
(9) Suppose the fiber is viscoelastic, withG′ at the frequency calculated from part a equal to 109 Pa, and withG′′ = 107
Pa. How many periods of the oscillation will take place before the magnitude of the oscillation decays by a factorofe (2.72)? Note: the rotational moment of inertia for the suspended metal bar in this geometry ism`2/12, wheremis the total mass of the bar and` is its length.
21) As mentioned in class, the Maxwell model, with a viscous element and an elastic element in series with one another,is the simplest possible model for a material that transitions from solid-like behavior at short times, to liquid-like behaviorat long times. For a shear geometry we refer to the elastic element asG0 and the viscous element asη.
(1) For what angular frequency are the storage and loss moduli equal to one another for a material that conforms tothe Maxwell model? Express you answer in terms of the relaxation time,τ.
(2) Suppose the material is oscillated at a frequency that is ten times the frequency you calculated from part a. Doesthe material act more like a liquid or a solid at this frequency? Describe your reasoning.
(3) Calculate the values ofG′ andG′′ at the frequency from part b, and calculate the phase angle,φ describing the phaselag between stress and strain in an oscillatory experiment. Not that the following expression relatesφ,G′ andG′′:
tan φ =G′′
G′
Does this phase angle make sense, given your answer to part b? Compare your value ofφ to the values you expectfor a perfectly elastic solid and a perfect liquid.
22) The following stress and strain response are observed for a material during the initial stages of a creep experiment.
12345
0.010.020.030.040.050.06
10 20 30 40
(1) Draw a spring/dashpot model that describes this behavior. Label moduli and viscosities as quantitatively as pos-sible.
(2) A stress relaxation test (strain shown below) is performed on the same material. On the stress axis below, draw thestress response that you expect for the model you have drawn from part a.
51
12345
0.010.020.030.040.050.06
10 20 30 40
23) The following stress tensor describes the state of stress of a material at its yield point:
σ =
0 3 03 0 00 0 −5
MPa
Suppose the same material is subjected to stress state of simple shear. At what value of the applied shear stress do youexpect yielding to occur, assuming that the material obeys a Tresca yield criterion.
24) Consider a material with elastic constants given by the following compliance matrix:
(1) Describe the symmetry of this material, and explain your reasoning.
(2) What is the highest value for Young’s modulus that you would expect for this material? What direction does itcorrespond to?
(3) Calculate the value of Poisson’s ratio obtained from an experiment where the materials is pulled in the 3 directionand change in sample width in the 2 direction is measured.
25) The following plot shows values of the yield strength of copper samples as a function of the grain size of thesesamples.
0 20 40 60 80 100120
140
160
180
200
220
240
grain size (nm)
yie
ld s
trength
(M
Pa)
52
(1) Describe why the yield stress decreases with increasing grain size.
a Describe the procedure you would use to determine the limiting value of the yield strength in the absence ofgrain boundaries.
26) The figure below shows the yield strength of a precipitation hardened aluminum alloy as a function of aging timeat different temperatures. Note that the yield strength initially goes through maximum and then decreases with time.Explain why this happens in as much detail as possible.
27)(2) Consider the following two stress-strain curves obtained from a glassy polymer material. In these plotsσt is the
true stress andλ is the extension ratio (1+e, wheree is the tensile strain).
(a)
0 1 2 3 4 5
xFracture
(b)
0 1 2 3 4 5
Fracture x
On the axes below, sketch the behavior of the engineering stress (measured tensile force vs. undeformed crosssectional area) vs extension ratio that you expect for each of these samples. Be as quantitative as possible withregard to the x axis.
(a)
0 1 2 3 4 5
(b)
0 1 2 3 4 5
Briefly describe why you drew the curves the way you did.
Nonlinear Viscoelasticity and Creep28) A step stress (0 for t<0,σ for t>0) is applied to a solid which can be modeled by the following combination of linearsprings and dashpots:
53
EE1
2
1e
2e3
e
(1) This model is useful because it includes a non-recoverable creep component, a recoverable time dependent creepcomponent, and an instantaneous, recoverable strain. Identify the element (or combination of elements) in theabove model which is associated with each of these three contributions to the strain.
(2) This model has been applied to creep data for oriented polyethylene at room temperature. Model predictions werecompared to data obtained from samples of high molecular weight (High M) and low molecular weight (Low M).Both samples were drawn to the same draw ratio. The following values ofE1,E2,η2 andη3 were obtained fromexperimental data:
Sample σ (GPa) E1 (GPa) E2 (GPa) η3 (GPa-s) η2 (GPa-s)Low M 0.025 17.4 33.5 1.8x10⁵ 4300Low M 0.05 13.6 35.6 6.3x10⁴ 5000Low M 0.1 17.7 26.4 3.1x10⁴ 2200Low M 0.15 17.7 26.5 2.6x10⁴ 2300Low M 0.2 16.4 26.8 1.2x10⁴ 2000High M 0.1 18.3 31.9 3.1x10⁶ 8.7x10⁴
High M 0.15 16.6 21.3 1.7x10⁶ 7.3x10⁴
High M 0.2 15.8 32.7 7.7x10⁵ 3x10⁴
High M 0.3 25.4 39.1 4.8x10⁴ 2800High M 0.4 25.0 43 3x10⁴ 3000High M 0.5 21.7 46 2.5x10⁴ 5000
From the values ofη3 given in this table, determine the stress dependence of the steady state creep rate. From thisstress dependence, calculate the activation volume for non-recoverable creep in the high and low molecular weightsamples, and compare these values to one another.
29) In class we briefly talked about the possibility that you could see flow of a glass window over very long periodsof time. Can creep of a glass by viscous flow give measurable changes in sample dimensions over a very long period oftime? To sort this out, do the following:
(1) Estimate the stress at the bottom of a very tall pane of window glass, due to the weight of the window itself. Lookup the density of silica glass, and a height of the window that makes sense (choose a big one).
(2) Estimate the viscosity that would be needed to give a measurable change in sample dimensions after 400 years.(3) Using the data below, does it make sense to you that observable flow could noticeably change the dimensions of the
window? (You’ll need to make some assumptions about how the viscosity will extrapolate to room temperature.
30) Creep in metals at low stresses occurs by a vacancy diffusion mechanism, which means that the activation volumefor these creep mechanisms corresponds to the atomic volume. Show using the data below for silver that we can safely
54
replacesinh (σv/2kBT) withσv/2kBT, so that the creep rates are linear in stress at all relevant temperatures and stresseswhere the dominant creep mechanisms involve vacancy diffusion. (You’ll need to luck up data you can use to calculatethe atomic volume of silver).
Nanoindentation31) Commercial nanoindenters are generally not suitable for the characterization of soft materials. To understand whythis is the case, consider the following indentation data from the Hysitron web site (this is for the same instrument thatNorthwestern has in the NUANCE facility):
(1) If the data in this figure are obtained with a spherical indenter of radiusR, use the data from this figure to estimatethe value ofR. Assume that the material is being indented elastically and that adhesion can be neglected. (You’llneed to look up mechanical property data for silicon).
(2) Suppose that the material is replaced by an elastomer with a modulus of106 Pa. What value ofR would need tobe used to obtain the same Force displacement curve for this much softer material? (Assume that the effects ofadhesion can eliminated by performing the indentation in a suitable liquid.
32) Suppose an elastomeric sphere with a radius of 1 mm and a reduced modulus,E∗, of 106 Pa is placed on a flat,rigid substrate. Suppose also that the adhesion between the sphere and the substrate is characterized by a critical energyrelease rate of 0.05 J/m2, independent of the crack velocity or direction of crack motion. Calculate the radius of the
55
circular contact area that develops between the elastomer and the surface, assuming that there is no external load appliedto the sphere (apart from it’s weight).
Weibull Statistics33) A set of glass rods with a Weibull modulus of 30 are fractured in a uniaxial tensile test. If the stress at which 63% ofthe samples fracture is 100 MPa, what stress should you apply to make sure that less than 1% of the rods fail? What isthe maximums stress if you want to make sure that less than one in106 rods fail? (Note that 1/e is 0.37). What does thestress need to be to get less than 1 failure in106 if the Weibull modulus is 10 instead of 30?34) What determines the value of the Weibull modulus in a brittle material?
Fracture Toughness35) Hertzberg 7.5: What is crack tip shielding?36) Describe the difference between a crack and a craze? How is the maximum width of a craze related toGc andKIC?37) Describe how transformation toughening works to increase the toughness of a ceramic material likeZrO2.38) What is a Charpy impact test conducted, and what does it measure?39) Hertzberg 7.26: What the difference between the side windows of your car and the windshield? Include the role oftempering, thermal annealing and composite layering, and describe how the desired properties are obtained for the twodifferent applications of glass.
General Knowledge40) How areG,ν andK related to one another for an isotropic material?41) What are typical values ofG andK for metals, ceramics and polymers?
Compile the team’s work into a single report. Your report should contain:(1) A brief introduction.(2) The work of each individual student as a separate section. You can work together on the finite element analysis, but
write up the work for your component individually and combine work with labmates later.(3) A conclusion for the project as a whole.
I am looking for accuracy and deliberation in your modeling and thoughtful consideration of the results. I am notconcerned with formatting or the length of your report particularly, but as for any report you write, readability, goodcitation sourcing, informative figure presentation, and conciseness are valued. Broadly, the body of the report shouldinclude the following:
(1) The problem definition: geometry, materials properties, loads and boundary conditions.(2) Discretization: Element type and mesh parameters.(3) The results: Provide the results as a function of parameter values and discretization, as required. Show relevant
results — displacement or stresses — and make sure to note which stress values you are showing. Note how yourresults change as the parameters or mesh changes.
Hint - well-constructed figures are very important to a good report. You may want to carefully design your figures so that that theyare efficient at conveying relevant information.Note that the Abaqus/CAE viewport can be exported as an image by selecting File→Print.Submit an electronic copy of your report, as well as your Abaqus files (.cae and .odb files), by uploading them to CANVASthe date that they are due.
332 Computational Lab #1: Finite Element Analysis of a Cantilever BeamSupported Program Outcomes
• ABET 2: The ability to apply mathematics and science to engineering problems.• ABET 4: Knowledge of computational materials science.• ABET 16: The ability to communicate effectively in written, spoken and graphical form.
The embodiment of stresses and strains in a cantilever beam is well known from solid mechanics. A simple theory usedto explain this behavior is Euler-Bernoulli beam theory, or E-B theory, a model that does not account for large or plasticdeformation, transverse shear strain or Poisson contraction. In this exercise, you will use finite element analysis (FEA) tomodel a rectangular cantilever beam under an end load. You will use Abaqus explore the stresses and strains present inthe beam, compare them to E-B theory, and use engineering principles to adapt the cantilever design.
Objectives
• Explore basic FEA modeling (defining loads, boundary conditions, and meshes) usingAbaqus.• Use computational solvers to calculate and subsequently visualize stress and displacement fields.• Compare computational and analytical results, noting the strengths and weaknesses of each.• Use your results to adapt the cantilever design to achieve a performance tolerance.
Model a cantilever beam loaded on its free end by a shear traction Tz, as shown in Figure7.1, below.
Tz
L b
h
z
xy
0
Figure 7.1: A cantilever beam fixed at one end.
The beam is made of Al 6070-T6 with Young’s modulus E = 80 GPa, Poisson’s ratio ν = 0.33 , and yield strengthσy =69 MPa. Its dimensions are length L = 150 mm, height h = 10 mm and base b = 50 mm. The beam is uniformly loadedwith a stress of Tz = −0.50 MPa on the free end. We will model the cantilever beam to be fixed to the wall at one end(displacements of nodes at x = 0 are u = 0). We define our origin as the point at the beam’s centroid and the interfacewith the wall. These parameters are summarized below:
Refer to the walk-through provided in class to construct your model and perform the computational analysis. Don’thesitate to ask questions if you get stuck.Address the following question in your report:
(1) Describe (using words and figures) theu2 and u3 displacement fields present in the deformed beam. Explain thesources of the features of thesefields.
(2) Describe (using words and figures) theσxx and von Mises (σ) stress fields present in the deformed beam. Explainthe similarities and differences between these fields. Do you expect this beam to yield?
(3) Plot and discuss the FEA-computed and the Euler-Bernoulli displacement as a function of distance from the fixedend (x-direction). The beam deflection in thez-direction as a function of distance is
δz(x) =Fz
6EI(3L− x)x2, (7.1)
whereFz is the force applied along thez-axis of the beam andI = bh3
12 is the second moment of inertia.
(4) Plot and discuss the FEA-computed and the Euler-Bernoulli axial stresses (σxx, orS11 in Abaqus) in the tensile regionin thex-direction. Theσxx stress at the topmost yz-face of the beam is:
σxx(x) =Fz(L− x)
Z, (7.2)
whereZ = bh2
6 is the section modulus.
(5) Referring to your previous two plots, identify any major deviations between the FEA results and the results fromEuler-Bernoulli theory. Identify two possible sources reasons for any derivations you may see. Hint: Both E-Btheory and your FEA model may have shortcomings.
57
(6) Assume that the the tip displacement you find for this beam,δz(L), is smaller than you can tolerate in your applica-tion, but the beam itself is too heavy. Based on your FEA results, construction a new model in which 50% of the Al6070-T6 is replaced with polystyrene (E = 3 GPa,ν = 0.35), but such that the bending stiffness (K = Tz
δz(L) ) reducesonly by∼25% compared to the all-Al beam. Hints: Look at the von Mises stress field. Where can you tolerate amore compliant material? Also, it is very easy to copy and modify an Abaqus model!
Grading Rubric
Total Points Possible: 40• Introduction (3):
– 1 pt for correct title and their names.– 1 pts for exercise description.– 1 pts for noting why they are performing this study.
• Methods (4)– 1 pt for part dimensions and materials properties.– 1 pt for reporting element types.– 1 pt for meshing information.– 1 pt for loads and boundary conditions.
• Results/Discussion (21):– 4 pts for Part 1: 2 pts for including graphs with correct values. 2 pts for good written descriptions of the
observed behavior.– 4 pts for Part 2: 2 pts for including graphs with correct values. 2 pts for good written descriptions of the
observed behavior.– 3 pts for Part 3: 1 pt for showing/describing Euler-Bernoulli equation and model. 2 pt for correct analysis and
plots.– 3 pts for Part 4: 1 pt for showing/describing Euler-Bernoulli equation and model. 2 pt for correct analysis and
plots.– 3 pts for Part 5: Neither FEA or Euler-Bernoulli theory is correct. 1 pt for noting this somewhere, somehow. 2
pts for correct interpretation of model and theory limitations.– 4 pts for Part 6: 1 pt for correct approach. 2 pts for field plots and correct results. 1 pt for calculations of beam
stiffness.• Conclusion (5):
– 3 pts for complete summery of results.– 2 pts for providing some sort of overarching conclusion.
• Presentation (7): In general, take off points for any presentation errors.– Up to 2 pts for figure issues (e.g., scale factor, illegibility, captions, poor presentation)– Up to 2 pts for typos and spelling (including missing units).– Up to 2 pts for scientific presentation — formatting and scientific language.– 2 pts conciseness. I’ve told students that they need to be judicious in the information they present. They should
only include relevant figures (all the required figures are shown above, if they have many more than this, takepoints). Also, I’ve informed them that they should not reproduce line-by-line Abaqus instructions, so dockpoints if they do that, as well.
– 1 pts for citations (they may cite my slides or lecture), they need to cite their sources for their analyticalequations in some way.
58
331 ProblemsBasic chemistry review
Some basic problems having to do with the chemical structures of polymers.(1) Calculate the repeat unit molecular weights for each of the 22 polymers shown in the ’common polymers’ section
of the text.
(2) Draw Lewis diagrams illustrating the valence shell configurations for polystyrene, poly(methyl methacrylate) andpoly(dimethylsiloxane).
(3) Draw Lewis diagrams illustrating the valence shell configurations for amide, ester and urethane linkages.
Polymerization Reactions(4) Consider the following monomers:
a List all of the monomers that will polymerize by chain growth polymerization.
b Draw the repeat unit structures of 3 different polymer structures that can be formed from (c)
c Which monomers will react with each other to form a linear polyamide?
d Which monomers can you combine to produce a highly crosslinked polymer network by step growth poly-merization so that no condensation products are produced?
(5) Suppose a polyester is formed by combining 1.00 mol of a diacid (2 acid groups per molecule) with 1.01 mol of adialcohol in a homogeneous solution. The molecular weight of the diacid is 160g/mol and the molecular weight ofthe dialcohol is 180 g/mol.
a What is the highest value ofMnthat can be expected from this combination?
b How many grams of water will be produced during the polymerization reaction?
(6) Consider the following 5 monomers:
a Draw the repeat units for three linear polymers that can be produced by reactions between the monomers inthis list. Identify these polymers according to their type (polyamides, polyesters, etc.), and indicate whethereach polymerization reaction is condensation reaction or not.
b What combination of monomers from this list would you choose in order to produce a three-dimensionalnetwork?
(7)(8) “Living” polymerizations are chain growth polymerizations that proceed without termination or chain transferreactions.
a Discuss the conditions that must be met in order for polymers with a low polydispersity to be formed by aliving polymerization.
b What type of reactions must be avoided in order to produce block copolymers by radical chain growth poly-merization.
59
c Proteins are perfectly disperse copolymers, with a polydispersity index of exactly 1. While relatively monodis-perse polymers (Mw/Mn < 1.05) can be made by living polymerization methods like anionic polymerization,it is not possible to make perfectly monodisperse polymer by these methods, even when termination andchain transfer events are completely eliminated. Why is that?
(9)(10) Suppose nylon is formed in two separate batches by reacting the same sets of monomers with one another. In thefirst reaction, an extent of reaction of 0.999 is obtained. In the second reaction, an extent of reaction of 0.9999 isobtained. Assume that an ideal distribution of molecular weights is obtained for each reaction.
a What is the ratio ofMw for the second reaction toMw for the first reaction?
b Suppose equal weights of the polymers formed by these two reactions are mixed with one another. What isthe polydispersity index of the resultant mixture?
(11) Draw the chemical structures of the monomers from which the following polymers are formed.
(12) Find answers to the following problems:a Draw the repeat unit structure of a polyamide formed by a condensation polymerization involving a combi-
nation of the above molecules, and identify the condensation product.
b Draw the structure of a polymer formed by ring opening polymerization of one of these molecules.
c Which of the molecules shown above can be polymerized by chain growth polymerization? Draw thechemical structure of the resultant polymers.
(13) Suppose you want to sell a set of cheap plastic mugs which are suitable for drinking coffee. Briefly discuss thepotential applicability of the following materials for this purpose:
(a) atactic polystyrene
(b) atactic poly(vinyl chloride)
(c) high density polyethylene
(14) Consider the the piece of the highly crosslinked chemical structure shown below.
60
a Draw the chemical structures of the two different monomers that were used to form this material. (Note thatthe R groups just represent connections to the rest of the material, they are not part of the structures you needto draw).
NH
NH
NH
NH
NH
O
OO
O
O
O
O
O
O
NH
NH
NH
R
R
R
NH
b What type of polymer is this (polyester, polyamide, polyurethane, epoxy, etc.)
c Next to each structure that you have drawn in part a, indicate its chemical functionality.
d What is the relative amount of each of the two monomers from part a (in moles) that you should be added toone another to optimize the polymerization?
e Assuming that the two monomers are added together in optimum proportions you mentioned in part d, whatfraction of reactive groups need to react to form an insoluble gel.
The Glass Transition(15) An amorphous polymer hasT∞ = 50C. The thermal expansion coefficient in the glassy state is3× 10−4/C, and
the thermal expansion coefficient in the liquid state is4.5× 10−4/C.a Calculate the glass transition temperature if the fractional free volume at the glass transition is 0.025.
b The glass transition temperature measured at a different cooling rate is found to correspond to a fractionalfree volume of 0.021. Is this cooling rate higher of lower than the cooling rate from part a?
(16) Rank these three polymers in the order of highTg to lowTg, and provide an explanation for your prediction:
Polystyrene
CH2 C
H
Poly(para butylstyrene)
CH2 C
H
CH2
H2C
CH2
H3C
Poly(α-methylstyrene)
CH2 C
CH3
(17) The DSC curves below correspond to the 3 polymers listed below. Identify which is which, and identify on thecurves any crystallization (Tc), glass transition (Tg) or melting (Tm) temperatures, and give your reasoning in eachcase.
61
a Atactic polystyrene being heated from room temperature to 200oC.
b High density polyethylene being cooled from 200oC to room temperature.
c Poly(ethylene terephthalate) that had originally been cooled rapidly from 300oC to room temperature, and isnow being slowly heated from room temperature back up to 300oC.
(18) Short, bulky side groups (like methyl of phenyl groups) increase the fractional free volume required for the motionof polymer chain segments, whereas long, thin groups (like the n-butyl group -CH2CH2CH2CH3 ) increase theavailable free volume.
a Describe how each of these two types of groups is expected to affect the glass transition temperature.
b Polymers with very little flexibility along the backbone of the polymer chain have very high glass transitiontemperatures. Give a brief explanation for this in terms of free volume theory.
Chain Dimensions(19) The value ofR0, the rms (root mean squared) end-to-end distance for a polystyrene molecule in the bulk material
(no solvent) is 200Å. The molecular weight, M, of this molecule is 100, 000 g/mol.a What is the rms end-to-end distance for a polystyrene molecule with M=250,000 g/mol?
b What is the characteristic ratio (C∞) for polystyrene?
c What is the statistical segment length (equivalent length of a repeat unit in a random walk model of chaindimensions) for polystyrene?
d The volume pervaded by a single molecule is given approximately byR30. For a polystyrene molecule with
M=250, 000 g/mol, compare this volume to the volume actually occupied by the polystyrene molecule. Howmany different molecules overlap with one another in polystyrene with this molecular weight?
e Consider a simple model of polystyrene for which all of the bonds are in either gauche or trans configurations.What fraction of bonds are in the trans configuration?
(20) Consider a simple model for the chain dimensions of amorphous poly(vinyl chloride) where only trans and gauchebonds are possible.
Poly(vinyl chloride) Trans Configuration Gauche Configuration
a What fraction of the backbone bonds are in the gauche configuration ifC∞ for the polymer is 8?
b Calculate the statistical segment length of a repeat unit, assuming the value ofC∞ from part a.
(21) What fraction of molecules in an equilibrated amorphous polymer melt have end-to-end vectors with magnitudeslarger than the root-mean-square end-to-end distance? (note – this will require a numerical or graphical solution.);
62
Mechanical Properties(22) A thermoset is cooled to a very low temperature. As the temperature is increased, the elastic modulus remains
roughly constant untilTg, at which point the elastic modulus rapidly decreases. Above the glass transition temper-ature the elastic modulus slowly increases. Describe in qualitative terms what is going on at the glass transition,and why the modulus actually increases slightly aboveTg.
(23) Values of Young’s moduli (E) for elastomers are typically near106 Pa (1 MPa).a What is the average molecular weight between crosslinks for a polymer with this value of E? Assume the
polymer has a specific gravity of 1. What fraction of cis 1-4 polyisoprene repeat units contain crosslinks if themodulus is106 Pa?
b Plot the predicted tensile stress/strain curve for this material for engineering strains from -0.5 to 2 (extensionratios from 0.5 to 3).
c The yield point of a material is often defined as the onset of nonlinear behavior in the stress-strain curve. Canthis definition be used for an elastomeric material that is deformed in tension? Why or why not?
(24) Suppose a sample of Sylgard 184 is cured, and the degree of polymerization of the prepolymer is 60. Estimate thevalue for both the shear modulus and Young’s modulus of this polymer. Describe any assumptions that you’vemade.
(25) Consider the deformation behavior of a uniaxially stretched rubber.a Plot the free energy of a uniaxially stretched rubber as a function of the extension ratio fromλ = 0.1 (compres-
sive strain toλ =4 (tensile strain). (The extension ratio of interest here corresponds to the direction in whichthe rubber is stretched.)
b At what value of the strain is the free energy minimized?
c For what compressive value of the extension ratio is the free energy of the rubber equal to the free energy ithas for an extension ratio equal to 4?
(26) Calculate the force required to fix the ends of a 1,4 polyisoprene molecule with M = 100,000 g/mol at the separationof 1000Å. AssumeC∞ = 8, and that the double and single bonds have equal lengths of 1.54 Å.
(27) Consider a material which is defined between two circular plates that are parallel to one another. Each plate has adiameter of 2.5 cm, and the plates are separated by 1mm.
a Calculate the maximum shear strain at the outer periphery of the disks, if the top disk is rotated by1withrespect to the bottom disk.
b Calculate the torque required to rotate the top plate by1, in terms of the magnitude of the complex shearmodulus,G∗. (You will need to integrate contributions from all portions of the disk, keeping in mind that thelocal stress is equal to the shear modulus multiplied by the local strain.)
c Suppose the material between the two plates is a purely viscous fluid (G′ = 0 at the appropriate frequency),and that the viscosity of the fluid is 1000 Pa-sec. Calculate the magnitude of the torque which must be appliedto give a sinusoidal rotation with a magnitude of1. Assume that the angular frequency of the applied torqueis 100 radians/second.
(28) Consider a polymer with a density of 1g/cm3 that has the following relaxation modulus at room temperature(themolecular weight is much higher than the average molecular weight between entanglements).
G(t) = G1 exp(−tτ1
)+ G2 exp
(−tτ2
)SupposeG1 = 109 Pa ,G2 =3x10⁵ Pa,τ1 =10−6 s andτ2 = 1 s.
a Calculate the zero shear viscosity for this polymer.
63
b Is this polymer crosslinked? How do you know?
c Calculate the average molecular weight between entanglements.
d Describe what happens toτ1 andτ2 when the temperature is increased (do they remain constant, increase ordecrease)?
e What vibrational frequencies do you expect to be most efficiently damped by this polymer?
f Describe what happens toτ1 andτ2 when the molecular weight of the polymer is increased (do they remainconstant, increase or decrease)?
(29) Consider a polymer with the behavior of the relaxation modulus (G (t)) and temperature shift factor(aT) plottedbelow. Assume the polymer has a density of 1 g/cm3.
10−8
10−7
10−6
10−5
10−4
10−3
10−2
10−1
100
102
104
106
108
1010
t/aT (s)
G(t
) (P
a)
T (°C)
80 100 120 140
log(a
T)
-4
-3
-2
-1
0
1
a Describe in qualitative terms what is going on at each of the two characteristic values oft/aT whereG (t)decreases substantially.
b Is this polymer crosslinked? Briefly explain your answer.
c Estimate the entanglement molecular weight for this polymer.
d Estimate the viscosity of this polymer that is obtained at very low shear rates, at a temperature of 40C.
e What is the ratio of viscosity of the polymer at -40C to the viscosity at 40C?
f (5 points) Suppose thatG′ (ω) is measured at a very high frequency of109 s−1. What value ofG′ do you expectto obtain from this experiment.
(30) Determine the shift factors as a function of temperature for poly(t-butyl acrylate) (PtBA), using 75C as the referencetemperature. Plot these shift factors as a function of temperature, and determine a value forT∞ by fitting to the Vogelequation. Compare this value ofT∞ toTg for PtBA. Values ofG′ andG′′ at different temperatures are included in thedata tables at the end of the text.
(31) Determine the zero shear viscosity of PtBA with M=350,000 g/mol at75C.
(32) Determine the entanglement molecular weight,Me, for PTBA. Assume a density of 1 g/cm3for PtBA.
(33) Repeat the previous 3 problems for poly(2-vinylpyridine) with a molecular weight of 82,000 g/mol, using160Cas the reference temperature (whereaT = 1), and130 C for the viscosity calculation. (Data included with the datatables at the end of the text).
(34) An elastomer is made from a poly(n-butyl acrylate) precursor molecule with double bonds at either end that are
64
able to react with a tetrafunctional crosslinker. The chemical structure is shown at the left below, and a schematicrepresentation of the crosslinked structure is shown at the right.
O
ONM0=128 g/mole
density = 1.0 g/cm3
N=100
a=0.7 nm
Tg=-45 C
Crosslinks
g Calculate the shear modulus, G, for this material at room temperature.
h Give Young’s modulus (E) and the Poisson’s ratio (ν) for this material.
i What is the root mean square end-to-end distance⟨
R2⟩1/2 for crosslink points at either end of the one of theprecursor chains when the material is in its undeformed state?
j What is the value ofC∞ for poly(n-butyl acrylate)?
k Express the deformation free energies of the elastomer, divided by the shear modulus,G, for the followingstrain states:
i. Simple shear at a shear strain,γ, of 1.
ii. Uniaxial extension to an engineering strain of 100 % (λ = 2).
iii. Uniaxial compression to a engineering strain of -50% (λ = 0.5).
(35) For each if the following pairs of quantities, circle thelargest one. If you expect them to have the same value, write’same’.
quantity 1 quantity 2The thermal expansion coefficient of poly(n-butyl
acrylate) at temperaturesabove -45 C.The thermal expansion coefficient of poly(n-butyl
acrylate) at temperaturesbelow -45 C.the free volume for a poly(n-butyl acrylate)
sampleabove -45 C.the free volume for a poly(n-butyl acrylate)
samplebelow -45 C.Thefree energy of an undeformed poly(n-butyl
acrylate) sample.Thefree energy of poly(n-butyl acrylate) sample at a
shear strain of 0.3Theentropy of an undeformed poly(n-butyl acrylate)
sample.Theentropy of poly(n-butyl acrylate) sample at a
shear strain of 0.3Tg for poly(n-butyl acrylate) Tg for poly(methyl acrylate) (where the 4-carbon
butyl group in poly(n-butyl acrylate) is replaced by amethyl group.
Crystallinity(36) Consider a polyethylene molecule with a molecular weight of 150,000 g/mol.
a Estimate the number of times the molecule folds back on itself within a lamellar crystallite with a thickness
65
of 100Å. Assume for the purposes of this calculation that the molecule remains in the crystallite, and does notmove into the amorphous regions of the polymer.
b From your answer to part a, what can you say about the ability to stretch a polymer molecule in a semicrys-talline polymer without breaking any bonds?
(37) Describe how axis of the unit cell in polyethylene is oriented with respect to a spherulite, with respect to an indi-vidual lamellar crystallite, and with respect to the molecular chain axis.
(38) Consider a polymer that crystallizes with an orthorhombic unit cell (all angle= 90). The polymer has a carbonbackbone, and crystallizes with a 4*1/1 helical structure. The unit cell dimension are a=10.4Å, b=5.3Å with 1.27Åper backbone carbon along the c axis. The molecular weight of a polymeric repeat unit is 125 g/mol, and there aretwo of these units per unit cell.
c What is the theoretical density of a completely crystalline version of this polymer (100% crystalline)?
d The percent crystallinity of a sample with a density of 1.35 g/cc is 60%. What is the density of the amorphousregions of this polymer?
(39) Poly(ethylene terephthalate) has a relatively high equilibrium melting point (265 °C), but the polymer at roomtemperature is almost completely amorphous. Based on this result, do you expect thatTg for PET is above roomtemperature or below room temperature? Explain your reasoning.
(40) Consider two perfect single crystals of polyethylene and polypropylene. Polypropylene forms a 3/1 helix, andpolyethylene forms a 2/1 helix. Which of these single crystals would you expect to have a higher modulus alongthe C axis? Include in your discussion the relative importance of bond bending and bond rotation during elasticdeformation of the two materials. Also mention the importance of the lateral packing (i.e., the number of helicesper unit area in the AB plane).
(41) High density polyethylene has an equilibrium melting temperature of 138 °C. Two identical batches of this polymerare crystallized at different temperatures: one at 100 °C and one at 125 °C. Describe one important difference in theresulting structures of these two semicrystalline polymers, and explain the origin of the difference.
(42) A linear homopolymer was crystallized from the melt at crystallization temperatures (Tc) within the range 270K to330K. Following complete crystallization the following melting temperatures (Tm) were measured by differentialscanning calorimetry (DSC).
Graphically determine the equilibrium melting temperature,T0m.
(43) Small angle x-ray scattering experiments using x-rays with a wavelength of 1.54 Å were used to measure the dis-tance between crystalline regions. Peaks corresponding to the lamellar period were obtained at the followingangles:
a Use the Bragg equation to calculate the values of the lamellar period for each crystallization temperature.
b The degree of crystallinity was measured to be 45% for all samples. Calculate the lamellar thickness in eachcase, and use this information to graphically obtain the fold surface energy,γe. Assume the enthalpy of fusionof the polymer is 150J/cm3, and the value of the equilibrium melting temperature from the previous problem.
(44) Poly(ethylene oxide) (PEO) is a semicrystalline polymer with melting point of 65C and a glass transition temper-ature of -60C. Suppose a series of crystalline samples is made by performing the crystallization at temperatures of40C and 60C.
a Describe any differences you expect rate of crystallization, and the crystal thickness`c, at these two tempera-tures. Be as quantitative as possible.
b Suppose the two samples are slowly heated. Describe any differences you expert to observe in the meltingtemperatures for these two samples.
c PEO is always crystalline at room temperature, but PET is often amorphous at room temperature, even thoughPET has a much higher melting temperature than PEO. Why is this?
Liquid Crystals(45) Consider the liquid crystalline texture from the nematic liquid crystal texture page of a nematic liquid crystalline
material confined between two crossed polarizers.a Give an example of the type of defect that can lie at the places where 4 dark bands come together. (show how
the molecules are oriented in these regions)
b Describe why alternating light and dark bands emanate from these defect points.
c Is it possible to obtain a completely black image from a sample that has good nematic order? If so, describe asituation where this would be the case.
Thermodynamics of Solutions and Blends(46) Which contribution to the free energy (enthalpy of entropy) dominates at low temperature?
(47) What are the signs of4hmixand4smixfor a system which has an LCST phase diagram?
(48) For what values ofχ will a polymer be able to completely dissolve in a small-molecular solvent?
(49) Measured values ofχ for a blend of polymer A with polymer B have the following temperature dependence:
χ =0.326
T− 2.3× 10⁻⁴
where T is the absolute temperature.Consider a blend withNa = 2500, Nb = 3500
a What is the predicted critical composition, and the predicted critical temperature for this blend?
b Plot free energy curves (free energy as a function of composition) forχ/χcrit= 1.1, 1.2, 1.3, 1.4, and 1.5. Usingthe common tangent construction from these five curves, construct a phase diagram withχ/χcrit on the verticalaxis and the blend composition on the horizontal axis.
(50) Consider the following phase diagram:
67
a Is the enthalpy of mixing positive or negative for this system?
b Is the entropy of mixing positive or negative for this system?
c Draw free energy of mixing vs. composition curves at100, 150, 200 that are consistent with this phase dia-gram. Show any common tangents points and points of inflection.
(51) Consider a polymer/solvent mixture for which the ratio of polymer to solvent volume is 10,000.a Determine the critical value of the chi parameter (χcrit)
b What is polymer volume fraction at the critical point?
c Plot the solvent chemical potential for this system as a function of polymer volume fraction forχ/χcrit =0.9, χ/χcrit = 1.0, χ/χcrit = 1.2, χ/χcrit = 1.5.
d Suppose that the polymer is dipped into a pure solvent (solvent chemical potential equals zero). Solvent willdiffuse into the polymer until the solvent chemical potential in the polymer reaches zero. From the plots madefor part c, determine the equilibrium solvent volume fractions forχ/χcrit = 1.2, andχ/χcrit = 1.5.
(52) Describe in your own words why most pairs of different types of polymers do not mix with each other in the liquidstate.
(53) Most liquids mix better at high temperatures than they do at low temperatures. However, polymeric liquids oftenmix better at low temperatures than high temperatures. Explain in as much detail as possible why this is the case.
(54) Consider the following osmotic pressure data obtained for polyethylene oxide solutions in water (1MPa =106 Pa)at 20 °C.
a Plot the osmotic pressure as a function of the polymer volume fraction, using logarithmic axes for both the
68
pressure and the polymer volume fraction. On the same plot, include the Flory Huggins expression forΠ,using the value ofχ that gives the best fit to the data.
b Repeat part a, but now compare the data to the scaling expression forφ in the semidilute regime (Eq.), wherea3o/vs
is the adjustable parameter. (Note thatvs is the solvent molecular volume, obtained from the molar volume,Vs,by dividing byNav).
(55) Use the PEO solution data from the previous page to calculate the following:a The concentration of PEO at20C that gives an osmotic pressure large enough to support a column of water
that is 100 meters tall.
b What is the correlation lengthξ, for a PEO solution in water withφP = 0.1?
c For charged molecules, the osmotic pressure is often dominated by the counterions. Suppose a solution ofsodium polyacrylate at a concentration of 0.05g/cm3is made in water. Estimate the osmotic pressure, assumingthat the counterions can be treated as an ideal gas.
CH2 C
H
ONa+ -O
(56) The interfacial free energy characterizing the interface high molecular weight versions of polystyrene (PS) andpoly(2-vinyl pyridine) (P2VP) is3x10−3 J/m2 at 180 °C. Assume the volume per repeat unit is the same for bothpolymers (165Å
3, and use this as your reference volume. Also assume that the statistical segment length for both
polymers is 6.7 Å.
PS
CH2 C
H
P2VP
CH2 C
H
N
a What isχ for the PS/P2VP system at 180 °C?
b Suppose PS and P2VP polymers with equal degrees of polymerization are mixed with one another. What rangeof molecular weights will form mixtures that are completely miscible with one another at all compositions at180 °C?
c Suppose monodisperse PS and P2VP samples with degrees of polymerization of 1000 are mixed with oneanother. What is the solubility of the PS in the P2VP at 180 °C? (hint: for a symmetric system like this, whereboth degrees of polymerization are equal to one another, the common tangent construction is satisfied at thepoint where the first derivative of the free energy of mixing with respect to volume fraction is equal to zero).
(57) Use the data from the PS/P2VP system from the previous page to answer the following questions:a A diblock copolymer is synthesized that has a PS block with a degree of polymerization of 500 attached to a
2nd block with a degree of polymerization of 500. Calculate the periodicity of the lamellar structure that isformed by this material at equilibrium.
b Describe in qualitative terms the equilibrium geometries of the structures formed when the P2VP block lengthis fixed, but the PS block degree of polymerization is steadily increased.
(58) Poly(n-isopropylacrylamide) (chemical structure shown below) exhibits a lower crtical solution temperature inwater. It is fully soluble in water at temperatures below 32C, but the phase diagram with water has a two phaseregion for temperatures above 32C.
69
CH2 C
H
OHN
CH3H3C C
H
a The temperature dependence ofχ for the Poly(n-isopropylacrylamide)/water system can be written in thefollowing form:χ = A + BT, whereA andB are constants andT is the temperature inC. What is the sign(positive or negative) ofB in this equation?
b Is the entropy of mixing for this system positive or negative? Briefly explain your answer.
c Calculate the osmotic pressure of an aqueous solution of high molecular weight poly(n-isopropylacrylamide)with a polymer volume fraction of 0.2.
Capillarity(59) A hollow glass tube is immersed in water as shown in the illustration below:
a Calculate the internal tube diameter that gives a capillary rise of 10 cm, assuming that water completely wetsthe glass (contact angle of zero).
b Calculate the capillary rise if the same glass tube from part a is coated with a thin layer of polystyrene, chang-ing the contact angle to 90 .
(60) Solve the following problems:a Calculate the force required to push a cylindrical fiber with a radius of1 µm into water, if the contact angle the
fiber makes with the water is130.
b What stress can be supported if you create an array of these fibers on a square lattice, with a spacing betweenfiber centers of4 µm? (Assume the density of the fibers is equal to the density of water, so you don’t need toworry about forces due to buoyancy).
c How much weight could be supported by an object like this with a total area of1 cm2?
331 Computational Exercises(61) In binary blends where the two components have very different molar volumes (often the case with polymers), the
following form of the free energy expression is commonly used:
v0Gv
kBT=
φblnφbNb
+(1− φb) ln (1− φb)
Na+ χφb (1− φb)
The expressions for the chemical potentials for the A and B molecules are given by the following expression:
µa
kBT= ln (1− φb) + φb (1− Na/Nb) + χNaφ2
b
70
µbkBT
= ln (φb) + (1− φb) (1− Nb/Na) + χNb (1− φb)2
Here Gv is the free energy per volume, φbis the volume fraction of B in the system, and Na and Nbare proportionalto the molecular volumes of the two components. The quantity v0 is a reference volume, so the molecular volumeof the ’A’ molecule is v0Na and the molecular volume of the ’B’ molecule is v0Nb. Adapt the MATLAB script belowto do the following:
1 global na nb chi % these values also get used in function definitions2 set(0,'defaultaxesfontsize ' ,16)3 set(0,'defaultlinelinewidth ' ,2)4 phi=linspace (0.001 ,0.999 ,1000);5 na=150;6 nb=100;7 chi =0.02;8 % fv is the expression for the free energy of mixing9 fv=@(phi) phi.*log(phi)/nb+(1-phi).*log(1-phi)./na+chi.*phi.*(1-phi);10
11 %mua and mub are the chemical potentials of A and B12 mua=@(phi) log(1-phi)+phi*(1-na/nb)+chi*na*phi .^2;13 mub=@(phi) log(phi)+(1-phi)*(1-nb/na)+chi*nb*(1-phi)^2;14
15 % now write the function that is equal to zero when the A and B chemical16 % potentials are equal to one another for phi=phi (1) and phi=phi(2)17
25 % start with a guess for the equilibrium volume fractions26 phiguess = [0.2; 0.8]; % Make a starting guess at the equilibrium compositions27 [phicalc ,fval] = fsolve(ftosolve ,phiguess); % Call solver28
29 % now we add the tangent line30 slope =(fv(phicalc (2))-fv(phicalc (1)))/( phicalc (2)-phicalc (1));31 intercept=fv(phicalc (1))-slope*phicalc (1);32 tangentline=intercept+slope.*phi;33 hold on34 plot(phi ,tangentline ,'r')35 hold off36 title (['\chi=' num2str(chi) ', N_a=' num2str(na), ', N_b=' num2str(nb)], 'fontsize ', 11)37
38 % now save the plot as a jpg file39 saveas(gcf ,'commontangent.jpg');40
41 % this saves the file a .eps file , used to embed the figure into the42 % solution set - students can comment out this next line if they don 't wan43 % the .svg file44 print(gcf ,'-dsvg','commontangent.svg')
a Plot the free energy expression χ = 0.02, Na = 200, and Nb = 100, along with its common tangent construc-tion, and report the values of the equilibrium compositions of the two phases. Include the plot with yoursolution.
b Repeat the previous calculation for χ = 0.025 and χ = 0.05 (you may need to adjust the initial guess for thevolume fractions).
c Decrease χ to the critical value, χcrit, which can be calculated analytically. Include a plot of Gv as a function ofφb for value of χ.
(62) Extend work from the previous problem to obtain a MATLAB code that generates the full phase diagram (with χon the vertical axis and φb on the horizontal axis) for a system with Na = 200 and Nb = 100. Show both the bimodaland spinodal curves, and turn in a printout of your actual MATLAB code.
Hint: You’ll want to solve the equations for a variety of χ values above the critical value of χ, which you cancalculate analytically. You can use a ’for’ loop in MATLAB to do this. Calculation of the spinodal curve is pretty
71
easy, because there’s an analytic expression for that. When you’re developing your initial guesses for the bimodalcompositions to pass to the ’fsolve’ command, keep in mind that the bimodal compositions must lie outside thespinodal compositions. This can help you develop sensible guesses to use for this quantity.
72
351-1 Problems(1) Newton’s Laws Can be derived from Hamilton’s equations.
a Identify the Hamiltonian from conservation of energy using only momentum p (for Kinetic Energy) and posi-tion x (for potential Energy):
H = KE + PE
Use the Hamiltonian for a particle in a 1-D quadratic potential like a mass on a spring. What is KE, PE?b Hamiltion’s equations are
dρdt = − ∂H
∂xdxdt = ∂H
∂ρ
Show these give Newton’s laws of motion for the mass on a spring.c Derive the 1-D differential equation of motion from Hamilton equation. For a particle of total energy E and
spring constant k,x = 0 at t = 0, what is the equation of motionx(t). what is p(t). show the region of PhaseSpace (p vsx) that describes the particle throughout its motion.
d Use the equipartition theorem (where <A> is time average of A, and i is index for each spatial dimension):⟨pi
∂H∂pi
⟩=⟨
xi∂H∂xi
⟩= kBT
to derive the relationship between thermal velocity and temperature 12 mv2
th = 32 kBT
e Derive the Dulong-Petit law for atoms in a 3-D potential from the equipartition theorem:
〈E〉 = 3kBT
f What is the heat capacity C = dE/dT in this case?(2) Problem 1.1 from Solymar and Walsh:
A 10 mm cube of germanium passes a current of 6.4 mA when 10 mV is applied between two of its parallel faces.Calculate the resistivity of the sample. Assuming that the charge carriers are electrons that have a mobility of 0.39m2V−1s−1, calculate the density of carriers. What is their collision time if the electron’s effective mass in germaniumis 0.12 me where me is the free electron mass?
(3) Give a one line description of each of these experiments and their significance to modern physics: Photoelectric Ef-fect, Compton Effect, Black Body Radiation, Rutherford Backscattering (Bohr model), Electron Diffraction, Atomicspectra.Classical: https://www.youtube.com/watch?v=yXsHflXB7QMBohr Atom: https://www.youtube.com/watch?v=ydPzEZTd-98Wave Particle Duality - photoelectric effect: https://www.youtube.com/watch?v=frNLtEm1glgSchrödinger waves: https://www.youtube.com/watch?v=C8XGIYz1PCwProbability interpretation: https://www.youtube.com/watch?v=p7xIKoBdViYCompton Effect: https://www.youtube.com/watch?v=0Y648TNGAIo
(4) Problem 2.1 from Solymar and Walsh.Find the de Broglie wavelength of the following particles, ignoring relativistic effects:(i) an electron in a semiconductor having average thermal velocity at T = 300K and an effective mass of m∗e = amo,(ii) a helium atom having thermal energy at T = 300K(iii) an α particle (He4 nucleus) of kinetic energy 10 MeV.Hint: See question 1. For a gas of non-interacting particles, 1
2 mv2th = 3
2 kBT .(5) A particle of mass, m, is confined to a 1-D region 0 ≤ x ≤ L . In class, we derived the following stationary state
wavefunctions and energies for this 1-D infinite square well potential:
ψn(x) = Asin(πn
Ls)
a Normalize the wave function to find the value of A.b Find the Energy of these stationary states
Assuming that the initial normalized wavefunction of this particle att = 0 is:
Ψ(x, t = 0) =
√8
5L
[1 + cos
(π
Lx)]
sin(π
Lx)
a Derive an expression for the wavefunction Ψ(x, T), at all later times t > 0.b Show that the probability of finding the particle in the left half of the box (i.e., in the region 0 ≤ x ≤ L/2) at
(6) Assuming that Ψ(x,t) is a solution of the 1-D Schrödinger Equation, the current density is defined as:
J(x) = − ihe2m
[Ψ∗
∂Ψ∂x−Ψ
∂Ψ∗
∂x
]In this problem, consider the potential barrier of height (V) and width (d) that is depicted in Fig. 3.3 of Solymarand Walsh. Assume that the electron energy (E) is less than V.
a By applying suitable boundary conditions and your knowledge of quantum mechanics, develop a system ofequations that could be solved to determine the transmitted current through the barrier (Jt) in terms of theincident current on the barrier (Ji).
b By solving your system of equations from part (a), show that:
Jt
Jt=
1
1 + V2
4(V−E)E sinh2(γd)
where γ =
√2m(V−E)
h and sinh(γd) = 12 (e
γd − e−γd)
c In the limit where γd 1, show that: JtJt= 16(V−E)E
V2 e−2γd
d The exponential dependence of the “tunneling” current on distance is utilized for atomic resolution imagingof conductive surfaces with the scanning tunneling microscope (STM). Conservatively assume that the STMcan detect changes in the tunneling current of 1%. Under typical tunneling conditions (e.g., V − E 1eV, d ~ 10Å), estimate the vertical spatial resolution of the STM. Hint: The answer can be expressed in picometers (10−12
m)!(7) Derive the solution of the 2-D particle in a box (particle is constrained in both x, and y directions; V → ∞ at the
boundaries).a Solve for the energies and wave functions of the ground and first excited states.b What is the degeneracy of the first excited state?c Plot the probability distributions 2 ψ of the first excited states as surface plots.d Optional: plot probability distributions of the ground state, first excited states, and 2nd excited states, and
comment on the evolution.(8) Consider the infinite spherical well: V(r) = 0 if r ≤ a, V(r) = ∞ if r > a .
a For l = 0, determine the allowed energies (En).b For l = 0, show that the corresponding wavefunctions are:
Ψn(r) =1√2πa
sin(nπr/a)r
In class, we worked through the Schrödinger equation in spherical coordinates for spherically symmetric potentials by breakingthe solution into radial and angular functions. You should be able to solve the radial equation for the conditions given here.
(9) Consider the infinite spherical well: V(r) = 0 if r ≤ a, V(r) = Vo if r > a.a For l = 0, show that there is no bound state if: Voa2 < π2 h2
8m . This can be shown without resorting to numericalcomputation.
b Given Vo = 2hπ2
ma2 , find the energies of the two bound states by graphing in MATLAB or Excel. You can alsouse MATLAB to check your solution by solving the transcendental equation directly.
This problem is analogous to the finite square well problem solved in 3.8 of Solymar and Walsh, but in the spherical coordinatesystem. Through the appropriate application of boundary conditions, you should arrive at a transcendental equation whoseargument can be analyzed to establish the condition for the existence of bound states.
(10) Suppose that the nucleus of a hydrogen atom is located at a distance d from a two-dimensional infinite potentialwall which, of course, tends to distort the hydrogen atom. As d approaches zero, determine the following items:
a The ground state wavefunction.b The degeneracy of the first excited state (ignore degeneracy due to spin).c The wavelength of light that is emitted upon transition between the first excited state and the ground state
(express your answer in nanometers).With the exception of part (c), this problem does not involve mathematical calculation. The proper choice of coordinate systemcan make the relationship between these solutions and the usual hydrogen atom solutions clear. Bear in mind that the groundstate refers to the lowest energy state that exists.
(11) Consider a double finite potential well in one dimension. Suppose that the depth V0 and the width a are fixed suchthat the following equation is obeyed:
β2 =V0ma2
2h2 = 4π2
74
(12) Qualitatively sketch the ground state wavefunction ψ1and the first excited state wavefunction ψ2 for: (i) b =0, (ii)b = a/2, and (iii) b a.
a For b = 0, show that the ground state energy (E1) is given by: E1 =h2x2
12ma2 , where x1 is the solution of the
following equation: tanx1 =
√(2βx1
)2− 1 . CalculateE1 in units of h
ma2 .
b Forb = 0, show that the first excited state energy (E2) is given by: E2 =h2x2
22ma2 where x2 is the solution of the
following equation: −cotx2 =
√(2βx2
)2− 1 . Calculate E2 in units of h2
ma2 .
c For b a, estimate E1 and E2 in units of h2
ma2 .d Use the MATLAB code derived from Garcia, R., Zozulya, A. & Stickney, J. MATLAB codes for teaching quan-
tum physics: Part 1. arXiv physics.ed-ph, (2007). http://arxiv.org/pdf/0704.1622.pdfConsult the original publication for background on the code, which is reproduced below.
i. What is the Heaviside function? How is it used in this code (for what purpose)?ii. Using the MATLAB code, generate the plots you sketched in part (a) (ground and first excited states for
b=0, b=a/2, and b>>a). You should have three graphs with two curves on each. Label the graphs and thewave functions.
iii. Generate 2 more plots with intermediate barrier widths, and sketch the trends in E1 and E2 as a functionof barrier width (you should have 5 different widths).
Note: in the code, you can change the potential profile quite easily (e.g. the quadratic harmonic oscillator potential orsingle square well). Parameters can be varied to develop insight into how the wavefunctions vary with the potentials.
e Provide a physical explanation for the variation of E1 with b that you observed in part (e).f The double well is a primitive one dimensional model for the potential experienced by an electron in a di-
atomic molecule (the two wells represent the attractive force of the nuclei). If the nuclei are free to move, theywill adopt the configuration of minimum energy. In view of your conclusions in (b), does the electron in theground state (E1) tend to draw the nuclei together or push them apart? What about E2? Provide a physicalreason for these behaviors, considering your answer to the previous question.
1 % ****************************************************************2 % Program 4: Find several lowest eigenmodes V(x) and3 % eigenenergies E of 1D Schrodinger equation4 % -1/2* hbar ^2/m(d2/dx2)V(x) + U(x)V(x) = EV(x)5 % for arbitrary potentials U(x) %
****************************************************************6 % Parameters for solving problem in the interval -L < x < L7 % PARAMETERS:8 L = 5;% Interval Length9 N = 1000; % No of points10 x = linspace(-L,L,N)';% Coordinate vector11 dx = x(2) -x(1); % Coordinate step12
13 % POTENTIAL , choose one or make your own14 U = 1/2*100*x.^(2); % quadratic harmonic oscillator potential15 %U = 1/2*x.^(4); % quartic potential16
17 % Finite square well of width 2w and depth given18 %w = L/50;19 %U = -500*( heaviside(x+w)-heaviside(x-w));20
21 % Two finite square wells of width 2w and distance 2a apart22 %w = L/50; a=3*w;23 %U = -200*( heaviside(x+w-a) -heaviside(x-w-a) ...24 % + heaviside(x+w+a) -heaviside(x-w+a));25
26 % Three -point finite -difference representation of Laplacian27 % using sparse matrices , where you save memory by only28 % storing non -zero matrix elements29 e = ones(N,1); Lap = spdiags ([e -2*e e],[-1 0 1],N,N)/dx^2;30
32 % constants for Hamiltonian H = -1/2*( hbar ^2/m)*Lap + spdiags(U,0,N,N);33
34 % Find lowest nmodes eigenvectors and eigenvalues of sparse matrix35 nmodes = 3; options.disp = 0;36 [V,E] = eigs(H,nmodes ,'sa',options);% find eigs37 [E,ind] = sort(diag(E));% convert E to vector and sort low to high38 V = V(:,ind); % rearrange corresponding eigenvectors39
40 % Generate plot of lowest energy eigenvectors V(x) and U(x)41 Usc = U*max(abs(V(:)))/max(abs(U)); % rescale U for plotting42 plot(x,V,x,Usc ,'- k '); % plot V(x) and rescaled U(x)43
44 % Add legend showing Energy of plotted V(x)45 lgnd_str = [repmat('E = ',nmodes ,1),num2str(E)];46 legend(lgnd_str) % place lengend string on plot
(13) Consider a cesium chloride crystal where the potential energy per formula unit is:
E(r) =Arn −
Me2
4πε0r
whereA is a constant, n > 1, r is interionic distance, andM is the Madelung constant.a Express the binding energy (E0) in terms of M, n, r0, and fundamental constants. Hint: first express A in terms
of these constants by considering the equilibrium condition.b The cesium chloride crystal structure consists of cations located on a simple cubic lattice (lattice constant = a)
with an anion located at the center of the cube. What is the volume per formula unit (v) in terms of r?c From thermodynamics, the bulk modulus (B) is known to be: B = v ∂
∂v
(∂E∂v
).Show that Bo is of the form
B0 = Cro
d2Edr2 |r=ro , and find C. Hint: use your result from the previous problem to rewrite the derivatives in terms of r.
d Using the result from part (c), express the equilibrium bulk modulus (B0) in terms of M, n, r0, and fundamentalconstants.
e The experimentally determined values of B0 and r0 for CsCl are 19.8 GPa and 3.571 Å respectively. CalculateE0 for CsCl in eV. Note: M = 1.7627 for CsCl.
76
351-2 Problems(1) An abrupt Si p-n junction hasNa = 1018cm−3 on one side andNd = 1015cm−3on the other.
a Calculate the Fermi level position at 300K on both sides.
b Draw an equilibrium band diagram for the junction.
c Determine the contact potentialΦo for this junction.
(2) A siliconp+ − n junction10−2cm2 in area hadNd = 1015cm−3 doping on the n-side. Calculate the junction capaci-tance with a reverse bias of 10V.
(3) For metallic aluminum, calculate:a The valence electron density.
b The radius of the Fermi spherekF.
c Fermi energy in eV.
(4) From the Schrodinger equation for a quantum well, show that the wave vector is equal tonπ/L where L is the wellwidth.
(5) Calculate the energy of light emitted from a 10 nm wide AlGaAs/GaAs quantum well structure that is photoexcitedwith 2.5 eV laser light.
(6) What is the luminescent energy for a CdSe quantum dot with a 2 nm radius.
(7) For a MOSFET device briefly describe how the three types of device work: a) enhancement mode b) depletionmode c) inversion mode.
(8) Calculate the capacitance of an MOS capacitor with a 10 nm thickHfO2 dielectric oxide. What is the ratio of capac-itances forCHfO2 /CSiO2 . The relatie dielectric constant forHfO2is 25.
(9) Problem 9.9 in Solymar and Walsh
(10) Problem 9.14 in Solymar and Walsh
(11) Problem 9.16 in Solymar and Walsh
(12) Problem 12.10 in Solymar and Walsh
(13) Consider a quantum cascade laser (QCL) made from GaAs and GaAlAs. What well thickness is needed for laseremission at 3 microns?
(14) Derive the expression for the average value of the dipole moment. Show that it is given by:< µ >= µ[cotha− 1
a ]
(15) The saturation polarizationPs ofPbTiO3, a ferroelectric, is0.8 coulombs/m2. The lattice constant is 4.1A. Calculatethe dipole moment of unit cell.
(16) Calculate the polarization P of one liter of argon gas at 273 K and 1 atm. The diameter of an argon atom is 0.3 nm.
(17) Consider the frequency dependence of the atomic polarizability. The polarizability and its frequency dependencecan be modeled as a damped harmonic oscillator. Derive the expression forα in this case.The expression is given by:m dx
dt2 + b dxdt + ω2
0x = −eεlocsinωtPlotα vs.ω for this case.
(18) Problem 4.6 in Solymar and Walsh.
77
(19) Problem 4.7 in Solymar and Walsh.
(20) Problem 4.8 in Solymar and Walsh.
(21) Problem 4.9 in Solymar and Walsh.
(22) Calculate the magnetic susceptibility of metallic copper. How does it compare to the measured value of -1.0?
(23) Calculate the effective magneton number p forMn2+, Co2+. Show work.
(24) Consider Mn doped GaP. There are1020Mn2+ ions.
(25) What is the electron configurationMn2+ in spectroscopic notation.a Calculate its magnetic moment at saturation in Bohr magnetons.
b Calculate its magnetic susceptibility.
(26) For metallic Co, which has a Curie temperature of 1388 K, calculate the Weiss constantλ. Calculate the exchangeconstant in meV.
78
361 ProblemsHomework Policy: You may consult with other class members when preparing your homework answers; indicate clearlyon your paper the names of the students with whom you worked. The solutions you submit should, nevertheless, beyour own and in your own hand.Reading Assignments: See the Syllabus, which is published on the NU Blackboard for this course.
(1) By operating on a "7" in the plane of the paper, show that an inversion center is equivalent to a 2-fold rotation axis(perpendicular to the plane of the paper) in two dimensions.Show that the inversion center and 2-fold rotation axis are not equivalent in three dimensions by doing the same
type of operation on a 3D asymmetrical unit “ .”(2) Below are sketched a 2-fold axis parallel to a mirror and two perpendicular mirrors. Operate on the "7" with the
indicated symmetry elements and show that a third symmetry element is present in each case and that the twocases are equivalent. Which point group does this pattern of 7’s belong to ?
(3) For the following 2D primitive rectangular unit cell:a Fill in the pattern of 7’s based on the indicated unit cell and symmetry elements.b Draw in the additional symmetry elements that are present.c Indicate which 2D space group this pattern belongs to.
(4) From Azaroff 1-7Examine the crystal on page 22 of Week 1 notes (Azaroff Fig. 1-29) and list all the symmetry elements that you findpresent. Determine the correct crystal class and system.
(5) From Azaroff 1-8Consider the tetragonal crystal shown on page 21 of Week 1 notes (Azaroff Fig. 1-24). Using the axis labeled a1, a2,and c in that figure, what are the indices of the four faces visible? What is the form?
(6) C&S Prob. 2-6(7) Hammond Prob. 2-3(8) C&S Prob. 2-10(9) C&S Problem 2-13 (Use tracing paper on top of a Wulff net for this problem, in addition to the following two).
(10) C&S Problem 2-14(11) C&S Problem 2-15(12) Prepare a drawing of the hk0 layer in the reciprocal lattice of a monoclinic crystal for which a = 2.5 Å, b = 3.0 Å, c =
5.12 Å, and γ=120°. Note that γ* = 180° - γ = 60°.(13) Using the figure from lecture notes Week 2 slide 11, draw two lines that represent the edge-on view of the (010),
(110) and (210) hkl planes. Draw the corresponding reciprocal lattice vectors, noting that they are perpendicularto the hkl planes. This is already done below for the (210) plane. Using a ruler, measure the interplanar spacing,dhkl , and the length of the reciprocal lattice vector r∗hkl . Verify that the product dhkl•r∗hkl is the same for each set ofplanes, thus demonstrating that reciprocal lattice vector lengths are inversely proportional to d-spacings in directspace.
79
(14) Using the general definition of the reciprocal lattice vector (see Week 2 Lecture Notes), derive the relation for dhklfor the tetragonal, orthorhombic, and monoclinic systems in terms of the unit cell parameters a, b, c, α, β, γ and theMiller indices h, k, l. Check answer with C&S A3-1.
(15) (a) Determine the lattice constant "a" in terms of R for a BCC (body centered cubic) structure with spheres of radiusR at each lattice point packed as closely as possible. (b) repeat part (a) for an FCC lattice.
(16) GaAs is a zinc blende structure, which has Ga atoms at FCC positions and As atoms at FCC + (1/4, 1/4, 1/4)positions. Write out the 4 coordinates for Ga and the 4 coordinates for As for a unit cell. Make a sketch of this unitcell with the 8 atoms or use Crystal Maker.
(17) Hammond Prob. 5.6. Plus use MatLab to perform the matrix transformations between cubic-I (HKL) and rhombo-hedral (hkl) for HKL = 100, 111, 110 and hkl = 100, 111, 110.
(18) C&S Problem 2-7(19) C&S Problem 2-8(20) Hammond Exercise 5.2(21) One formula weight of NiO equals 74.69 amu, and the density of a NiO crystal is 6.67 g/cm3. (a) Calculate the
length of the unit cell edge, a. (b) Using λ = 1.54 Å prepare a list of the first 6 allowed reflections (hkl) and thecorresponding Bragg angles, θhkl . Refer to CS Appendix 9 which lists the allowed reflections for various Bravaisdirect-space lattices.
(22) Prepare a 3-d drawing of the reciprocal lattice for a body-centered-cubic direct space lattice. Show and label allreciprocal lattice points for 0 ≤ h,k,l ≤ 2. Show and label the reciprocal space axes, a*, b*, and c*. Identify theBravais lattice type for this reciprocal space lattice.
(23) a) What are the (hkl) Rhombohedral unit cell Miller indices for the three nonparallel faces of the Rhombohedralunit cell?b) Read Hammond Section 5.9, make sure you understand how the transformation matrices were generated fortrigonal crystals with rhombohedral lattices. Using the transformation matrix derived in Sec. 5.9, what are the(HKL) Hexagonal unit cell Miller indices for the three nonparallel faces of the Rhombohedral unit cell?c) Now list these as (hkil) Miller- Bravais indices.d) What is the [uvw] direction in the Rhombohedral unit cell for the hexagonal c-axis direction [001]?EXTRA CREDIT: Hematite α-Fe2O3 has a rhombohedral crystal structure with a=5.43Å and α = 55.3. What is theangle between the hexagonal c-axis and the rhombohedral c-axis? What is the angle between the hexagonal c-faceand the rhombohedral c-face?
(24) Find Azaroff Chapters 6 and 8 on BlackBoard, Read Azaroff Ch 6. pp 86-113, an Azaroff Ch. 8 pp. 155-165(25) [Azaroff 6-1](26) Refer to Azaroff Fig. 6-2 on page 88. This experiment is with continuous radiation.
a The x ray beam from the x-ray tube is traveling along y. Is this x ray beam:i. preferentially polarized along x ?
ii. preferentially polarized along y ?iii. preferentially polarized along z ?iv. not preferentially polarized ? Explain your answer.
b Is radiation scattered by the block stronger in detector 1 (along x) or in detector 2 (along z)? Again explainyour answer.
(27) [Azaroff 6-2](28) [Azaroff 6-3](29) [Azaroff 8-1] Hint : According to the Bohr model, the radius rn of the nth orbit is proportional to n2/Z, where Z is
the atomic number. Plot the scattering-factor curves fK, fL and f as functions of krK.
f = 2sinkrK
krK+ 8
sinkrLkrL
Note that there is a typo in the text book. “a missing factor of 8”.(30) [Azaroff 8-2] (see Cullity & Stock Appendix 10)(31) [Azaroff 8-9](32) The one dimensional interference function is:
sin2πQ · aMsin2πQ · a =
sin2βMsin2β
Q = (S− So)/λ is the scattering vector. S and Soare unit vectors in the scattered and incident directions whereβ = πQ · a is one-half the phase angle difference (in radians) for rays scattered by planes separated by a. The crystalcontains M planes separated by a.
a Use a computer with a suitable program or spreadsheet and plotting program (MSE Ugrads must use MatLab)to plot this function over the domain 0 ≤ β ≤ π . Note that this is a periodic function repeated every π radians.
80
Figure 12.1: S/λ and So/˘
Make separate plots of the function for the cases of M = 2, 4, and 16. You will have to appropriately adjust theevaluation intervalΔβ to accommodate the sharpness of the function that varies with M.
b For each M above, tabulate the height of the primary maxima, the height of the first subsidiary maxima, andthe ratio of the height of the first subsidiary maxima to the height of the primary maxima. This demonstrateshow the subsidiary maxima become less significant as M increases.
c By numerical integration determine the area under the β = 0 primary diffraction peak between the first inten-sity minima (nulls) for each M above. How does this vary with M?
d The integral breadth of a peak is the quotient of the area over the height. This represents the full width ofa rectangle that has the same height and area as the peak in question. Calculate the integral breadth of theprimary maximum for the three cases, and consider its relation to M.
(33) Consider powder diffraction from CsCl (a = 4.11 Å) with Cu Kα radiation (λ = 1.542 Å). This is a simple cubicstructure with Cs+ at 0,0,0 and Cl−at 1/2,1/2,1/2. (Note: CsCl is not BCC.)
a What are the hkl indices for the first 7 observed reflections from CsCl?b For the first four of these calculate and tabulate sinθ/λ , fCs+ , fCl− , Fhkl , 2θ, and LP.c Look up multiplicities mhkl (Cullity & Stock Appendix 11). Combine these with your results from part B to
calculate the relative intensities of the four peaks in question. Assign the value of 100 to the most intense peak.(34) The relation of multiplicity factors mhkl to powder diffraction intensities can be appreciated with the reciprocal
lattice.a Sketch the hk0 plane of the reciprocal lattice for an HCP crystal, using solid dots (•) to indicate nonzero |Fhkl |2.
Cover the range from -2a* to +2a* and -2b* to +2b*.b Show that there are 6 reciprocal lattice vectors of the same length rhkl∗ = a∗ = b∗. Give the hkl indices for
these six vectors. In a powder sample, these will all diffract at the same value of (scalar) Q (or in the same 2θdirection).
c The six planes responsible for this diffraction are of the form 100, though this is seen more clearly in the 4axis Bravais-Miller system hkil , where i = -(h+k). Write the indices hkil for these six planes.
(35) Write the structure factor for a crystal with two atoms of the same type per unit cell atx, y, z and x+ 1/2, y+ 1/2, z+1/2 . This conforms to a body centered (I) unit cell with an arbitrarily displaced origin at x,y,z.Now evaluate the product FF∗ for all possible values of h, k, and l. You should see that the result is independentof x,y,z. Therefore, the intensity (FF*) depends only on the separation between atoms; absolute positions are notrelevant.Make a perspective sketch of the reciprocal lattice for an orthorhombic I crystal, a = 3Å, b = 4 Å and c = 5 Å. Include8 reciprocal lattice unit cells ( from origin to 2a*, 2b*, 2c*). Indicate nonzero values of FF* by dots (•).You should notice two things: the "missing" reciprocal lattice points result from the choice of the nonprimitive unitcell; the pattern of nonzero points forms a face centered (F) array in reciprocal space. The same is true for cubic Iand tetragonal I Bravais lattices, the reciprocal lattices of which are face centered.
(36) (Cullity & Stock Prob. 4-4) Derive simplified expressions for F and F2 for diamond, including the rules governingobserved reflections. This crystal is FCC and contains 8 atoms per unit cell located at: FCC and FCC + 1/4 1/4 1/4. Note, silicon and germanium are diamond structure.
(37) Construct a diagram that illustrates the hkl Bragg condition, showing S/λ, So/λ and an (hkl) reflecting plane suchthat the two unit vectors originate from the same point as shown below. Continue the diagram and show thatthe vector Q = (So/λ− S/λ) must be perpendicular to the hkl plane. From the construction derive Braggs’ Lawrecalling that Q must be the same as a reciprocal lattice vector.
(38) Figure P2 is a c-axis-rotation photograph of an orthorhombic crystal which has a* = 0.25 A−1, b* = 0.15 A−1 and c* =0.36 A−1. The radius of the cylindrical camera used for taking this photograph is 50 mm and the x-ray wavelengthis 1.542 A. Construct the appropriate reciprocal lattice nets (l=0 and l=1) to index all the reflections shown. What isthe lattice type of this crystal?
(39) Use the Scherrer equation (δ(2θ) = 2ε1/2 = 0.94λ/Dcosθ) to evaluate the FWHM peak width δ(2θ) (in degrees) forcrystallite sizes D = 25, 75, 125, 450, and 900 Å. Assume that λ = 1.542 Å and that the peak in this θ− 2θ scan whose
81
width we are considering occurs at 2θ = 80.The ability to measure small peak widths is hampered by instrumental broadening. Even if the incident anddiffracted beams were perfectly collimated, the peaks would still be broadened by theKα1 − Kα2 splitting. Dif-ferentiate Braggs law to obtain an expression for dθ as a function of θ, λ, and dλ. Using this expression, calculatedθ for the Kα1 − Kα2 splitting of Cu radiation at 2θ = 90.λ(Kα1) = 1.5405A.λ(Kα2) = 1.5433AFrom this you should appreciate that it is difficult to measure D values greater than about 500 A. when using theCu Kα doublet as a radiation source. Note that the wavelength resolution λ/dλ can be improved by an order ofmagnitude by using a single crystal monochromator to select out the Cu Kα1, whose width is approximately 2 eVin comparison to the 20 eV energy separation between the Kα1 and Kα2.
(40) Identical powder diffraction scans are made of a diamond powder sample and a germanium powder sample withCu Kα radiation. Each has "diamond cubic" crystal structure with 8 atoms per unit cell. Other pertinent informationfor this problem is as follows:
Germanium 32 5.6577 67.9 5.91The scans were done in symmetric reflection. One might think that the ratio of observed intensities would be givenby the ratio of the quantities
Kx = |Fhkl |2mhkl LPVC2
where x is C or Ge. However, the observed intensity of diamond, relative to that of germanium, was 25 times largerthan that calculated from the ratio KC/KGe. Explain where this factor of 25 comes from.
82
390 ProblemsReferences
[1] C. E. Johnson, E. J. Hathaway, Solid-Liquid Phase Equilibria for the Ternary Systems Li(F,Cl,I) and Na(F,Cl,I), Journalof The Electrochemical Society 118 (4) (1971) 631–634. doi:10.1149/1.2408125. 13