lR;eso ijeks /eZ% IEG Working Paper No. 353 2015 William Joe Suresh Sharma Jyotsna Sharma Y Manasa Shanta Mala Ramanathan Udaya Shankar Mishra B Subha Sri Maternal Mortality in India: A Review of Trends and Patterns
Transcript
lR;eso ijeks /eZ% IEG Working Paper No. 353 2015
William Joe
Suresh Sharma
Jyotsna Sharma
Y Manasa Shanta
Mala Ramanathan
Udaya Shankar Mishra
B Subha Sri
Maternal Mortality in India:
A Review of Trends and Patterns
lR;eso ijeks /eZ% IEG Working Paper No. 353 2015
Maternal Mortality in India:
A Review of Trends and Patterns
William Joe
Suresh Sharma
Jyotsna Sharma
Y Manasa Shanta
Mala Ramanathan
Udaya Shankar Mishra
B Subha Sri
ACKNOWLEDGEMENTS
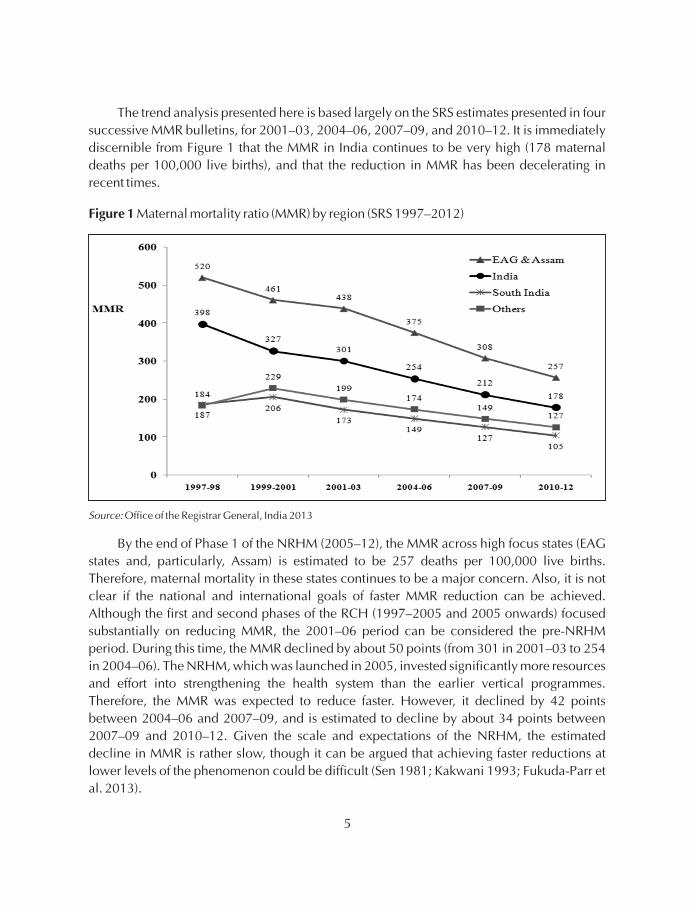
An earlier version of this paper was presented at a workshop on the National Health Mission
at the Institute of Economic Growth, Delhi (IEG) in September 2014. We thank the
participants for their feedback. The workshop was sponsored jointly by the IEG-Think Tank
Initiative (TTI) and ICSSR. The authors are grateful to the IEG-TTI for providing partial funding
support for the study, and to the Ministry of Health and Family Welfare, Government of India
for their continuing funding support and encouragement. We thank Abhishek, Jyotsna Negi,
and Deepti Sikri for excellent research assistance. The authors are grateful to Dr K
Kolandaswamy for a helpful discussion on the subject matter of this paper. However, this
paper is solely the responsibility of the authors and do not necessarily represent the views of
any organisation.
William Joe is Assistant Professor, Institute of Economic Growth, Delhi
Sample Registration System Bulletin, RGI (Various years)
EAG States: Empowered Action Group includes Uttarakhand, Uttar Pradesh, Bihar, Jharkhand, MadhyaPradesh, Chhattisgarh, Rajasthan and Odisha. In addition Assam is also considered as a high focus state here.
Source:
Note:
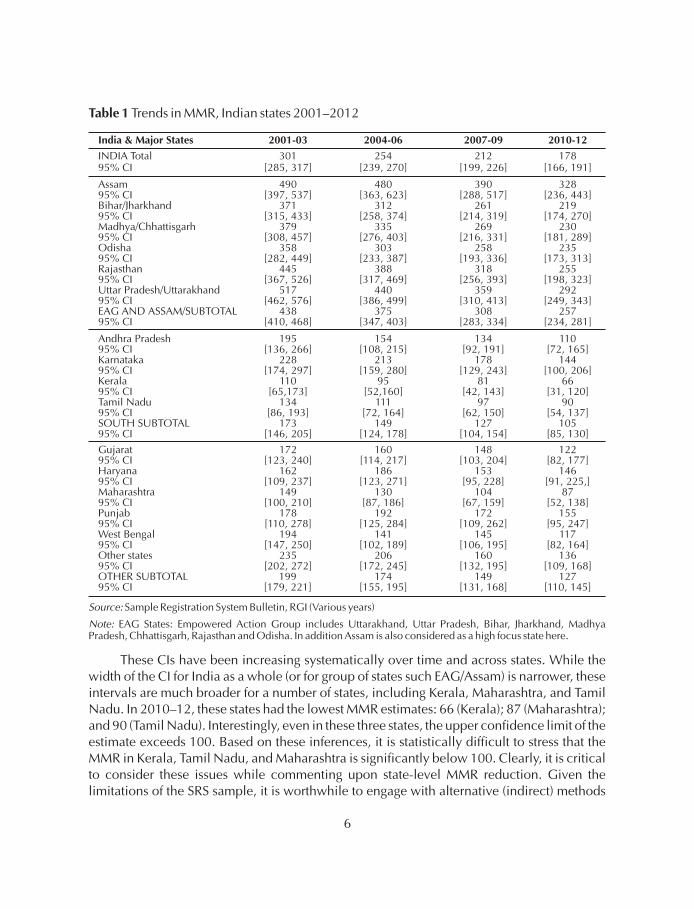
These CIs have been increasing systematically over time and across states. While thewidth of the CI for India as a whole (or for group of states such EAG/Assam) is narrower, theseintervals are much broader for a number of states, including Kerala, Maharashtra, and TamilNadu. In 2010–12, these states had the lowest MMR estimates: 66 (Kerala); 87 (Maharashtra);and 90 (Tamil Nadu). Interestingly, even in these three states, the upper confidence limit of theestimate exceeds 100. Based on these inferences, it is statistically difficult to stress that theMMR in Kerala, Tamil Nadu, and Maharashtra is significantly below 100. Clearly, it is criticalto consider these issues while commenting upon state-level MMR reduction. Given thelimitations of the SRS sample, it is worthwhile to engage with alternative (indirect) methods
7
simultaneously to estimate MMR (see, for instance, Bhat et al. 1995; Hogan et al. 2010; Hill etal. 2006; Ahmed and Hill 2011). However, it is worth emphasising that the best option is acomplete vital registration system for births and deaths.
These wider CIs around the estimate also compel us to examine if the state-level declines inMMR over the years are significant. For this purpose, we perform the test of equality ofproportions using large sample statistics. The results reported in Table 2 suggest that thedeclines are statistically significant only for pooled regional sub-samples.
For instance, the differences are significant at 99 per cent at the all-India level or for theEAGs and Assam, taken together. Statistically, the reduction in MMR is significant only forUttar Pradesh/Uttarakhand. In a long-term comparison—that is over the pre-NRHM(2004–06) and NRHM (2010–12) periods—mostly, the decline in the NRHM period has beensignificant over EAG states. In the other (non-EAG) states, the decline has been insignificant.
Table 2 Statistical significance of MMR reduction, India 2001–03 to 2010–12
India & Major States 2001/03–2004/06 2004/06–2007/09 2007/09–2010/12 2004/06–2010/12
INDIA Total *** *** *** ***
Assam *
Bihar/Jharkhand **
Madhya/Chhattisgarh **
Odisha
Rajasthan ***
Uttar/Pradesh/Uttarakhand * ** * ***
EAG & ASSAM *** *** *** ***
Andhra Pradesh
Karnataka *
Kerala
Tamil Nadu
SOUTH SUBTOTAL **
Gujarat
Haryana
Maharashtra
Punjab
West Bengal
Others ***
OTHER SUBTOTAL * * * ***
Source:
Note:
Authors based on Sample Registration System Bulletin, RGI (Various years)
EAG States: Empowered Action Group includes Uttarakhand, Uttar Pradesh, Bihar, Jharkhand, MadhyaPradesh, Chhattisgarh, Rajasthan and Odisha. In addition Assam is also considered as a high focus state here.
*** p<.01, ** p<.05 *p<.10 represents significance of difference at 1%, 5% and 10%, respectively.
8
In part, this reflects the problems of a lower sample size. Nevertheless, as an alternative, wealso examine the declines in maternal mortality rate (MM Rate), and find that it is significantacross most states (results not reported here). This decline may also be related with reducingfertility over the years.
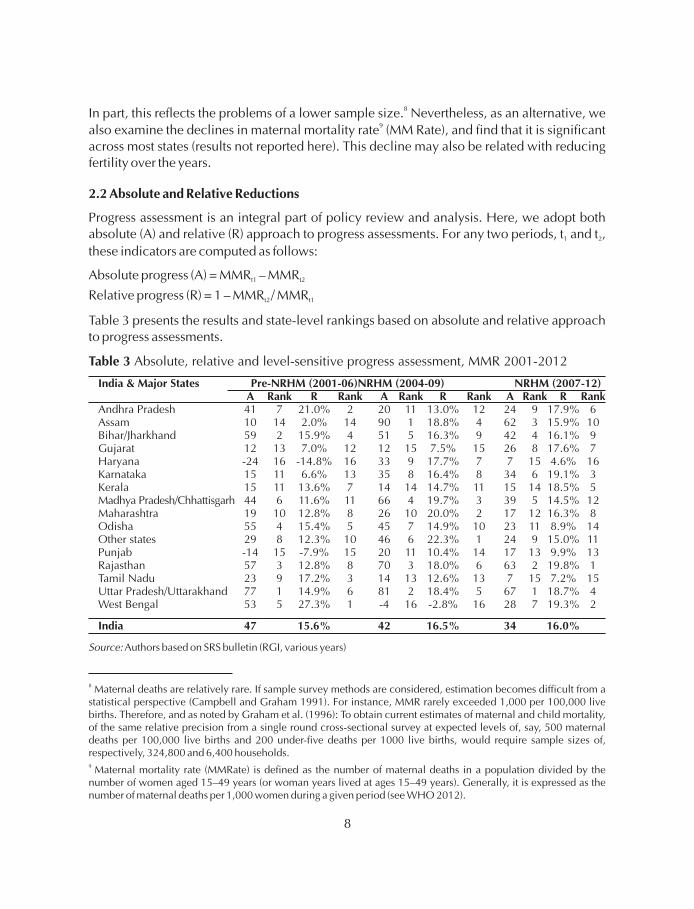
Progress assessment is an integral part of policy review and analysis. Here, we adopt bothabsolute (A) and relative (R) approach to progress assessments. For any two periods, t and t ,
these indicators are computed as follows:
Absolute progress (A) = MMR – MMR
Relative progress (R) = 1 – MMR / MMR
Table 3 presents the results and state-level rankings based on absolute and relative approachto progress assessments.
8
9
2.2 Absolute and Relative Reductions
1 2
t1 t2
t2 t1
Table 3 Absolute, relative and level-sensitive progress assessment, MMR 2001-2012
India & Major States Pre-NRHM (2001-06)NRHM (2004-09) NRHM (2007-12)A Rank R Rank A Rank R Rank A Rank R Rank
Source: Authors based on SRS bulletin (RGI, various years)
8
9
Maternal deaths are relatively rare. If sample survey methods are considered, estimation becomes difficult from astatistical perspective (Campbell and Graham 1991). For instance, MMR rarely exceeded 1,000 per 100,000 livebirths. Therefore, and as noted by Graham et al. (1996): To obtain current estimates of maternal and child mortality,of the same relative precision from a single round cross-sectional survey at expected levels of, say, 500 maternaldeaths per 100,000 live births and 200 under-five deaths per 1000 live births, would require sample sizes of,respectively, 324,800 and 6,400 households.
Maternal mortality rate (MMRate) is defined as the number of maternal deaths in a population divided by thenumber of women aged 15–49 years (or woman years lived at ages 15–49 years). Generally, it is expressed as thenumber of maternal deaths per 1,000 women during a given period (see WHO 2012).
9
Specifically, we examine the progress over three periods: 2001–06, 2004–09, and
2007–12. Here, the first period can be regarded as the pre-NRHM period; the second and
third periods can be regarded to fall in Phase 1 of the NRHM (2005–12). We can expect some
effect of the NRHM during the second period, but greater results in the third period.
Interestingly, the all-India reduction in MMR for the three periods was 47 points, 42 points,
and 34 points, respectively. This absolute view suggests that the pace of reduction has been
slowing down in recent years. However, a relative approach informs that the pace of
reduction has been more or less constant (around 16 per cent) since 2000.
Further, the absolute approach suggests that over 2001–2006, the MMR dropped over
50 points in Uttar Pradesh/Uttarakhand, Bihar/Jharkhand, Rajasthan, Odisha, and West
Bengal, but perhaps increased in Haryana and Punjab. The decline was steep in most states
with high MMR, but only 10 points in Assam. However, Assam showed considerable
improvement during the NRHM period: it achieved large reductions of 90 points during
2004–2009 and 62 points during 2007–2012.
An absolute view of assessing progress proves disadvantageous for states with lower
base levels, such as Kerala, Tamil Nadu, and Maharashtra. For instance, during 2001–06,
both Karnataka and Kerala achieved a 15-point reduction in MMR. Consequently, the
absolute approach ranks both states equally. However, Kerala achieved this reduction from a
lower base level (MMR 110 in 2001–03) than Karnataka (MMR 228 in 2001–03). It is argued
that an improvement at a higher level represents a greater achievement than an equal
improvement at a lower level (Joe 2014; Waage et al. 2010; Fukuda-Parr et al. 2013;
Prennushi et al. 2002; Sen 1981; Dasgupta 1990; Kakwani 1993). Also, consensus is growing
that the non-linear dynamics of improvement at different levels should be considered, as at
higher levels the marginal social cost for improvement increases disproportionately (Easterly
2009; Osório 2008; Vandemoortele 2009; Vandemoortele and Delamonica 2010; Addison
et al. 2005). It is important to approach progress assessment by allowing for level-sensitive
assessments, and to acknowledge the commitment of states that continue to progress despite
lower net benefits. The relative approach offers a crude method to capture level-sensitive
behaviour, as it provides greater weights to a similar improvement achieved from a lower
base level. For instance, using this method, we notice that for 2001–06 Kerala is ranked
seventh and is placed ahead of Karnataka (ranked 13) in MMR reduction.
10
10 To assess inter-temporal progress, methods such as rate differentials (absolute changes) and rate ratios (relative
changes) are commonly applied. However, a few indicators account for level differentials in progress assessments
(see, among others, Kakwani 1993; Sen 1981; Mishra and Subramanian 2006; Joe 2014). Here, we rely exclusively
on the implicit level-sensitive property of the relative progress indicator, R. The index A is based on simple rate
differentials and provides equal weight to progress, irrespective of base-level differentials. This implies that the rate
differential indicator will not exhibit level sensitivity as, for instance, the effort leading to a decrease in MMR from
500 to 400 will be considered as good as the effort required for a decrease from 200 to 100. However, in the case of
indicator R, the weights are such that for a given improvement in MMR, regions or groups with a higher base level of
MMR would receive lower weights.
In relative terms, both Rajasthan and West Bengal have shown good progress during the
NRHM (2007–12), but performance has stagnated recently in some states. In Punjab and
Haryana, in particular, the pace of reduction does not augur well with their developmental
profile. Also, it is surprising to observe the slow pace of improvements in the better
performing state of Tamil Nadu: the MMR has improved by only 7 points between 2006–09
and 2007–12. The state government estimates of the 2010–12 MMR levels (73–79;
Government of Tamil Nadu 2014) are inconsistent with the SRS estimates (90). Nevertheless,
even the state estimates show a stagnant picture in MMR reduction: the most recent state
government estimates, for 2013–14, suggest a MMR of 68.
Given such wide variations in MMR, it is critical to examine the inter- and intra-state
disparities to comprehend whether the disparities are narrowing. For this purpose, we apply
the following indicators: range; ratio of worst and best performing states; standard deviation;
coefficient of variation; and Gini coefficient. The MMR range across states, computed as the
difference between the highest and the lowest MMR, state has been narrowing over the years.
For instance, during 2001–03, there was a 407-point difference in MMR of the highest (Uttar
Pradesh/Uttarakhand) and lowest (Kerala) MMR states. In 2010–12, the gap between the
highest (Assam) and the lowest (Kerala) MMR states was 262 points. Although the gaps
between the extremes are reducing, the range ratio, computed as the ratio of the highest MMR
state to lowest MMR state, has not shown any significant reduction. In fact, the MMR of the
worst performing state is almost five times that of the best performing state. The standard
deviation indicates that the spread of MMR across states is also narrowing. Nevertheless, the
magnitude of inter-state disparities remains high and is confirmed by the coefficient of
variation and the Gini coefficient for the various years (Table 4).
2.3 Inter- and Intra-state Disparities
Table 4
Inequality Indices 2001/03 2004/06 2007/09 2010/12
Magnitude of inter-state disparities in MMR, India 2001-03 to 2010-12
Range difference (Highest Lowest MMR) 407 385 309 262
Range ratio: Highest/ Lowest MMR 4.70 5.05 4.81 4.97
Standard deviation 139.2 124.4 98.0 80.8
Coefficient of variation 0.512 0.513 0.479 0.476
Gini coefficient 0.272 0.276 0.258 0.253
Data inadequacies restrict comprehensive analysis and discussion regarding magnitude
of intra-state disparities in maternal mortality but nevertheless it is critical to flag these
concerns to improve divisional administration and policy implementation. In this regard, the
Annual Health Survey (AHS) conducted across EAG states and Assam provides some
–
Source: Authors based on Sample Registration System Bulletin, RGI (Various years)
10
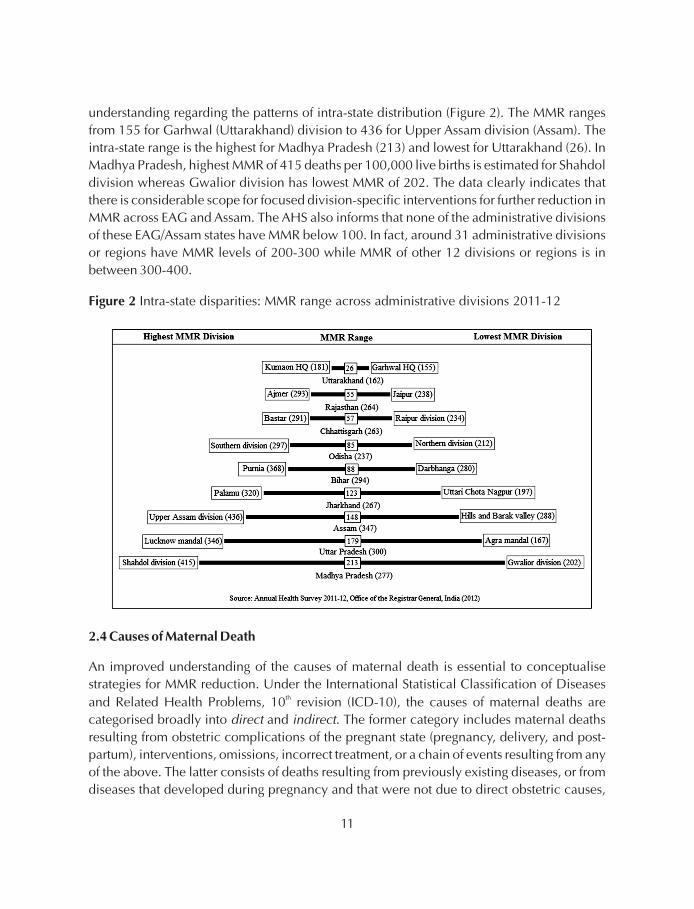
understanding regarding the patterns of intra-state distribution (Figure 2). The MMR ranges
from 155 for Garhwal (Uttarakhand) division to 436 for Upper Assam division (Assam). The
intra-state range is the highest for Madhya Pradesh (213) and lowest for Uttarakhand (26). In
Madhya Pradesh, highest MMR of 415 deaths per 100,000 live births is estimated for Shahdol
division whereas Gwalior division has lowest MMR of 202. The data clearly indicates that
there is considerable scope for focused division-specific interventions for further reduction in
MMR across EAG and Assam. The AHS also informs that none of the administrative divisions
of these EAG/Assam states have MMR below 100. In fact, around 31 administrative divisions
or regions have MMR levels of 200-300 while MMR of other 12 divisions or regions is in
between 300-400.
Intra-state disparities: MMR range across administrative divisions 2011-12Figure 2
2.4 Causes of Maternal Death
An improved understanding of the causes of maternal death is essential to conceptualise
strategies for MMR reduction. Under the International Statistical Classification of Diseases
and Related Health Problems, 10 revision (ICD-10), the causes of maternal deaths are
categorised broadly into and . The former category includes maternal deaths
resulting from obstetric complications of the pregnant state (pregnancy, delivery, and post-
partum), interventions, omissions, incorrect treatment, or a chain of events resulting from any
of the above. The latter consists of deaths resulting from previously existing diseases, or from
diseases that developed during pregnancy and that were not due to direct obstetric causes,
th
direct indirect
11
but were aggravated by the physiological effects of pregnancy (WHO 2012). As shown in
Figure 3, the 2001–03 SRS data suggest that haemorrhage (38 per cent) is the leading cause of
death in India, and is followed by sepsis (11 per cent) and abortion (8 per cent). The relative
shares of these causes were notably similar across regions such as EAG states and Assam,
South India, and other states. However, hypertensive disorders are much higher in South
India, whereas abortion-related deaths are higher in EAG states and Assam (RGI 2003).
Using data from the SRS 2001–03, Montgomery et al. (2014) re-examine the causes ofmaternal mortality in India, and find that direct obstetric causes account for over 80 per centof maternal deaths in India. The pattern is notably similar across rural and urban areas as wellas across different states. Obstetric haemorrhage causes about 25 per cent of the totalmaternal deaths, whereas other obstetric complications lead to over 20 per cent of maternal
Figure 3 Causes of maternal death in India (2001-03)
Source: The data for India and Tamil Nadu are reported in Montgomery et al (2014) and Kolandaswamy (2010),respectively.
12
deaths. Pregnancy-related infection (17 per cent) and complications followingspontaneous/therapeutic abortion (9 per cent) are also identified as important causes ofmaternal deaths in India. Studies based on data sources other than the SRS also shed light onthe causes of maternal death in India. For instance, a civil society report analyses124maternal deaths (in 2012–13) across 10 major states of India, and finds that about 28 per centof the deaths are due to haemorrhage (Subha Sri and Khanna 2014). Importantly, this studyidentifies that 18 per cent of the maternal deaths reviewed were caused by anaemia.Abortion-related complications are responsible for about 4 per cent of the investigatedmaternal deaths. Similar inferences are available from the description of causes of maternaldeath in Tamil Nadu during 2008–09 (Kolandaswamy 2010), which finds that the proportionof direct (81 per cent) and indirect (19 per cent) causes of maternal death is similar to the all-India proportion. Again, haemorrhage is identified as the cause of about 24 per cent ofmaternal deaths in the state. Tamil Nadu is witnessing an increase in hypertension-relatedmaternal deaths. Eclampsia and pulmonary embolism are identified as other major directcauses of maternal death during 2008–09. However, abortion-related maternal deaths arenot identified as a significant cause of maternal death. Such increasing share of indirectcauses is also noted in other parts of the country.
With advances in scientific knowledge and proven clinical interventions, it is possible to
prevent most maternal deaths. Therefore, it is critical to understand if the deaths were caused
due to delays in decision making and care seeking at the household level, or in arranging
transport and reaching the health facility, or in receiving appropriate care at the health facility
(Thaddeus and Maine 1994). Each of these dimensions has different implications for policy.
Verbal autopsies based on the SRS 2001–03 suggest that about 50 per cent of maternal deaths
occurred at home, 14 per cent occurred during transit, and 36 per cent occurred at the health
facility (Montgomery et al. 2014). However, the more recent review of selected maternal
death cases by Subha Sri and Khanna (2014) suggests that with improving access there may
be a possible change in the reporting of place of maternal deaths. This study finds that about
26 per cent of maternal deaths occurred at home, 25 per cent occurred in transit, and 48 per
cent occurred at the health facility. In Tamil Nadu, less than 10 percent of deaths occurred in
the health facilities where the expectant mother was admitted; the corresponding all-India
figure is about 33 per cent (Kolandaswamy 2010; Montgomery et al. 2014; Subha Sri and
Khanna 2014).
This section reviews the ecological association between important structural factors and
MMR across 15 major states. It is widely acknowledged that economic growth is an important
determinant of maternal and child health. Economic growth not only helps boost public and
private sector investments in health care but also affects several immediate and intermediate
factors, such as transportation and infrastructure, which improve access to health care.
3 STRUCTURAL ENVIRONMENT AND MMR REDUCTION
13
Similarly, MMR levels and reduction are significantly influenced by socio-cultural, health
system, and demographic factors. These aspects of the structural environment can be
reasonably captured by proxy variables such as public spending on social sector, female
literacy rate, and total fertility rate (TFR).
The top left panel in Figure 4 plots the association between per capita net state domestic
product (PCNSDP) and MMR for the pooled SRS data points (2001–03 and 2010–12). A
parabolic shape of the PCNSDP-MMR scatter (top left panel) resembles a unitary elasticity
plot indicating that, wherever the states are, a given percentage increase in PCNSDP should
result in an identical percentage decline in the MMR. In other words, this ecological
association suggests that economic growth at lower levels of income can have significant
impact in achieving faster decline in MMR. Also, the Pearson correlation between MMR and
PCNSDP for all the four SRS data points is found to be negative and significant at 1 per cent
level for significance. The Pearson correlations coefficients are as follows:
2001–03: Correlation -0.843 (p-value 0.0001);
2004–06: Correlation -0.794 (p-value 0.0004);
2007–09: Correlation -0.830 (p-value 0.0001); and
2010–12: Correlation -0.817 (p-value 0.0002).
Figure 4 Association of MMR with PCNSDP, PCSSE, TFR and female literacy
Source: SRS Bulletin (2001-03 & 2010-12), Census of India (2001 & 2011) and RBI report on state finances.
§
§
§
§
14
It is also worthwhile to examine a somewhat longer relationship (2001–12) by observing
the changes in MMR associated with absolute and relative changes in the PCNSDP. This
change-in-change analysis (results not reported) informs that smaller absolute increments in
per capita incomes had had a significant impact on MMR reductions than large absolute
increments. Such smaller absolute increment in PCNSDP and faster MMR reduction are
noted across low-income states such as Uttar Pradesh and Assam. In relative terms, it implies
that rapid economic growth can also accelerate MMR reductions.
Figure 4 also reiterates the increasing importance of non-income factors to accelerate
MMR reductions. This is immediately discernible from the association of MMR with per
capita social sector expenditure (PCSSE in current prices), total fertility rate (TFR), and female
literacy rate. The female literacy rate and TFR share a significant relationship with maternal
mortality. The bottom left plot indicates that faster progress towards lower TFR levels can
have a direct and independent effect on MMR. Similarly, female literacy and education
emerges as a key developmental issue for reducing MMR.
Levels of per capita social sector expenditure and MMR are also positively associated.
This fact is well established by the MMR profiles of states such as Kerala and Tamil Nadu,
which have consistently devoted significant public resources to the social sector.
Table 5
PCSSE* % PCSSE/PCTE*
Public spending on the social sector by selected states, 1990-2010
State
1990s 2000s 1990s 2000s
Assam 660 1721 38.6 37.0
Bihar 553 1081 41.8 39.5
Uttar Pradesh 472 1247 33.3 32.0
Kerala 962 2348 41.3 34.6
Tamil Nadu 913 2413 40.3 36.1
Source:
Note:
State Finances AStudy of Budgets of 2012-2013, RBI (2013)
All figures are in current prices
*Average annual PCSSE (per capita social sector expenditure) and PCTE (per capita total expenditure) are taken forthe decade of 1990s and 2000s.
The social sector expenditure includes expenditure on social services, rural development and food storage andwarehousing under revenue expenditure, capital outlay and loans and advances by the State Governments.
—
15
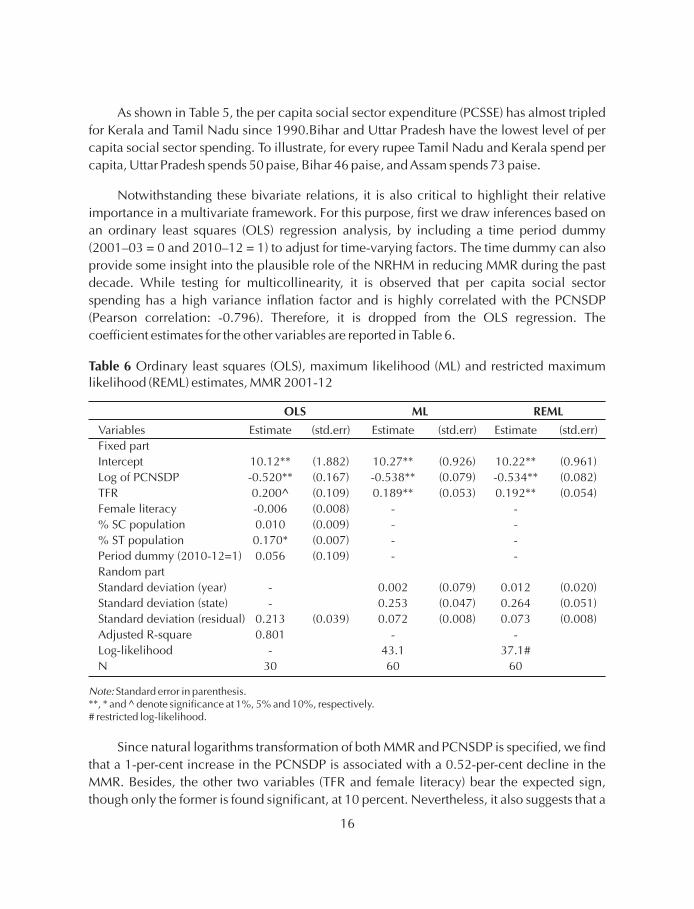
As shown in Table 5, the per capita social sector expenditure (PCSSE) has almost tripled
for Kerala and Tamil Nadu since 1990.Bihar and Uttar Pradesh have the lowest level of per
capita social sector spending. To illustrate, for every rupee Tamil Nadu and Kerala spend per
Standard deviation (year) - 0.002 (0.079) 0.012 (0.020)
Standard deviation (state) - 0.253 (0.047) 0.264 (0.051)
Standard deviation (residual) 0.213 (0.039) 0.072 (0.008) 0.073 (0.008)
Adjusted R-square 0.801 - -
Log-likelihood - 43.1 37.1#
N 30 60 60
Note: Standard error in parenthesis.**, * and ^ denote significance at 1%, 5% and 10%, respectively.# restricted log-likelihood.
16
1-per-centreduction in TFR can be associated with an about 20-per-centdecline in MMR. We
have also included the proportion of Scheduled Caste (SC) and Scheduled Tribe (ST)
populations as explanatory variables, as these vulnerable social groups share a higher burden
of health deprivations. The coefficient for the ST population is also significant, at 5 percent,
and suggests that a large concentration of tribal sub-groups is associated with a higher MMR.
Interestingly, the time dummy, which plausibly informs about the role of the NRHM, does not
bear any statistical significance.
Further, we use the MMR, PCNSDP, and TFR data at four time points to draw additional
inferences about their association (we dropped female literacy as data is not available).
Specifically, the MMR data are cross-classified by state and years. Therefore, we treat both
these factors as random, develop two simple two-way error component models, and present
the results in Table 6 (Rabe-Hesketh and Skrondal 2012; Goldstein 1987). First, we fit the
model using the maximum likelihood (ML) estimation method. The coefficient of the log of
PCNSDP is estimated to be -0.54 and is closer to the one obtained using ordinary least
squares method. Interestingly, the significance of TFR increases after dropping female literacy
from the analysis; this suggests that a 1-point-decline in TFR is associated with a 18.9-per-cent
decline in MMR. The estimated residual standard deviation between years is only 0.002,
whereas the estimated residual standard deviation between states is 0.253, and indicates
greater heterogeneity between states. The leftover residual standard deviation is estimated to
be 0.072. A similar between-state heterogeneity is revealed from the residual standard
deviation of the OLS (0.237), though it is lower than the ML estimates.
As the number of clusters is small, the ML estimates of variance components are biased
downward. Hence, we also report the estimates based on restricted maximum likelihood
(REML), as it yields unbiased estimates. Compared to ML estimates, we find that only the
random effects parameters for years and states show some variation. Based on the REML
estimates, the cross-sectional intra-class correlation between states within years is estimated
at 0.002, whereas the residual intra-class correlation within states is estimated at 0.927. After
adjusting for the PCNSDP and TFR, there is a negligible correlation in MMR over states within
years, whereas a very high correlation exists for MMR over years within states. We also obtain
the empirical Bayes predictions for the REML estimates, which are adjusted for PCNSDP and
TFR. These predictions inform that the MMR in Assam, Haryana, Karnataka, Madhya
Pradesh, Odisha, Punjab, Rajasthan, and Uttar Pradesh is higher than the state average, and
that the SRS 2004–06 estimates have a higher MMR than the average over the 10-year period.
17
4 DISCUSSION
India's MMR reduction scenario can be summarised using the obstetric transition framework.
Souza et al. (2014) describe five stages of obstetric transition:
1. Stage 1 (MMR > 1,000)
2. Stage2 (300 MMR < 1,000)
3. Stage3 (50 MMR < 300)
4. Stage4 (5 MMR < 50)
5. Stage5 (MMR < 5)
The timeline of MMR decline informs that India remained in Stage 1 for almost two decades
after independence (Figure 5).
It is only during the 1960s that India reached MMR levels of less than 1,000 maternal
deaths per 100,000 live births. For almost four decades (1960–2000), India remained in Stage
2, and entered Stage 3 in the early 2000s. It should reach Stage 4 by the late2020s. However, a
synergistic policy approach is required to capture the whole gamut of factors, including
health system, economic growth, developmental infrastructure, education, nutritional status,
and an exclusive focus on the marginalised sub-groups. In fact, some of the existing
frameworks for MMR causes and reduction (see McCarthy and Maine 1992; Campbell et al.
≤
≤
≤
Figure 5 Timeline for India's progress to Stage III of obstetric transition
Source: Based on Radkar (2012). Also see Bhat et al (1995), Vora et al (2009) and RGI (various years)
11
18
11 Readers may refer to the companion piece (Joe et al. 2015) for a further discussion on framework and important
policy lessons for improving primary health care to reduce maternal mortality in India.
19
2006; World Bank 2012) emphasise on strengthening the health system, and argue that
sustained MMR reduction requires a synergistic environment with rapid improvement in
health system, economic performance, socio-cultural outlook, and governance. Therefore,
without undertaking anything in the nature of a summary, this section comments on India's
performance in these domains.
It is well known that the health system in India has a history of gross neglect, largely
because the egalitarian goals of equity and universal care have been pursued exclusively via
what could be referred to as the utilitarian means. The problem is deeply rooted in the nature
of fiscal management and business environment in India, which has inextricably linked
social sector investment with economic performance. This has not only squeezed the space
for pursuing egalitarian goals of but has also altered the discourse by
emphasising on the utilitarian role of and .
The issue of high maternal mortality in India was singled out as early as in 1946 by the report
of the government's Health Survey and Development Committee (Bhore Committee).But
Indiahas not been able to cater adequately to established health care norms, or allocate much
needed resources to the public health sector. India has one of the lowest public health
spending figures, of about 1.2 per cent of GDP (HLEG 2011). The lack of funding implies that
the health system lacks its own agenda, and that problems bearing an economic dimension
supercede the more fundamental criteria of rights and equity. India's attention to maternal
mortality is synonymous with the launch of the Child Survival and Safe Motherhood in 1992
(CSSM), which is an outcome of global attention to hitherto neglected tragedy of maternal
deaths in low-income countries. Other international events, including the International
Conference on Population and Development (ICPD 1994) and the MDGs, played an
important role in integrating the fragmented family welfare, child health, and maternal health
components into the RCH programme and the NRHM (Vora et al. 2009).
health as an end in itself
health as an input for economic growth vice versa12
13
12
13
Interestingly, even the Alma Ata declaration (1978) on primary health care had no direct reference to maternal
mortality or the plight of mothers at childbirth. It was only in the late 1980s that researchers emphasised maternal
deaths (WHO 1978; Rosenfield and Maine 1985; Van Lerberghe and De Brouwere 2001). The global attention to
maternal mortality is synonymous with the launch of the Safe Motherhood Initiative in 1987 by international
agencies and governments to raise global awareness about the impact of maternal mortality and morbidity, and find
solutions. The state of affairs was disquieting: Every four hours, day in, day out, a jumbo jet crashes and all on board
are killed. The 250 passengers are all women, most in the prime of life, some still in their teens…(WHO 1986). During
this period, WHO and UNICEF (1996) estimated that globally 585,000 women die due to pregnancy-related causes.
International events in the 1990s, including the International Conference on Population and Development (ICPD
1994), incorporated human rights into the definition of Safe Motherhood and emphasised broader political, social,
and economic interventions to reduce maternal mortality (UNFPAet al. 1997). These events played an important role
while deciding upon interventions for improving reproductive health and family welfare services, particularly
among the marginalised sections of the population. More recently, the UN declaration of the MDGs provided the
much necessary impetus by promoting inter-sectoral convergence across international, national, private, and civil
society organisations.
20
In India, public health is also affected by governance standards. Good governance
facilitates development of appropriate policy frameworks and monitoring systems to support
programme implementation. Several studies argue that governance and strong political
support to the health system are key to a good public health system, such as in Tamil Nadu
(Muraleedharan et al. 2011; Mehrotra 2006; Padmanaban et al. 2009; Vora et al. 2009; WHO
2009; Kalaiyarasan 2014). Although the public health system in India is well structured (sub-
centre, primary health centre, community health centre, district hospitals, and medical
colleges), it fails to meet even customary service standards. The shortage of human resources
hampers the functionality and quality of public health facilities, and is a critical concern.
Renewed emphasis on medical education is necessary, as is the resolve to have at least one
medical college per district. This requires substantial investment and policy commitment,
which Tamil Nadu and Kerala have succeeded in making. Medical education should be
expanded to support the training of staff and functionaries to provide comprehensive
emergency obstetrics and neonatal care, which is critical to save maternal and neonatal lives.
Meanwhile, improvements in human resource management can help to fill the gaps in health
care provision. In fact, improvements in health administration is a major challenge, as several
states (and the central government) lack the appropriate structure, and a clear division of roles
and functions across departments (Vora et al. 2009). It is important to create a separate public
health cadre in all states; with the shifting demographic and epidemiological profile of the
country, the importance of this requirement is only increasing.
High fertility, abortion, transport, and emergency care are among the key determinants
of maternal mortality. Improvement is critical to achieve faster reductions in MMR (McCarthy
and Maine 1992). In fact, the TFR among EAG states continues to be much higher than in
others and increases the risk of maternal death. Similarly, the availability and quality of
Emergency Obstetric Care (EmOC) is essential to prevent maternal deaths. Several skilled
birth attendants (SBA) lack the skills to provide even basic emergency care, and there is a
shortage of specialists and a poor spread of EmOC facilities in several states with high MMR.
The lack of availability and access to blood transfusion contributes to maternal mortality, but
is a key gap in many states, especially because sometimes members of the immediate family
refuse to donate blood for surgical interventions. In fact, EAG states should emphasise public
awareness campaigns and mobilisation to increase the voluntary donation of blood. Clearly,
emergency care is an area where innovative strategies are required, including the mapping of
health facilities for referral and improved communication before referrals.
The maternal death review system should become a mechanism by which it learns and
institutes corrective action to prevent and reduce any such incidence. However, the lack of
timely and complete information on maternal deaths is a major challenge. Partly, the problem
lies in poor surveillance and monitoring systems for maternal and child health care in India.
In the past few years, surveillance has received considerable attention, and new initiatives
such as Mother and Child Tracking System (MCTS) and Health Management Information
System (HMIS) have been rolled out. Their success varies across regions, but these initiatives
are expected to evolve into a proxy system over time for vital registration and provide
comprehensive information for beneficiary care and policymaking. But, for this purpose,
states must start using the surveillance system to undertake a comprehensive maternal death
review, to undertake corrective measures and policy action. All the reporting (including
private sector deaths) should take place within 24 hours, and the reviews should be carried
out at community, facility, district, and state level. Such a practice can self-propel
improvement in surveillance and monitoring.
Health care promotion cannot be complete unless the health system empowers
communities and shares mutual respect and trust. In fact, fear and embarrassment among
both beneficiaries and grassroots workers have not received adequate attention, unlike in
countries such as Malaysia and Sri Lanka, where competence, status, and the role of
midwives and nurse–midwives are critical in reducing MMR (Pathmanathan et al. 2003).
These factors are also noted in South Indian states, where women enjoy better sociocultural
status. In Bangladesh, the MMR has declined steadily, although only 18 per cent of births are
attended by SBAs (Prata et al. 2011). This paradoxical situation may be explained by
environmental factors, such as high enrolment of girls in school, and well performing family
planning programmes that not only lowered the fertility rate but also enabled women avoid
unsafe abortions. However, India is increasingly relying on monetary mechanisms (cash
transfers and incentives) to achieve policy objectives, and has failed to leverage the
influential ethical tools of duty, principles, and pride in health care achievement.
Unsurprisingly, therefore, few conclusions of the impact of such policies on maternal health
are favourable (Lim et al. 2010; NHSRC 2011; Sharma and Joe 2014; Montgomery et al.
2014b). Also, the practice of applying all international goals and targets uniformly across all
regions needs to be revisited (see Easterly 2009). Such burdensome targets only lead to easy
labeling of regions as failures and potentially stakeholders, including grassroots
workers.
The analysis outlines that the high level of maternal mortality in India, particularly across EAG
states and Assam, is a critical policy concern. Besides, the pace of reduction for the past two
decades (particularly, the rate of decline) does not commensurate well with the observed
improvements in socioeconomic indicators across states. Also, huge inter-state and intra-
state disparities in MMR remain a major concern. Therefore, in concluding, it is important to
mention that economic performance alone would be insufficient to achieve faster reductions
in MMR. The economic system works on a quid pro quo basis, which implies that it would
neglect social groups unable to offer the system any economic service. In India, these groups
largely include women and tribal sub-groups living in unfavourable geographic locations
demotivating
5 CONCLUSION
21
(inaccessible rural areas and hilly regions). Moreover, states with high MMR also tend to have
an unfavourable geography; therefore, economic growth would largely be confined to
advantaged locations, and the remotest and tribal areas will remain underserved and have
high levels of MMR (Banerjee et al. 2013). Economic growth may help initiate improvements
in MMR but, to reduce MMR faster, simultaneous investment is important in strengthening the
health system; education and empowering women; and making available qualified human
resources in health, good governance, and transportation facilities. Also, improvement in
recording and sharing vital health (and health-related) information is critical to facilitate
policymaking and enhance effectiveness of various interventions. India's developmental
narrative should display increased socio-political commitment towards health, one that
could place India ahead of other countries.
22
REFERENCES
Addison, T, G Mavrotas and M McGillivray (2005) Aid to Africa: An unfinished agenda.17 (8): 989–1001.
Ahmed, S and K Hill (2011) Maternal mortality estimation at the subnational level: a modelbased method with an application to Bangladesh.
89: 12–21.
Banerjee, S et al. (2013) Stairway to death: Maternal mortality beyond numbers,, 48 (31): 123–30.
Bhat PNM (2002) Maternal mortality in India: An update. 33 (3):227–36.
Bhat PNM, K Navaneetham and S Irudaya Rajan (1995) Maternal mortality in India: Estimatesfrom a regression model. 26 ( 4): 217–32.
Bhatia, Jagdish C (1988) A study of maternal mortality in Anantapur district, Andhra Pradesh,India. Bangalore: Indian Institute of Management.
Bhatia, Jagdish C (1993) Levels and causes of maternal mortality in southem India.24 (5): 310–18
Blum, Alain and Philippe Fargues (1990) Rapid estimation of maternal mortality in countrieswith defective data: An application to Bamako (1974–85) and other developingcountries. 44: 155–71.
Campbell OM and Graham WJ (2006) Strategies for reducing maternal mortality: getting onwith what works. 368 (9543): 1284–99. Lancet Maternal Survival SeriesSteering Group
Campbell OMR and Graham WJ (1990) Measuring maternal mortality and morbidity: Levelsand trends . Maternal and Child Epidemiology Unit Publication No. 2. London:London School of Hygiene and Tropical Medicine
Dasgupta, P (1990) Well-being and the extent of its realization in poor countries.(Supplement) 100.
Easterly, W (2009) How the Millennium Development Goals are unfair to Africa.37(1): 26–35.
Fukuda-Parr, Sakiko, J Greenstein and D Stewart (2013) How should MDG success and failurebe judged: Faster progress or achieving the targets? 41: 19–30.
Gakidou E and G King (2006) Death by survey: estimating adult mortality without selectionbias from sibling survival data. 43: 569–85
Journal of International Development
Bulletin of World HealthOrganization
Economicand Political Weekly
Studies in Family Planning
Studies in Family Planning
Studies inFamily Planning
Population Studies
Lancet
EconomicJournal
WorldDevelopment
WorldDevelopment
Demography
22
Goldstein H (1987) Multilevel covariance component models. 74: 430–31.
Government of India (1946) Report of the Health Survey and Development Committee. NewDelhi: Manager of Publications.
Government of India (1961) Report of the Health Survey and Planning Committee. NewDelhi: Manager of Publications
Government of India (1994) National Child Survival and Safe Motherhood Programme. NewDelhi: Maternal and Child Health Division, Department of Family Welfare
Government of India (2011) Millennium Development Goals: India Country Report 2011,Ministry of Statistics and Programme Implementation, New Delhi.
Government of Tamil Nadu (2014) Health and Family Welfare Department Policy Note2014–15, Government of Tamil Nadu, Chennai.
Graham W J et al. (1996) Demonstrating programme impact on maternal mortality,11(1): 16–20.
Graham et al. (1989) Estimating maternal mortality: The sisterhood method20(3): 125–135
Gupta S D et al. (2010) Maternal mortality ratio and predictors of maternal deaths in selecteddesert districts in Rajasthan: A community based survey and case control study
20: 80–85.
Hill K, S El Arifeen, M Koenig, A Al-Sabir, K Jamil, H Raggers (2006) How should we measurematernal mortality in the developing world? A comparison of household deaths andsibling history approaches. 84:173–80.
Hogan MC et al. (2010) Maternal mortality for 181 countries, 1980–2008: a systematicanalysis of progress towards Millennium Development Goal 5, 375: 1609–23.
Jahn A and V De Brouwere (2001) Referral in pregnancy and childbirth : Concepts andstrategies. 17: 229–246.
Jeffrey, P and R Jeffrey (2010) Only when the boat has started sinking: A maternal death inrural north India, Social Science and Medicine, 71: 1711–18.
Jejeebhoy, Shireen and Saumya R Rao (1992) Unsafe motherhood: A review of reproductivehealth in India. Paper presented at the workshop on the Future of Health andDevelopment in India, National Council for Applied Economic Research and HarvardCenter for Population and Development Studies, New Delhi, 2–4 January.
Joe et al. (2015) Strategies for safe motherhood in Tamil Nadu: A note, Institute of EconomicGrowth Working Paper 354, Institute of Economic Growth, Delhi.
Joe, W (2014) Intersectional inequalities in immunization in India 1992–93 to 2005–06: AProgress Assessment, , forthcoming.
Biometrika
HealthPolicy and Planning
Studies in FamilyPlanning
Women’s Health Issues
Bulletin of World Health Organization
Lancet
Studies in Health Services Organisation and Policy
Health Policy and Planning
23
Kakwani N (1993). Performance in living standards: an international comparison.41(2): 307–336.
Kalaiyarasan A (2014) A comparison of developmental outcomes in Gujarat and Tamil Nadu.49 (15).
Kanitkar, Tara et al. (1994) India: Introductory Report. National Family Health Survey,1992–93. Bombay: International Institute of Population Sciences.
Kolandaswamy, K (2010) Maternal mortality in Tamil Nadu during 2001–10: Varied progressin reducing maternal mortality at the health district level and preventable causesremain unchanged, Unpublished dissertation, National Institute of Epidemiology,Chennai.
Lim, S et al. (2010) India’s Janani Suraksha Yojana, a conditional cash transfer programme toincrease births in health facilities: An impact evaluation. , 375 (9730):2009–23.
Lohr SL and JNK Rao (2009) Jackknife estimation of mean squared error of small areapredictors in nonlinear mixed models. 96: 457–68
McCarthy J and DA Maine (1992) Framework for analyzing the determinants of maternalmortality. 23 (1): 23–33.
McCulloch C and S Searle S (2001). . New York: JohnWiley and Sons.
Mehrotra, S (2006) Well-being and caste in Uttar Pradesh: Why UP is not like Tamil Nadu..
Mishra, US and S Subramanian (2006) On measuring group differentials displayed by socio-
economic indicators. (8): 519–521.
Montgomery AL, U Ram, R Kumar and P Jha (for The Million Death Study Collaborators)(2014) Maternal mortality in India: Causes and healthcare service use based on anationally representative survey. 9(1): e83331
Muraleedharan, V, U Dash and L Gilson (2011) Tamil Nadu 1980s–2005: A success story inIndia, in D Balabanova, M Mckee and A Mills (eds)
, London School of Hygiene and TropicalMedicine, London.
NHSRC (2011) Programme evaluation of the Janani Suraksha Yojana, National HealthSystems Resource Centre, New Delhi.
Osorio, RG (2008) . Technical Paper 2. Brasilia,International Policy Centre for Inclusive Growth.
Journal ofDevelopment Economics
Economic and Political Weekly
The Lancet
Biometrika
Studies in Family Planning
Generalized, linear, and mixed models
Economic and Political Weekly
Applied Economics Letters
PLoS ONE
‘Good Health at Low Cost’ 25 yearson: What makes a good health system
Alternatives for projecting MDGs indicators
13
24
Padmanaban, P et al. (2009) Innovations and challenges in reducing maternal mortality inTamil Nadu, India, , 27(2):202–219.
Pathmanathan, I et al. (2003)The International Bank for Reconstruction and Development / The World Bank,
Washington, DC.
Prata, N, P Passano, A Sreenivas and C E Gerdts (2010) Maternal mortality in developingcountries: challenges in scaling-up priority interventions. 6(2),311–327.
Prennushi, G, G Rubio, K Subbarao (2002) Monitoring and evaluation. In: Klugman, J. (ed),. Washington, DC, World Bank.
Rabe-Hesketh S and A Skrondal (2012) Multilevel and longitudinal modelling using Stata (3edition). StataCorp LP, Texas.
Radkar A (2012) Risk of maternal mortality: Indian scenario, in M. Kappas et al. (eds), Universitatsverlag Gottingen,
117–32.
Rao JNK (2003). . Hoboken: John Wiley & Sons, Inc.
RGI (2006) Maternal mortality in India: 1997–2003: Trends, causes and risk factors, Office ofthe Registrar General & Census Commissioner, India, New Delhi
RGI (2012) Annual Health Survey 2011–12 Fact Sheets, Office of the Registrar General &Census Commissioner, India, New Delhi
RGI (various years) Special bulletin on maternal mortality in India. New Delhi: Office of theRegistrar General & Census Commissioner, India, New Delhi
Rosenfield A and D Maine D (1985) Maternal mortality: a neglected tragedy. Where is the Min MCH? 2 (446), 83–85.
Sengupta, SK and PN Kapoor (1972) Maternal Mortality in India. Technical Studies, Series 1,No. 15. New Delhi: Central Bureau of Health Intelligence. mimeo.
Sen, AK (1981) Public action and the quality of life in developing countries.43: 287–319.
Sharma S and W Joe (2014) . Bookwellpublishers, New Delhi.
Souza JP, et al. (2014). Obstetric transition: the pathway towards ending preventablematernal deaths. BJOG; 121 (Suppl. 1): 1–4.
Subha Sri B and R Khanna (2014), CommonHealth, Jan Swasthya Abhiyan, July.
Journal of Health, Population and Nutrition
Investing in maternal health: Learning from Malaysia and SriLanka.
Women’s Health
Asourcebook for poverty reduction strategies
Globalhealth: A challenge for interdisciplinary research
Small area estimation
Lancet
Oxford Bulletinof Economics and Statistics
National Rural Health Mission: An Unfinished Agenda
Dead women talking: A civil society report on maternaldeaths in India
rd
25
26
Thaddeus S and D Maine (1994) Too far to walk: Maternal mortality in context,, Vol. 38. No. 8, pp. 1091–1110.
United Nations (2000) United Nations Millennium Declaration, United Nations, New York.
United Nations (2012) The millennium development goals report 2012. New York.
Van Lerberghe, W and V De Brouwere (2001) Reducing maternal mortality in a context ofpoverty in Vincent De Brouwere and Wim Van Lerberghe (ed) Safe MotherhoodStrategies: a Review of the Evidence, Studies in Health Services Organisation andPolicy, 17, 2001, ITG Press, Antwerp, Belgium.
Vandemoortele, Jan (2009) The MDG conundrum: Meeting the targets without missing thepoint. 27(4): 355–71.
Vandemoortele, Jan and E Delamonica. (2010). Taking the MDGs beyond 2015: Hastenslowly. 41 (1): 60–69.
Vora, K et al. (2009) Maternal health situation in India: A case study.27 (2):184–201.
Waage, J. et al. (2010) The Millennium Development Goals: a cross-sectoral analysis andprinciples for goal setting after 2015. (376): 991–1023.
WHO and UNICEF (1996) Revised 1990 estimates of maternal mortality. A new approach byWHO and UNICEF, Geneva: WHO.
World Bank (2012) Delivering the Millennium Development Goals to reduce maternal andchild mortality: A systematic review of impact evaluation evidence. IndependentEvaluation Group, The World Bank, Washington DC.
World Health Organization (1978) Declaration of Alma Ata, WHO.
World Health Organization (1986) Maternal mortality: helping women off the road to death.
(5): 175–183.
World Health Organization (1990) Maternal Mortality: AGlobal Factbook. Geneva: WHO.
World Health Organization (2009) Safer pregnancy in Tamil Nadu: From vision to reality,World Health Organization, Regional Office for South-East Asia, New Delhi.
World Health Organization (2012) Trends in maternal mortality: 1990 to 2010, Geneva:WHO.
Social Scienceand Medicine
Development Policy Review
IDS Bulletin
Journal of Health,Population and Nutrition
Lancet
WHO Chronicle 40
RECENT WORKING PAPERS
Title Name of Author(s) Paper No.
Demand for Price Insurance among
Farmers in India: A Choice
Experiment-based Approach
Social Capital as Obstacle to
Development: Brokering Land,
Norms, and Trust in Rural India
Boom and Bust? A Political
Economy Reading of India's
Growth Experience, 1993-2013
Anomaly in Decision Making Under
Risk: Violation of Stochastic Dominance
Among Farmers in Gujarat, India
China's Manufacturing Success:Lessons for India
The Role of Exports inIndia's Economic Growth
Financing for Health Coverage in India:Issues and Concerns
Women Police in the City of Delhi:Gender Hierarchies, 'Transgression',and 'Pariah Femininities'
Bank Regulation, Supervision, andPerformance around the World:What has been the Change sincethe Global Financial Crisis?
Reducing Poverty in India:The Role of Economic Growth
Thiagu Ranganathan
Sarthak Gaurav
Ashish Singh
Michael Levien
Kunal SenSabyasachi Kar
Thiagu Ranganathan
Sarthak Gaurav
Ashish Singh
Pravakar SahooAbhirup Bhunia
Pradeep Agrawal
Indrani GuptaSamik Chowdhury
Santana Khanikar
Vighneshwara Swamy
Pradeep Agrawal
E/340/2014
E/341/2014
E/342/2014
E/343/2014
E/344/2014
E/345/2015
E/346/2015
E/347/2015
E/348/2015
E/349/2015
Infrastructure in India:Challenges and the Way Ahead
Pradeep Agrawal E/350/2015
William JoeAtish Kumar DashPradeep Agrawal
Demographic Transition, Savings, andEconomic Growth in China and India
E/351/2015
William JoeUdaya Shankar Mishra
On Reckoning Level Differentials in theMeasurement of Progress: An Illustrationin the Context of Deliveries Assisted bySkilled Health Personnel