INTRODUCTION Over half of American women with a child less than 1 year of age are currently in the labor force. 1 For many women, a child’s birth signals numerous changes in the daily schedule at work and at home that both the family and employer must confront and resolve. This report examines trends in maternity leave and employment patterns of women who gave birth to their first child between January 1961 and December 1995. The report primarily uses retrospective fer- tility, employment, and maternity leave data from the 1996 panel of the Census Bureau’s Survey of Income and Program Participation (SIPP), conducted in 1996. However, previ- ously published results based on similarly collected information from the 1984 and 1985 SIPP panels are also included. 2 The report first discusses changes in char- acteristics of first-time mothers since the 1960s that are related to the likelihood of employment during pregnancy. These changes are placed in the historical context of the enactment of family-related legisla- tion over the last quarter-century to better understand major work transformations that have occurred in women’s pre- and post-birth employment experiences. U S C E N S U S B U R E A U Helping You Make Informed Decisions U.S. Department of Commerce Economics and Statistics Administration U.S. CENSUS BUREAU Maternity Leave and Employment Patterns: 1961-1995 Demographic Programs Household Economic Studies Issued November 2001 P70-79 Current Population Reports By Kristin Smith Barbara Downs Martin O’Connell 1 Amara Bachu and Martin O'Connell. Fertility of American Women: June 2000. Current Population Reports, P20-543. U.S. Census Bureau: Washington, DC, 2001. 2 Data shown for 1981 to 1994 were collected in the SIPP 1996 Panel, Wave 2. Data shown for 1961 to 1980 was collected in the SIPP 1984 and 1985 panels. For more information on the previously published report, see Martin O'Connell. "Maternity Leave Arrangements: 1961-85," in Work and Family Patterns of American Women. Current Population Reports, Series P23, No.165. U.S. Census Bureau, Washington, DC, 1990. What’s in this Report? INTRODUCTION FIRST-TIME MOTHERS AND FAMILY LEGISLATION SINCE THE 1960s Characteristics of mothers at first birth Legislation related to employment and childbearing EMPLOYMENT HISTORY BEFORE THE FIRST BIRTH Overall trends: 1961-65 to 1991-95 Women who work during first pregnancy Duration of work during pregnancy Working during pregnancy: Who works the longest? MATERNITY LEAVE ARRANGE- MENTS Changes in leave arrangements since the 1960s Leave arrangements before and after first birth Who receives maternity leave and who leaves their job? RETURNING TO WORK Trends since the 1960s Likelihood of a rapid return to work Returning to the same or a different employer
Transcript
INTRODUCTION
Over half of American women with a childless than 1 year of age are currently in thelabor force.1 For many women, a child’sbirth signals numerous changes in the dailyschedule at work and at home that both thefamily and employer must confront andresolve. This report examines trends inmaternity leave and employment patternsof women who gave birth to their first childbetween January 1961 and December1995.
The report primarily uses retrospective fer-tility, employment, and maternity leave datafrom the 1996 panel of the Census Bureau’sSurvey of Income and Program Participation(SIPP), conducted in 1996. However, previ-ously published results based on similarlycollected information from the 1984 and1985 SIPP panels are also included.2
The report first discusses changes in char-acteristics of first-time mothers since the1960s that are related to the likelihood ofemployment during pregnancy. Thesechanges are placed in the historical contextof the enactment of family-related legisla-tion over the last quarter-century to betterunderstand major work transformationsthat have occurred in women’s pre- andpost-birth employment experiences.
U S C E N S U S B U R E A UHelping You Make Informed Decisions
U.S.Department of CommerceEconomics and Statistics Administration
U.S. CENSUS BUREAU
Maternity Leave andEmployment Patterns: 1961-1995
Demographic Programs
Household Economic Studies
Issued November 2001
P70-79
CurrentPopulationReports
ByKristin SmithBarbara DownsMartin O’Connell
1Amara Bachu and Martin O'Connell. Fertility ofAmerican Women: June 2000. Current PopulationReports, P20-543. U.S. Census Bureau: Washington, DC,2001.
2Data shown for 1981 to 1994 were collected in theSIPP 1996 Panel, Wave 2. Data shown for 1961 to 1980was collected in the SIPP 1984 and 1985 panels. Formore information on the previously published report,see Martin O'Connell. "Maternity Leave Arrangements:1961-85," in Work and Family Patterns of AmericanWomen. Current Population Reports, Series P23, No.165.U.S. Census Bureau, Washington, DC, 1990.
What’s in this Report?
INTRODUCTION
FIRST-TIME MOTHERS ANDFAMILY LEGISLATION SINCETHE 1960sCharacteristics of mothers at firstbirth
Legislation related to employmentand childbearing
EMPLOYMENT HISTORYBEFORE THE FIRST BIRTHOverall trends: 1961-65 to 1991-95
Women who work during firstpregnancy
Duration of work during pregnancy
Working during pregnancy: Whoworks the longest?
MATERNITY LEAVE ARRANGE-MENTSChanges in leave arrangementssince the 1960s
Leave arrangements before andafter first birth
Who receives maternity leave andwho leaves their job?
RETURNING TO WORKTrends since the 1960s
Likelihood of a rapid return to work
Returning to the same or a differentemployer
2 U.S. Census Bureau
Second, the report examines thetrends in women’s work experienceprior to their first birth and the fac-tors associated with employmentduring pregnancy. Third, it considersthe maternity leave arrangementswomen use both before and aftertheir first birth and identifies theshifts that have occurred in the mixof leave arrangements used by first-time mothers. The report concludeswith an examination of how rapidlymothers with newborns return towork and the factors related to thelength of time absent from the laborforce in the post-birth period.
In addition to updating childbearing,employment, and maternity leavetrends through the mid-1990s, thisreport covers new substantiveground. Specifically, it detailschanges the mother experienced inthe number of hours worked, paylevel, and job skill level after thebirth of the first child relative to thelast job held before the child wasborn. These changes are examinedin relation to whether a womanreturned to the same employer shehad during pregnancy or changedemployers after the birth of the child.
Over the time period studied in thisreport, many social, economic, andlegislative changes have occurred inAmerican society. This sectionbegins with a summary of the char-acteristics of mothers around thetime of their first birth and ends witha discussion of these societalchanges.
Characteristics of mothersat first birthTwo important factors are likely toshape women’s employment historiesprior to first birth: their age at thetime of the birth and their education-al attainment level. Younger womenare still developing job skills andoften have yet to complete their edu-cational careers as teenagers or evenby their mid-twenties, the age bywhich marriage and motherhood fre-quently have begun. Women whohave delayed childbearing until theirthirties are more likely to have com-pleted their schooling and accumulat-ed more years of work experienceprior to their first birth. This experi-ence, in turn, may affect their incomelevel and job security and influencetheir decisions about working during
pregnancy and how soon after theirchild’s birth to return to work.
How have these two characteristicschanged over time? Data from theNational Center for Health Statistics(NCHS) show that first-time mother-hood at age 30 and over tripledbetween 1960 and 1995, from 7 per-cent to 22 percent.3 The educationalattainment level of first-time mothershas also increased since 1970, partlybecause older women, who make upan increasing proportion of first-timemothers, have higher education lev-els than younger first-time mothers.In 1970, 10 percent of first-timemothers had 16 or more years ofeducation, compared with 23 percentin 1995.
During this time, increasing propor-tions of women in these older child-bearing age groups—women 25 to34 years old—continued their educa-tion beyond high school.4 The pro-portion of women 25 to 34 years oldwho had completed 4 or more yearsof college increased from 8 percentin 1960 to 12 percent in 1970 andfurther increased to 21 percent by1980. These years closely corre-spond to the development of thewomen’s movement and issues relat-ed to the family and the workingenvironment. By 1995, this propor-tion again increased, but only slightlyto 25 percent. As the age and edu-cational composition of first-timemothers may be related to changesin their workforce behavior, thesetwo indicators will often be exam-ined in the ensuing sections of thisreport.
SIPP FERTILITY, EMPLOYMENT, AND MATERNITY LEAVE DATA
The 1996 panel of the Survey of Income and Program Participation(SIPP), which was a nationally representative survey of approximately37,000 households, included a fertility module in the second wave ofinterviews conducted in August-November, 1996. Information was col-lected on the birth dates of the first and last children born to all women15 to 64 years old at the time of the survey. Women whose first birthoccurred between 1980 and the survey date were also asked a seriesof questions concerning their employment history before and aftertheir pregnancy, as well as their receipt of maternity leave benefits.Data from this survey were used in combination with similar informa-tion collected in the 1984 and 1985 SIPP panels to provide an extendedseries of employment and maternity leave data between 1961 and1995.
3National Center for Health Statistics. VitalStatistics of the United States, Vol. 1-Natality.U.S. Government Printing Office: Washington,DC, annual issues. Data on educational attain-ment of the mother were not published until1969 and only then from a sample of states.
4Jennifer Day and Andrea Curry. EducationalAttainment in the United States: March 1995.Current Population Reports, P20-489. U.S.Census Bureau, Washington, DC, 1996, Table 17.
U.S. Census Bureau 3
Legislation related to employ-ment and childbearingIn addition to the changes noted inthe age and educational structure ofmothers, changes in the work envi-ronment related to maternity andemployment issues need to be con-sidered. In the 1960s, a commonexpectation for women was that theywould leave work upon becomingpregnant.5 In 1978, the PregnancyDiscrimination Act was passed whichprohibited employment discrimina-tion on the basis of pregnancy orchildbirth. This act covered hiringand firing policies as well as promo-tions and pay levels. Also at thistime, changes to the federal tax codein 1976 permitted working familieswith a dependent child to take a taxcredit on child care costs. Both theseactions clearly marked the beginningof federal involvement in work-relat-ed issues and concerns of mothers.These laws affected both employ-ment practices during pregnancy andnet child care costs after the childwas born, the latter item stronglyrelated to the affordability of childcare services which would enable amother to return to work.
Job security and flexibility in thework schedule are important con-cerns a mother with a newborn childfaces when deciding when to returnto work. Flexible work schedulesand employment-based child carebenefits became popular employeeissues during the 1980s, just aboutthe time when fertility rates in theUnited States began to increasesteadily, especially among women 30years and older.6 In addition, a land-mark U.S. Supreme Court decision in
1987, California Federal Savings andLoan Association v. Guerra, upheld aCalifornia law requiring most employ-ers to grant pregnant women 4months of unpaid disability leave andthe right to return to their same job.
The most comprehensive federal actto date relative to maternity leaveand employment policies is theFamily and Medical Leave Act of1993 (FMLA) which mandates up to12 weeks of unpaid leave for child-bearing or family care over a 12-month period for eligible employees.Eligible employees are defined asthose who worked for at least 1 yearfor their current employer, and whoworked for at least 1,250 hours dur-ing the previous 12 months, andwho worked for a business employ-ing 50 or more employees. Forwomen who are employed part timeor work in small businesses forwhich the FMLA does not apply, boththe families and employers are facedwith a dilemma: how to reconcile themedical and emotional needs of themother and infant with the require-ments of the employer and the finan-cial needs of the family.
Another noteworthy change over thistime period is the increased impor-tance of a second income to thehousehold’s overall economic well-being. Stagnant men’s wages cou-pled with rapidly rising housingprices and the prices of other goodsbeginning in the 1970s and continu-ing into the 1980s translated intoboth spouses working outside thehome.7 To remain in the middleclass, mothers were increasinglycalled upon to remain in the workforce.
It is important to interpret the notedchanges in the age and educationalstructure of mothers with infants inconjunction with the historical back-
ground of the women’s movement,and the legislative and economicchanges of the 1970s and 1980s.While the demographic factors mayhave changed the normative balancebetween work and family life formothers, the legal, economic, andcultural changes in this period werealso important and may have fos-tered a working environment for thisBaby Boom generation of womenthat was quite different from that oftheir mothers.
EMPLOYMENT HISTORYBEFORE THE FIRST BIRTH
This section starts with a descriptionof overall trends in women’s employ-ment histories from 1961-65 to1991-95 and then describes the char-acteristics of women who work dur-ing their first pregnancy.
Overall trends: 1961-65 to1991-95 Over the years, the disparity betweenthe percentage of women who everworked before becoming mothersand the percentage working whilepregnant with their first child (here-after referred to as “pregnant” or“pregnancy”) has diminished.8
Figure 1 shows that the percentageof women who have ever worked for6 or more consecutive months9
increased from 60 percent in 1961-65 to 74 percent in 1991-95.10
Only 44 percent of women workedduring their pregnancy in 1961-65but by 1991-95 the threshold had
5Andrew Cherlin. Marriage, Divorce,Remarriage. Harvard University Press:Massachusetts, 1992.
6David E. Bloom and Jane T. Trahan. FlexibleBenefits and Employee Choice. Pergamon Press:New York, 1986; Martin O'Connell and David E.Bloom. Juggling Jobs and Babies: America'sChild Care Challenge. Population Trends andPublic Policy, No. 12. Population ReferenceBureau: Washington, DC, 1987.
7Frank Levy. Dollars and Dreams: TheChanging American Income Distribution.Russel Sage Foundation: New York, 1987.
8For the remainder of this report, the term"pregnancy" is used to refer to the pregnancypreceding the first birth to facilitate reader com-prehension, although a woman's first pregnan-cy may not result in her first birth.
9Working for 6 consecutive months is astandard labor force indicator which measuresthe likelihood of a serious commitment to thelabor force.
10The estimates in this report are based onresponses from a sample of the population.As with all surveys, estimates may vary fromthe actual (population) because of samplingvariation, or other factors. All statementsmade in this report have undergone statisticaltesting and meet Census Bureau standards forstatistical accuracy.
4 U.S. Census Bureau
risen considerably, as 67 percentworked while pregnant.
Most of the gains in these indicatorswere made by the 1976-80 period,about the time that the PregnancyDiscrimination Act was passed.Although we cannot disentangle theeffects of social change and legisla-tion, it is important to note thatthese social and legislative changesoccurred at roughly the same pointin time. Between 1976-80 and 1991-95, the proportion of womenwho had ever worked for 6 or moreconsecutive months ranged between74 percent and 75 percent, while theproportion who worked during preg-nancy increased by 5 percentagepoints. In comparison, both thesemeasures increased — by 13 per-centage points and 17 percentagepoints, respectively — between the1961-65 and 1976-80 periods (seeTable A).11
As previously mentioned, age andeducational level strongly influencethe likelihood of entering the laborforce. Table B presents, for the most
recent period, the percentage ofwomen employed for at least 6 con-secutive months at any time beforethe birth of their first child, by age.The likelihood of working rises rapid-ly with age. By ages 25 to 29,approximately 9 out of 10 womenwho had a first birth in 1991-95 hadworked for at least 6 consecutivemonths.
Table B also shows this proportion byeducational attainment level forwomen 25 years and over, an agewhen most women are old enoughto have graduated from high schoolor have attended or graduated fromcollege. Clearly, educational back-ground and attendant job skills aresignificantly related to the likelihoodof working before the first birth.Significant differences in employmentexperience occur between thosemothers who did not graduate fromhigh school and those with moreeducation. No significant differenceswere found in employment rates
Figure 1.
Women Who Ever Worked for Pay Continuously for6 or More Months Before Their First Birth, and WhoWorked During Pregnancy: 1961-65 to 1991-95(Percent)
Source: Tabulations derived from Current Population Reports, Series P23-165, Tables C and B-2, and this report, P70-79, U.S. Census Bureau, Survey of Income and Program Participation (SIPP), 1996 Panel, Wave 2.
Year of first birth
11In contrast, overall labor force participa-tion rates for women, regardless of pregnancystatus, progressed more smoothly for theseperiods: 32 percent in 1960, 43 percent in1970, 52 percent in 1980, and 58 percent in1990 (see the Bureau of Labor Statistics Website at www.bls.gov/pdf/cpsaat2.pdf).
Table A.Employment History Before First Birth:1961-65 to 1991-95(In thousands)
1At any time before first birth.2Full-time/part-time status refers to last job held before first child’s birth.
Note: Numbers in parentheses represent the 90-percent confidence interval for the esti-mated percent.
Source: Tabulations derived from Current Population Reports, Series P23-165, Tables Cand B-2, and this report, P70-79, U.S. Census Bureau, Survey of Income and ProgramParticipation (SIPP), 1996 Panel, Wave 2.
U.S. Census Bureau 5
among college-educated mothers bywhether they had completed college.
In 1991-95, the majority of womenwho worked during pregnancyworked at full-time jobs (35 hours ormore per week; see Table A). Theproportion of women working fulltime during pregnancy increasedfrom the 1960s to the 1980s, anddeclined slightly in the early 1990s.However, there was an increase inpart-time work in the 1990s.Whether this relative shift from full topart-time work is a function of thetype of work available or women’sdesires to minimize work hours out-side the home cannot be discernedfrom the data. However, subsequentsections of this report will show theimportance of the number of hoursworked while pregnant and theamount of leave taken from theworkforce around the time of thefirst birth in determining the type ofmaternity benefits received.
Women who work duringfirst pregnancy
Table C summarizes the trends inwomen’s work experience duringpregnancy since the early 1960s.With one exception (1966-70), moth-ers under age 18 and age 18 and 19had consistently lower rates ofemployment compared with women25 to 29 years old and 30 years oldand over. Of course, many youngermothers had not finished school andwould not be expected to favorablycompete in the job market, even ifthey were not pregnant.
Differences in employment ratesbetween age groups also increased.Since 1961-65, employment ratesincreased from 29 percent to 46 per-cent for mothers 18 and 19 yearsold, and from 54 percent to about 84 percent for mothers 25 to 29years old. Again, it should be notedthat the greatest increases in employ-ment for women 25 years and overoccurred in the first 20-year segmentshown in the table (1961-65 to 1976-
80) rather than in the second 15-yearsegment since the 1980s.
Since 1961-65, White women havebeen most likely to have worked dur-ing their first pregnancy.12 Asian andPacific Islander women haveincreased their employment ratesduring their pregnancy since 1981-85, the first year with data for analy-sis. Hispanics and Blacks haveremained at fairly constant levelssince 1981-85, although Blackwomen have experienced significantincreases in employment rates since1961-65.
Figure 2 shows for the most recentbirth period, 1991-95, employmentrates by age and race and ethnicityof the mother. Among women whohad their first child between 1991and 1995, White non-Hispanicwomen, regardless of age, weremore likely to work while pregnantthan either Black women or Hispanicwomen. Among mothers under age18, Black women and Hispanicwomen were equally likely to haveworked during pregnancy (about 17 percent). After age 22, Blackwomen were more likely to haveworked during their pregnancy thanHispanic women. It is interesting tonote that the large differences thatexisted between White non-Hispanicwomen and Black women betweenthe ages 18 and 19 (about 18 per-centage points) were considerablyless for older age groups (about 8 percent for ages 22 to 24 and 25and over). It may be that womenwho delay childbearing do so becausethey are employed, and are thereforemore likely to be in the labor force atthe time of their pregnancy.
Table B.Women Who Ever Worked for Pay Continuously for 6 orMore Months Before Their First Birth: 1991-951
Age at first birthLess than 18 years . . . . . . . . . . . . . . . . 814 218 26.818 and 19 years. . . . . . . . . . . . . . . . . . . 1,223 638 52.220 and 21 years. . . . . . . . . . . . . . . . . . . 1,148 752 65.522 to 24 years . . . . . . . . . . . . . . . . . . . . 1,543 1,236 80.125 to 29 years . . . . . . . . . . . . . . . . . . . . 2,024 1,798 88.930 years or older . . . . . . . . . . . . . . . . . . 1,847 1,703 92.2
Edcuational attainment2
Less than high school. . . . . . . . . . . . . . 184 103 56.1High school graduate . . . . . . . . . . . . . . 781 675 86.4Some college, no degree. . . . . . . . . . . 1,184 1,093 92.3Bachelor’s degree or more . . . . . . . . . 1,721 1,630 94.7
1Includes work at any time before the first birth, regardless of whether a woman workedduring the pregnancy.
2Limited to women age 25 and over at the time of first birth.
Source: U.S. Census Bureau, Survey of Income and Program Participation (SIPP), 1996Panel, Wave 2.
12Categories are not exclusive. Blacks maybe Hispanic. Hispanics are of any race. Datafor the American Indian and Alaska Native pop-ulation are not shown in this report because oftheir small sample size in the Survey of Incomeand Program Participation (SIPP) in the 1996Panel. Based on the 1996 SIPP Panel, Wave 2maternity leave data, 6 percent of the Blackpopulation and 6 percent of the Asian andPacific Islander population are also of Hispanicorigin.
6 U.S. Census Bureau
A mother’s educational level is alsoassociated with the probability thatshe will work during her first preg-nancy. Table C shows that in 1991-95, women with college degreeswere much more likely to work dur-ing pregnancy (87 percent) than werewomen with less than a high schooldiploma (29 percent) or women whohad just graduated high school (60 percent). Women with more edu-cation may have jobs more con-ducive to accommodating pregnancy.For example, they may be more like-ly to sit during the day, not engagein manual labor or be exposed tohazardous materials or conditions,and may have rest facilities available.Their schedules may also be moreflexible, allowing for ease of schedul-
ing medical appointments, or latearrivals/early departures.
Since 1966-70, women who hadtheir first child before their first mar-riage were least likely to haveworked while pregnant, while thosewho had their first child after theirfirst marriage ended were more likelyto have worked while pregnant.13
Women who have their first childprior to marriage are generallyyounger and more likely to be of aminority race or ethnic group, andthus to have lower levels of educa-tion and labor market experience or
skills. Women who have their firstbirth within or after their first mar-riage are more likely to be older andalready in the labor force at the timethey become pregnant. As will beshown, after statistically controllingfor the effect of these variables—age,education, and race—the marital sta-tus of the mother at the time of herfirst birth has very little relationshipto the likelihood of her working dur-ing pregnancy.
In general, the changing age andeducational composition of motherssince the 1960s has shifted to thosegroups who are also more likely tohave either a prior work historybefore first birth or are more likely towork while pregnant—namely, olderand more educated women.
Table C.Women Who Worked During Pregnancy by Selected Characteristics:1961-65 to 1991-95(Percent working in specific category)
1Refers to marital status at time of first birth. Before first marriage includes never married women. After first marriage includes first birthsoutside or within second or subsequent marriages.
Source: Tabulations derived from Current Population Reports, Series P23-165 Table C and this report, P70-79, U.S. Census Bureau,Survey of Income and Program Participation (SIPP), 1996 Panel, Wave 2.
13Discussion of estimates for 1966-70 to1976-80 is on page 14 of "Maternity LeaveArrangements: 1961-85," by Martin O'Connell,in Work and Family Patterns of AmericanWomen. Current Population Reports, Series P23,No.165. U.S. Census Bureau, Washington, DC,1990.
U.S. Census Bureau 7
Duration of work duringpregnancyIn 1961-65, 13 percent of womenwho worked during pregnancyreported they stopped working dur-ing their first trimester (6 or moremonths before the birth), and only23 percent worked until less than 1 month before the birth of their firstchild (see Table D). A key transitionoccurred between 1971-75 and1981-85 when the percentage ofwomen who left work in their firsttrimester declined from 13 percent to5 percent while the proportion work-ing within 1 month of their child’sbirth jumped from 27 percent to 53 percent. Since 1981-85, thosepercentages have varied only by 2 percentage points for either indica-tor.14
Since 1981-85, the percentage ofpregnant women who worked full
time has declined slightly from 89 percent to 82 percent.15 Perhapsthe composition of available workhas changed, making part-time workincreasingly available. On the otherhand, women with more labor forceexperience or education may nowhave the skills or seniority todemand part-time work while preg-nant, more than they did in the past.This change may be tied to the shiftin age structure of women at firstbirth, to older ages since 1961.
The bottom panel of Table D showsthat in the early 1960s there was lit-tle variation in the proportion ofwomen who were full-time workersby the month they stopped workingin their pregnancy. Among womenwho had their first birth in 1961-65,about 9 out of 10 women worked atfull-time jobs, regardless of whenthey stopped working. With theexception of 1976-80, for all subse-quent periods, women who left theirjobs in their first trimester of their
pregnancy were less likely to be full-time workers than women whoworked within a month of the birthof their child. In 1961-65, 88 percentof women who stopped working intheir first trimester were full time,not different from the percentage forwomen who worked until 1 monthbefore their child’s birth. In 1991-95,89 percent of women who workedwithin one month of their child’sbirth worked full time compared with72 percent of women who stoppedworking in their first trimester. Ingeneral, Table D suggests thatwomen who expressed the mostcommitment to their jobs, the full-time workers, remained at work untilthey became mothers.
Working during pregnancy:Who works the longest? As shown previously, women withmore years of schooling are morelikely to be employed during theirpregnancy, reflecting both their jobskills and educational training gear-ing them towards employment afterschool. The previous report in thisseries noted that in the early 1960s,women who worked longer into theirpregnancy were those in need ofmore financial assistance, especiallyhigh school dropouts who may havehad low paying jobs.16 However, dur-ing the 1980s and 1990s, college-educated women began to work intothe last trimester of their pregnancymore often than women with lessthan a high school education (seeFigure 3). The earlier report suggest-ed that women in the 1980s mayhave begun to work longer into theirpregnancy for reasons other thanimmediate financial needs, perhapsviewing their jobs from a long-termperspective such as subsequent jobopportunities with their employerafter the birth of their child. Thiscurrent report corroborates this find-ing.
Figure 2.
Women Who Worked During Pregnancy by Age atFirst Birth and Race and Ethnicity: 1991-95
(Percent)
2 54
55 32
30
Less than 18 18 and 19 20 and 21 22 to 24 25 and over
Source: U.S. Census Bureau, Survey of Income and Program Participation (SIPP), 1996 Panel, Wave 2.
Age at first birth
25
17 16
55
3631
65
4740
77
69
45
89
81
66
White non-HispanicBlackHispanic (of any race)
15Bureau of Labor Statistics data show thatthe percentage of employed workers workingpart time increased over the 1970s and 1980s,and then began to decrease in the late 1990s.
14It is interesting to note that of the 53 per-cent of women who worked within 1 month oftheir child's birth in 1991-95, about one-half ofthese women (27 percent) reported that theyhad never stopped working during their preg-nancy.
16 Op cit., O'Connell, 1990, pp. 16-17.
8 U.S. Census Bureau
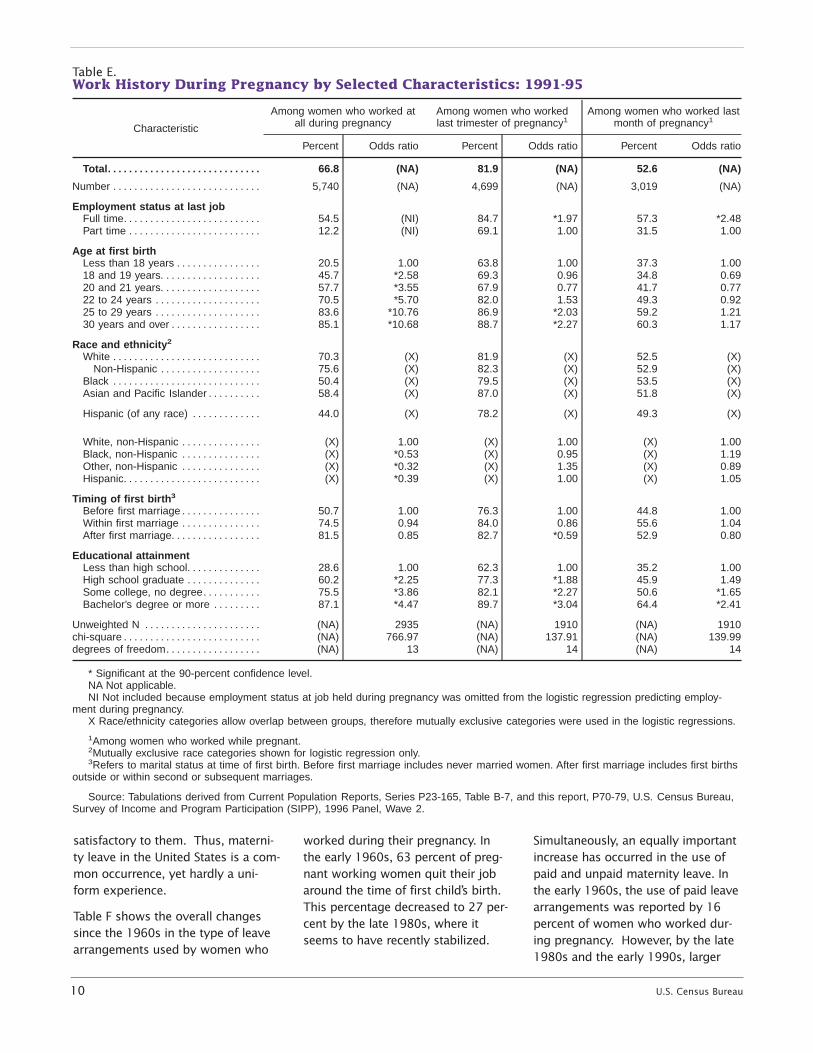
Figure 3 shows that this pattern hascontinued since the 1980s. By 1991-95, 90 percent of college grad-uates who had worked during theirpregnancy were employed at leastuntil their last trimester (less than 3months before their child’s birth)compared with 62 percent of womenwho had not graduated from highschool. In fact, Table E shows for themost recent 5-year period of births (1991-95), a much higher proportionof college graduates had worked dur-ing the last month of pregnancy (64 percent) as did women with lessthan a high school education (35 per-cent). The changing relationship ofeducational attainment and workduring pregnancy is perhaps relatedto the changing composition of theU.S. workforce. As more womenenter the workforce, highly educatedemployees may be more valued andrewarded by their employer and
encouraged to stay as long at workas possible.
For the most recent study period,1991-95, Table E presents data fordifferent socioeconomic groups ontheir likelihood of working during dif-ferent stages of pregnancy. Becausethe characteristics shown in Table Eare closely related to each other—forexample, younger women also tendto be less educated—a multivariateanalysis was used to ascertain theindependent effects of each of thelisted variables on the likelihood ofworking during pregnancy, statistical-ly controlling for each of the otherfactors. For each of the time inter-vals shown in Table E, two columnsare shown: the “Percent” columnsshow the simple percentage ofwomen working, while the “Oddsratio” columns show the likelihood ofa woman with that characteristicworking in that time interval relative
to a woman in the reference catego-ry. It is this latter column that indi-cates the relationship between thecharacteristic and the likelihood ofworking, after taking into accountthe other variables in the analysis.17
In general, women most likely towork late into their pregnancy arefull-time workers, older women, andwomen with more years of school-ing. Table E shows percentages andodds ratios predicting the likelihoodof working during different stages ofpregnancy. Working at a full-time jobduring pregnancy is strongly associ-ated with the likelihood of workingin both the last trimester and the lastmonth of pregnancy. After statistical-ly controlling for the effects of other
Table D.Women Who Worked During Pregnancy: 1961-65 to 1991-95(In thousands)
1Among women who worked while pregnant.2Full time employment status refers to last job held before birth of first child.
Source: Tabulations derived from Current Population Reports, Series P23-165, Tables B and B-6, and this report, P70-79, U.S. CensusBureau, Survey of Income and Program Participation (SIPP), 1996 Panel, Wave 2.
17An odds ratio of 1.0 indicates that awoman with this characteristic is as likely to beworking as a woman with the specified refer-ence or comparison characteristic. Ratios under1.0 or over 1.0 indicate that a woman is lesslikely or more likely to work, respectively.
U.S. Census Bureau 9
factors, women who worked full timeat their last job during pregnancywere about two times as likely towork until the last trimester and twoand a half times as likely to workuntil the end of their pregnanciesthan part-time workers.
Likewise, women who were older atthe time of their first birth were morelikely to work during pregnancy andalso later in pregnancy than theiryounger counterparts. Older womenmay have more permanent jobs thatenable or require them to maintaininvolvement in their work until closeto the time their child is born. Theodds that pregnant women age 25 orolder at their first birth were workingin the last trimester of pregnancy,was about twice that of teenagers.However, there were no statisticallysignificant differences by age in thelikelihood of working in the lastmonth of pregnancy, after controllingfor other factors in the statisticalmodel.
Race and ethnicity are significantlyassociated with whether a woman
works at all during her first pregnan-cy, with White non-Hispanic womenbeing more likely to work than othergroups. However, there were no dif-ferences by race in the proportionsof women working until late in theirpregnancies.
Similarly, although women who hada child before their first marriageappear to be the least likely group ofwomen to work either during preg-nancy or late into their pregnancy,these differences are minimized bycontrolling for the other factors.
For all of the intervals shown in Table E, educational attainment clear-ly maintains a significant relationshipwith working during pregnancy.More highly educated women maybe in career positions that require agreater show of commitment thanthe jobs of women with fewer yearsof school completed. Only 35 per-cent of women who had failed tocomplete high school worked in theirlast month of pregnancy comparedwith 64 percent of pregnant workerswith at least a bachelor’s degree.
Other factors in the statistical modeldid not diminish this pattern.
The data suggest that working dur-ing pregnancy is closely associatedwith job commitment and skill levelof the worker. Women who areemployed at full-time jobs and who,by the nature of their level of educa-tional attainment, are employed atmore highly skilled jobs, maintaintheir ties to the labor force for themajority of the months of their preg-nancy. As will be shown, employ-ment history is closely related to thetypes of maternity benefits receivedand the rapidity of returning to workafter childbirth.
MATERNITY LEAVEARRANGEMENTS
This section first provides anoverview of the changes in maternityleave arrangements since the 1960s.Next, it discusses leave arrange-ments women use before and afterthe birth of their first child, and endswith a comparison of women whotake maternity leave and return towork with women who quit workingwhen they have their first child.
Changes in leave arrange-ments since the 1960sPeriods of maternity leave are impor-tant for families as infants requireconsiderable care and mothers needtime to recover from pregnancy andchildbirth. Businesses also benefitfrom offering maternity leave (bothpaid and unpaid) if it leads to greaterjob retention, because they can avoidthe time and financial costs of find-ing and training new employees.18
Because there is no consistent formalstructure for maternity leave in theUnited States, women must oftenindividually patch together a plan ofboth paid and unpaid leave, the sumtotal of which may or may not be
Source: Tabulations derived from Current Population Reports, Series P23-165, Table B-7, and this report, P70-79, U.S. Census Bureau, Survey of Income and Program Participation (SIPP), 1996 Panel, Wave 2.
Year of first birth
Figure 3.
Women Who Worked in the Last Trimester ofPregnancy by Education Level: 1961-65 to 1991-95(Among women who worked during pregancy)
18Commission on Family and Medical Leave.A Workable Balance: Report to Congress onFamily and Medical Leave Policies. U.S.Department of Labor: Washington, DC, 1996.
10 U.S. Census Bureau
satisfactory to them. Thus, materni-ty leave in the United States is a com-mon occurrence, yet hardly a uni-form experience.
Table F shows the overall changessince the 1960s in the type of leavearrangements used by women who
worked during their pregnancy. Inthe early 1960s, 63 percent of preg-nant working women quit their jobaround the time of first child’s birth.This percentage decreased to 27 per-cent by the late 1980s, where itseems to have recently stabilized.
Simultaneously, an equally importantincrease has occurred in the use ofpaid and unpaid maternity leave. Inthe early 1960s, the use of paid leavearrangements was reported by 16percent of women who worked dur-ing pregnancy. However, by the late1980s and the early 1990s, larger
Table E.Work History During Pregnancy by Selected Characteristics: 1991-95
Characteristic
Among women who worked atall during pregnancy
Among women who workedlast trimester of pregnancy1
Among women who worked lastmonth of pregnancy1
Percent Odds ratio Percent Odds ratio Percent Odds ratio
* Significant at the 90-percent confidence level.NA Not applicable.NI Not included because employment status at job held during pregnancy was omitted from the logistic regression predicting employ-
ment during pregnancy.X Race/ethnicity categories allow overlap between groups, therefore mutually exclusive categories were used in the logistic regressions.
1Among women who worked while pregnant.2Mutually exclusive race categories shown for logistic regression only.3Refers to marital status at time of first birth. Before first marriage includes never married women. After first marriage includes first births
outside or within second or subsequent marriages.
Source: Tabulations derived from Current Population Reports, Series P23-165, Table B-7, and this report, P70-79, U.S. Census Bureau,Survey of Income and Program Participation (SIPP), 1996 Panel, Wave 2.
U.S. Census Bureau 11
proportions of pregnant workingwomen used paid maternity leave(43 percent). The use of unpaidleave increased in a similar manner.Of the 5.7 million women whoworked during pregnancy, only asmall percentage (14 percent) usedboth paid and unpaid leave in 1991-95.
No more than 5 percent of pregnantwomen were let go from their jobover the entire study period. The useof disability leave increased from 6percent in the early 1980s to 11 per-cent in the early 1990s (disabilityleave data were not specifically col-lected in earlier periods but mayhave been reported in the other
types of paid or unpaid leavearrangements).
These trends are likely related toother changes in the lives ofAmerican women over this sametime period. Women are havingbirths at later ages and are more like-ly to be college graduates, trendswhich translate into greater workexperience before first birth andstronger commitment to the laborforce. Employers, more than ever,may perceive women as integral totheir work force and may be morelikely to offer maternity leave as ajob benefit when they weigh thecosts of finding and training a newemployee against a short leave ofabsence.
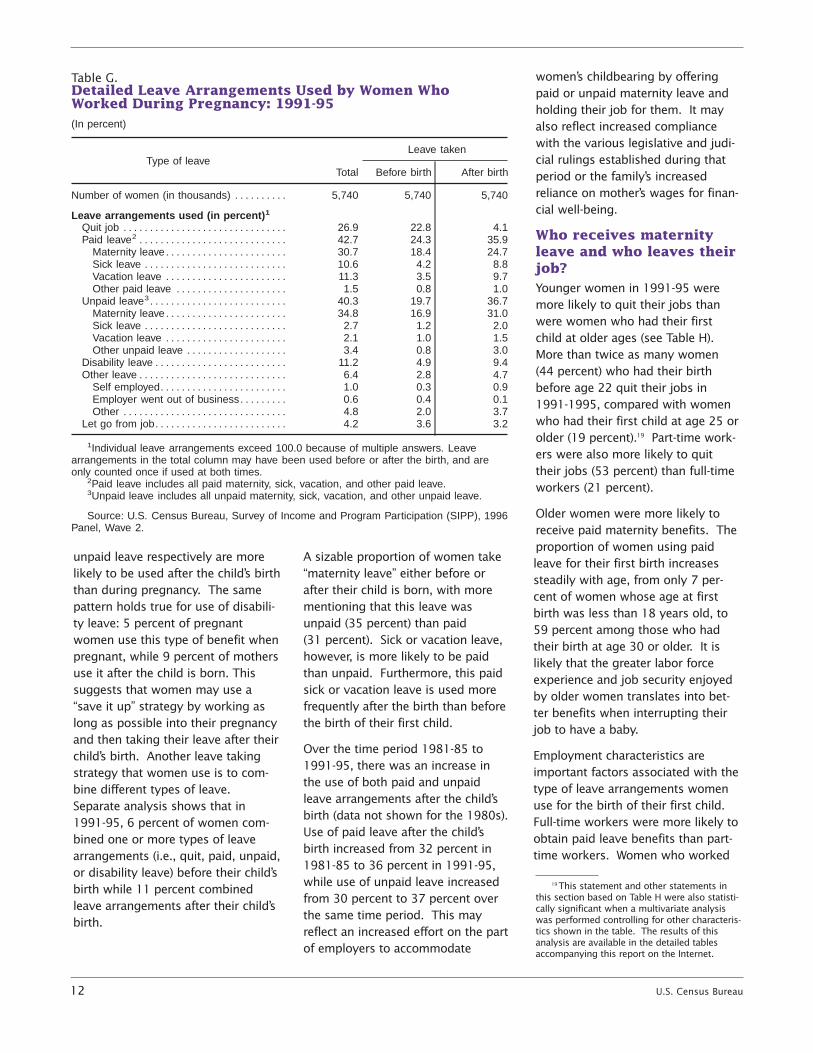
Leave arrangements beforeand after the first birthTable G provides a detailed picture ofmaternity leave arrangements usedby employed women—both beforeand after their child’s birth—who hadtheir first birth in 1991-95.
In general, women are more likely toquit their job before the birth of theirchild (23 percent) than wait untilafter their child is born (4 percent).On the other hand, both paid and
MATERNITY LEAVE ARRANGEMENTSIn the 1996 SIPP panel, two separate questions on maternity leave wereasked of every woman who worked during pregnancy. The first ques-tion concerned arrangements used between the time she stoppedworking and when the child was born, while the second questionasked about the arrangements used between the child's birth and up to12 weeks after the child was born. The 1984 and 1985 SIPP panelsasked only one question about arrangements used at any time duringpregnancy or up to 6 weeks after the child was born.
In both surveys, women who reported that they had never stoppedworking before the child's birth were not asked about arrangementsused prior to the child's birth but were asked about any arrangementsused after the child was born. Respondents in the surveys wereallowed to report as many arrangements as they used (in the 1996panel, 6 percent and 11 percent of women provided multiple answersto the questions on maternity leave before and after birth, respective-ly). The most important addition to the list of leave arrangements inthe 1996 panel was the inclusion of "disability leave," which may havebeen conceptually included as responses in either the paid or unpaidleave categories in the prior SIPP panels.
Table F.Leave Arrangements Used by Women Who Worked During Pregnancy: 1961-1965 to1991-95
1Individual leave arrangements exceed 100.0 because of multiple answers. Leave arrangements may have been used before or up to 12weeks after the birth for periods 1981-85 to 1991-95 and before or up to 6 weeks after the birth for periods 1961-65 to 1976-80.
2Paid leave includes all paid maternity, sick, vacation, and other paid leave.3Unpaid leave includes all unpaid maternity, sick, vacation, and other unpaid leave.
Source: Tabulations derived from Current Population Reports, Series P23-165 Table D and this report P70-79, U.S. Census Bureau, Sur-vey of Income and Program Participation (SIPP), 1996 Panel, Wave 2.
12 U.S. Census Bureau
unpaid leave respectively are morelikely to be used after the child’s birththan during pregnancy. The samepattern holds true for use of disabili-ty leave: 5 percent of pregnantwomen use this type of benefit whenpregnant, while 9 percent of mothersuse it after the child is born. Thissuggests that women may use a“save it up” strategy by working aslong as possible into their pregnancyand then taking their leave after theirchild’s birth. Another leave takingstrategy that women use is to com-bine different types of leave.Separate analysis shows that in1991-95, 6 percent of women com-bined one or more types of leavearrangements (i.e., quit, paid, unpaid,or disability leave) before their child’sbirth while 11 percent combinedleave arrangements after their child’sbirth.
A sizable proportion of women take“maternity leave” either before orafter their child is born, with morementioning that this leave wasunpaid (35 percent) than paid (31 percent). Sick or vacation leave,however, is more likely to be paidthan unpaid. Furthermore, this paidsick or vacation leave is used morefrequently after the birth than beforethe birth of their first child.
Over the time period 1981-85 to1991-95, there was an increase inthe use of both paid and unpaidleave arrangements after the child’sbirth (data not shown for the 1980s).Use of paid leave after the child’sbirth increased from 32 percent in1981-85 to 36 percent in 1991-95,while use of unpaid leave increasedfrom 30 percent to 37 percent overthe same time period. This mayreflect an increased effort on the partof employers to accommodate
women’s childbearing by offeringpaid or unpaid maternity leave andholding their job for them. It mayalso reflect increased compliancewith the various legislative and judi-cial rulings established during thatperiod or the family’s increasedreliance on mother’s wages for finan-cial well-being.
Who receives maternityleave and who leaves theirjob?Younger women in 1991-95 weremore likely to quit their jobs thanwere women who had their firstchild at older ages (see Table H).More than twice as many women (44 percent) who had their birthbefore age 22 quit their jobs in1991-1995, compared with womenwho had their first child at age 25 orolder (19 percent).19 Part-time work-ers were also more likely to quittheir jobs (53 percent) than full-timeworkers (21 percent).
Older women were more likely toreceive paid maternity benefits. Theproportion of women using paidleave for their first birth increasessteadily with age, from only 7 per-cent of women whose age at firstbirth was less than 18 years old, to59 percent among those who hadtheir birth at age 30 or older. It islikely that the greater labor forceexperience and job security enjoyedby older women translates into bet-ter benefits when interrupting theirjob to have a baby.
Employment characteristics areimportant factors associated with thetype of leave arrangements womenuse for the birth of their first child.Full-time workers were more likely toobtain paid leave benefits than part-time workers. Women who worked
Table G.Detailed Leave Arrangements Used by Women WhoWorked During Pregnancy: 1991-95(In percent)
Type of leaveTotal
Leave taken
Before birth After birth
Number of women (in thousands) . . . . . . . . . . 5,740 5,740 5,740
1Individual leave arrangements exceed 100.0 because of multiple answers. Leavearrangements in the total column may have been used before or after the birth, and areonly counted once if used at both times.
2Paid leave includes all paid maternity, sick, vacation, and other paid leave.3Unpaid leave includes all unpaid maternity, sick, vacation, and other unpaid leave.
Source: U.S. Census Bureau, Survey of Income and Program Participation (SIPP), 1996Panel, Wave 2.
19 This statement and other statements inthis section based on Table H were also statisti-cally significant when a multivariate analysiswas performed controlling for other characteris-tics shown in the table. The results of thisanalysis are available in the detailed tablesaccompanying this report on the Internet.
U.S. Census Bureau 13
into the last month of pregnancywere more likely to obtain paid leavebenefits than those who left workearlier in their pregnancy. Very fewwomen who worked until their lastmonth of pregnancy were let go fromtheir job (only 1 percent). However,13 percent of women who left intheir first trimester were let go fromtheir job and did not return to work
at all for the remainder of their preg-nancy.
While no other job-related character-istics of the mother while pregnantwere collected from this survey, edu-cational attainment at the time of theinterview may be a good proxy forthe type of job one holds, the wageone earns, and in turn, the type ofmaternity leave benefits offered.
Increasing levels of education appearto go hand-in-hand with increases inthe use and perhaps the availabilityof paid maternity benefits. Sixty-three percent of women with a bach-elor’s degree or more used paid ben-efits, compared with 18 percent ofwomen who had less than a highschool education. In addition, thesehighly educated women were lesslikely to use unpaid leave surround-
Table H.Type of Leave Arrangements Used by Women Who Worked During Their Pregnancy:1991-95(Numbers in thousands)
Characteristic Number ofwomen
Percent of women using specified leave arrangement
1Paid leave includes all paid maternity, sick, vacation, and other paid leave.2Unpaid leave includes all unpaid maternity, sick, vacation, and other unpaid leave.3Refers to marital status at time of first birth. Before first marriage includes never married women. After first marriage includes first births
outside or within second or subsequent marriages.
Note: Individual leave arrangements exceed 100.0 because of multiple answers. Leave arrangements may have been used before or upto 12 weeks after the birth.
Source: U.S. Census Bureau, Survey of Income and Program Participation (SIPP), 1996 Panel, Wave 2.
14 U.S. Census Bureau
ing the birth of their first child (35 percent) compared with womenwith less than a high school educa-tion (47 percent).
The striking relation between educa-tional level and use of paid maternityleave is a relatively new trend thatbegan in the early 1970s and thathad intensified by the 1990s. Figure 4 shows that in the early1960s, the use of paid maternityleave did not differ depending oneducational level. Over time, the per-centage receiving paid leave amongwomen who were not high schoolgraduates has remained steady atroughly 18 percent. However, therehas been a distinct rise in the use ofpaid maternity leave among womenwith higher levels of education sincethe 1960s.
Over this same period, women haveincreasingly acquired more years ofschooling and entered the labor forceat unprecedented levels. Their ageat first birth has risen, and they worklonger into their pregnancy and havedone so in a period when family-friendly legislation has providedmore job security during pregnancy.All of these factors contribute to agreater commitment to the laborforce. The combination of thesechanges in American society helpsexplain the simultaneous declines injob quitting during pregnancy andthe increases noted in the receipt ofboth paid and unpaid maternityleave.
RETURNING TO WORK
Juggling work and family activitiesoften becomes difficult after the birthof a child. This section looks at howrapidly women begin working afterthe birth of their first child. Overalltrends since the 1960s will be exam-ined first. The next subsection willlook at the characteristics of womenwho return most rapidly to work.Finally, new data from the 1996 SIPPpanel will be examined to determine
which women are most likely toreturn to their same employer aftertheir child’s birth and the types ofchanges that have occurred in theirjobs.
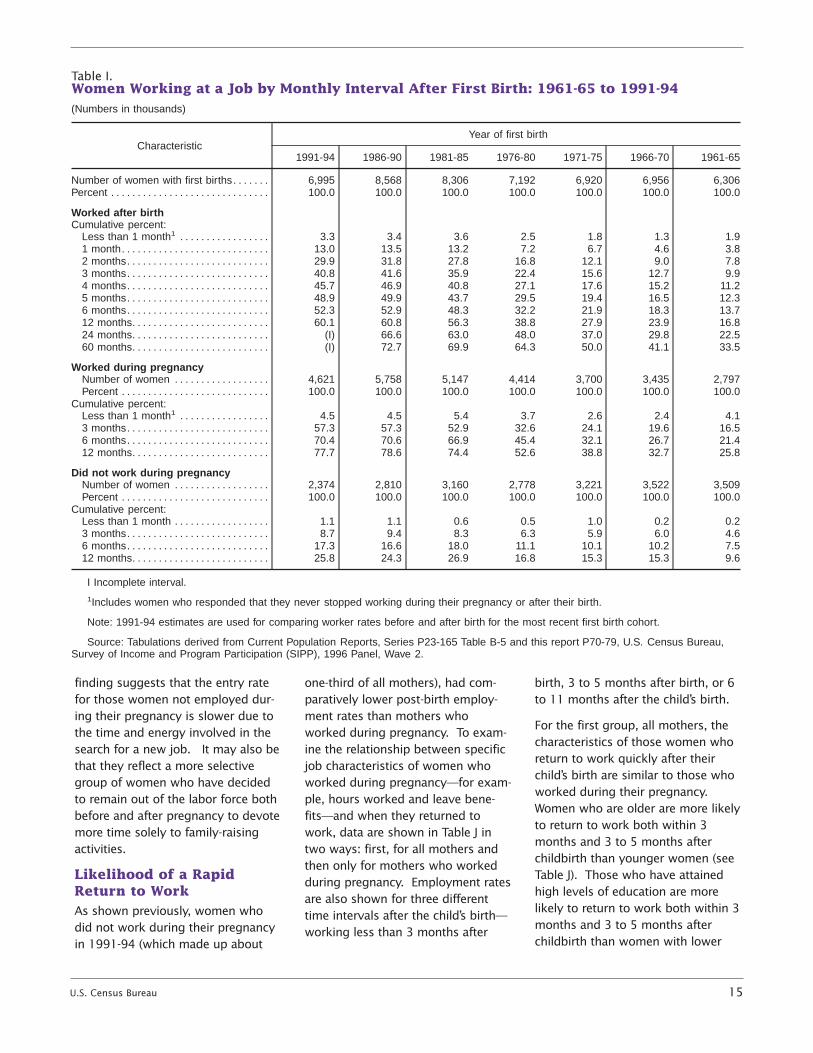
Trends since the 1960sTable I shows the cumulative month-ly percent of women working afterthe birth of their first child. In theearly 1960s, relatively few womenworked within one year of childbirth– only 14 percent of all mothers withnewborns had returned to work bythe 6th month, increasing to only 17 percent by the 12th month.These percentages more than dou-bled by 1976-80 with another largeincrease occurring by 1981-85 afterthe passage of the PregnancyDiscrimination Act. By 1991-94, 52 percent of mothers had returnedto work by the 6th month after theirchild’s birth, and 60 percent by the12th month.
If a woman decides to return to workduring the first year of her child’s life,she will probably return earlier ratherthan later in the child’s infancy.
Among those who returned to workby the 12th month after childbirth,most had returned by the 3rd month.In 1991-94, over half had returnedby 3 months after the first birth andover three-fourths were working bythe 6th month.
Figure 5 clearly illustrates the rela-tionship between work experienceduring pregnancy and the rate atwhich women returned to work.Women who worked during theirpregnancy in 1991-94 were back towork much sooner than were womenwho did not work during their preg-nancy. For example, 57 percent ofwomen who worked during theirpregnancy were back to work by the3rd month, compared with only 9 percent among women who hadnot worked during their pregnancy.By the 6th month after childbirth, 70 percent of women who workedduring their pregnancy and 17 per-cent of women who did not wereemployed. These differences byprior employment history are notedfor each time period (see second andthird panels of data in Table I). This
Figure 4.
Women Who Received Paid Leave for Their FirstBirth by Educational Attainment, Selected Years:1961-65 to 1991-95(Percent)
1961-65 1971-75 1981-85 1991-95
Note: Paid leave includes all paid maternity, sick, vacation, and other paid leave used before or after the birth.
Source: Tabulations derived from Current Population Reports, Series P23-165 Table B-9 and this report, P70-79, U.S. Census Bureau, Survey of Income and Program Participation (SIPP), 1996 Panel, Wave 2.
Year of first birth
1916 16 14
1822
26 27
19
32
39
47
18
40
29
Less than high schoolHigh school graduateSome college, no degreeBachelor's degree or more
63
U.S. Census Bureau 15
finding suggests that the entry ratefor those women not employed dur-ing their pregnancy is slower due tothe time and energy involved in thesearch for a new job. It may also bethat they reflect a more selectivegroup of women who have decidedto remain out of the labor force bothbefore and after pregnancy to devotemore time solely to family-raisingactivities.
Likelihood of a RapidReturn to WorkAs shown previously, women whodid not work during their pregnancyin 1991-94 (which made up about
one-third of all mothers), had com-paratively lower post-birth employ-ment rates than mothers whoworked during pregnancy. To exam-ine the relationship between specificjob characteristics of women whoworked during pregnancy—for exam-ple, hours worked and leave bene-fits—and when they returned towork, data are shown in Table J intwo ways: first, for all mothers andthen only for mothers who workedduring pregnancy. Employment ratesare also shown for three differenttime intervals after the child’s birth—working less than 3 months after
birth, 3 to 5 months after birth, or 6to 11 months after the child’s birth.
For the first group, all mothers, thecharacteristics of those women whoreturn to work quickly after theirchild’s birth are similar to those whoworked during their pregnancy.Women who are older are more likelyto return to work both within 3months and 3 to 5 months afterchildbirth than younger women (seeTable J). Those who have attainedhigh levels of education are morelikely to return to work both within 3months and 3 to 5 months afterchildbirth than women with lower
Table I.Women Working at a Job by Monthly Interval After First Birth: 1961-65 to 1991-94(Numbers in thousands)
1Includes women who responded that they never stopped working during their pregnancy or after their birth.
Note: 1991-94 estimates are used for comparing worker rates before and after birth for the most recent first birth cohort.
Source: Tabulations derived from Current Population Reports, Series P23-165 Table B-5 and this report P70-79, U.S. Census Bureau,Survey of Income and Program Participation (SIPP), 1996 Panel, Wave 2.
16 U.S. Census Bureau
levels of education. White non-Hispanic women are also more likelyto work after the birth of their firstchild than are Black women orHispanic women.
A different picture emerges whenone looks only at employment ratesfor women who worked during theirpregnancy. The large differences inreturning to work within threemonths just noted for all women bythese demographic characteristicsare reduced or become insignificantfor women who have worked duringtheir pregnancy. For all mothers,teenagers returned within 3 monthsless often than women 30 years andover, but among women who hadsome work experience during preg-nancy, only a few percentage pointsseparated these age groups. Higherreturn rates, however, were stillfound for older women in the 3 to 5month interval.
Employment differences betweenhigh school dropouts and womenwith college degrees disappeared,although higher return rates for the 3 to 5 month interval were similarlynoted for college graduates. As fordifferences by ethnicity, no differ-ences were noted for any of theintervals between Hispanics andWhite non-Hispanics for any of theintervals in Table J.
For women who worked during theirpregnancy, job characteristicsseemed to play the most importantrole in determining when theyreturned to work.20 Women whoworked into their last month of preg-nancy returned to work more rapidlythan those who left work before theirlast trimester of the pregnancy. Forexample, 50 percent of women whostopped working less than onemonth prior to their child’s birth wereback at work less than 3 months
after their child’s birth compared with 22 percent of women who left 6 ormore months before their child’s birth.
Likewise, the type of maternity leavewomen use is also related to howsoon they return to work. Womenwho use maternity leave—either paidor unpaid—or disability leave, areroughly twice as likely to experiencea rapid return to work (within lessthan 3 months) compared withwomen who either quit or are let gofrom their job. Women who are letgo or who quit obviously havegreater difficulty in securing employ-ment after their child’s birth as timefor a job search may be scarce con-sidering the newly acquired responsi-bilities of motherhood.
These findings imply that there is astrong association between work-related variables and rapid returns towork. It is unclear whether thesewomen are more motivated to main-tain ties to the labor force because ofcareer goals or whether the jobsthese women hold offer benefits thatfacilitate these ties to the labor force,such as promising a job after child-
birth without experiencing any nega-tive job sanctions. Clearly, the coststo employers associated with findingand training new employees are highas well as are the costs to employeessearching for a new job. In contrast,previous research showed that in the1960s and 1970s, the women mosteconomically in need and dependenton their own earnings (teenagers,Black women, and women with pre-marital first births) experienced themost rapid returns to work.21
Women’s commitment to the laborforce now appears to be stronger,and maternity leave benefits mayplay a more important role in contin-ued employment after the child’sbirth.
(Cumlative percent)
2 54
32
30
0
20
40
60
80
100
Did not work during pregnancy
Less than 1
1 2 3 4 5 6
Worked during pregnancy
Source: U.S. Census Bureau, Survey of Income and Program Participation (SIPP), 1996 Panel, Wave 2.
Number of months after birth when work began
7 8 9 10 11 12
Figure 5.
Women Who Returned to Work by Work Status During Pregnancy and Interval After First Birth: 1991-94
20The ensuing results were also verified andupheld by performing a multivariate statisticalanalysis which controlled for the other variablesshown in this table.
21Martin O'Connell. "Maternity LeaveArrangements: 1961-85," in Work and FamilyPatterns of American Women. CurrentPopulation Reports, Series P23, No.165. U.S.Census Bureau, Washington, DC, 1990. Forother research also showing economic need asan important factor in rapid returns to work,see Frank Mott and Lois Shaw. "TheEmployment Consequences of Different FertilityBehaviors," in Lois Shaw, ed., Midlife Women atWork. Lexington Books: Lexington, MA, 1986;and Steven McLaughlin. "Differential Patterns ofFemale Labor-Force Participation Surroundingthe First Birth," Journal of Marriage and theFamily, 44(2): 407-420, 1982.
U.S. Census Bureau 17
Returning to the same or adifferent employer
Since the early 1980s, approximately75 percent of women who workedduring their pregnancy returned towork by 12 months after their child’s
birth (see Table I). Among thesemothers, most of them secured theirfirst job after childbirth (about 76 percent) with their pre-birth
Table J.Returning to Work in Stated Intervals After First Birth by Selected Characteristics: 1991-94
NA Not applicable for women who did not work during pregnancy.
1Refers to marital status at time of first birth. Before first marriage includes never married women. After first marriage includes first birthsoutside or within second or subsequent marriages.
2Leave arrangement may have been used before or after the birth. Individual leave arrangements exceed 100.0 because of multiple answ
Source: U.S. Census Bureau, Survey of Income and Program Participation (SIPP), 1996 Panel, Wave 2.
18 U.S. Census Bureau
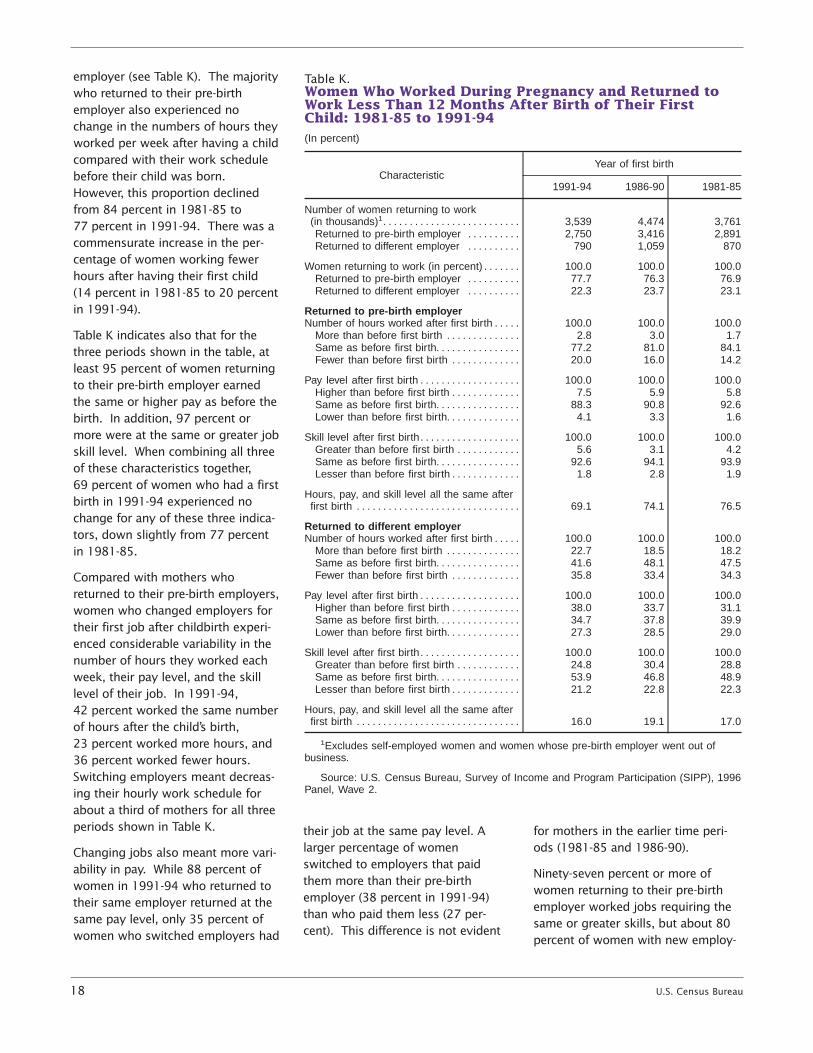
employer (see Table K). The majoritywho returned to their pre-birthemployer also experienced nochange in the numbers of hours theyworked per week after having a childcompared with their work schedulebefore their child was born.However, this proportion declinedfrom 84 percent in 1981-85 to 77 percent in 1991-94. There was acommensurate increase in the per-centage of women working fewerhours after having their first child (14 percent in 1981-85 to 20 percentin 1991-94).
Table K indicates also that for thethree periods shown in the table, atleast 95 percent of women returningto their pre-birth employer earnedthe same or higher pay as before thebirth. In addition, 97 percent ormore were at the same or greater jobskill level. When combining all threeof these characteristics together, 69 percent of women who had a firstbirth in 1991-94 experienced nochange for any of these three indica-tors, down slightly from 77 percentin 1981-85.
Compared with mothers whoreturned to their pre-birth employers,women who changed employers fortheir first job after childbirth experi-enced considerable variability in thenumber of hours they worked eachweek, their pay level, and the skilllevel of their job. In 1991-94, 42 percent worked the same numberof hours after the child’s birth, 23 percent worked more hours, and36 percent worked fewer hours.Switching employers meant decreas-ing their hourly work schedule forabout a third of mothers for all threeperiods shown in Table K.
Changing jobs also meant more vari-ability in pay. While 88 percent ofwomen in 1991-94 who returned totheir same employer returned at thesame pay level, only 35 percent ofwomen who switched employers had
their job at the same pay level. Alarger percentage of womenswitched to employers that paidthem more than their pre-birthemployer (38 percent in 1991-94)than who paid them less (27 per-cent). This difference is not evident
for mothers in the earlier time peri-ods (1981-85 and 1986-90).
Ninety-seven percent or more ofwomen returning to their pre-birthemployer worked jobs requiring thesame or greater skills, but about 80percent of women with new employ-
Table K.Women Who Worked During Pregnancy and Returned toWork Less Than 12 Months After Birth of Their FirstChild: 1981-85 to 1991-94(In percent)
CharacteristicYear of first birth
1991-94 1986-90 1981-85
Number of women returning to work(in thousands)1. . . . . . . . . . . . . . . . . . . . . . . . . . 3,539 4,474 3,761Returned to pre-birth employer . . . . . . . . . . 2,750 3,416 2,891Returned to different employer . . . . . . . . . . 790 1,059 870
Women returning to work (in percent) . . . . . . . 100.0 100.0 100.0Returned to pre-birth employer . . . . . . . . . . 77.7 76.3 76.9Returned to different employer . . . . . . . . . . 22.3 23.7 23.1
Returned to pre-birth employerNumber of hours worked after first birth . . . . . 100.0 100.0 100.0
More than before first birth . . . . . . . . . . . . . . 2.8 3.0 1.7Same as before first birth. . . . . . . . . . . . . . . . 77.2 81.0 84.1Fewer than before first birth . . . . . . . . . . . . . 20.0 16.0 14.2
Pay level after first birth . . . . . . . . . . . . . . . . . . . 100.0 100.0 100.0Higher than before first birth . . . . . . . . . . . . . 7.5 5.9 5.8Same as before first birth. . . . . . . . . . . . . . . . 88.3 90.8 92.6Lower than before first birth. . . . . . . . . . . . . . 4.1 3.3 1.6
Skill level after first birth. . . . . . . . . . . . . . . . . . . 100.0 100.0 100.0Greater than before first birth . . . . . . . . . . . . 5.6 3.1 4.2Same as before first birth. . . . . . . . . . . . . . . . 92.6 94.1 93.9Lesser than before first birth . . . . . . . . . . . . . 1.8 2.8 1.9
1Excludes self-employed women and women whose pre-birth employer went out ofbusiness.
Source: U.S. Census Bureau, Survey of Income and Program Participation (SIPP), 1996Panel, Wave 2.
U.S. Census Bureau 19
ers were working at jobs with thesame or greater level of skills afterthe birth of their child. However,among those women who experi-enced a change in their skill level,more generally advanced their skilllevel rather than taking a job needingless skill. Overall, between 15 per-cent and 20 percent of women whochanged employers maintained con-sistency on all three of these charac-teristics before and after the birth oftheir child. Clearly, women who finda new job after becoming mothersuse a variety of paths to supportthemselves and their new child.Some move up in the work world,while the majority maintain or scaleback their commitment to the laborforce.
Figure 6 shows the types of leavemothers used by whether theyreturned to their pre-birth employerby the 12th month after their child’sbirth.22 Leave arrangements usedeither before or after the first birthare included because some arrange-ments, such as quitting, occur almostexclusively before the birth of thechild, while others (for example, paidleave) tend to occur most often afterthe child is born. These leavearrangements can be taken concur-rently and are not mutually exclu-sive—that is, a woman could useboth paid and unpaid leave, or anyother combination of leave arrange-ments.
Among women who returned towork by the 12th month after theirchild’s birth, those who returned totheir pre-birth employer most fre-
quently used paid leave (61 percent)or unpaid leave (48 percent). Veryfew quit their job (5 percent) or werelet go during their pregnancy (1 per-cent) and subsequently returned.Among women who returned towork by the 12th month but whoswitched employers, most had quittheir job during their pregnancy (63 percent), followed by unpaidleave (29 percent). Nine percent hadbeen let go by their previous employ-er. About 12 percent of women whoswitched employers did receive sometype of paid maternity leave eitherbefore or after their child’s birth.These patterns are consistent withthe use of paid leave as an incentivefor employee retention, whereasthose who quit their jobs before orafter having a child exhibit minimalamounts of employer loyalty.
Unpaid leave, however, shows mixedresults. About half of women return-ing to their pre-birth employer usedunpaid leave. They may also haveused other types of leave, as the cat-egories are not mutually exclusive.Twenty-nine percent of those who
went to a new employer post-birthalso used unpaid leave. It appearsthat the use of unpaid leave does nothave as strong a retention effect asdoes paid leave. It may be that someforms of unpaid leave are a legalmandatory benefit given to employ-ees but are not strong enough topromote job retention.
CONCLUSIONS
Since the 1960s, women have expe-rienced considerable gains in educa-tion beyond the high school yearsand have continued to delay child-bearing to older ages. These factorshave contributed to the increase inthe work experience of women bothbefore and during their first pregnan-cy. Not only are women more likelyto work during their pregnancy thanthey did 30 to 40 years ago, but theywork longer into their pregnancy.More than half of women work upuntil one month before the birth oftheir first child. In addition, womenare returning to work after theirpregnancy at a faster rate than inprevious decades. The cumulative
Returned to same employer
Note: Includes women who worked during pregnancy and returned to work within 12 months oftheir first child's birth.
Source: U.S. Census Bureau, Survey of Income and Program Participation (SIPP), 1996 Panel, Wave 2.
Percent used leave arrangements before or after first birth
11
1
48
61
5
10
12
9
6
29
63
Figure 6.
Type of Leave Arrangement Used Before or After First Birth by Return to Post-Birth Employer: 1991-94
Returned to different employer
3
Quit
Let go from job
Paid leave
Unpaid leave
Disability leave
Other leave
22This analysis was limited to women return-ing to work by the 12th month after theirchild's birth as employer benefits are not likelyto extend for more than 1 year after birth.Some countries, like Sweden, do extend mater-nity leave benefits for more than 1 year afterthe child's birth. For a cross-national compari-son of parental leave, see Sheila Kamerman."Parental Leave and Infant Care: U.S. andInternational Trends and Issues, 1978-1988" inJanet Shibley Hyde and Marilyn Essex, eds.,Parental Leave and Child Care: Setting aResearch and Policy Agenda. Temple UniversityPress: Philadelphia, PA, 1991.
20 U.S. Census Bureau
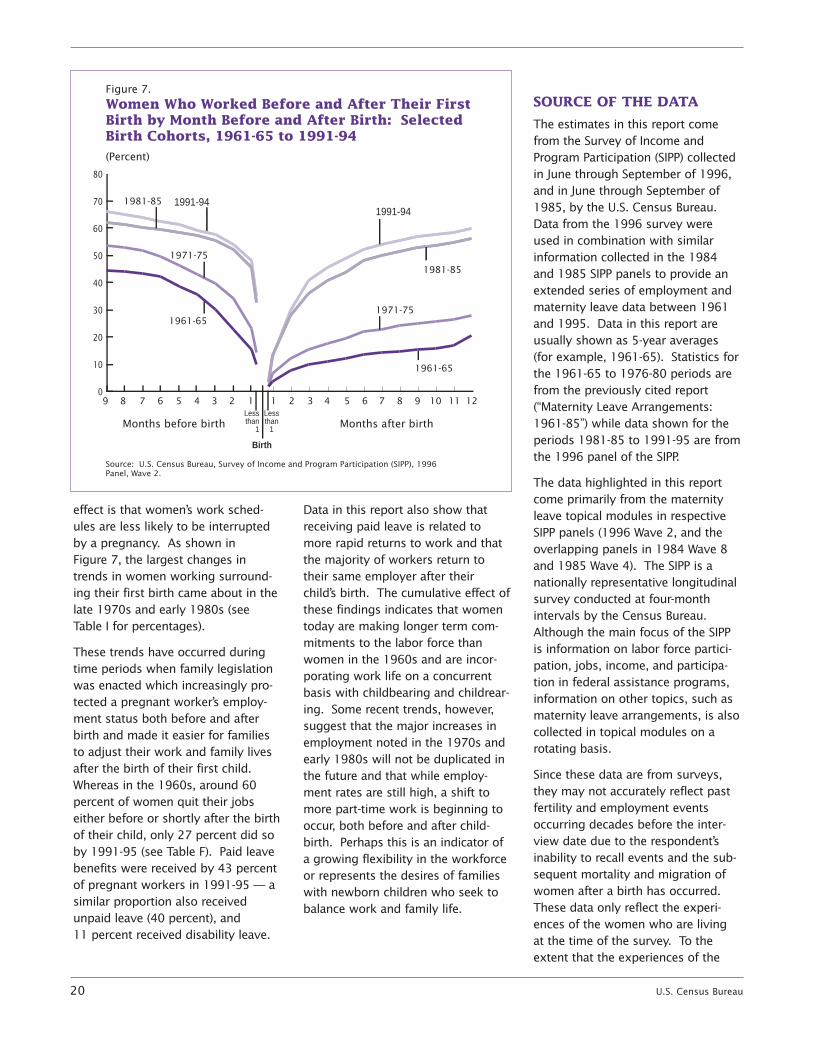
effect is that women’s work sched-ules are less likely to be interruptedby a pregnancy. As shown in Figure 7, the largest changes intrends in women working surround-ing their first birth came about in thelate 1970s and early 1980s (seeTable I for percentages).
These trends have occurred duringtime periods when family legislationwas enacted which increasingly pro-tected a pregnant worker’s employ-ment status both before and afterbirth and made it easier for familiesto adjust their work and family livesafter the birth of their first child.Whereas in the 1960s, around 60percent of women quit their jobseither before or shortly after the birthof their child, only 27 percent did soby 1991-95 (see Table F). Paid leavebenefits were received by 43 percentof pregnant workers in 1991-95 — asimilar proportion also receivedunpaid leave (40 percent), and 11 percent received disability leave.
Data in this report also show thatreceiving paid leave is related tomore rapid returns to work and thatthe majority of workers return totheir same employer after theirchild’s birth. The cumulative effect ofthese findings indicates that womentoday are making longer term com-mitments to the labor force thanwomen in the 1960s and are incor-porating work life on a concurrentbasis with childbearing and childrear-ing. Some recent trends, however,suggest that the major increases inemployment noted in the 1970s andearly 1980s will not be duplicated inthe future and that while employ-ment rates are still high, a shift tomore part-time work is beginning tooccur, both before and after child-birth. Perhaps this is an indicator ofa growing flexibility in the workforceor represents the desires of familieswith newborn children who seek tobalance work and family life.
SOURCE OF THE DATA
The estimates in this report comefrom the Survey of Income andProgram Participation (SIPP) collectedin June through September of 1996,and in June through September of1985, by the U.S. Census Bureau.Data from the 1996 survey wereused in combination with similarinformation collected in the 1984and 1985 SIPP panels to provide anextended series of employment andmaternity leave data between 1961and 1995. Data in this report areusually shown as 5-year averages(for example, 1961-65). Statistics forthe 1961-65 to 1976-80 periods arefrom the previously cited report(“Maternity Leave Arrangements:1961-85”) while data shown for theperiods 1981-85 to 1991-95 are fromthe 1996 panel of the SIPP.
The data highlighted in this reportcome primarily from the maternityleave topical modules in respectiveSIPP panels (1996 Wave 2, and theoverlapping panels in 1984 Wave 8and 1985 Wave 4). The SIPP is anationally representative longitudinalsurvey conducted at four-monthintervals by the Census Bureau.Although the main focus of the SIPPis information on labor force partici-pation, jobs, income, and participa-tion in federal assistance programs,information on other topics, such asmaternity leave arrangements, is alsocollected in topical modules on arotating basis.
Since these data are from surveys,they may not accurately reflect pastfertility and employment eventsoccurring decades before the inter-view date due to the respondent’sinability to recall events and the sub-sequent mortality and migration ofwomen after a birth has occurred.These data only reflect the experi-ences of the women who are livingat the time of the survey. To theextent that the experiences of the
0
10
20
30
40
50
60
70
80
(Percent)
1991-94
1981-85
1971-75
1961-65
Source: U.S. Census Bureau, Survey of Income and Program Participation (SIPP), 1996 Panel, Wave 2.
Months before birth
Figure 7.
Women Who Worked Before and After Their First Birth by Month Before and After Birth: Selected Birth Cohorts, 1961-65 to 1991-94
Less than
1
1 2 3 4 5 6 7 8 9 10 11 12
Birth
123456789Less than
1 Months after birth
1961-65
1971-75
1981-851991-94
U.S. Census Bureau 21
deceased or the migrants who leftthe United States are different fromthe surveyed population, the esti-mates are biased.
ACCURACY OF THEESTIMATES
Statistics from sample surveys aresubject to sampling and nonsam-pling error. All comparisons present-ed in this report have taken samplingerror into account and meet the U.S.Census Bureau’s standards for statis-tical significance. Nonsamplingerrors in surveys may be attributedto a variety of sources, such as howthe survey was designed, howrespondents interpret questions, howable and willing respondents are toprovide correct answers, and howaccurately answers are coded andclassified. The Census Bureauemploys quality control proceduresthroughout the production process –including the overall design of sur-veys, testing the wording of ques-tions, review of the work of inter-viewers and coders, and statisticalreview of reports.
The SIPP employs ratio estimation,whereby sample estimates areadjusted to independent estimates ofthe national population by age, race,sex, and Hispanic origin. Thisweighting partially corrects for biasdue to under coverage, but how itaffects different variables in the sur-vey is not precisely known.Moreover, biases may also be presentwhen people who are missed in the
survey differ from those interviewedin ways other than the categoriesused in weighting (age, race, sex,and Hispanic origin). All of theseconsiderations affect comparisonsacross different surveys or datasources.
For further information on statisticalstandards and the computation anduse of standard errors, contact Tim Stewart, Demographic StatisticalMethods Division, at 301-457-6849(TTY) or on the Internet [email protected].
MORE INFORMATION
The report is available on the Internet(www.census.gov); search for mater-nity leave data by clicking on the let-ter “F” in the “Subjects A to Z” sectionof the web page and selecting “fertili-ty data” and scrolling to the materni-ty leave data section. A detailedtable package presenting more in-depth maternity leave information isalso on the Internet.
Other research on maternity leavecan be found in the following report:Kristin Smith and Amara Bachu,Women’s Labor Force AttachmentPatterns and Maternity Leave: AReview of the Literature, PopulationDivision Working Paper Series, No.32, U.S. Bureau of the Census,Washington, DC, 1999. This report ison the Internet on the “Population:Working Paper;” section under“Subjects A to Z.”
CONTACTS
For additional maternity leave infor-mation, you may contact the authorsof this report in the Fertility andFamily Statistics Branch, at 301-457-2416. You may also contact theauthors of this report by e-mail.
Smith, Kristin, Barbara Downs, andMartin O’Connell. 2001. MaternityLeave and Employment Patterns:1961-1995. Current PopulationReports, P70-79. U.S. CensusBureau, Washington, DC.