Presented at the Symposium on Emerging Trends in Separation Science and Technology — SESTEC 2006 Bhabha Atomic Research Centre (BARC), Trombay, Mumbai, India, 29 September – 1 October 2006 Mathematical model for swelling in a liquid emulsion membrane system S. Mukhopadhyay a , S.K. Ghosh a , V.A. Juvekar b a Chemical Engineering Division, BARC, Mumbai 400085, India b Chemical Engineering Department, IIT Bombay, Mumbai 400076 Abstract Application of the liquid emulsion membrane (LEM) technology to the industrial scale is hindered by the challenges imposed by stability of the emulsion during the transfer of the solute (pertraction). One of the important factors which leads to the instability is swelling. Emulsion undergoes swelling due to the osmotic gradient across the membrane as well as due to the occlusion of the external phase into the membrane phase; the latter is caused by the hydrodynamic deformation of the membrane globules. In the present work, we have studied swelling of the emulsion phase in a water-in-oil-in-water type LEM system. Nitric acid is the internal aqueous phase and is encapsulated in organic membrane phase composed of DEHPA–kerosene-SPAN80. Demineralised water is used as the external phase. The effect of the composition of the system and the hydrodynamic condition on the rate of swelling has been studied. A mathematical model has been developed to describe the effects of the relevant parameters on swelling of the emulsion. The globules of the emulsion are viewed as having a core-shell structure, based on the visual evidence. The model takes into account both the osmotic and the occlusion modes of swelling and also the leakage of the internal phase. The predictions of the model are found to be in good agreement with the experiments. The model would be useful for evaluating the rate of pertraction of a solute through the membrane–strip combination used in the present study. The study would also be useful for tuning the design and the operating parameters in LEM pertraction to achieve minimum swelling of the emulsion. Keywords: Liquid emulsion membrane; Pertraction; Swelling; Osmosis; Occlusion
Transcript
Presented at the Symposium on Emerging Trends in Separation Science and Technology — SESTEC 2006Bhabha Atomic Research Centre (BARC), Trombay, Mumbai, India, 29 September – 1 October 2006
Mathematical model for swelling in a liquid emulsionmembrane system
S. Mukhopadhyaya, S.K. Ghosha, V.A. Juvekarb
aChemical Engineering Division, BARC, Mumbai 400085, India
Application of the liquid emulsion membrane (LEM) technology to the industrial scale is hindered by thechallenges imposed by stability of the emulsion during the transfer of the solute (pertraction). One of the importantfactors which leads to the instability is swelling. Emulsion undergoes swelling due to the osmotic gradient acrossthe membrane as well as due to the occlusion of the external phase into the membrane phase; the latter is caused bythe hydrodynamic deformation of the membrane globules. In the present work, we have studied swelling of theemulsion phase in a water-in-oil-in-water type LEM system. Nitric acid is the internal aqueous phase and isencapsulated in organic membrane phase composed of DEHPA–kerosene-SPAN80. Demineralised water is usedas the external phase. The effect of the composition of the system and the hydrodynamic condition on the rate ofswelling has been studied. A mathematical model has been developed to describe the effects of the relevant parameterson swelling of the emulsion. The globules of the emulsion are viewed as having a core-shell structure, based on thevisual evidence. The model takes into account both the osmotic and the occlusion modes of swelling and also theleakage of the internal phase. The predictions of the model are found to be in good agreement with the experiments.The model would be useful for evaluating the rate of pertraction of a solute through the membrane–strip combinationused in the present study. The study would also be useful for tuning the design and the operating parameters inLEM pertraction to achieve minimum swelling of the emulsion.
Liquid emulsion membranes have demon-strated a considerable potential as effective toolsfor a wide variety of separations, especially fromdilute solutions including hydrocarbon separation,mineral recovery, wastewater treatment, separa-tion of toxic material like uranium and cadmiumfrom effluents [1–4]. Boyadzhiev and Lazarova[5] have brought out the advantages of LEM overthe conventional solvent extraction process in lowsolvent inventory, low equipment cost and highermass transfer rate due to a larger available sur-face area for extraction. Bart et al. [6] have a costcomparison of extraction, permeation and precipi-tation. According to them, the LEM process is verypromising for clean up of waste streams in viewof rising dumping prices for hazardous sludge.
Application of LEM technology to industrialscale is, however, hindered by the challenges im-posed by stability of the emulsion duringpertraction. Swelling of emulsion, rupture of theglobule and leakage of the internal phase into theexternal one are the major drawbacks of the pro-cess. Swelling in LEM is caused by the transferof water from the external phase into the internalphase through the membrane by permeation andentrainment [7]. The stability of the emulsion dropdecreases due to swelling and it becomes moreprone to leakage and breakage [8]. Also, swellingof the emulsion dilutes the internal strip and low-ers selectivity for separation. Nakashio et al. [9]have analyzed the reasons for very few industrialapplications of LEM and emphasized the need fordevelopment of LEM with acceptably low levelof swelling, high levels of stability and perme-ability and ease of demulsification, for completesolute recovery. Appropriate hydrodynamic con-ditions are necessary to generate a stable primaryemulsion, which will resist swelling and ruptureof the globules during pertraction. Again, toostable an emulsion will be difficult to demulsify,after pertraction, for the recovery of the product.Hence, a proper choice of the composition of the
primary emulsion (viz. the carrier and the surfac-tant) is needed for formulating an emulsion, whichis stable during pertraction, but could be easilydestabilized after the solute recovery.
There are two modes of emulsion swelling, viz.occlusion swelling and osmotic swelling. In theocclusion or entrainment swelling, the externalphase is occluded in the emulsion globule duringpertraction. Agitation and presence of surfactantcauses this type of swelling [10]. Ding and Xie[11] observed that various surfactants have dif-ferent effects on occlusion and the choice of sur-factant is important to reduce the rate of occlu-sion. Osmotic swelling or permeation swellingoccurs when the solvent of the external phase dif-fuses in the emulsion globule due to the differ-ence in the concentration of the solute betweenthe internal and external aqueous phases.
Yan and Pal [12] have studied a primary emul-sion drop under microscope and evaluated swell-ing and entrainment at various surfactant concen-trations. Ramasedar et al. [13] have studied os-motic swelling, occlusion and breakage of emul-sion. Several mechanisms have been suggestedfor permeation of water, viz. solute hydration [14],hydrated solute-carrier complexes and inversemicelles [15]. Colinert et al. [16] observed thatthe relative magnitude of two competitive effectscaused by surfactants, viz. water hydration andmembrane viscosity, is the basis for deciding theoptimum surfactant concentration.
Usually, the LEM separation processes havebeen analyzed on the basis of the different con-figurations of the emulsion globule. Dependingon the system under consideration, these can bedivided into two general categories viz., the well-mixed internal phase model (also called core-shell/hollow sphere/membrane film model) and therigid drop model (e.g., advancing front/shrinkingcore and reversible reaction model). The well-mixed internal phase model (Fig. 1) suits betterto emulsion prepared at a low speed of agitationand/or in emulsion prepared with a low surfac-tant concentration so that the droplets of strip have
112
sufficient mobility for getting coalesced [17–20].This model is simple in approach, involves a lowernumber of parameters and provides approximateestimates useful for preliminary design calcula-tions.
Several authors [21–26] have worked on thebasis of the concept that the internal droplets arerigidly embedded in the membrane phase of theprimary emulsion globule (Fig. 2). The main dif-ficulty with the rigid drop model is that it is notcompatible with any physically relevant mecha-nisms of leakage. The actual situation, therefore,may fall between two extreme cases, one of therigid drop and the other of the core-shell model.
Mathematical models for transport of water byosmosis have been presented by several authors[27–29]. Colinert et al. [16] have presented amodel for swelling of globules using a core-shelltype of structure for the globule. The model usesfive parameters which have been estimated byexperimental results. Three of these parametersare related to the characteristics of the surfactantused. The osmotic coefficient and membranethickness are the other two parameters. Bart et al.[15] have presented a reaction front model inwhich osmosis occurs due to solubilization ofwater by inverse micelles diffusing through theorganic membrane.
All the models reported in the literature arelimited in their application because they eitherconsider a single mode of swelling or else lump
Fig. 1. Spherical shell model. F — feed, R — strip, M —membrane phase.
R F
External solution
Unreacted strip drops
Reacted Strip drops
Organic Membrane
Fig. 2. Rigid drop model.
all the modes of swelling into a single swellingparameter. Since different modes of swelling/leak-age have different dependences on the systemparameters, it is necessary to account for thesedependences separately in the model. This pro-vides motivation for the present work.
For the present study a liquid emulsion mem-brane system composed of carrier–surfactant–diluent–strip combination of DEHPA–SPAN80–kerosene–nitric acid has been considered. Thissystem has a high potential for the recovery oflow concentration of uranium from a dilute ni-trate solution as the raffinate stream of uraniumrefining. This work will be useful for generationof design data for this process.
2. Experimental
The set up consists of four parts viz. primaryemulsifier, pertractor, phase separator and de-emulsifier. A schematic of the experimental setup is given in Fig. 3. The primary emulsifier andthe pertractor were mechanically agitated con-tactors placed in a water bath with a temperaturemonitor. Demulsification was conducted ther-mally in a thermostatic bath heated with hot wa-ter. A thermometer was used to monitor the tem-perature.
113
Analytical grade di-2-ethylhexylphosphoricacid (DEHPA) (M/S Sigma Chemical Co.) wasused as a carrier. The stripping agent, nitric acid(analytical grade), was obtained from M/S T.A.Corp., and kerosene, of commercial grade, wasobtained from M/S IRE Ltd. India was used as
Fig. 3. Schematic diagram of the experimental set-up.
diluent for the carrier. The surfactant SPAN 80was obtained from M/s Mohini Organics.
The liquid membrane phase was prepared bymixing the organic carrier and the surfactant inthe organic diluent in the primary emulsifier atspeed of 100 rpm. The primary emulsion was then
114
formed by adding an equal volume of the stripsolution to the liquid membrane phase in adropwise manner while agitating the membranephase at a high speed (3000 rpm). The additionwas completed in around 20 min. The mixture wasthen cooled to room temperature.
The pertraction was conducted in the pertrac-tor. The treat ratio, i.e., the ratio of the feed (DMwater in this study) to the primary emulsion (or-ganic) was kept at 10 : 1 in most cases. The mea-sured quantity of the feed solution was taken inthe pertractor and the primary emulsion was addedslowly, under agitation (300 rpm). The tempera-ture during the pertraction was maintained at28°C. The samples were withdrawn periodicallyfrom the aqueous phase, filtered and analyzed forthe acidity. In the lower range, acidity was mea-sured with a digital pH meter (EquiptronicsEQ610). A higher range of acidity was measuredby acid base titration using standard alkali (so-dium hydroxide) and phenolphthalein indicator.
Settling of the secondary emulsion generatedduring the pertraction step was done in a 500 mlglass separating funnels. A settling time of 10 minwas maintained in all the experiments. Swellingwas estimated by measuring the volume of theprimary emulsion after phase separation follow-ing pertraction, and comparing it with the vol-ume of the primary emulsion before pertraction.
Studies on stability of the primary emulsioncomposed of DEHPA (1% v/v)–SPAN80–kero-sene–HNO3 (2 M with 50% v/v loading) and mea-surement of the size of the emulsion globules wasdone by capturing images of the globules with animage capturing system. It consisted of a CCDcamera, a frame grabber card with 25 frame/s cap-turing speed, an optical microscope and an imageanalysis software (Fig. 3). For capturing imagesof the emulsion globule under microscope, a tinydrop of the primary emulsion was put into a watchglass containing DM water and a single globulewas focused. The water taken in the watch glasscontained TWEEN80 (20% v/v) to prevent coa-lescence of the globule. Thus, a water in oil in
water (W/O/W) type double emulsion was formedwith a globule of the primary emulsion (W/O) ina pool of water. Images of the globule were cap-tured at various intervals of time to observe thefate of the internal droplets. Measurement of theaverage size of the globules was done online whileagitating a small volume of the primary emulsionin the aqueous feed solution at various speeds ofpertraction using the image capturing system.
3. Mathematical model
Figs. 4 and 5 show the images of the primaryemulsion prepared with 3% and 5% surfactant(SPAN80) concentration respectively with the stir-rer speed of 3000 rpm. For higher concentrationof the surfactant, the internal droplets appear tobe more stable resembling a rigid drop. Since inthe present set of experiments only 3% surfactantis used (for ease of demulsification), there isground to believe that there will be a substantialcirculation of the droplets inside the emulsionglobules and also a significant coalescence. Thephotograph of emulsion used in this work (Fig. 4)supports this fact. This finding favor the shell andcore model rather than the rigid drop model.
The relevant model for the process of swell-ing by occlusion and osmosis and leakage is de-veloped below. The following assumptions aremade in the development of the model.(i) A globule is viewed as a sphere. The internal
phase is assumed to form a spherical core. It issurrounded by the membrane layer in the formof a shell (Fig. 2).
(ii)The external mass transfer resistance of theglobule is neglected. This is a reasonable as-sumption in view of the fact that the membranethickness (about 25 μm) is much larger thanthe external diffusion film thickness (about 5μm). Moreover, the viscosity of the membranefluid is much higher than that of the externalfluid. Hence most of the mass transfer resis-tance will be located inside the membrane.
115
Fig. 4. Primary emulsion globule prepared with 3%SPAN80.
Fig. 5. Primary emulsion globule prepared with 5%SPAN80.
(iii) The volume of the internal phase changeswith time due to occlusion of the externalphase and the leakage of the internal phase.The volume of the membrane phase, how-ever, is assumed to remain constant. This re-sults in a variation of the membrane thick-ness with time. This affects both the rate ofocclusion as well as leakage.
(iv) Occlusion occurs due to deformation of themembrane. This deformation results in for-mation of cavities, which occlude the exter-nal phase. Deformability of the membraneand hence the rate of occlusion should in-crease with the increase in the thickness ofthe membrane. The rate of occlusion is as-sumed to be directly proportional to the thick-ness of the membrane and the outer surfacearea of the globule. Hence it could be writtenas
0a atr k At
⎛ ⎞= ⎜ ⎟⎝ ⎠
(1)
where ra = volumetric rate of occlusion of theinternal phase, ka = the occlusion coefficient,t = thickness of the membrane, t0 = the initialthickness of the membrane, and A = outersurface area of the globule. Note that both tand A vary with time.
(v) Leakage occurs due to rupture of the mem-brane. The thinner the membrane is, the moreis the likelihood of it being ruptured. Basedon this understanding, the rate of leakage isassumed to be inversely proportional to thethickness of the membrane and is written as
0tr k At
⎛ ⎞= ⎜ ⎟
⎝ ⎠(2)
where r = volumetric rate of leakage of theinternal phase, and k = leakage coefficient.
(vi) The internal phase is assumed to be com-pletely mixed, on the other hand, the mem-brane phase is assumed to be unmixed.
(vii)In the case of nitric acid/DEHPA/water sys-tem, water is assumed to permeate (apart from
116
occlusion) into the globule by osmosis whichis generated due to the difference in the con-centration of the nitric acid in the internal andthe external phases. The permeation is in theinward direction due to the higher concen-tration of HNO3 in the internal phase.
The extent of swelling (ψs) of the emulsionglobule and the extent of leakage of the internalphase (p) are given by the following equations(see mathematical model derived in the Appendix)
These two simultaneous ordinary differentialequations have been solved using the fourth or-der Runge–Kutta method to obtain ψs and p asfunctions of time. The procedure for finding the
values of the coefficients ka, k and k0p is also given
in the Appendix.The above equations assume a simpler form
for O/W/O double emulsion system, in whichwater as the internal phase is emulsified in theorganic membrane phase which, again, is dis-persed in the external water phase. Hence it iscalled water/membrane/water system. Here, swell-ing occurs only by occlusion. Since there is nonitric acid in the internal phase, there is no os-motic gradient across the organic membrane. Thefirst term associated with the osmotic coefficientk0
p can be ignored and hence the reduced form ofthe expression for the rate of swelling is
Thus the initial slope gives the difference ka –k . Also at steady state, Eq. (3) reduces to
( )( )
21/ 3
1/ 31/ 3
1 1 ma
s s m
kk ∞ ∞
⎡ ⎤− − φ⎢ ⎥=⎢ ⎥ψ − ψ − φ⎣ ⎦
(5)
The two equations (4) and (5) could, in prin-ciple, be used to estimate the occlusion and theleakage coefficients.
4. Results and discussion
In this section, we first describe the experi-ments corresponding to the water/membrane/wa-ter system. The aim of these experiments is to
117
obtain both the leakage and the occlusion coeffi-cients. Next we describe the experiments corre-sponding to nitric acid/membrane/nitric acid ex-periments. For correlating the results of these ex-periments, the values of the coefficients obtainedfrom the water/membrane/water system are used.
Fig. 6 shows a plot of ψs vs. θ in the water/membrane/water emulsion system at a stirrerspeed of 300 rpm. The concentrations of the sur-factant and the carrier are listed in the figure. Thevalue of the slope of the plot for 300 rpm is 7.9×10⁻⁴ s–1. The average initial radius of the globuleswas measured to be 5.8×10⁻⁵ m. From these val-ues, the difference ka – k was calculated to be1.5×10–8 m.s–1 [see Eq. (37A)]. It was not pos-sible to separate the two coefficients using Eq. (35A)since it required attainment of the steady state. Itwas found that beyond 800 s, the globules be-came sticky and phase separation, after pertrac-tion, was difficult. This introduced unacceptableinaccuracies in the measurement of the extent ofswelling. However, independent measurement
Fig. 6. Extent of occlusion in W/M/W emulsion at various impeller speeds, Np rpm. The solid lines are model fit and thesymbols are experimental data. Ratio of volume of external to membrane phase =10, initial concentration of DEHPA inthe membrane = 30 mol/m3, concentration of SPAN80 in the membrane = 69 mol/m3; speed of pertraction =300 rpm,speed of emulsification = 3000 rpm, parameters: ka = 1.5×10⁻⁸ m.s–1, k = 1.5×10⁻⁹ m.s–1.
0.0
0.2
0.4
0.6
0.8
1.0
1.2
1.4
1.6
1.8
2.0
0 200 400 600 800 1000 θ, s
Ψs
[30] gave the value of the leakage coefficient ofk = 1.50×10⁻⁹ m.s–1, which was an order of mag-nitude lower than ka – k . Hence we assigned thevalue of 1.5×10⁻⁸ m.s–1 entirely to ka.
The experiments were conducted at three dif-ferent stirrer speeds (viz. 200, 300 and 500 rpm)but with the same values of the membrane com-position. All of them yielded the same value of kaof 1.5×10⁻⁸ m.s–1. Microscopic measurements ofthe average globule size at various rpm duringpertraction are given in Table 1. The size decreaseswith the increase in the agitator speed as expected.The increase in the intensity of agitation will tendto induce a greater extent of deformation of glob-ules. On the other hand, the smaller size will ren-der the globules more resistant to deformation. Itappears from the results of these experiments thatthe effect of the intensity of agitation on defor-mation of the globules is counterbalanced by agreater rigidity of smaller globules.
There is a small but significant influence ofthe surfactant concentration on the occlusion co-
efficient as is evident from Fig. 7. The values ofthe coefficients obtained by regression are givenin Table 2. The leakage coefficient values havebeen obtained from independent experiments [30].It is observed that with an increase in the concen-tration of SPAN80, there is an increase in themagnitude of the occlusion coefficient and de-crease in the values of the leakage coefficient. Thistrend is expected because the increase in surfac-tant will result in the decrease in the interfacial
Table 2Model parameters (ka and k ) obtained by regression forvarious surfactant concentrations [S] in the water/mem-brane /water system
Fig. 7. Extent of occlusion in W/M/W emulsion for various concentrations of the surfactant [S], mol/m3. The solid linesrepresented by A, B and C are the model fits and the symbols are the experimental data. = 23 mol.m–3 (A), =46 mol.m–3 (B)
, = 69 mol.m–3 (C); treat ratio = 10, speed of pertraction = 300 rpm (R0 = 5.8×10⁵ m), initial concentra-tion of DEHPA in the membrane = 30 mol/m3, concentration of SPAN80 in the membrane = 69 mol/m3, speed ofemulsification = 3000 rpm. The model parameter values obtained by regression are given in Table 2.
1
1.1
1.2
1.3
1.4
0 100 200 300 400
A B
C Ψs
θ , s
*These values have been obtained from independent ex-periments [30]
[S] mol.m–3 ka ×108 m.s–1 *k ×109 ms–1
23 46 69
1.38 1.43 1.50
1.71 1.62 1.50
tension of the membrane making it more deform-able. This will promote occlusion of the externalphase into the membrane. Viscosity of membraneincreases with the increase in the concentrationof the surfactant. This reduces the internal circu-lation and escape of droplets and hence, the leak-age coefficient.
119
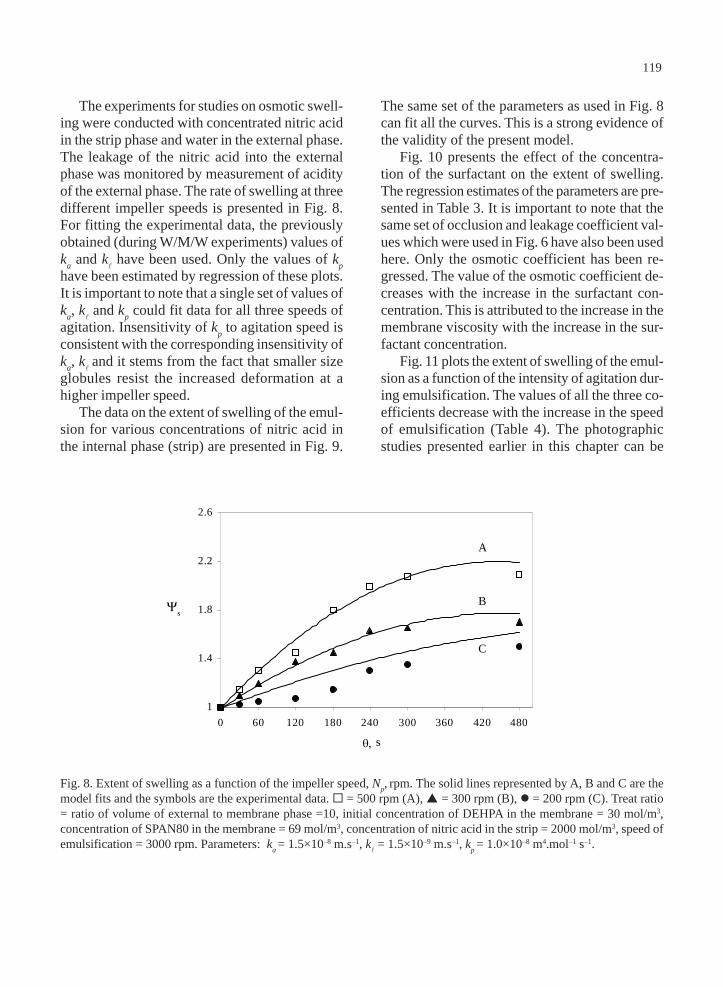
The experiments for studies on osmotic swell-ing were conducted with concentrated nitric acidin the strip phase and water in the external phase.The leakage of the nitric acid into the externalphase was monitored by measurement of acidityof the external phase. The rate of swelling at threedifferent impeller speeds is presented in Fig. 8.For fitting the experimental data, the previouslyobtained (during W/M/W experiments) values ofka and k have been used. Only the values of kphave been estimated by regression of these plots.It is important to note that a single set of values ofka, k and kp could fit data for all three speeds ofagitation. Insensitivity of kp to agitation speed isconsistent with the corresponding insensitivity ofka, k and it stems from the fact that smaller sizeglobules resist the increased deformation at ahigher impeller speed.
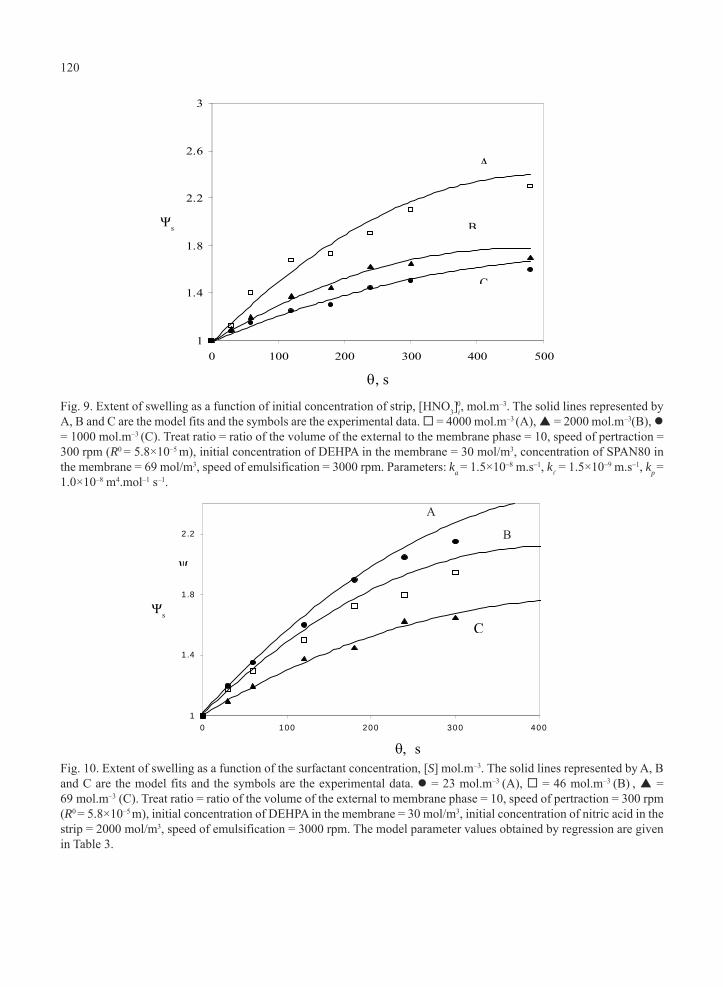
The data on the extent of swelling of the emul-sion for various concentrations of nitric acid inthe internal phase (strip) are presented in Fig. 9.
Fig. 8. Extent of swelling as a function of the impeller speed, Np, rpm. The solid lines represented by A, B and C are themodel fits and the symbols are the experimental data. = 500 rpm (A), = 300 rpm (B), = 200 rpm (C). Treat ratio= ratio of volume of external to membrane phase =10, initial concentration of DEHPA in the membrane = 30 mol/m3,concentration of SPAN80 in the membrane = 69 mol/m3, concentration of nitric acid in the strip = 2000 mol/m3, speed ofemulsification = 3000 rpm. Parameters: ka = 1.5×10⁻⁸ m.s–1, k = 1.5×10⁻⁹ m.s–1, kp = 1.0×10⁻⁸ m4.mol–1 s–1.
1
1.4
1.8
2.2
2.6
0 60 120 180 240 300 360 420 480
θ, s
A
B
C
The same set of the parameters as used in Fig. 8can fit all the curves. This is a strong evidence ofthe validity of the present model.
Fig. 10 presents the effect of the concentra-tion of the surfactant on the extent of swelling.The regression estimates of the parameters are pre-sented in Table 3. It is important to note that thesame set of occlusion and leakage coefficient val-ues which were used in Fig. 6 have also been usedhere. Only the osmotic coefficient has been re-gressed. The value of the osmotic coefficient de-creases with the increase in the surfactant con-centration. This is attributed to the increase in themembrane viscosity with the increase in the sur-factant concentration.
Fig. 11 plots the extent of swelling of the emul-sion as a function of the intensity of agitation dur-ing emulsification. The values of all the three co-efficients decrease with the increase in the speedof emulsification (Table 4). The photographicstudies presented earlier in this chapter can be
Ψs
120
Fig. 9. Extent of swelling as a function of initial concentration of strip, [HNO3]i0, mol.m–3. The solid lines represented by
A, B and C are the model fits and the symbols are the experimental data. = 4000 mol.m–3 (A), = 2000 mol.m–3(B), = 1000 mol.m–3 (C). Treat ratio = ratio of the volume of the external to the membrane phase = 10, speed of pertraction =300 rpm (R0 = 5.8×10⁻⁵ m), initial concentration of DEHPA in the membrane = 30 mol/m3, concentration of SPAN80 inthe membrane = 69 mol/m3, speed of emulsification = 3000 rpm. Parameters: ka = 1.5×10⁻⁸ m.s–1, k = 1.5×10⁻⁹ m.s–1, kp =1.0×10⁻⁸ m4.mol–1 s–1.
1
1.4
1.8
2.2
2.6
3
0 100 200 300 400 500
ψ
A
B
C
θ, s
1
1.4
1.8
2 .2
0 100 200 300 400
ψ
θ, s
C
A
B
Fig. 10. Extent of swelling as a function of the surfactant concentration, [S] mol.m–3. The solid lines represented by A, Band C are the model fits and the symbols are the experimental data. = 23 mol.m–3 (A), = 46 mol.m–3 (B) , =69 mol.m–3 (C). Treat ratio = ratio of the volume of the external to membrane phase = 10, speed of pertraction = 300 rpm(R0 = 5.8×10⁻⁵ m), initial concentration of DEHPA in the membrane = 30 mol/m3, initial concentration of nitric acid in thestrip = 2000 mol/m3, speed of emulsification = 3000 rpm. The model parameter values obtained by regression are givenin Table 3.
Ψs
Ψs
121
referred to explain this case. When the emulsionis prepared at a high speed of agitation (Ne), thestrip phase is finely dispersed and rigidly embed-ded in the membrane. In the framework of thecore shell model, this implies that the shell be-comes more rigid with the increase in the impel-ler speed during emulsification. The membrane
Table 3Model parameters (ka, k and kp) obtained by regressionfor various surfactant concentrations [S] in the nitric acid/membrane/water system
[S] mol.m–3
ka ×108 m.s–1
k ×109 ms–1
kp ×108 m4.mol–1 s–1
23 46 69
1.38 1.43 1.50
1.71 1.62 1.50
1.48 1.21 1.00
Table 4Model parameters (ka, k and kp) obtained by regressionfor various speeds of emulsification (Ne) for the nitricacid/membrane/water system
* These values have been obtained from independentexperiments [30]
Ne rpm
ka ×108 m.s-1
*k ×109 ms–1
kp ×108 m4.mol–1 s–1
2000 3000 5000
2.00 1.50 1.00
2.00 1.50 0.60
1.10 1.00 0.90
Fig. 11. Extent of swelling of the membrane as a function of intensity of agitation during emulsification, Ne, rpm. Thesolid lines represented by A, B and C are the model fits and the symbols are the experimental data. Ne = 2000 rpm (A),
Ne = 3000 rpm (B), = 5000 rpm (C). Treat ratio = ratio of the volume of the external to membrane phase = 10, speedof pertraction = 300 rpm (R0 = 5.8×10⁻⁵ m), initial concentration of DEHPA in the membrane = 30 mol/m3, concentrationof SPAN80 in the membrane = 69 mol/m3, initial concentration of nitric acid in the strip = 2000 mol/m3. The modelparameter values obtained by regression are given in Table 4.
1
1.2
1.4
1.6
1.8
2
2.2
0 50 100 150 200 250 300 350
ψ
θ, s
A
B
C
is thus more resistant to deformation and henceall the coefficients decrease.
Comparing Figs. 8–11 with Figs. 6 and 7, wesee that swelling in the presence of nitric acid inthe strip phase is considerably higher than in itsabsence. This indicates that in the presence nitric
Ψs
122
acid, osmosis is a dominant mechanism of theswelling. This is also evident from the fact thatkp
0 = kp [HNO3]i0 is three orders of magnitude higher
than the occlusion coefficient. This is understand-able since the nitric acid concentrations used inthese experiments are very high.
5. Conclusions
The model presented in this work appears beconsistent with all the experimental data on bothwater/membrane/water system and nitric acid/membrane/water system under various operatingconditions. The model is therefore a fairly goodpresentation of the actual process. The work hasresulted in the following understandings about theLEM system.1. For the present experiments, core and shell
model appears to be appropriate representa-tion of the emulsion globule.
2. The occlusion coefficient is independent of theimpeller speed, which is consistent with thedecrease in the globule size.
3. The occlusion coefficient increases with theincrease in the surfactant concentration.
4. It is observed that between the two swellingmechanisms viz. occlusion and osmotic swell-ing, the latter dominates the rate.
The present study has allowed us to collectthe information, which will be useful for estimat-ing the rate of pertraction of a solute through thenitric acid/membrane/solution LEM system withthe help of the developed model. The study willalso provide data for tuning the design and theoperating parameters in LEM pertraction toachieve minimum swelling of the emulsion. Moreimportantly, it also provides an insight into themechanisms of swelling and their relative impor-tance.
Symbols
A — Surface area of globule, m2
[D] — Concentration of DEHPA, mol/m3
[H] — Concentration of nitric acid, mol/m3
ka — Occlusion coefficient, ms–1
k0p — Osmotic coefficient, m.s–1
kp — Osmotic coefficient, m4.mol–1.s–1
k — Leakage coefficient, ms–1
Ne — Impeller speed during emulsification,rpm
Np — Impeller speed during pertraction, rpm[S] — Concentration of surfactant (SPAN80),
mol/m3
R — Radius of emulsion globule, mra — Volume rate of occlusion, m3.s–1
r — Volume rate of leakage, m3.s–1
rp — Volume rate of osmosis, m3.s–1
t — Thickness of the membrane in theglobule, m
TR — Treat ratio = ratio of volume of external(feed) phase to emulsion phase
Tr — Volume ratio of external to internal(strip) phase
V — Volume, m3
W/M/W — Water in membrane (oil) in watertype double emulsion
W/O— Water in oil type emulsion
Greek
φm — Membrane to acid phase ratio in theprimary emulsion
θ — Time, sψ — Ratio of the emulsion globule volume
References[1] R. Marr and J. Draxler, in Membrane Handbook,
W.S. Ho and K.K. Sirkar, eds., Van NorstrandReinhold, New York, 1992, p.733.
[2] R. Marr and J. Draxler, in Membrane Handbook,W.S. Ho and K.K. Sirkar, eds., Van NorstrandReinhold, New York, 1992, p.701.
[3] J.W. Frankfeld and N.N. Li, Chemical Separationswith Liquid Membranes, American ChemicalSociety, 1996, p. 841.
[4] W.S. Ho and N.N. Li, ACS Symposium Series, 642(1996) 208.
[5] L. Boyadzhiev and Z. Lazarova, in MembraneSeparations Technology: Principles andApplications, R.D. Noble and S.A. Stern, eds.,Elsevier Science, 1995, p. 283.
[6] H.J. Bart, R. Marr, J. Draxler and J. Hartl, Chem.Eng. Technol., 13 (1990) 313.
[7] Y. Wan and X. Zhang, J. Membr. Sci. 196 (2002)185.
[8] X.J. Zhang, J.H. Liu and T.S. Lu, Water Treatment,2 (1987) 127.
[9] F. Nakasio, H.A. Masha, M. Michiaki, I. Jin and K.Karuo, J. Membr Sci., 38 (1988) 249.
[10] W. Zihao, J. Yuanli and F. Jufu, J. Membr. Sci., 109(1996) 25.
[11] X.C. Ding and F.Q. Xie, J. Membr. Sci., 59 (1991)183.
[12] J. Yan and R. Pal, J. Membr. Sci., 190 (2001) 79.[13] C. Ramasedar, H.J. Bart and R. Marr, Sep. Sci.
AIChE J., 28 (1982) 662.[22] M. Teramoto, T. Sakuramoto, T. Koyama, H.
Matsuyama and Y. Miyake, Sep. Sci. Technol., 21(1986) 229.
[23] S.C. Lee, B.S. Ahn and W.K. Lee, J. Membr. Sci.,114 (1996) 223.
[24] X. Liu and X. Zhang, J. Membr. Sci., 128 (1997)223.
[25] M. Teramoto, H. Takihana, M. Shibutani, T. Yuasa,Y. Miyake and H. Teranishi, J. Chem. Eng. Jpn., 14(1981) 122
[26] A.L. Bunge and R.D. Noble, J. Membr. Sci., 21(1984) 55.
[27] R.D. Noble and S.A. Stern, Membrane Science andTechnology: Series 2, Principles and Applications,1995, p. 283.
[28] A. Skelland and X. Mang, J. Membr. Sci., 158 (1999)1.
[29] J. Yuanli, W. Fuan, K. Hyun and L. Sook, J. Membr.Sci., 191 (2001) 215.
[30] S. Mukhopadhyay, Application of liquid emulsionmembrane to extraction of uranium from diluteaqueous streams, PhD thesis, Indian Institute ofTechnology, Bombay, 2004.
124
Appendix
Mathematical model
The rate of permeation of water into a globuleis written using van’t Hoff rule as,
( )0
3 3[HNO ] [HNO ]p p i etr k At
⎛ ⎞= −⎜ ⎟
⎝ ⎠(3A)
where kp = osmotic or permeation coefficient, rp= rate of permeation of water into the globule.The osmotic coefficient is assumed to be inde-pendent of the concentration of HNO3.
Since the change of the volume, V, of the glob-ule is due to the change in the volume of the in-ternal phase alone, the volume balance on a glob-ule at any time θ can be written, using Eqs. (1A)–(3A) as
( )0
3 3
0
0
dd [HNO ] [HNO ]d d
ip i e
a
VV tk At
t tk A k At t
⎛ ⎞= = −⎜ ⎟θ θ ⎝ ⎠
⎛ ⎞ ⎛ ⎞− +⎜ ⎟ ⎜ ⎟⎝ ⎠⎝ ⎠
(4A)
Expressing the thickness of the membrane asthe difference between the outer radius R and theinner radius Ri of the membrane, i.e.
0 0 0 and i it R R t R R= − = − (5A)
we get
0 00
ii
R Rtt R R
−=
−(6A)
We denote the extent of swelling of the glob-ule as
0sVV
ψ = (7A)
Eq. (4A) can now be written in terms of theextent of swelling as follows:
( )1
3 30 0
1
0 0
d [HNO ] [HNO ]d
sp i e
a
A tkV t
t tk kt t
−
−
⎡ψ ⎛ ⎞= −⎢ ⎜ ⎟θ ⎝ ⎠⎢⎣⎤⎛ ⎞ ⎛ ⎞+ − ⎥⎜ ⎟ ⎜ ⎟
⎝ ⎠ ⎝ ⎠ ⎥⎦
(8A)
We also define the ratio of the volume of themembrane phase to the initial volume of the glob-ule as
0m
mVV
φ = (9A)
Note that
( )1/ 3 1/ 33 3
4 4i i mR V V V⎛ ⎞ ⎛ ⎞= = −⎜ ⎟ ⎜ ⎟π π⎝ ⎠ ⎝ ⎠(10A)
Using Eqs. (7A) and (9A) we can rewrite theabove equation as follows:
( )1/ 30i s mR R= ψ − φ (11A)
At θ = 0, ψs = 1 and Eq. (11A) reduces to
( )1/ 30 0 1i mR R= − φ (12A)
Using Eqs. (11A) and (12A), we can write
( )( )
1/ 31/ 3
1/ 30 00 1 1
s s mii
m
R Rtt R R
ψ − ψ − φ−= =
− − − φ(13A)
At the steady state, i.e., at θ = ∞, t = t∞ and ψs= ψs
∞, and hence
( )( )
1/31/ 3
1/ 30 00 1 1
s s mii
m
R Rtt R R
∞ ∞∞∞ ψ − ψ − φ−= =
− − − φ(14A)
The globule surface area A is related to its ini-tial volume by the following equation:
125
( )
( )
2 / 3 1/ 31/3
0 0 0
2 / 3
0
136
3 s
A VV V V
R
⎛ ⎞ ⎛ ⎞= π ⎜ ⎟ ⎜ ⎟⎝ ⎠ ⎝ ⎠
⎛ ⎞= ψ⎜ ⎟
⎝ ⎠
(15A)
Eq. (8A) can now be modified using Eq. (15A)as follows
Multiplying Eq. (21A) by p and subtracting itfrom Eq. (20A), we obtain
( ) ( )2 /30
10
0 0
3
s m s e
p a
dp p pd R
t tk p kt t
−
⎛ ⎞− ψ − φ = ψ −⎜ ⎟θ ⎝ ⎠⎡ ⎤⎛ ⎞ ⎛ ⎞+⎢ ⎥⎜ ⎟ ⎜ ⎟
⎝ ⎠ ⎝ ⎠⎢ ⎥⎣ ⎦
(23A)
Due to leakage, the concentration of nitric acidin the external phase changes with time. The varia-tion of this concentration with time can be ob-tained from the following equation based on thebalance of the nitric acid:
( )03 3
0 03 3
[HNO ] [HNO ]
[HNO ] [HNO ]e e e
i i i i
V
V V
−
= −(24A)
In the above equation, Ve represents the vol-ume of the external phase. It is assumed to beconstant. Denoting the ratio of volume of exter-nal phase to the internal phase Tr as
0e
ri
VTV
= (25A)
We can rewrite Eq. (24A) as:
( )( )
0 1 11
s me e
r m
p p pT
⎡ ⎤ψ − φ= + −⎢ ⎥
− φ⎢ ⎥⎣ ⎦(26A)
126
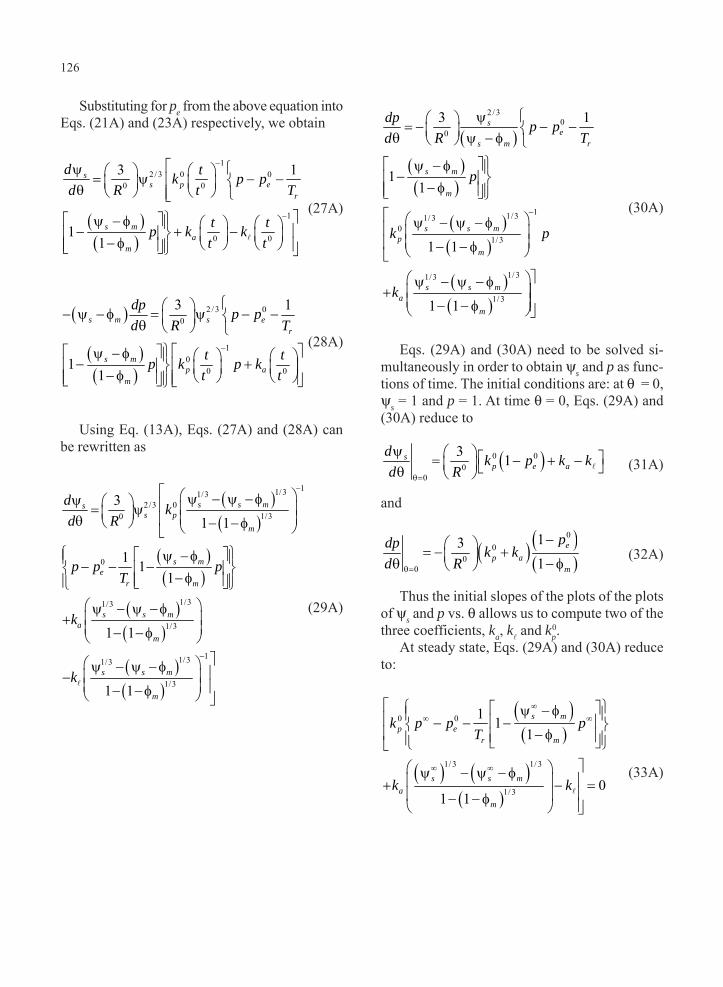
Substituting for pe from the above equation intoEqs. (21A) and (23A) respectively, we obtain
Eqs. (29A) and (30A) need to be solved si-multaneously in order to obtain ψs and p as func-tions of time. The initial conditions are: at θ = 0,ψs = 1 and p = 1. At time θ = 0, Eqs. (29A) and(30A) reduce to
( )0 00
0
3 1sp e a
d k p k kd Rθ=
ψ ⎛ ⎞ ⎡ ⎤= − + −⎜ ⎟ ⎣ ⎦θ ⎝ ⎠(31A)
and
( ) ( )( )
00
00
131
ep a
m
pdp k kd Rθ=
−⎛ ⎞= − +⎜ ⎟θ − φ⎝ ⎠(32A)
Thus the initial slopes of the plots of the plotsof ψs and p vs. θ allows us to compute two of thethree coefficients, ka, k and kp
From Eqs. (31A), (32A) and (35A), we canobtain the values of all three coefficients.Eqs. (29A) and (30A) can then be solved numeri-cally to obtain ψs and p as functions of time.
The above equations assume a simpler formfor O/W/O double emulsion system, in whichwater as the internal phase is emulsified in theorganic membrane phase which, again, is dis-persed in the external water phase. Hence it iscalled water/membrane/water system. Here, swell-ing occurs only by occlusion. Since there is nonitric acid in the internal phase, there is no os-motic gradient across the organic membrane.
Hence Eq. (30A) is not required. Moreover, thefirst term associated with the osmotic coefficientk0
p in Eq. (29A) can be ignored and hence the re-duced form of the equation is
Thus the initial slope gives the difference ka –k . Also at steady state, Eq. (36A) reduces toEq. (35A). The two equations (35A) and (37A)could, in principle, be used to estimate the occlu-sion and the leakage coefficients.