THEORETICAL AND EXPERIMENTAL STUDY O Nasir H COMPRESSION IGNITION ENGINE Muthanna L VIBRATION AND NOISE رات ا ش لإوت لص اات ع ب ن لإ ي لا ع ل ادى م ل ا ن ا! ظ وح لا م ك.(رك ح م ل اRMS ي ع و ن ل ا( لإك ه ت س الإة م ي ق ي ف ادة ي ز ل ي ا ل اب س ن يان ك ب كر م لم ا ا! ظ نل ل ار ج ن الإ اتاي س ح ن. ا(رك ح م ل م ار عان ص ق نع م ود ق و ل ل ي ن ا ي] لب ا76.72 % ي عل ة رب حg ت ل اب ي ر ج ا دما ي ع و) رى! ظ ن لا( ح ي ح ص ن ل ا وعة م ج م75.47 % ح م اري ب واسطة ب ة وب س ح م ل ا ح ن ا ي لب ا ن . ا ي ن ها لتر ا ا ي ت خ الإ وعة م ج م ي علMATLAB وى ق م ي ق ل ب ي كا ة ي] سب لن ا ظا خ ل ا ة ي س ن ، وان صة ل ج ت س م ل ا ة ي مل ع ل ا ح ن ا ي لب ع ا م دا ي ح ق ف بg ن س كن م ل ا ار ز هت ظ ومدى ا غ لص ا3 % . INTRODUCTION: The main drawback of vibration technique is effective when the vibration signal generated by a development fault of an engine is well above the background noise level. Thus, applications of the technique in diesel engine monitoring could be severely hindered by the relatively low vibration energy generated by incipient engine faults and the more dominant high energy noise and vibration from various mechanical events such as combustion, valve opening, closing and auxiliary devices [Lin et al, 2011]. It is known that diesel engines generally deliver less power for a given size and they produce more noise and vibration. Lately, the noise and vibration have been decreasing toward a level that is comparable to that of gasoline engines grace of technological improvements of the fuel injection system [Mihai et al, 2000].An internal combustion engine operating on a thermodynamic cycle in which the ratio of compression of the air charge is sufficiently high to ignite the fuel subsequently injected into the combustion chamber since the combustion of fuel takes place inside the engine cylinder so these engines are very noisy [Chirag, 2004]. The vibration induced in any machine due to its moving parts is only of lower frequency. But some high frequency vibrations are also present in internal combustion engine due to abnormal combustion of charge ( fuel – air mixture). Vibrations produced in diesel engine are mainly in two directions: vibrations in lateral direction and vibrations in longitudinal (axial) direction [Jindal, 2012]. Condition monitoring technology for diesel engines has been developed in recent years. Diesel engine manufactures and third – party vendors have developed engine monitoring techniques to determine performance of 537
Transcript
THEORETICAL AND EXPERIMENTAL STUDY O Nasir H COMPRESSION IGNITION ENGINE Muthanna LVIBRATION AND NOISE
إلشارات. الصوت النبعاث العالي المدى أن لوحظ كما في RMSالمحرك الزيادة إلى ينسب . للنظام االنجاز حسابات إن المحرك عزم نقصان مع للوقود البياني النوعي االستهالك قيمة
كان ( % 76.72المركب ( و النظري التصحيح مجموعة على التجربة أجريت على % 75.47عندما . برنامج بواسطة المحسوبة النتائج إن النهائي االختبار الضغط MATLABمجموعة قوى لقيم
كانت النسبية الخطأ نسبة وان المستخلصة، العملية النتائج مع جيدا تتفق المكبس اهتزاز ومدى3%.
INTRODUCTION: The main drawback of vibration technique is effective when the vibration signal
generated by a development fault of an engine is well above the background noise level. Thus, applications of the technique in diesel engine monitoring could be severely hindered by the relatively low vibration energy generated by incipient engine faults and the more dominant high energy noise and vibration from various mechanical events such as combustion, valve opening, closing and auxiliary devices [Lin et al, 2011]. It is known that diesel engines generally deliver less power for a given size and they produce more noise and vibration. Lately, the noise and vibration have been decreasing toward a level that is comparable to that of gasoline engines grace of technological improvements of the fuel injection system [Mihai et al, 2000].An internal combustion engine operating on a thermodynamic cycle in which the ratio of compression of the air charge is sufficiently high to ignite the fuel subsequently injected into the combustion chamber since the combustion of fuel takes place inside the engine cylinder so these engines are very noisy [Chirag, 2004]. The vibration induced in any machine due to its moving parts is only of lower frequency. But some high frequency vibrations are also present in internal combustion engine due to abnormal combustion of charge ) fuel – air mixture(. Vibrations produced in diesel engine are mainly in two directions: vibrations in lateral direction and vibrations in longitudinal )axial( direction [Jindal, 2012]. Condition monitoring technology for diesel engines has been developed in recent years. Diesel engine manufactures and third – party vendors have developed engine monitoring techniques to determine performance of diesel engine operation. A typical monitoring system is applied microprocessor based instrument with analysis software to monitor engine combustion characteristics, intake / exhaust valve operation, piston motion, cylinder and liner conditions[Songpon et al, 2009]. Several researchers worked on the some field, but with several point of views. Among the diagnostic techniques applied to internal combustion engines, those based on the analysis of accelerometer data have earned a greater success. Chun measured oscillations at the upper part of the cylinder block center for knock in S.I.E )spark ignition engines( [Chun et al, 1994]. Zurita rebuilt in – cylinder pressure history through the signal provided by an accelerometer placed externally [Zurita et al, 1999]. Antoni used vibrations to indicate malfunctioning [Antoni et al, 2002], which has been proved by Carlucci that injection pressure and injected quantities, over an energy release threshold, really affect the vibration signals in a peculiar way, injection timing affects the engine block vibration in a less evident way [Carlucci et al, 2005]. Gideon used vibration measurement to identify malfunctioning in a multi cylinder engine [Gideon et al, 2004]. The cylinder pressure developed within an internal combustion engine can be considered to be the pulse of the engine. In conjunction with the periodic events such as inlet and exhaust valve operations and fuel injection timings, it provides valuable information about the combustion characteristics of the engine [Chun et al, 1994]. Many investigations have been done concerning the relation of the diesel engine combustion noise to the engine operating and design parameters [Sun et al, 2007]. Typical frequencies seen in vibration power spectra measured on the engine block include low frequency harmonic components at firing frequency and its multiplies from 1Hz up
537
Nasir H The Iraqi Journal For Mechanical And Material Engineering, Vol.13, No3, 2013 Muthanna L
to 400Hz,bending frequencies in the range of 400 - 800 Hz and combustion chamber resonances in the range from 800 – 4000 Hz [Ren et al, 1999]. The aim of this research is to investigate relationship between the diesel engine vibration and noise with engine performance parameters such as )indicated power, indicated specific fuel consumption, indicated thermal efficiency and indicated mean effective pressure(, and the effect of pressure force ) which is produced from by ignition of air – fuel mixture in the cylinder( on vibration and sound pressure level )SPL( in a small diesel engine. The calculation performance of the combined system was tested on the validation ) theoretical( set and on the final test set. Also comparison with effectiveness and sensitivity of different vibration and noise analysis was done.
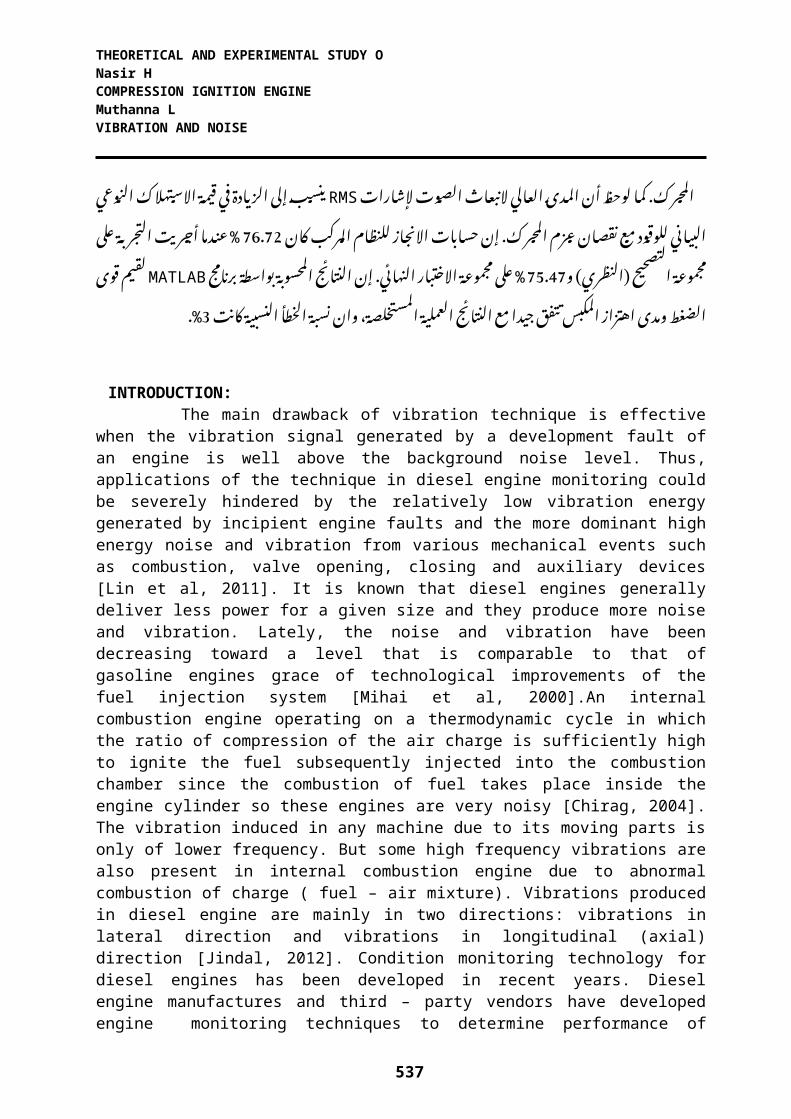
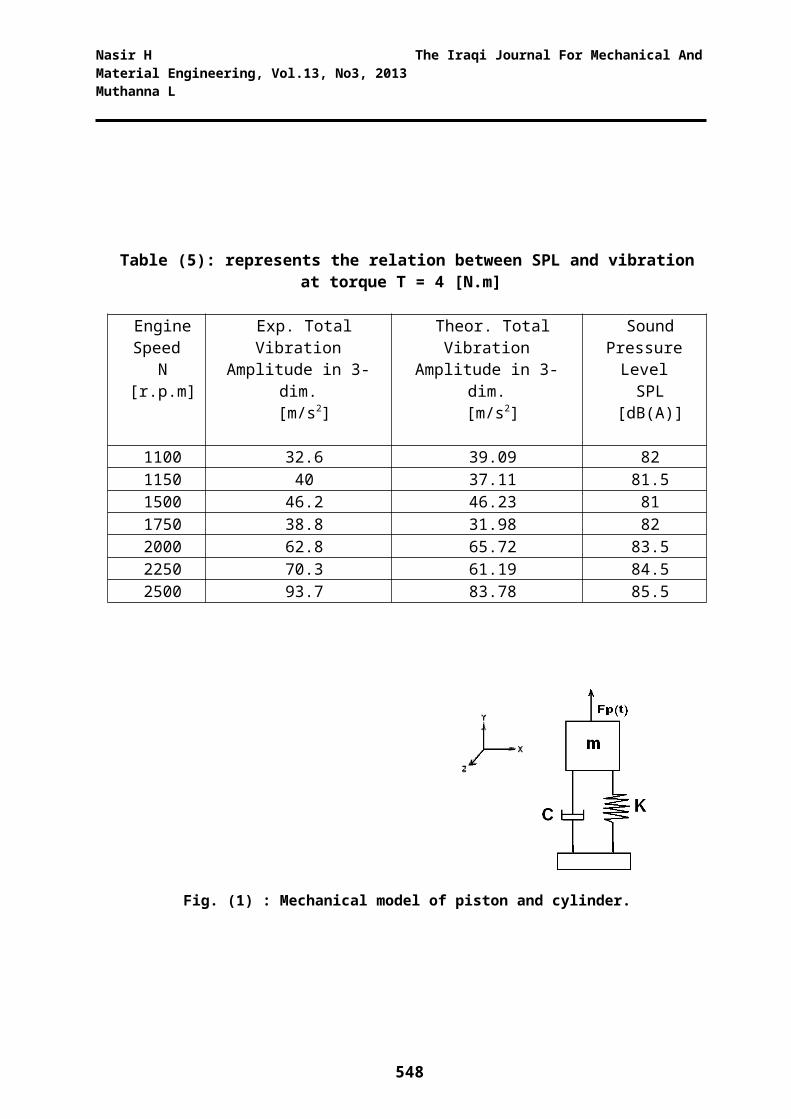
THEORY: In a direct injection, there are two main excitatory forces which are the unidirectional force due to combustion and reversible forces which are mechanically induced. Due to the large heat release during combustion, the pressure rise is extremely rapid in this zone and causes oscillations in the cylinder pressure [Ren et al, 1999].The pressure force fluctuations, Fp )t( as shown in Fig. 1 , cause the engine structure to vibrate and this response could be modeled as a linear spring – mass system of mass )M(, damping coefficient )C(, and dynamic stiffness )K( in degree of freedom dimensional system as in [Ren et al, 1999].
Ma + Cv + Kx = Fp )t( )1(
Where : x: displacement v : velocity a : acceleration In loading the engine, the equation of motion of diesel engine which is used in this research
in three degree of freedom DOF system becomes:
m + C +Kx = Fx)t( )2(
m +C + Ky = Fy)t( )3(
m + C + Kz = Fz)t( )4(
+ )5(
Eq. )5( can be reduced to unit matrix as:
m )6(
538
THEORETICAL AND EXPERIMENTAL STUDY O Nasir H COMPRESSION IGNITION ENGINE Muthanna LVIBRATION AND NOISE
Where unit matrix is : I =
Substituting this unit matrix I in eq.)6(:
m.I. )7(
In order to solve eq.)7(, the following assumptions are used: x = X sin t
y = Y sin t
z = Z sin t
Substituting these values in eq.)7( and rearranging in terms of unit matrix I:
- m.I. 2 sin + C.I. + K.I. = )8(
Rearranging eq.)8( becomes as:
) C.cot ) ( . sin ) )9(
MATLAB PROGRAM:Eq. )9( is used to determine vibration pressure force at different engine torque range )0 N.m
to 10 N.m( and at engine speed range N = 1100 – 2500 r.p.m or =115 – 262 rad/s is shown in
following program, where:
Therefore by using experimental results at engine torque T = 0 N.m.>> % Calculate vibration pressure force at T = 0 N.m>> t = 385.7;>> m = 35 ;>> C = 47 ;>> K = 344 ;>> = 115 ;
>> x = 10.2 ;>> y = 27 ;>> z = 25.3 ;>> B = C * cot ) * t( – m* + )K / ( ;
539
Nasir H The Iraqi Journal For Mechanical And Material Engineering, Vol.13, No3, 2013 Muthanna L
>> D = B * [ x; y; z];>> J = ) / sin ) * t((* [ 100; 010; 001]* )1/106(;
>> F = J*D>> F
80.2136 Fx = 80.2 134.4071 it means Fy = 134.4 243.6315 Fz = 243.6
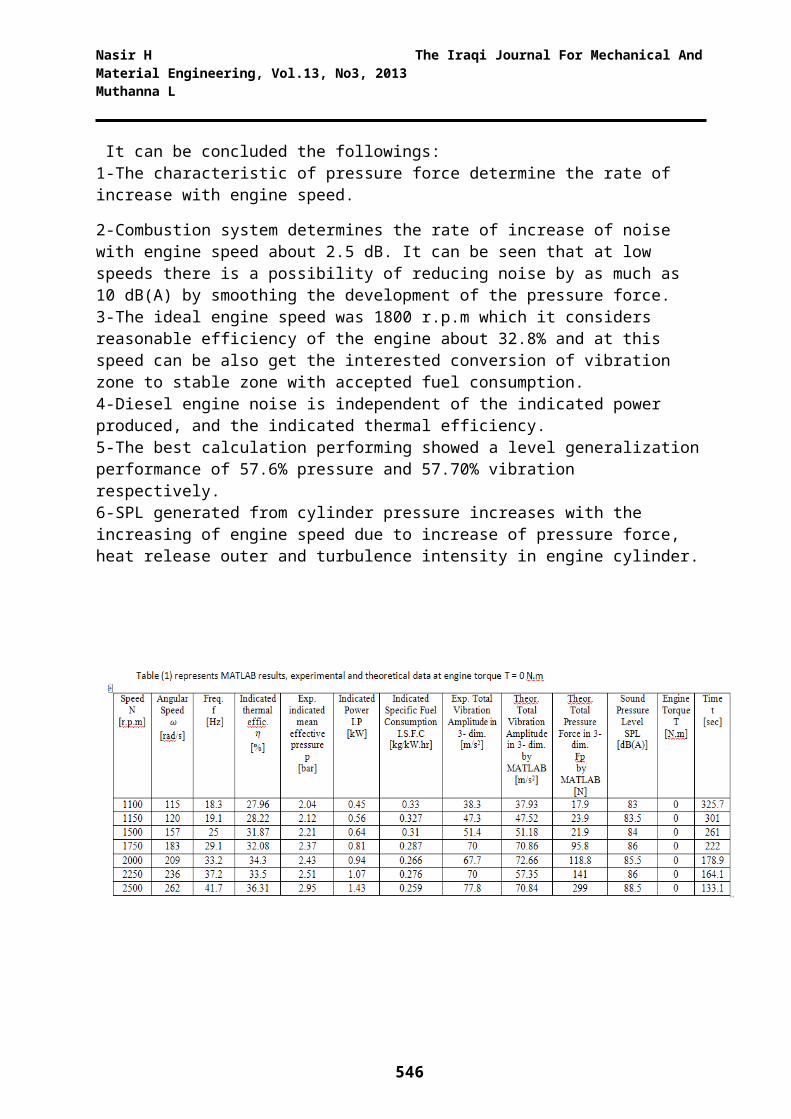
The results of MATLAB program is represented in Tables 1, 2 and 3. This program is used to determine vibration pressure forces in three axes and to calculate theoretical vibration amplitude in three coordinates. In automotive applications, it is generally assumed that:a. The engine is decoupled from the load torque.b. The crankshaft is sufficiently rigid.c. The engine torque is changed.
The assumption that the engine is decoupled from the load is usually valid in automotive applications, since the nominal rotational speed of the engine is typically significantly higher than the first natural frequencies of the crankshaft.
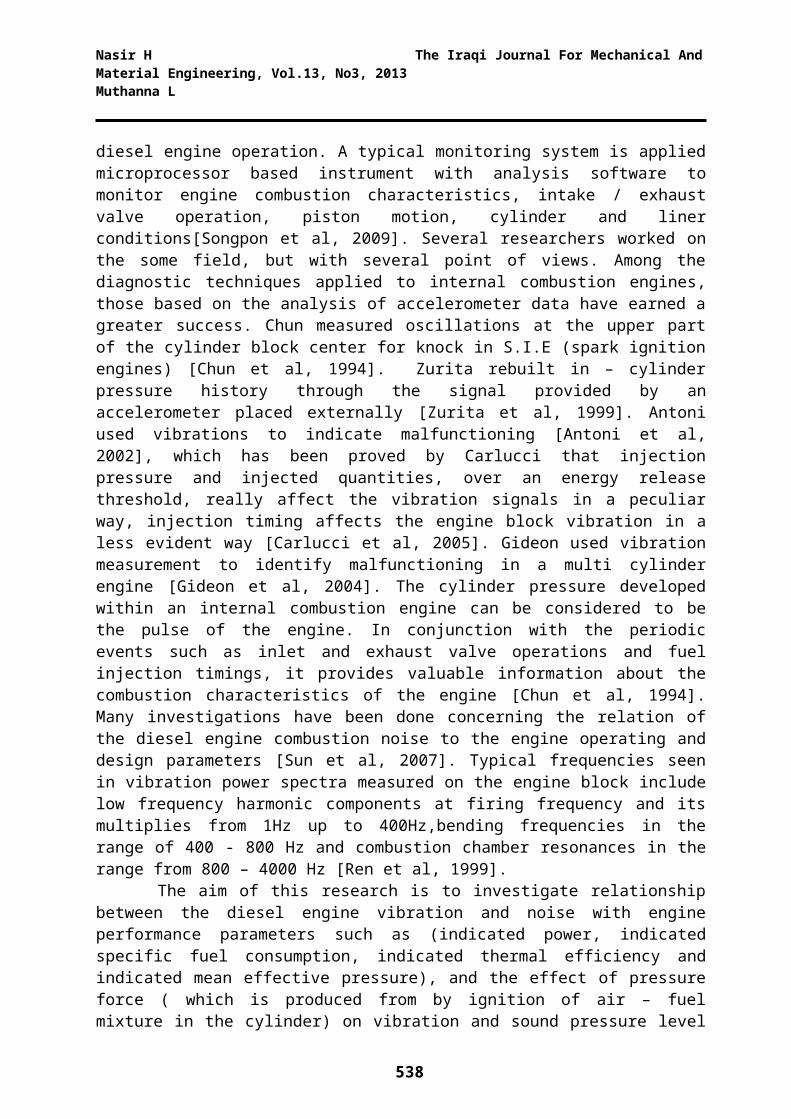
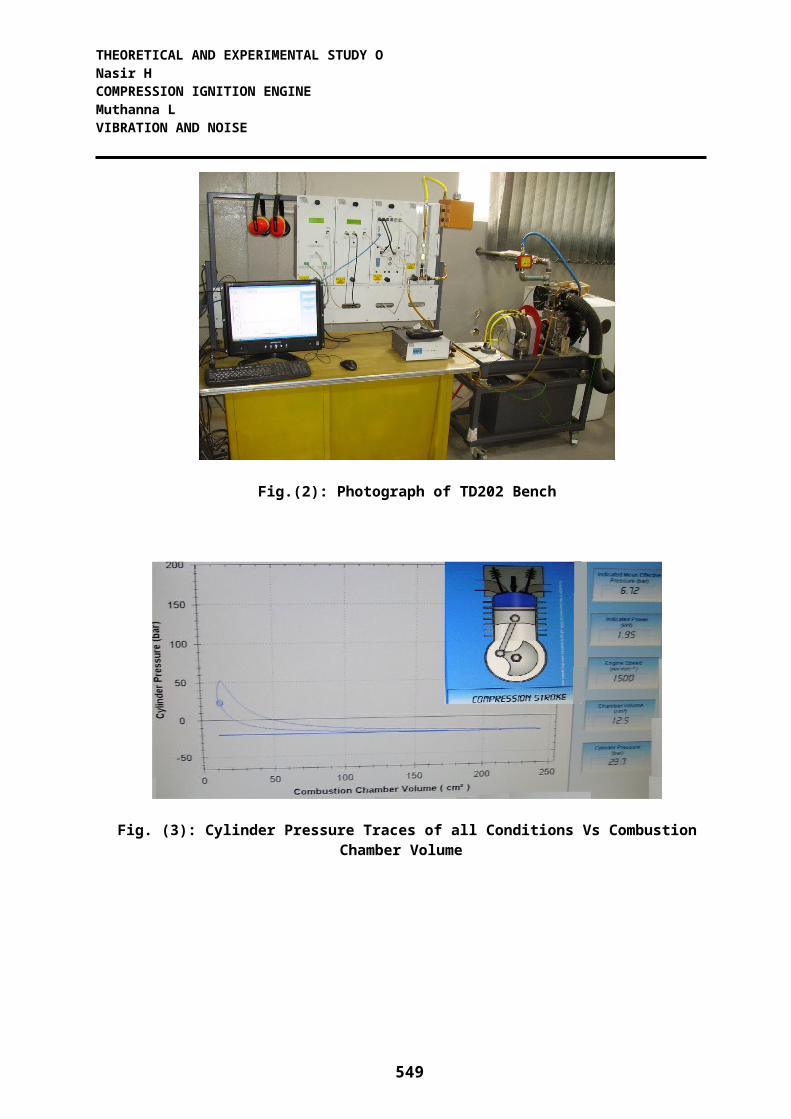
EXPERIMENTAL SETUP: The tests were carried on the small internal combustion diesel engine test bed at the research lab of automotive workshop in Institute of Technology - Baghdad. The engine is four stroke, single cylinder naturally aspirated compression ignition engine combined with scale data acquisition system with following specifications: Engine Type TD202 Fuel Type Diesel Displacement)Engine Capacity( 232cm3 Compression Ratio 22:1 Bore Diameter 69 mm Stroke 62 mm Absolute Maximum Power 3.5 kW )4.8 hp( at 3600 rev/min Continuous Rated Power 3.1 kW at 3000 rev/min Maximum Speed 3600 rev/min The present system is digitally controlled, and capable to store the experimental data instantaneously. The system as shown in Fig. 2 provides a facility to conduct engine performance tests at different engine speeds )1100 – 2500( r.p.m. Two signals acquired using Lab / View program as vibration and noise signals. An aluminum clamp was used to hold - Bruel )PCB( & Kjoer )JCP( piezoelectric accelerometers at the three axis x, y and z are used. It can be seen that the vibration signals show other small and unclear events, which may come from other sources inside the engine such as ignition process, combustion process, piston movement and auxiliary equipment. The noise measurements were effected in accordance with instrument STAS 7150 – 77, concerning measurement method for the noise level. The microphone being mounted in the position where the engine in working conditions. SLM )Sound Level Meter( was calibrated and the calculating errors were removed. It was calibrated to 75 dB)A( on the lower side and 100 dB)A( on the upper side. The engine connected to hydraulic type dynamometer for loading. These signals were interfaced to the computer. Provision was also made available for interfacing indicated specific fuel consumption, indicated power, indicated pressure and load measurements. The compression ratio was constant )C.R = 22:1( and the engine torque was varied from 0 N.m to 10 N.m., fuel measuring unit, pressure measurement, time measurement, process indicator and engine indicator were used in this test. The sensors are type )Kistler( high temperature pressure sensor and an )PCB(
540
THEORETICAL AND EXPERIMENTAL STUDY O Nasir H COMPRESSION IGNITION ENGINE Muthanna LVIBRATION AND NOISE
JCP piezoelectric accelerometers. Signals acquired by these sensors at the normal engine signal running condition various engine torques are analyzed for the characterization and to establish the baseline information of the diesel engine. This baseline information would be utilized for fault detection in the fault simulation test of the diesel engine. Cylinder pressure is measured using piezoelectric pressure transducer as shown in Fig. 3. The sensing element is located in a hole drilled through the cylinder head into the combustion chamber. The sensing element consists of a metal diaphragm which deflects under pressure, and is connected by an optical fiber to a light source and a detector. The intensity of the reflected light is converted to a voltage which is proportional to the pressure.
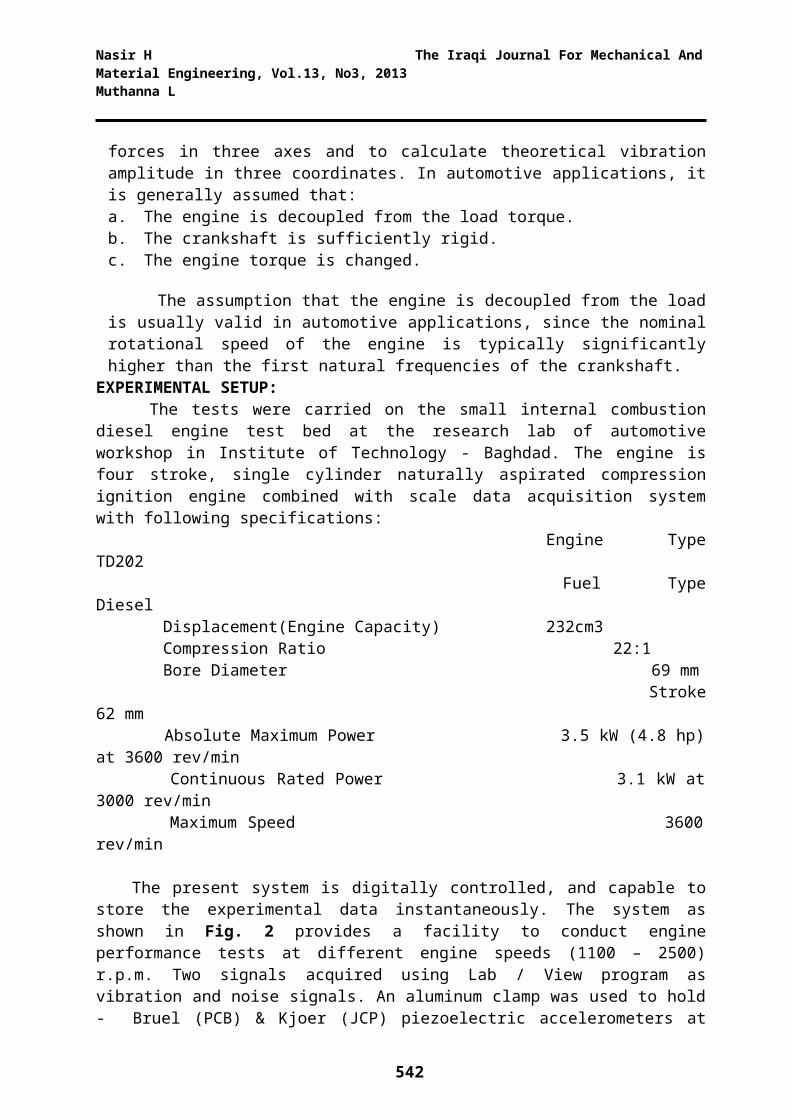
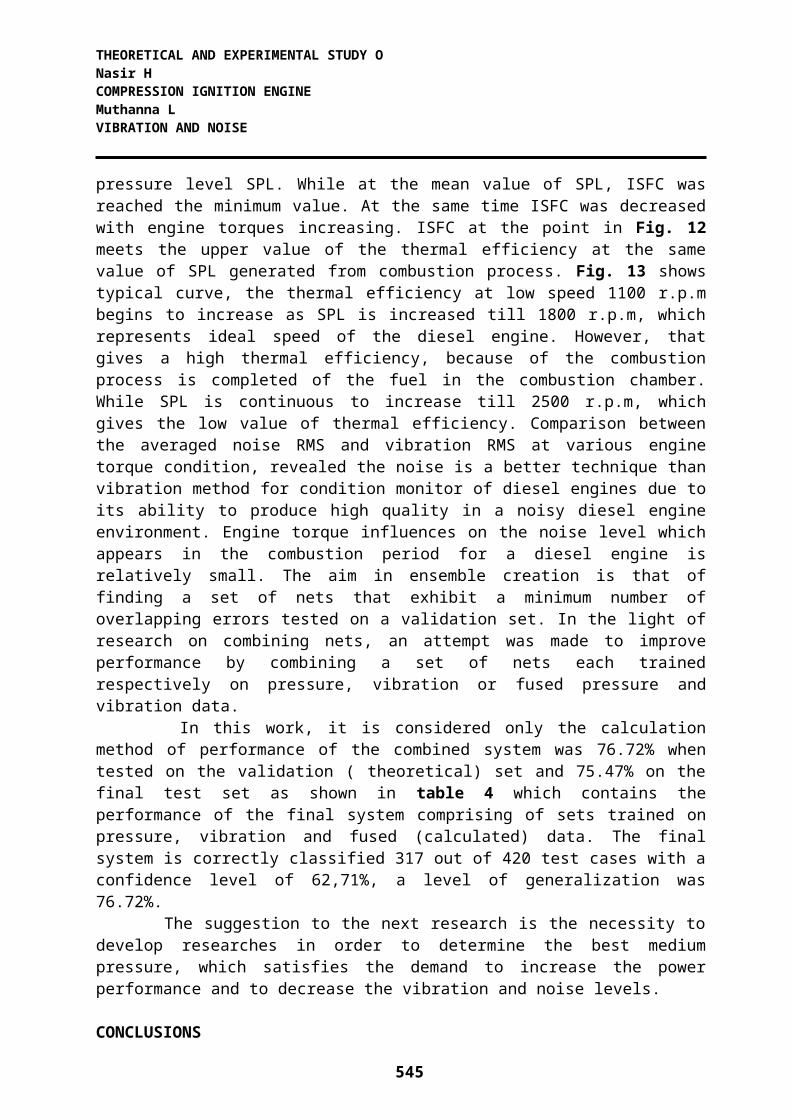
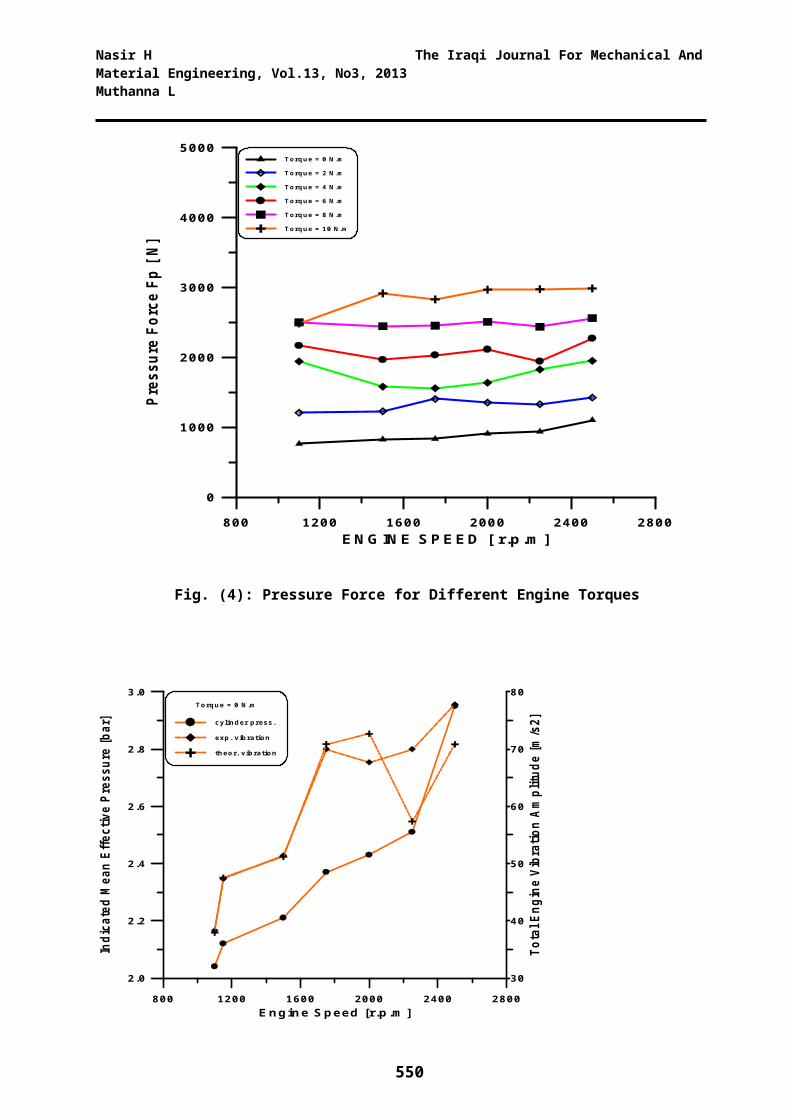
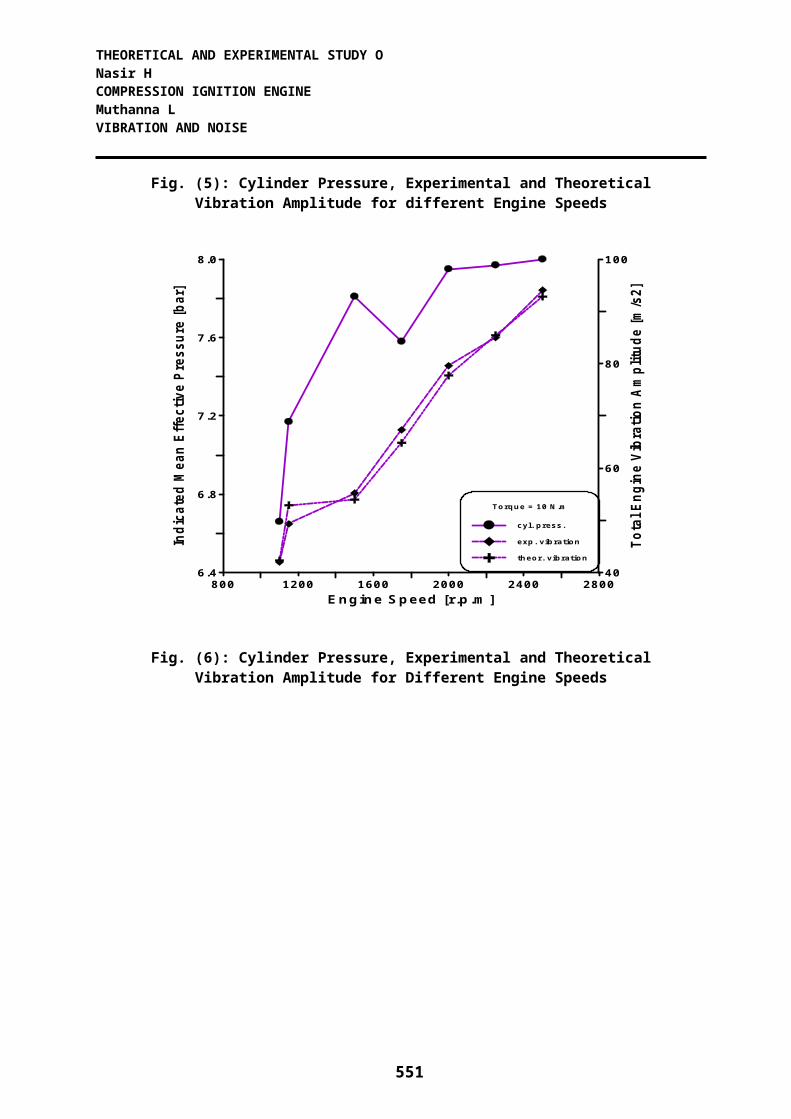
RESULTS AND DISCUSSION: Fig. 4 shows the relationship between pressure force and engine speed. It is seen that the engine speed has no effect on the resulted pressure force. From Figs. 5 & 6 the engine structure get excited with lower order harmonics which has higher vibration amplitudes, and the pressure is increased parallel to the vibration amplitudes at engine torques 0 N.m and 10 N.m., also, it can be seen from these figures, the effect of different engine torques on the total engine vibration amplitudes. Fig. 7 shows the stability zone decreases as RMS of total vibration amplitude and mean cylinder pressure are increased, so it is noticed the minimum zone of vibration at torques 2 N.m and 8 N.m. The calculated results by MATLAB program of theoretical vibration amplitudes agree well with experimental results with relative true error was 3%. In this research, the diesel engine speed used is in the range of )1100 – 2500( r.p.m. The changes in indicated mean effective pressure ) IMEP( and total engine vibration amplitudes would be proportionally slower in the slow engine speed, thus making it easier to record data with a much higher resolution. Fig. 8 shows that the small amount of heat energy is produced in the chamber of the compression ignition engine, which needs low thermal efficiency with low RMS vibration and then thermal efficiency is increased with however, increasing RMS vibration. The relationship between sound pressure level SPL and engine speed, is represented by Fig. 9, noise was in the range of 80 – 88 dB, it means not so high noise is produced from the engine, because of SPL generated from cylinder pressure is due to different rates of fuel burning, pressure wave generated with different process inside engine cylinder due to piston motion, fluctuations in heat release rate, mixing process of burnt and unburnt gases, compression and expansion of gases inside the cylinder due to piston motion. Noise SPL signals are due to their respective operating frequency ranges. Therefore noise SPL is increased clearly with increasing engine speed. Important vibrations are generated by the forces of pressure in Fig. 10 which developed in the cylinder block, that depend on the mass and dimensions of the different moving engine parts. The forces of pressure and their torque can be generally, entirely or partly balanced. The engine sound pressure level SPL varies with loading torque variations with 2 – 4 dB, but at the same time working characteristics vary in large intervals. It is concluded, that engine torque has nearly no effect on sound pressure level SPL. In Fig. 11 it is obviously noticed that SPL is decreased with increasing indicated power. Fig. 12 shows typical curve, which indicated specific fuel consumption ISFC represents the maximum value at low and high sound pressure level SPL. While at the mean value of SPL, ISFC was reached the minimum value. At the same time ISFC was decreased with engine torques increasing. ISFC at the point in Fig. 12 meets the upper value of the thermal efficiency at the same value of SPL generated from combustion process. Fig. 13 shows typical curve, the thermal efficiency at low speed 1100 r.p.m begins to increase as SPL is increased till 1800 r.p.m, which represents ideal speed of the diesel engine. However, that gives a high thermal efficiency, because of the combustion process is completed of the fuel in the combustion chamber. While SPL is continuous to increase till 2500 r.p.m, which gives the low value of thermal efficiency. Comparison between the averaged noise RMS and vibration RMS at
541
Nasir H The Iraqi Journal For Mechanical And Material Engineering, Vol.13, No3, 2013 Muthanna L
various engine torque condition, revealed the noise is a better technique than vibration method for condition monitor of diesel engines due to its ability to produce high quality in a noisy diesel engine environment. Engine torque influences on the noise level which appears in the combustion period for a diesel engine is relatively small. The aim in ensemble creation is that of finding a set of nets that exhibit a minimum number of overlapping errors tested on a validation set. In the light of research on combining nets, an attempt was made to improve performance by combining a set of nets each trained respectively on pressure, vibration or fused pressure and vibration data.
In this work, it is considered only the calculation method of performance of the combined system was 76.72% when tested on the validation ) theoretical( set and 75.47% on the final test set as shown in table 4 which contains the performance of the final system comprising of sets trained on pressure, vibration and fused )calculated( data. The final system is correctly classified 317 out of 420 test cases with a confidence level of 62,71%, a level of generalization was 76.72%.
The suggestion to the next research is the necessity to develop researches in order to determine the best medium pressure, which satisfies the demand to increase the power performance and to decrease the vibration and noise levels.
CONCLUSIONS It can be concluded the followings:1-The characteristic of pressure force determine the rate of increase with engine speed.
2-Combustion system determines the rate of increase of noise with engine speed about 2.5 dB. It can be seen that at low speeds there is a possibility of reducing noise by as much as 10 dB)A( by smoothing the development of the pressure force.3-The ideal engine speed was 1800 r.p.m which it considers reasonable efficiency of the engine about 32.8% and at this speed can be also get the interested conversion of vibration zone to stable zone with accepted fuel consumption.4-Diesel engine noise is independent of the indicated power produced, and the indicated thermal efficiency.5-The best calculation performing showed a level generalization performance of 57.6% pressure and 57.70% vibration respectively.6-SPL generated from cylinder pressure increases with the increasing of engine speed due to increase of pressure force, heat release outer and turbulence intensity in engine cylinder.
542
THEORETICAL AND EXPERIMENTAL STUDY O Nasir H COMPRESSION IGNITION ENGINE Muthanna LVIBRATION AND NOISE
Table (4): performance of final system
Data Source performanceExperimental Validation ) theoretical(
Pressure )pi( 50 – 87% 57.61%
Vibration )vj( 57.70% 56.78%P&v
)pi +vj( fused )calculated(
62.71% 62.28%
Ensemble performance 75.47% 76.72%
Table (5): represents the relation between SPL and vibration at torque T = 4 [N.m]
543
Nasir H The Iraqi Journal For Mechanical And Material Engineering, Vol.13, No3, 2013 Muthanna L
Fig. (1) : Mechanical model of piston and cylinder.
Fig.(2): Photograph of TD202 Bench
544
THEORETICAL AND EXPERIMENTAL STUDY O Nasir H COMPRESSION IGNITION ENGINE Muthanna LVIBRATION AND NOISE
Fig. (3): Cylinder Pressure Traces of all Conditions Vs Combustion Chamber Volume
800 1200 1600 2000 2400 2800ENGINE SPEED [ r.p.m]
0
1000
2000
3000
4000
5000
Pres
sure
For
ce F
p [ N
]
Torque = 0 N.m
Torque = 2 N.m
Torque = 4 N.m
Torque = 6 N.m
Torque = 8 N.m
Torque = 10 N.m
Fig. (4): Pressure Force for Different Engine Torques
545
Nasir H The Iraqi Journal For Mechanical And Material Engineering, Vol.13, No3, 2013 Muthanna L
800 1200 1600 2000 2400 2800
Engine Speed [r.p.m ]
2.0
2.2
2.4
2.6
2.8
3.0
Indi
cate
d Me
an E
ffect
ive P
ress
ure [
bar]
30
40
50
60
70
80
Tota
l Eng
ine V
ibra
tion
Ampl
itude
[m/s2
]Torque = 0 N.m
cylinder press.
exp. vibration
theor. vibration
Fig. (5): Cylinder Pressure, Experimental and TheoreticalVibration Amplitude for different Engine Speeds
800 1200 1600 2000 2400 2800Engine Speed [r.p.m]
6.4
6.8
7.2
7.6
8.0
Indi
cate
d Me
an E
ffect
ive P
ress
ure [
bar]
40
60
80
100
Tota
l Eng
ine V
ibra
tion
Ampl
itude
[m/s2
]
Torque = 10 N.m
cyl. press.
exp. vibration
theor. vibration
Fig. (6): Cylinder Pressure, Experimental and TheoreticalVibration Amplitude for Different Engine Speeds
546
THEORETICAL AND EXPERIMENTAL STUDY O Nasir H COMPRESSION IGNITION ENGINE Muthanna LVIBRATION AND NOISE
0 2 4 6 8 10Engine Torque [ N.m ]
40
50
60
70
RMS
of T
otal
Vibr
atio
n Am
plitu
de [m
/s2]
0
2
4
6
8
10
Mean
Cyli
nder
Pre
ssur
e [ba
r]
exp. vibration
theor. vibration
cylinder pressure
VIBRATION
STABLITY
Relative True Error = 3%
Fig. (7): RMS of Total Vibration Amplitude and MeanCylinder Pressure for Different Engine Torques
24 28 32 36 40Indicated Therm al Efficiency [% ]
45
50
55
60
65
70
RMS
of T
otal
Expe
rimen
tal V
ibra
tion
Ampl
itude
[m/s2
]
45
50
55
60
65
70
RMS
of T
otal
Theo
retic
al Vi
brat
ion
Ampl
itude
[m/s2
]
Torque = 10 N.m theor.
Torque = 6 N.m theor.
Torque = 0 N.m theor.
Torque = 10 N.m exp.
Torque = 6 N.m exp.
Torque = 0 N.m exp.
Fit 8: Polynom ial
Fit 7: Polynom ial
Fit 12: Linear, Y=B*X+A
Fit 9: Polynom ial
Fit 10: Polynom ial
Fit 11: Polynom ial
Fig. (8): Indicated Thermal Efficiency, RMS of Total Experimental and Theoretical Vibration Amplitude for Different Engine Torques.
547
Nasir H The Iraqi Journal For Mechanical And Material Engineering, Vol.13, No3, 2013 Muthanna L
1200 1600 2000 2400 2800
Engine Speed [ r.p.m ]
76
80
84
88
Soun
d Pr
essu
re L
evel
SPL
[dB]
Fig. (9): Sound Pressure Level for Different Rotational Engine Speed at Torque T = 6 N.m
0 2 4 6 8 10Engine Torque [N.m ]
60
70
80
90
RMS
of S
ound
Pre
ssur
e Lev
el SP
L [d
B]
Fig. (10): RMS of Sound Pressure Level for Different Engine Torques
548
THEORETICAL AND EXPERIMENTAL STUDY O Nasir H COMPRESSION IGNITION ENGINE Muthanna LVIBRATION AND NOISE
Fig. (11): Sound Pressure Level and Indicated Power for Different Engine Torques.
82 83 84 85 86Sound Pressure Level SPL [dB]
0.28
0.32
0.36
Indi
cate
d Sp
ecifi
c Fue
l Con
sum
ptio
n IS
FC [k
g/kW
.hr]
Torque = 10 N.m
Torque = 6 N.m
Torque = 0 N.m
Fit 1: Polynom ial
Fit 2: Polynom ial
Fit 4: Polynom ial
549
0 1 2 3 4Indicated Power [kW ]
80
82
84
86
Soun
d Pr
essu
re L
evel
SPL
[dB]
Torque = 0 N.m
Torque = 2 N.m
Torque = 4 N.m
Torque = 6 N.m
Torque = 8 N.m
Torque = 10 N.m
Nasir H The Iraqi Journal For Mechanical And Material Engineering, Vol.13, No3, 2013 Muthanna L
Fig. (12): Indicated Specific Fuel Consumption and Sound
Pressure Level for Different Engine Torques.
82 83 84 85 86
RMS of Sound Pressure Level SPL [dB]
24
28
32
36
40In
dica
ted
Ther
mal
Effe
cienc
y [%
]Torque = 10 N.m
Fit 1: Polynom ial
Torque = 6 N.m
Fit 2: Polynom ial
Torque = 0 N.m
Fit 3: Polynom ial
Fig. (13): Indicated Thermal Efficiency and RMS of Sound Pressure Level for
Different Engine TorquesREFERENCES: Antoni, J, Daniere, J. and Gnillet, F.” Effective Vibration Analysis of I.C.Engines Using Cyclostationary – part I; “ A Methodology for Condition Monitoring, Journal of Sound and Vibration; 257)5( 815 – 837, 2002. Carlucci, A.P., Chara, F.F.and Laforgia, D.” Analysis of the Relation Between Injection Parameter Variation and Block Vibration of an Internal Combustion Diesel Engine” Journal of Sound and Vibration, doi:10.1016, j.jsv. 2005, 12.054, 2005. Chirag Kakkar, “ A Study of 4- Stroke Diesel Engine Noise Using Different Blends of Pongamia Oil”, Dissertation submitted for degree of Master of Engineering; Mechanical Engineering Department, Thapar University, PATIALA-147004, India,2004. Chun, K.M, Kim, K.W. “ Measurement and Analysis of Knock in a S.I.Engine Using Cylinder Pressure and Block Vibration Signals”, Society of Automotive Engineers Paper No. 940146, 1994. Gideon G., Gal DE B.,Boris R. and Eran S.”Assessment of the Quality of Combustion in Compression Ignition Engines through Vibration Signature Analysis”, Technical Paper for Student and Young Engineers,Fisita World Automotive Congress, Barcelona – Beer Sheva, 1212/2004.
550
THEORETICAL AND EXPERIMENTAL STUDY O Nasir H COMPRESSION IGNITION ENGINE Muthanna LVIBRATION AND NOISE
Lin, Tian Ran &Tan, Andy,” Characterizing the Signal Pattern of a Four – Cylinder Diesel Engine Using Acoustic and Vibration Analysis”, In Shen, Gongtian & Wu, Zhanwen (Eds), Proceedings of World, Conference on Acoustic Emission; pp.506 – 515, Chinese, 2011.
Mihai Toader, Vasile Bacria, and Nicolae Herisanu, “Considerations about the Noise and Vibration Generated by Internal Combustion Engines”, Polytechnic University of Timisoara, Department of Mechanics and Vibration;I.Bd- M. Viteazu,300222 Timisoara, Romania,2000.
Ren, Y., Randall, R.B. and Milton, B.E.,” Influence of the Resonant Frequency on the Control of Knock in Diesel Engine”, Proc. Inst. Mech. Engrs. Part D.213, pp. 127 – 133, 1999.S, Jindal, “ Vibration Signatures of a Biodiesel Fueled C.I.Engine and Effect of Engine Parameters”, Int. J. of Energy and Environment Vol.3, I,2012, pp.151 – 160.
Songpon Klinchaeam, Pornachai Nivesrang San and Ming Lokitsang Thong,” Condition Monitoring of a Small Four – Stroke Petrol Engine Using Vibration Signals”, Dept. of Mech. Eng., Eng. Fac., Mahanakorn University of Technology, 140 Cheam – Sampon Road, Nongchok, Bangkok, 10530, Thailand, 2009.
Sun Shao Jun, Zheng – Young, NI Guan Gjian, Zhang Junhong” Multi – Body Dynamics Analysis and Low Noise Optimization of X6170ZC Diesel”, Transactions of Tianjin University, ISSN 1006 – 4982,Vol. 13, No. 4, pp. 297 – 302, Aug. 2007, China.
Zurita, G., Agren, V.A., Pattersson,E.” Reconstruction of Cylinder Pressure from Vibration Measurements for Predication of Exhaust and Noise Emission in Ethanol Engines”, Society of Automotive Engineers, Paper No. 1999 – 01 – 1658., 1999.


![Untitled-13 [] · O'E-SEL DIESEL WORLD DIESEL DIESEL DIESEL WC)ALD DIESEL WORLD DIESEL WORLD DIESEL want-a The Perfect Combo To sum up nearly every new truck review on a 3/4-ton or](https://static.documents.pub/doc/80x56/5f7a5b1de1247a6a345bc3bf/untitled-13-oe-sel-diesel-world-diesel-diesel-diesel-wcald-diesel-world-diesel.jpg)


