35
Mathematical Modeling of Bacterial Regulatory Networks Hidde de Jong INRIA Grenoble - Rhône-Alpes [email protected] http://ibis.inrialpes.fr

Mathematical Modeling of Bacterial Regulatory Networks
Hidde de Jong
INRIA Grenoble - Rhône-Alpes [email protected] http://ibis.inrialpes.fr

2
Overview
1. Gene regulatory networks in bacteria
2. Mathematical modeling of gene regulatory networks
3. Relation between network structure and dynamics
4. Stochasticity and network dynamics
5. Conclusion and challenges for modelers

3
Bacterial growth and adaptation Bacteria are geared towards growth and division
E. coli cells have doubling times up to 20 min
Stewart et al. (2005), PLoS Biol., 3(2): e45
External perturbations may cause adaptation of growth rate, and more generally, may change physiology of bacterial cell Nutrient starvation, heat shock, osmotic stress, high population density, …

Gene regulatory networks The adaptation of bacteria to changes
in their environment involves adjustment of gene expression levels Differences in expression of enzymes in
central metabolism of E. coli during growth on glucose or acetate
Gene regulatory networks control changes in expression levels in response to environmental perturbations
Oh et al. (2002), J. Biol. Chem., 277(15):13175–83

Gene regulatory networks Gene regulatory networks consist of genes, gene products
(RNAs, proteins), and the regulatory effect of the latter on the expression of other genes
5
Bolouri (2008), Computational Modeling of Gene Regulatory Networks, Imperial College Press
Brazhnik et al. (2002), Trends Biotechnol., 20(11):467-72
Gene regulatory networks cannot be reduced to direct interactions (transcription regulation), but also include indirect interactions (mediated by metabolism)

Indirect interactions can be derived from underlying system of biochemical reactions Time-scale hierarchies between metabolism and gene expression
allows model reduction using quasi-steady-state approximation
Gene regulatory networks
Baldazzi et al. (2010), PLoS Comput. Biol., 6(6):e1000812

Indirect interactions can be derived from underlying system of biochemical reactions Time-scale hierarchies between metabolism and gene expression
allows model reduction using quasi-steady-state approximation
Gene regulatory networks
Baldazzi et al. (2010), PLoS Comput. Biol., 6(6):e1000812
8
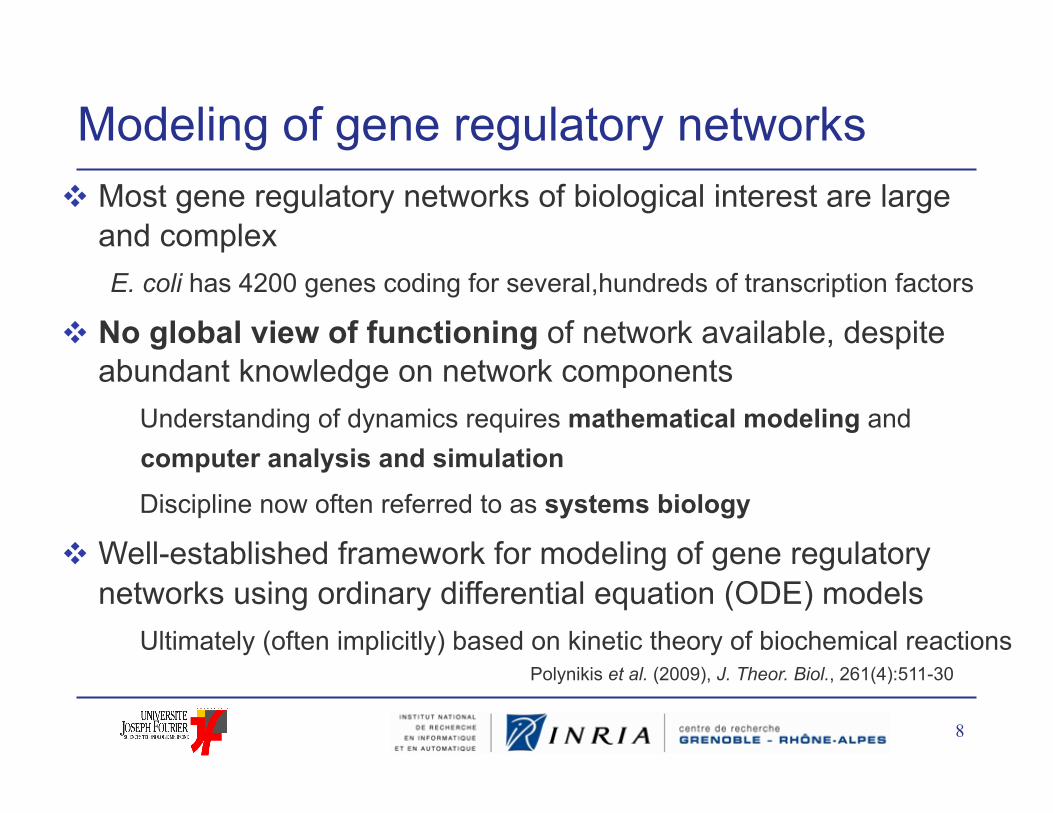
Modeling of gene regulatory networks Most gene regulatory networks of biological interest are large
and complex E. coli has 4200 genes coding for several,hundreds of transcription factors
No global view of functioning of network available, despite abundant knowledge on network components Understanding of dynamics requires mathematical modeling and
computer analysis and simulation
Discipline now often referred to as systems biology
Well-established framework for modeling of gene regulatory networks using ordinary differential equation (ODE) models Ultimately (often implicitly) based on kinetic theory of biochemical reactions
Polynikis et al. (2009), J. Theor. Biol., 261(4):511-30
9
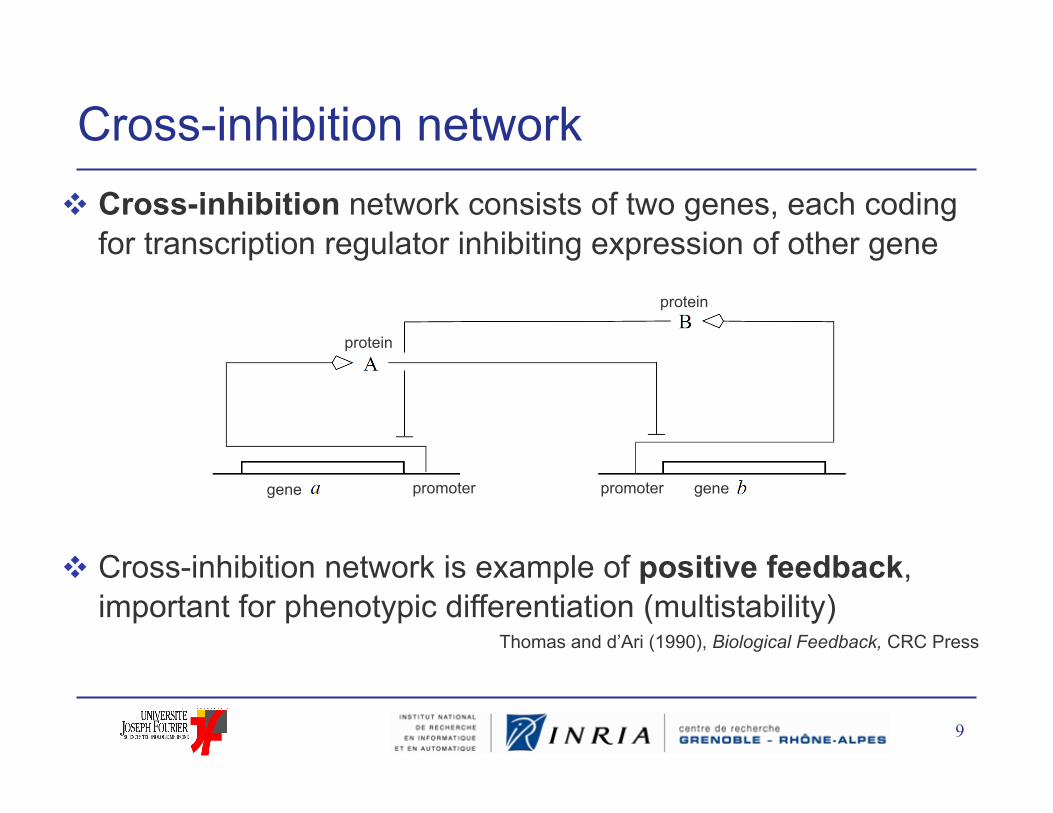
Cross-inhibition network consists of two genes, each coding for transcription regulator inhibiting expression of other gene
Cross-inhibition network is example of positive feedback, important for phenotypic differentiation (multistability)
Cross-inhibition network
Thomas and d’Ari (1990), Biological Feedback, CRC Press
gene
protein
promoter gene promoter
protein

10
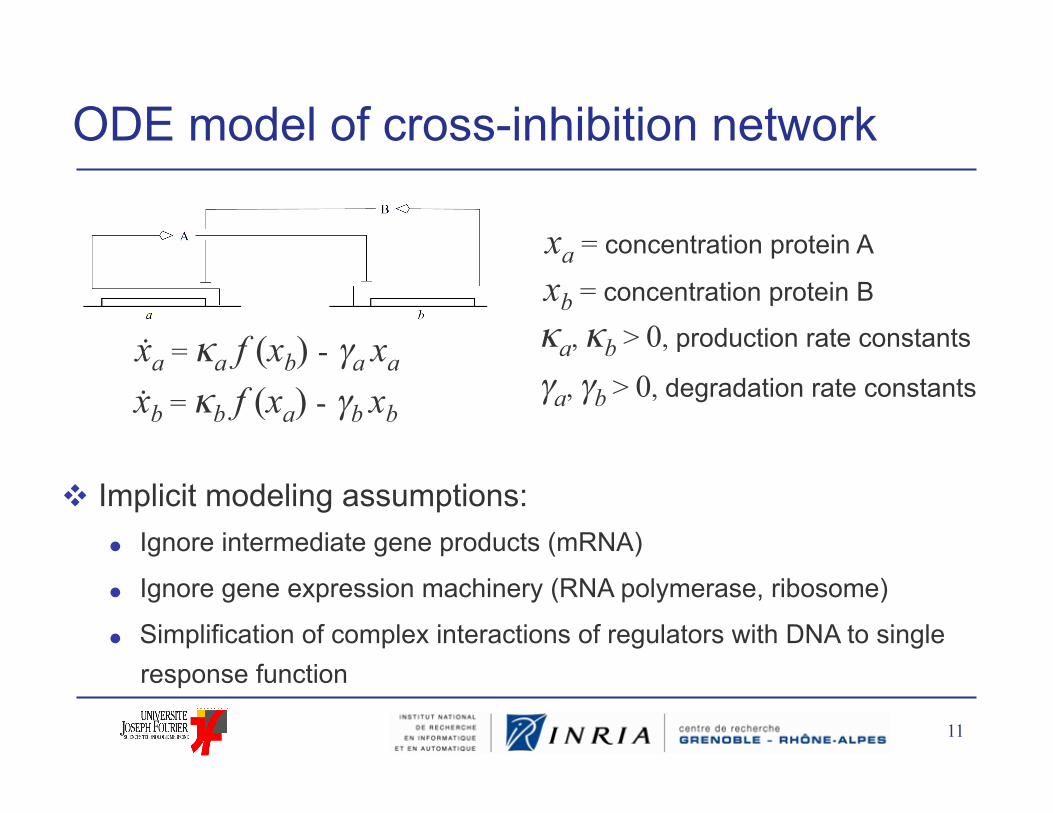
ODE model of cross-inhibition network
xa = concentration protein A
xb = concentration protein B
xa = κa f (xb) - γa xa
xb = κb f (xa) - γb xb
κa, κb > 0, production rate constants
γa, γb > 0, degradation rate constants
.
.
f (x) = , θ > 0 threshold θ n
θ n + x n
x
f (x )
θ 0
1
11
ODE model of cross-inhibition network
Implicit modeling assumptions: Ignore intermediate gene products (mRNA)
Ignore gene expression machinery (RNA polymerase, ribosome)
Simplification of complex interactions of regulators with DNA to single response function
xa = concentration protein A
xb = concentration protein B
xa = κa f (xb) - γa xa
xb = κb f (xa) - γb xb
κa, κb > 0, production rate constants
γa, γb > 0, degradation rate constants
.
.

12
Bistability of cross-inhibition network Analysis of steady states in phase plane
System is bistable: two stable and one unstable steady state. For almost all initial conditions, system will converge to one of
two stable steady states (differentiation) System returns to steady state after small perturbation
xb
xa
0
xb = 0 .
xa = 0 .
xa = 0 : xa = f (xb) κa γa
xb = 0 : xb = f (xa) κb γb
.
.

Hysteresis in cross-inhibition network Transient perturbation may cause irreversible switch from one
steady state to another (hysteresis) Modulation of regulatory effect of one of inhibitors (α)
Change in parameter causes saddle-note bifurcation
13
xb
xa
0
xb = 0 .
xa = 0 .
xa = κa f (αxb) - γa xa
xb = κb f (xa) - γb xb
.
.
xb
xa
0
xb = 0 .
xa = 0 .
α = 1 α = 0
14
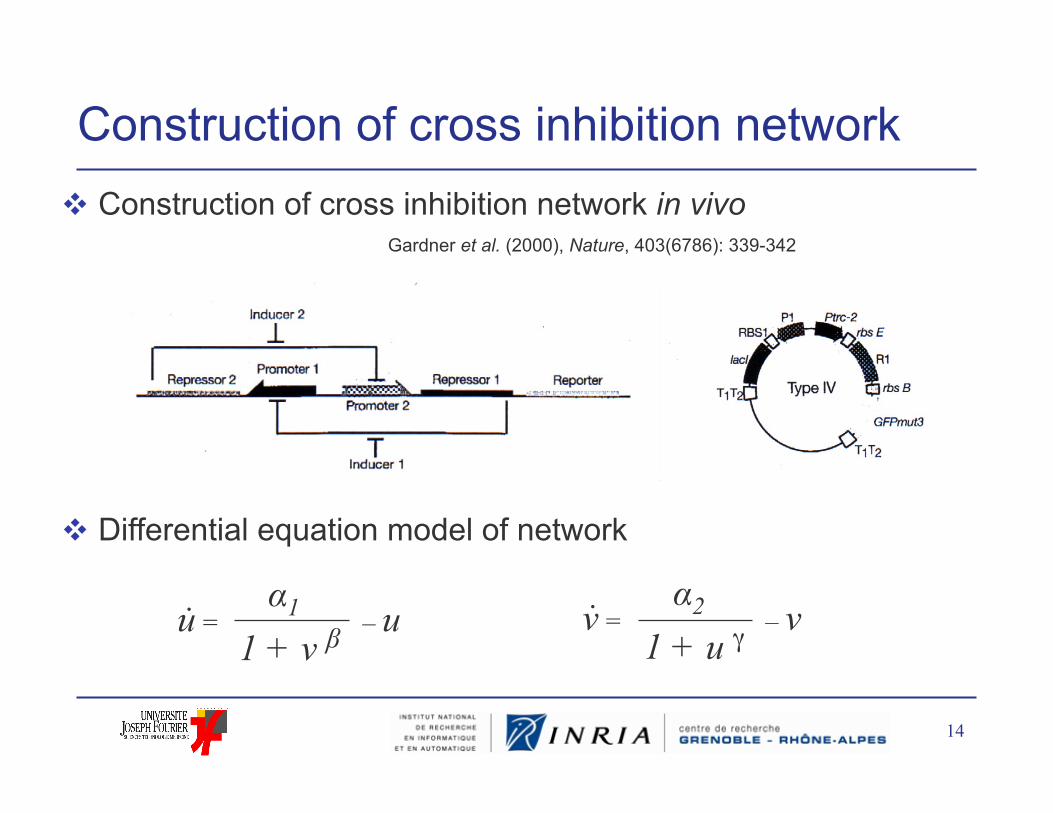
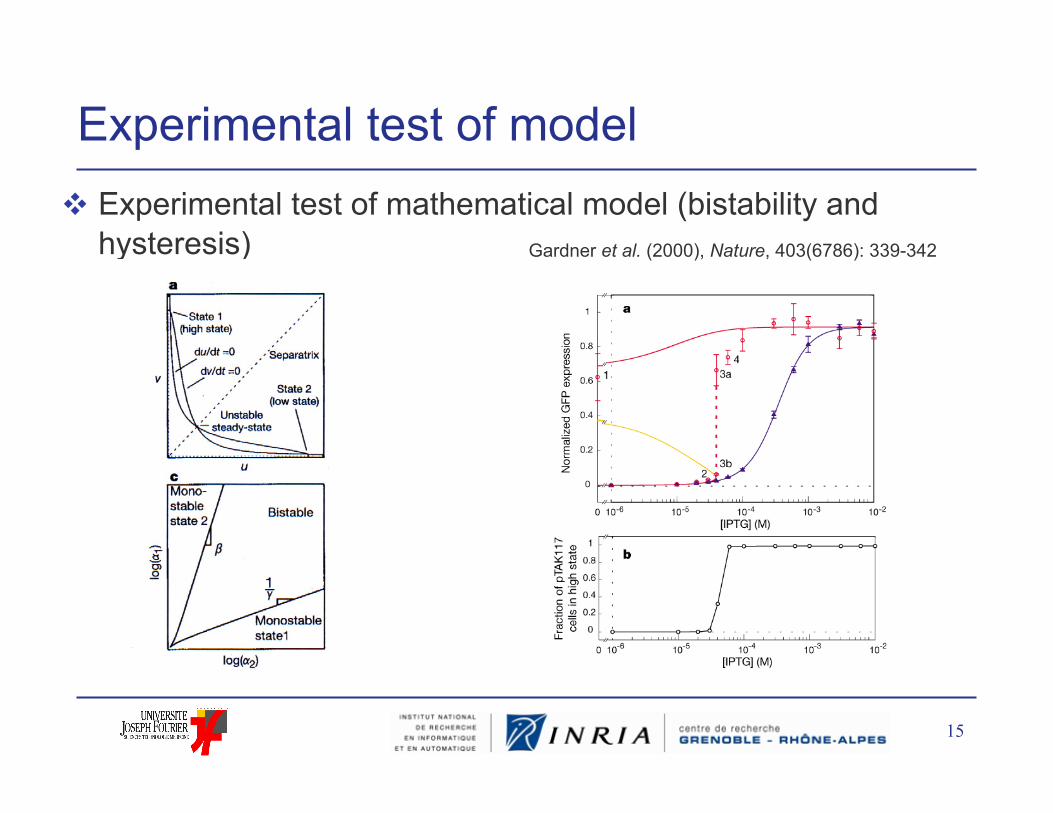
Construction of cross inhibition network Construction of cross inhibition network in vivo
Differential equation model of network
u = – u 1 + v β α1 v = – v
1 + u γ α2 . .
Gardner et al. (2000), Nature, 403(6786): 339-342
15
Experimental test of model Experimental test of mathematical model (bistability and
hysteresis) Gardner et al. (2000), Nature, 403(6786): 339-342

16
Bacteriophage λ infection of E. coli Response of E. coli to phage λ
infection involves decision between alternative developmental pathways: lysis and lysogeny
Ptashne, A Genetic Switch, Cell Press,1992

17
Bistability in phage λ

18
Control of phage λ fate decision Cross-inhibition motif plays key role in establishment of lysis or
lysogeny, as well as in induction of lysis after DNA damage
Santillán and Mackey (2004), Biophys. J., 86(1): 75-84

19
Simple model of phage λ fate decision Differential equation model of cross-inhibition feedback network
involved in phage λ fate decision mRNA and protein, delays, thermodynamic description of gene regulation
Santillán and Mackey (2004), Biophys. J., 86(1): 75-84

20
Analysis of phage λ model Bistability (lysis and lysogeny) only occurs for certain parameter
values Switch from lysogeny to lysis involves bifurcation between two
monostable regimes, due to change in degradation constant
Santillán and Mackey (2004), Biophys. J., 86(1): 75-84

21
Extended model of phage λ infection ODE model of the extended network underlying decision
between lysis and lysogeny Role of other regulatory proteins (CII, N, Q, …)
McAdams and Shapiro (1995), Science, 269(5524): 650-656
Recent experimental work downplays importance of mutual inhibition of CI and Cro in lysis-lysogeny decision
Oppenheim et al. (2005), Annu. Rev. Genet., 39:409–29

22
Simulation of phage λ infection Numerical simulation of promoter activity and protein
concentrations in (a) lysogenic and (b) lytic pathways
Cell follows one of two pathways after infection

Real-time monitoring of phage λ infection New measurement techniques allow real-time and in-vivo
monitoring of the execution of lytic and lysogenic pathways Use of fluorescent reporter genes in combination with automated plate
readers
23
Q
CII
Kobiler et al. (2005), Proc. Natl. Acad. Sci. USA, 102(12): 4470-5

24
Other examples of bistability Many other examples of bistability exist in bacteria
Lactose utilization in E. coli
Persister cells and antibiotic resistance in E. coli
Genetic competence in B. subtilis
…
Can we find general design principles, relating network structure to bistability and other properties of network dynamics?
Dubnau and Losick (2006), Mol. Microbiol., 61 (3):564–72
Alon (2007), An Introduction to Systems Biology, Chapmann&Hall/CRC

25
Necessary condition for bistability Necessary condition for bistability, or multistability, is the
occurrence of positive feedback loops in the regulatory network
Increasingly general mathematical proofs of necessary condition for bistability, or multistability, in regulatory networks Regulatory interactions (activation/inhibition) lead to non-zero signs
(+/-) in Jacobian matrix
Condition is not sufficient, as the actual occurrence of bistability depends on parameter values
Thomas and d’Ari (1990), Biological Feedback, CRC Press
+
+
+
!
!
Soulé(2003), ComPlexUs, 1:123-133

Stochasticity in gene expression ODE models make abstraction of underlying biochemical
reaction processes involved in gene expression that may not be warranted
Gene expression is stochastic instead of deterministic process
Stochasticity gives rise to fluctuations in gene products (noise)
Discrete number of molecules of reaction species, instead of continuous concentrations
Noise amplified by low number of molecules of each species
26
Kaern et al. (2005), Nat. Rev. Genet., 6(6):451-464
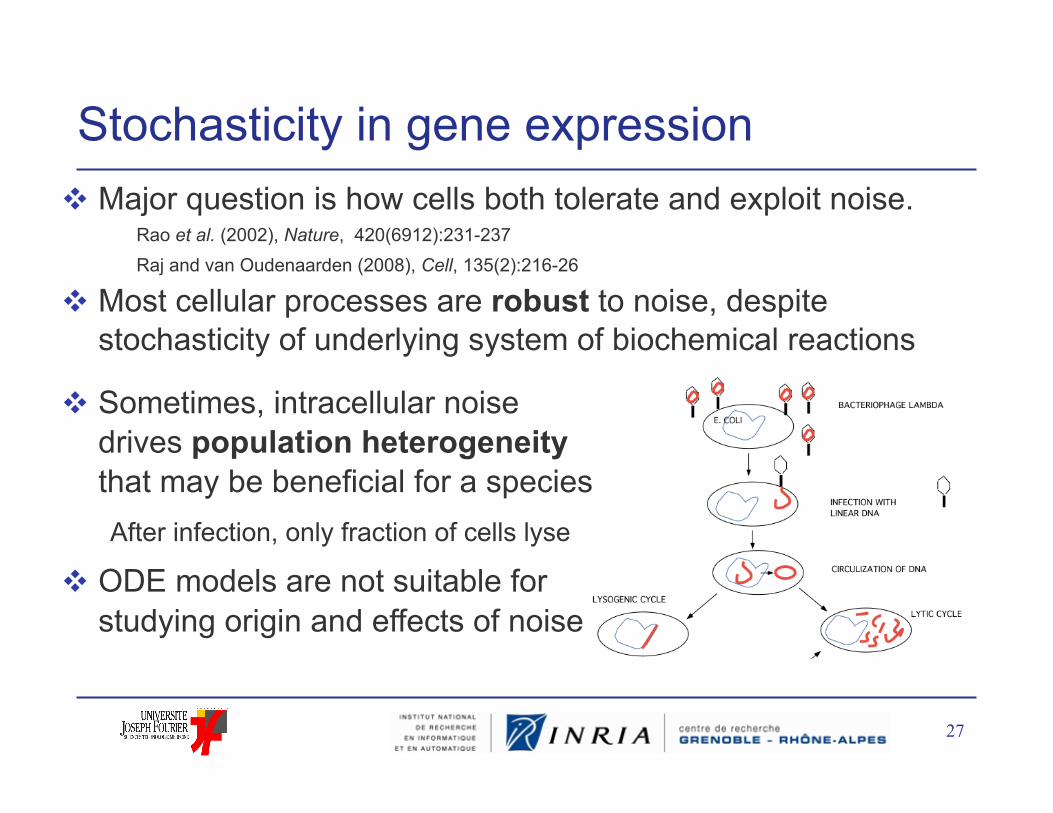
Major question is how cells both tolerate and exploit noise.
Most cellular processes are robust to noise, despite stochasticity of underlying system of biochemical reactions
Stochasticity in gene expression
27
Sometimes, intracellular noise drives population heterogeneity that may be beneficial for a species After infection, only fraction of cells lyse
ODE models are not suitable for studying origin and effects of noise
Rao et al. (2002), Nature, 420(6912):231-237 Raj and van Oudenaarden (2008), Cell, 135(2):216-26

Stochastic models of gene expression Stochastic master equation describes dynamics of
biochemical reaction system
Number of molecules of each species i at time-point t described by discrete variable Xi(t) ∈ N
p[Xi(t)=Vi] describes probability that at time t there are Vi molecules of species i
m is the number of different reactions
αj and βj are constants defined in terms of reaction constants and number of reactant molecules
28
dp[X(t)=V] / dt = ∑ p[X(t)=V-ν j] βj - p[X(t)=V] αj j = 1
m
Van Kampen (1997), Stochastic Processes in Physics and Chemistry, Elsevier

Stochastic simulation Analytical solution of master equations is not possible in most
situations of practical interest
Stochastic simulation predicts sequences of reactions that change state of system, starting from initial state X(0) = V0 Two different runs from identicial initial state may lead to different final
states
Repeating stochastic simulation many times yields approximation of probability distribution p(X (t )=V), and thus solution of stochastic master equation
29
Gillespie (2007), Annu. Rev. Phys. Chem., 58:35-55
Gillespie (2002), J. Phys. Chem., 81(25): 2340-61

30
Stochastic modeling of phage λ infection Stochastic model of λ lysis-lysogeny decision network
Arkin et al. (1998), Genetics, 149(4): 1633-48
31
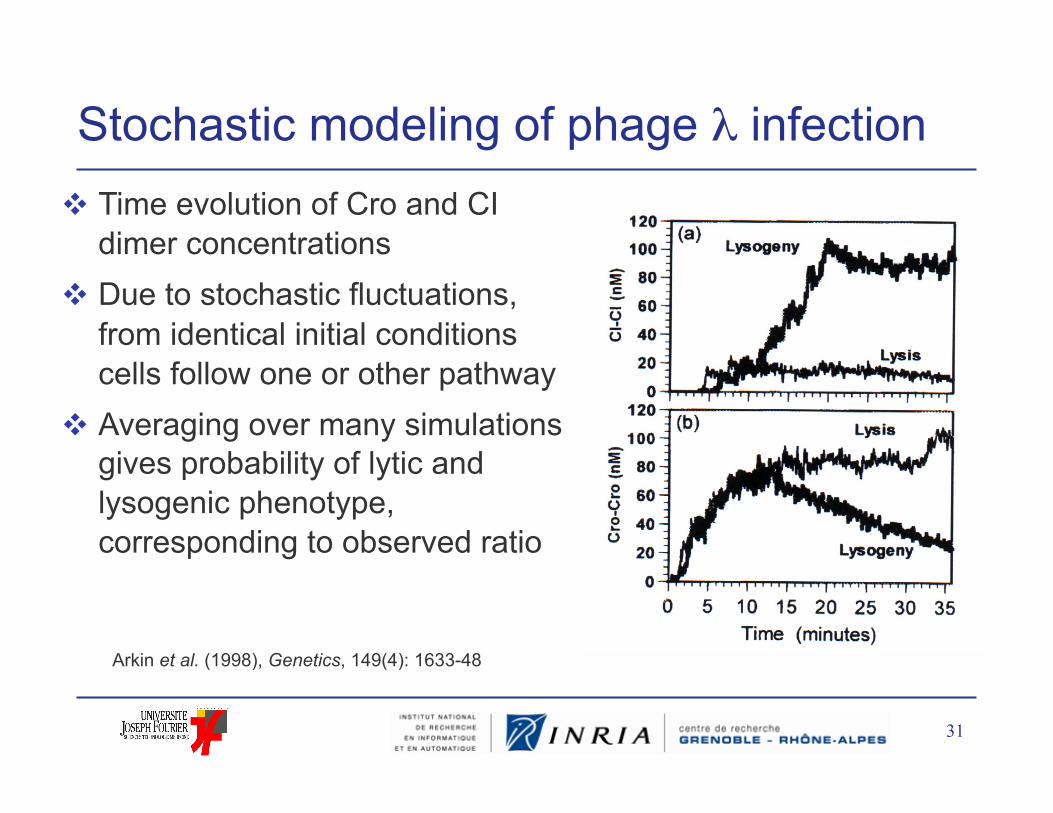
Stochastic modeling of phage λ infection Time evolution of Cro and CI
dimer concentrations Due to stochastic fluctuations,
from identical initial conditions cells follow one or other pathway
Averaging over many simulations gives probability of lytic and lysogenic phenotype, corresponding to observed ratio
Arkin et al. (1998), Genetics, 149(4): 1633-48

32
Measurements of phage λ infection New measurement techniques allow real-time and in-vivo
monitoring of the execution of lytic and lysogenic pathways in individual cells Use of reporter genes in combination with fluorescence microscopy
Amir et al. (2007), Mol. Syst. Biol., 3:71
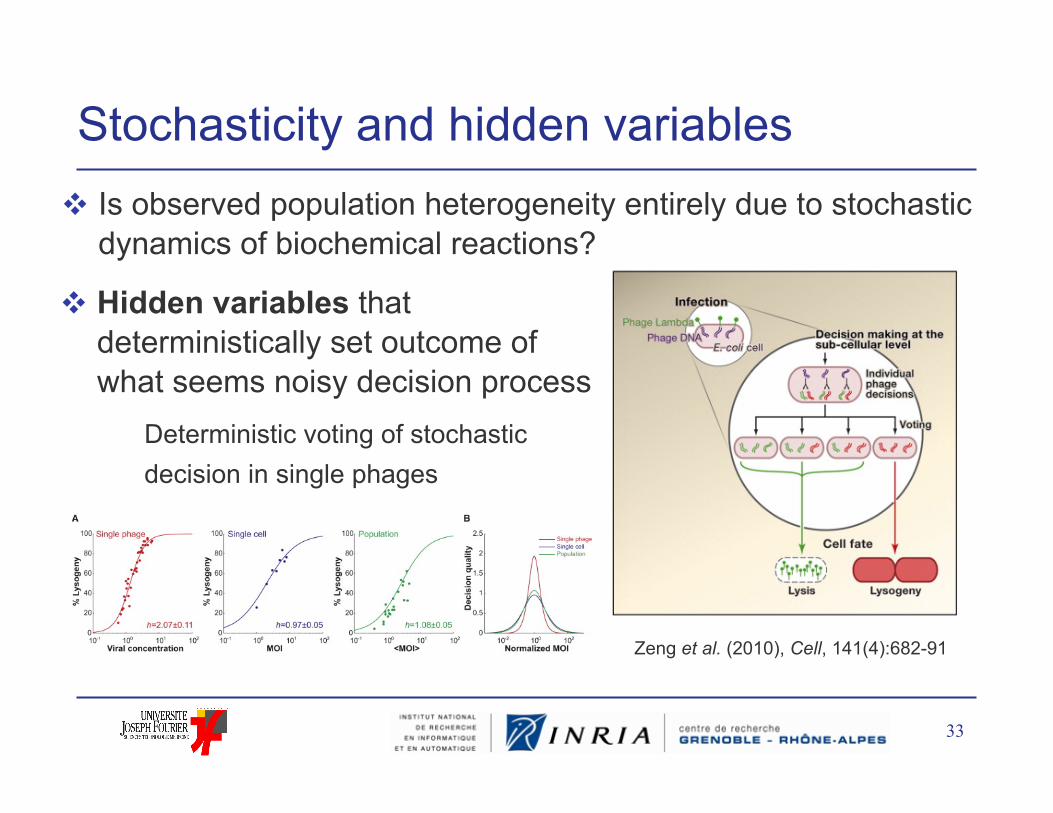
Stochasticity and hidden variables Is observed population heterogeneity entirely due to stochastic
dynamics of biochemical reactions?
33
Zeng et al. (2010), Cell, 141(4):682-91
Hidden variables that deterministically set outcome of what seems noisy decision process Deterministic voting of stochastic
decision in single phages
Conclusions Gene regulatory networks control changes in gene expression
levels in response to environmental perturbations Dynamic properties of bacterial regulatory networks can be
studied by means of mathematical models Deterministic and stochastic models capture different aspects of network
functioning
Dynamic properties can be related to structure of regulatory interactions in network Positive feedback and multistability, negative feedback and oscillations
Networks both tolerate and exploit noise due to stochasticity of underlying biochemical reaction systems Relation between feedback structure and noise amplification/attenuation?
34

Some challenges for modelers Upscaling of analysis to large networks of dozens or even
hundreds of genes, proteins, metabolites, … Model reduction, qualitative models, and formal verification tools
System identification and parameter estimation New measurement techniques yield higher-quality data, but still noisy,
sparse, heterogeneous
Large models on different time-scales, with many unobserved variables
Systematic design of experimental perturbations for identification and control
35


