138

WHAT IS NAEP? The National Assessment of Educational Progress (NAEP) is a continuing and nationally representative measure of trends in academic achievement of U.S. elementary and secondary students in various subjects. For nearly four decades, NAEP assessments have been conducted periodically in reading, mathematics, science, writing, U.S. his-tory, civics, geography, and other subjects. By collecting and reporting information on student performance at the national, state, and local levels, NAEP is an integral part of our nation's evaluation of the condition and progress of education.
THE 2007–2008 NATIONAL ASSESSMENT GOVERNING BOARD The National Assessment Governing Board was created by Congress to formulate policy for NAEP. Among the Governing Board’s responsibilities are developing objectives and test specifications and designing the assessment methodology for NAEP.
MembersDarvin M. Winick, Chair PresidentWinick & AssociatesAustin, Texas Amanda P. Avallone, Vice Chair Assist. Principal & 8th Grade TeacherSummit Middle School Boulder, Colorado Francie Alexander Chief Acad. Officer, Scholastic, Inc. Senior Vice Pres., Scholastic Educ. New York, New York David J. Alukonis ChairmanHudson School BoardHudson, New Hampshire Gregory CizekProfessor of Educ. MeasurementUniversity of North CarolinaChapel Hill, North Carolina Honorable David P. Driscoll Former Commissioner of EducationCommonwealth of Massachusetts Malden, Massachusetts Louis FabrizioDirectorDivision of Accountability ServicesNC Dept. of Public InstructionRaleigh, North Carolina Alan J. Friedman ConsultantMuseum Development and Science CommunicationNew York, New York
David W. Gordon Sacramento County Superintendent of SchoolsSacramento County Office of Education Sacramento, California Robin C. Hall Principal Beecher Hills Elem. SchoolAtlanta, Georgia Kathi M. King 12th Grade TeacherMessalonskee High SchoolOakland, Maine Honorable Keith King Former MemberColorado House of Representatives Colorado Springs, Colorado Kim Kozbial-Hess 4th Grade TeacherHawkins Elem. SchoolToledo, Ohio Henry Kranendonk Mathematics Curriculum SpecialistMilwaukee Public SchoolsMilwaukee, Wisconsin James S. Lanich President California Business for Educational ExcellenceSacramento, California Honorable Cynthia Nava Chair, Education Committee New Mexico State Senate Las Cruces, New Mexico
Honorable Steven L. Paine State Superintendent of Schools WV Department of Education Charleston, West Virginia Susan Pimentel Educational ConsultantHanover, New Hampshire Andrew C. Porter Dean, University of PennsylvaniaGraduate School of EducationPhiladelphia, Pennsylvania Honorable Kathleen Sebelius GovernorTopeka, Kansas Warren T. Smith, Sr. Vice PresidentWashington State Board of EducationOlympia, Washington Mary Frances Taymans, SND Executive DirectorSecondary Schools Dept.National Catholic Educ. AssociationWashington, DC Oscar A. TroncosoPrincipalAnthony High SchoolAnthony Independent School DistrictAnthony, Texas Ex-officio MemberGrover (Russ) Whitehurst Director Institute of Education SciencesU.S. Department of EducationWashington, DC


National Assessment Governing Board
Darvin M. Winick Chair
Amanda P. AvalloneVice Chair
Charles E. Smith Executive Director
Mary Crovo Project Officer
NAEP Mathematics ProjectWayne Martin
Project DirectorJohn Olson
Deputy Project DirectorLinda Wilson
Consensus CoordinatorFramework Author
Developed for the National Assessment Governing Board under contract number ED–00–CO–0115 by the Council of Chief State School Officers, with subcontracts to the Council of Basic Education and the Association of State Supervisors of Mathematics and
Grade 12 preparedness objectives developed under contract with Achieve, Inc.
For further information, contact:National Assessment Governing Board
800 North Capitol Street, N.W.Suite 825
Washington, DC 20002–4233www.nagb.org
September 2008
Superintendent of Documents, Mail Stop: SSOP, Washington, DC 20402-0328

TABLE OF CONTENTSList of Exhibits........................................................................................................................ iiAcknowledgments.................................................................................................................. iiiNAEP Mathematics Project Staff and Committees.............................................................vChapter One: Overview......................................................................................................... 1
What Is an Assessment Framework?................................................................................2Need for a New Framework at Grade 12..........................................................................2
Chapter Two: Framework for the Assessment.....................................................................5Content Areas................................................................................................................... 5Item Distribution............................................................................................................... 62009 NAEP Mathematics Objectives Organization..........................................................7Mathematical Content Areas............................................................................................7
Chapter Three: Mathematical Complexity of Items..........................................................37Low Complexity............................................................................................................. 38Moderate Complexity..................................................................................................... 42High Complexity............................................................................................................ 46
Chapter Four: Item Formats...............................................................................................51Multiple-Choice Items.................................................................................................... 51Short Constructed-Response Items.................................................................................52Extended Constructed-Response Items...........................................................................55Scoring Constructed-Response Items.............................................................................57
Chapter Five: Design of Test and Items..............................................................................59Balance of Content......................................................................................................... 59Balance of Mathematical Complexity............................................................................60Balance of Item Formats................................................................................................. 60Balance of Item Contexts................................................................................................ 61Sampling......................................................................................................................... 62Calculators...................................................................................................................... 63Manipulatives and Tools................................................................................................. 65Accessibility................................................................................................................... 66Item Families.................................................................................................................. 67
Bibliography.......................................................................................................................... 69Appendix A: NAEP Mathematics Achievement Level Descriptions.................................71
NAEP Mathematics Achievement Levels—Grade 4......................................................71NAEP Mathematics Achievement Levels—Grade 8......................................................72NAEP Mathematics Achievement Levels—Grade 12....................................................73

LIST OF EXHIBITS
Exhibit 1. Comparison of 2005 and 2009 Mathematics Frameworks.................................3Exhibit 2. Percentage distribution of items by grade and content area...............................6Exhibit 3. Number properties and operations......................................................................9Exhibit 4. Measurement.....................................................................................................14Exhibit 5. Geometry...........................................................................................................19Exhibit 6. Data analysis, statistics, and probability...........................................................25Exhibit 7. Algebra..............................................................................................................31Exhibit 8. Percent of testing time at each level of complexity..........................................38Exhibit 9. Percent of testing time by item formats............................................................51Exhibit 10. Percent distribution of items by grade and content area.................................59Exhibit 11. Percent of testing time at each level of complexity........................................60Exhibit 12. Percent of testing time by item formats..........................................................60
ii

ACKNOWLEDGMENTS
The following people were the primary authors of the introductions to the content areas:
Roger Howe, Yale University (Number Properties and Operations, Geometry, and Algebra)
Richard Scheaffer, University of Florida (Data Analysis and Probability)
Mary Lindquist, Columbus State University (Measurement)
iii

NAEP MATHEMATICS PROJECT STAFF AND COMMITTEES
MEMBERS OF THE BOARD’S GRADE 12 MATHEMATICS PANEL
Herbert ClemensProfessor, Department of MathematicsOhio State UniversityColumbus, OH
Mary Ann HuntleyAssistant Professor, MathematicsDepartment of Mathematical SciencesUniversity of DelawareNewark, DE
Jeremy KilpatrickRegents ProfessorUniversity of GeorgiaAthens, GA
Mary LindquistFuller E. Callaway Professor, EmeritusColumbus State UniversityLewisburg, WV
Mary Jo MessengerChair, Department of Mathematics (retired)River Hill High SchoolClarksville, MD
William SchmidtUniversity Distinguished ProfessorMichigan State UniversityEast Lansing, MI
Sharif ShakraniDirector, Education Policy Research CenterMichigan State UniversityEast Lansing, MI
Linda Dager Wilson, ChairMathematics ConsultantWashington, DC
NAEP GRADE 12 MATHEMATICS PROJECT ACHIEVE NAEP GRADE 12 MATHEMATICS PANEL
Sue EddinsMathematics Teacher (retired)Illinois Mathematics and Science AcademyAurora, IL
William McCallumUniversity Distinguished Professor of MathematicsDepartment of MathematicsUniversity of ArizonaTucson, AZ
Fabio MilnerProfessor of MathematicsPurdue UniversityWest Lafayette, IN William SchmidtUniversity Distinguished ProfessorMichigan State UniversityEast Lansing, MI
v

Lynn SteenProfessor of MathematicsSt. Olaf CollegeNorthfield, MN
Norman WebbSenior Research ScientistWisconsin Center for Education ResearchUniversity of WisconsinMadison, WI
REVIEWS RECEIVED ON THE DRAFT OF NAEP 12TH GRADE MATHEMATICS OBJECTIVES
Achieve, Inc.American Mathematical SocietyAssociation of State Supervisors of
MathematicsThomas B. Fordham InstituteState Mathematics Supervisors from
various statesNational Council of Teachers of
MathematicsState Testing Directors from various
states
2009 NAEP MATHEMATICS SPECIFICATIONS WORK GROUP
Mary LindquistFuller E. Callaway Professor, EmeritusColumbus State UniversityLewisburg, WV
Mary Jo MessengerChair, Department of Mathematics (retired)River Hill High SchoolClarksville, MD
Linda Dager Wilson, ChairMathematics ConsultantWashington, DCPhoebe Winter
Project DirectorState Education Assessment CenterCouncil of Chief State School OfficersRichmond, VA
2005 NAEP MATHEMATICS PROJECT STEERING COMMITTEE
Eileen Ahearn Project DirectorNational Association of State Directors of Special EducationAlexandria, VA
Charles AllanMathematics Education ConsultantMichigan Department of EducationLansing, MI
B. Marie ByersNational School Boards AssociationHagerstown, MD
Randy DeHoffColorado State Board of Education6th Congressional District–LittletonDenver, CO
M.B. “Sonny” DonaldsonSuperintendentAldine ISDHouston, TX
Janice EarleSenior Program DirectorNational Science FoundationArlington, VA
Lou FabrizioDirectorDivision of Accountability ServicesNorth Carolina Department of Public In-structionRaleigh, NCBettye ForteMathematics Consultant
vi

Arlington, TX
Matt GandalVice PresidentAchieve, Inc.Washington, DC
Alice GillAssociate DirectorEducational IssuesAmerican Federation of TeachersWashington, DC
M. Kathleen HeidThe Pennsylvania State UniversityUniversity Park, PA
Audrey JacksonAssistant PrincipalClaymont Elementary SchoolParkway City SchoolsFenton, MO
James M. LandwehrDirectorData Analysis Research DepartmentAvaya LabsBasking Ridge, NJ
Sharon LewisResearch DirectorCouncil of the Great City SchoolsWashington, DC
Dane LinnPolicy Studies DirectorNational Governors’ AssociationWashington, DC
Eddie LuceroPrincipalGriegos Elementary SchoolAlbuquerque, NMLee McCaskillPrincipalBrooklyn Technical High School
Brooklyn, NY
Barbara MontaltoAssistant Director of MathematicsTexas Education AgencyAustin, TX
Judy RohdeMathematics InstructorJohn Glenn Middle SchoolMaplewood, MN
Wilfried Schmid Professor of MathematicsHarvard Department of MathematicsCambridge, MA
Sr. Mary Frances Taymans Associate Executive DirectorSecondary Schools DepartmentNational Catholic Education AssociationWashington, DC
Zalman UsiskinProfessor of EducationDirector, University of Chicago School Mathematics ProjectChicago, IL
Judy WalterAssociation for Supervision & Curriculum DevelopmentAlexandria, VA
Diana WearneAssociate ProfessorSchool of EducationUniversity of DelawareNewark, DE
vii

Hung-Hsi WuProfessor of MathematicsDepartment of MathematicsUniversity of California–BerkeleyBerkeley, CA
2005 NAEP MATHEMATICS PROJECT PLANNING COMMITTEE
Dayo AkinsheyeMathematics Resource TeacherSeaton Elementary SchoolWashington, DC
Geri Anderson-NielsenMathematics SpecialistGeorgetown Day SchoolWashington, DC
Cindy ChapmanElementary TeacherAlbuquerque Public SchoolsAlbuquerque, NM
Herbert ClemensProfessor of MathematicsDepartment of MathematicsUniversity of UtahSalt Lake City, UT
Carl CowenProfessor of MathematicsPurdue UniversityWest Lafayette, IN
Jim EllingsonAssistant ProfessorConcordia CollegeMoorhead, MN
Joan Ferrini-MundyAssociate Dean/Director of Science and MathematicsCollege of Natural ScienceMichigan State UniversityEast Lansing, MI
Kim GattisEducation Program ConsultantKansas Department of EducationAssociation of State Supervisors of MathematicsTopeka, KS
Anne GonzalesMiddle School Mathematics TeacherSouth Gate Middle SchoolSouth Gate, CA
Jeremy KilpatrickProfessor of Mathematics EducationUniversity of GeorgiaAthens, GA
Gerald KulmCurtis D. Robert Professor of Mathematics EducationTexas A & M UniversityCollege Station, TX
Mary LindquistFuller E. Callaway Professor of Mathematics EducationColumbus State UniversityColumbus, GA
Mary Jo MessengerChair, Department of MathematicsRiver Hill High SchoolClarksville, MD
viii

Marjorie PetitSenior AssociateNational Center for the Improvement of Educational Assessment(The Center for Assessment)Portsmouth, NH
Edward SilverProfessorSchool of EducationUniversity of MichiganAnn Arbor, MI
Debra VitaleMathematics SpecialistArlington Public SchoolsFairfax, VA
Frank WangPresident/CEOSaxon Publishing, Inc.Norman, OK
Norman WebbSenior Research ScientistWisconsin Center for Education ResearchMadison, WI
John WisthoffMember, Maryland State Board of Education and Mathematics ProfessorAnne Arundel Community CollegePasadena, MD
2005 NAEP MATHEMATICS PROJECT TECHNICAL ADVISORY PANEL
Fen ChouPsychometricianLouisiana Department of EducationBaton Rouge, LA
Eugene JohnsonChief PsychometricianAmerican Institutes for ResearchWashington, DC
Edward KiferProfessor and ChairpersonDepartment of Educational Policy Studies and EvaluationCollege of Education University of KentuckyLexington, KY
Ina MullisCo-DirectorInternational Study CenterBoston CollegeChestnut Hill, MA
Barbara PlakeDirectorBuros Center for TestingUniversity of Nebraska–LincolnLincoln, NE
Roger TrentOhio State Assessment Director (Emeritus)Ohio Department of EducationColumbus, OH
CCSSO STAFF
Rolf BlankDirector of Indicators ProjectState Education Assessment CenterCouncil of Chief State School OfficersWashington, DC
Wayne MartinDirectorState Education Assessment CenterCouncil of Chief State School OfficersWashington, DC
ix

John OlsonDirector of AssessmentState Education Assessment Center Council of Chief State School OfficersWashington, DC
Frank PhilipSenior Project AssociateState Education Assessment CenterCouncil of Chief State School OfficersWashington, DC
Linda Dager WilsonConsensus Coordinator ConsultantCouncil of Chief State School OfficersWashington, DC
Phoebe WinterProject DirectorState Education Assessment CenterCouncil of Chief State School OfficersRichmond, VA
SUBCONTRACTORS AND CONSULTANTS
Patricia KenneySenior Research AssociateUniversity of MichiganAnn Arbor, MI
Rebecca KoprivaDirectorCenter for the Study of Assessment Validity in EducationDepartment of Measurement & StatisticsUniversity of Maryland College Park, MD
Christopher CrossPresident (Former)Council for Basic EducationWashington, DC
Kim GattisPresident, Association of State Supervisors of MathematicsEducation Program Consultant, Kansas Department of EducationTopeka, KS
Linda PlattnerDirector of Policy, Standards & InstructionCouncil for Basic EducationWashington, DC
x

COMMITTEE REPRESENTATION
Policy Organizations
Achieve, Inc.American Association of School Administrators (AASA)American Federation of Teachers (AFT)American Mathematical Society (AMA)American Statistical Association (ASA)Association for Supervision and Curriculum Development (ASCD)Association of State Assessment Programs (ASAP)Association of State Supervisors of Mathematics (ASSM)Business Roundtable/National Alliance of BusinessCouncil of the Great City SchoolsEducation Leaders Council (ELC)National Association of Elementary School Principals (NAESP)National Association of Secondary School Principals (NASSP)National Association of State Boards of Education (NASBE)National Association of State Directors of Special Education (NASDE)National Catholic Education Association (NCEA)National Education Association (NEA)National Governors’ Association (NGA)National Science Foundation (NSF)National School Boards Association (NSBA)Representative from national textbook publisher
Mathematical Associations and Groups
Mathematically CorrectMathematics Association of America (MAA)National Council of Teachers of Mathematics (NCTM)Third International Mathematics and Science Study (TIMSS)
Educators
Classroom mathematics teachers from public and non-public schools PrincipalsDistrict and state mathematics specialistsMathematics and mathematics education professors from public and private universities, colleges, and community colleges
Technical Experts
University professorsState testing specialistsRepresentatives from private research organizations
xi

CHAPTER ONEOVERVIEW
Since 1973, the National Assessment of Educational Progress (NAEP) has gathered infor-mation about student achievement in mathematics. Results of these periodic assessments, produced in print and Web-based formats, provide valuable information to a wide variety of audiences. They inform citizens about the nature of students’ comprehension of the subject, curriculum specialists about the level and nature of student achievement, and pol-icymakers about factors related to schooling and its relationship to student proficiency in mathematics.
The NAEP assessment in mathematics has two components that differ in purpose. One assessment measures long-term trends in achievement among 9-, 13-, and 17-year-old students by using the same basic design each time. This unique measure allows for com-parisons of students’ knowledge of mathematics since it was first administered in 1973. The main NAEP assessment is administered at the national, state, and selected urban dis-trict levels. Results are reported on student achievement in grades 4, 8, and 12 at the na-tional level and for grades 4 and 8 at the state and for large urban districts that volun-teered to participate. The main NAEP assessment is based on a framework (such as this one) that can be updated periodically. The 2009 Mathematics Framework only reflects changes in grade 12 from 2005; mathematics content objectives for grades 4 and 8 have not changed. Therefore, main NAEP trendlines from the early 1990s can continue at fourth and eighth grades for the 2009 assessment.
Taken together, the NAEP assessments provide a rich, broad, and deep picture of student mathematics achievement in the United States. Results are reported in terms of scale scores and percentiles. These reports provide comprehensive information about what stu-dents in the United States know and can do in the area of mathematics. They present in-formation on strengths and weaknesses in students’ knowledge of mathematics and their ability to apply that knowledge in problem-solving situations. In addition, they provide comparative student data according to gender, race/ethnicity, socioeconomic status, and geographic region; describe trends in student performance over time; and report on rela-tionships between student proficiency and certain background variables.
Student results on the main NAEP assessment are reported with respect to three achieve-ment levels (Basic, Proficient, and Advanced) as described below:
Basic denotes partial mastery of prerequisite knowledge and skills that are fundamental for proficient work at each grade.
Proficient represents solid academic performance for each grade assessed. Students reaching this level have demonstrated competency over challenging sub-ject matter, including subject-matter knowledge, application of such knowledge to real-world situations, and appropriate analytical skills.
1

Advanced represents superior performance.
These levels are intended to provide descriptions of what students should know and be able to do in mathematics. Established for the 1992 mathematics scale through a broadly inclusive process and adopted by the National Assessment Governing Board, the three levels per grade are the primary means of reporting NAEP data. The updated mathemat-ics framework was developed with these levels in mind to ensure congruence between the levels and the test content. See appendix A for the NAEP Mathematics Achievement Level Descriptions.
WHAT IS AN ASSESSMENT FRAMEWORK?
An assessment framework is like a blueprint. It lays out the basic design of the assess-ment by describing the mathematics content that should be tested and the types of assess-ment questions that should be included. It also describes how the various design factors should be balanced across the assessment. A companion document to this framework, As-sessment and Item Specifications for the 2009 NAEP Mathematics Assessment, gives more detail about development of the items and conditions for the 2009 NAEP mathe-matics assessment.
This is an assessment framework, not a curriculum framework. In broad terms, this framework attempts to answer the question: What mathematics skills should be assessed in 2009 on NAEP at grades 4, 8, and 12? The answer to this question must necessarily take into account the constraints of a large-scale assessment such as NAEP with its limi-tations on time and resources. Of critical importance is the fact that this document does not attempt to answer the question: What (or how) mathematics should be taught? The framework was developed with the understanding that some concepts, skills, and activi-ties in school mathematics are not suitable to be assessed on NAEP, although they may well be important components of a school curriculum. Examples would be an extended project that involves gathering data or a group project.
This framework describes a design for the main NAEP assessments at the national, state, and district levels, but it is not the framework for the long-term trend NAEP assessment described earlier.
NEED FOR A NEW FRAMEWORK AT GRADE 12For several years, the Governing Board has focused special attention on ways to improve the assessment of 12th graders by NAEP. The goal for this 12th-grade initiative is to en-able NAEP to report on how well prepared 12th-grade students are for postsecondary ed-ucation and training. To accomplish this goal, the content of the assessments as described in the 2005 mathematics framework was analyzed and revisions considered. The chal-lenge was to find the essential mathematics that can form the foundation for these post-secondary paths. These should include use of quantitative tools, broad competence in mathematical reasoning, mathematics required for postsecondary courses, and the ability
2

to integrate and apply mathematics in diverse problem-solving contexts. Analysis of the 2005 framework revealed that some revisions would be necessary to meet this challenge.
FRAMEWORK DEVELOPMENT PROCESS
To implement this change at the 12th grade, the Governing Board contracted with Achieve, Inc., to examine NAEP’s mathematics assessment framework in relation to benchmarks set by the American Diploma Project. An Achieve panel of mathematicians, mathematics educators, and policymakers proposed increasing the scope and rigor of 12th-grade NAEP. Achieve developed new assessment objectives, and a panel of mathe-maticians and mathematics educators (including classroom teachers) reviewed and re-vised the objectives and matched them against the current set of objectives for grades 4 and 8. The panel conducted focus groups with the Association of State Supervisors of Mathematics and survey reviews with various NAEP constituents, using repeated rounds of reviews. The Governing Board approved the final set of grade 12 objectives in August 2006.
CHANGES FROM 2005 FRAMEWORK
The exhibit below compares the 2009 and 2005 mathematics frameworks.
Exhibit 1. Comparison of 2005 and 2009 Mathematics FrameworksMathematics content Objectives for grades 4 and 8 remain the same
New subtopic of “mathematical reasoning” at grades 4, 8, and 12
Distribution of items for each content area at all grades remains the same
New objectives for grade 12Mathematical complexity
New clarifications and new examples to describe levels of mathematical complexity
Calculator policy Remains the sameItem formats Remains the sameTools and manipulatives
Remains the same
3

CONCLUSION AND PREVIEW OF FRAMEWORK
The bullets below summarize each chapter in the NAEP Mathematics Framework for 2009:
Mathematics content. Chapter two contains descriptions of the five major con-tent areas of mathematics (Number Properties and Operations; Measurement; Ge-ometry; Data Analysis, Statistics and Probability; and Algebra) and specific ob-jectives for grades 4, 8 and 12.
Mathematical complexity. Each NAEP mathematics test item is designed to measure a specific level of thinking (called the mathematical complexity of the item). Chapter three describes the three levels and offers examples of each.
Item formats. NAEP mathematics test items are written in one of three formats: multiple choice, short constructed response, or extended constructed response. Chapter four describes each of these formats and gives examples.
Assessment design. Each form of the NAEP mathematics assessment must be balanced according to a number of different factors, including content, level of complexity, and format. Chapter five describes the guidelines for balancing each factor. This chapter also addresses other issues of design such as sampling, use of calculators, tools and manipulatives, and accessibility for all students.
A valuable resource for learning more about NAEP can be found on the Internet at http://nces.ed.gov/nationsreportcard/. This site contains reports describing results of re-cent assessments and a searchable tool for viewing released items. Items can be searched by many different features such as grade level and content area. Information about the items includes student performance and any applicable scoring rubrics. NAEP-released items used as examples in this document are marked with a designation that matches the item name in the NAEP Sample Question Tool, which can be found on the website.
4
CHAPTER TWOFRAMEWORK FOR THE ASSESSMENT
This chapter presents content areas, distribution of items by content, a description of the matrix format, and a detailed description of each content area followed by the specific objectives of the mathematics framework for that area.
CONTENT AREAS
Since its first mathematics assessments in the early 1970s and early 1980s, NAEP has regularly gathered data on students’ understanding of mathematical content. Although the names of the content areas in the frameworks and some of the topics in those areas may change somewhat from one assessment to the next, a consistent focus toward collecting information on student performance in five key areas remains. The framework for the 2009 Mathematics Assessment is anchored in these same five broad areas of mathemati-cal content:
Number Properties and Operations (including computation and understanding of number concepts)
Measurement (including use of instruments, application of processes, and con-cepts of area and volume)
Geometry (including spatial reasoning and applying geometric properties) Data Analysis, Statistics, and Probability (including graphical displays and
statistics) Algebra (including representations and relationships)
These divisions are not intended to separate mathematics into discrete elements. Rather, they are intended to provide a helpful classification scheme that describes the full spec-trum of mathematical content assessed by NAEP. Classification of items into one primary content area is not always clearcut, but it helps ensure that important mathematical con-cepts and skills are assessed in a balanced way.
At grade 12, the five content areas are collapsed into four, with geometry and measure-ment combined into one. This reflects the fact that the majority of measurement topics suitable for 12th-grade students are geometric in nature. Separating these two areas of mathematics at grade 12 becomes forced and unnecessary.
It is important to note that certain aspects of mathematics occur in all content areas. The best example of this is computation, or the skill of performing operations on numbers. This skill should not be confused with the Number Properties and Operations content area, which encompasses a wide range of concepts about our numeration system. Certainly the area of Number Properties and Operations includes a variety of computational skills, ranging from operations with whole numbers to work with
5

decimals, fractions, and real numbers. However, computation is also critical in Measurement and Geometry in calculating the perimeter of a rectangle, estimating the height of a building, or finding the hypotenuse of a right triangle, for example. Data Analysis often involves computation in calculating a mean or the range of a set of data, for example. Probability often entails work with rational numbers. Solving algebraic equations also usually involves numerical computation. Computation, therefore, is a foundational skill in every content area. Although the main NAEP assessment is not designed to report a separate score for computation, results from the long-term NAEP assessment can provide insight into students’ computational abilities.
As described in chapter one, one of the changes made from the 2005 framework is the ad-dition of a subtopic for mathematical reasoning that appears in Number Properties and Operations; Geometry; Data Analysis, Statistics, and Probability; and Algebra. At grades 4 and 8, no new objectives were written but some of the objectives from the 2005 frame-work were moved into this new subtopic area. This reflects a new emphasis on the impor-tance of mathematical reasoning across each content area.
ITEM DISTRIBUTION
The distribution of items among the various mathematical content areas is a critical fea-ture of the assessment design because it reflects the relative importance and value given to each. As has been the case with past NAEP assessments, the categories receive differ-ential emphasis at each grade. Exhibit2 provides the recommended balance of items in the 2009 assessment by content area for each grade (4, 8, and 12). The recommended item distribution is identical to the percentages found in the 2005 Framework. Note that the percentages refer to numbers of items, not the amount of student testing time.
Exhibit 2. Percentage distribution of items by grade and content areaContent Area Grade 4 Grade 8 Grade 12
Number Properties and Operations 40 20 10
Measurement 20 15
30Geometry 15 20
Data Analysis, Statistics, and Probability 10 15 25
Algebra 15 30 35
6

2009 NAEP MATHEMATICS OBJECTIVES ORGANIZATION
Organizing the framework by content areas has the potential for fragmentation. However, the intent is that the objectives and the test items built on them will, in many cases, cross content area boundaries.
To provide clarity and specificity in the objectives for each grade level, the framework matrix depicts the particular objectives appropriate for assessment under each subtopic. For example, within the Number Properties and Operations subtopic of Number Sense, specific objectives are listed for assessment at grades 4, 8, and 12. The same objective at different grade levels depicts a developmental sequence for that concept or skill. An empty cell in the matrix conveys that a particular objective is not appropriate for assess-ment at that grade level.
To fully understand these objectives and their intent, please note the following: These objectives describe what is to be assessed on the 2009 NAEP. They should not be in-
terpreted as a complete description of mathematics that should be taught at these grade lev-els.
Some of the grade 12 objectives are marked with an “*.” This denotes objectives that de-scribe mathematics content beyond that typically taught in a standard 3-year course of study (the equivalent of 1 year of geometry and 2 years of algebra). Therefore, these objectives will be selected less often than the others for inclusion on the assessments. Although all test items will be assigned a primary classification, some test items could potentially fall into more than one content area or under more than one objective.
When the word or is used in an objective, it should be understood that an item may assess one or more of the concepts included.
Further clarification of some objectives along with sample items may be found in Assess-ment and Item Specifications for the 2009 NAEP Mathematics Assessment.
MATHEMATICAL CONTENT AREAS
NUMBER PROPERTIES AND OPERATIONS
Numbers are our main tools for describing the world quantitatively. As such, they de-serve a privileged place in the 2009 NAEP framework. With whole numbers, we can count collections of discrete objects of any type. We can also use numbers to describe fractional parts, to describe continuous quantities such as length, area, volume, weight, and time, and even to describe more complicated derived quantities such as rates of speed, density, inflation, interest, and so on. Thanks to Cartesian coordinates, we can use pairs of numbers to describe points in a plane or triads of numbers to label points in space. Numbers let us talk in a precise way about anything that can be counted, mea-sured, or located in space.Numbers are not simply labels for quantities: they form systems with their own internal structure. Arithmetic operations (addition, subtraction, multiplication, and division) help
7

us model basic real-world operations. For example, joining two collections or laying two lengths end to end can be described by addition, whereas the concept of rate depends on division. Multiplication and division of whole numbers lead to the beginnings of number theory, including concepts of factorization, remainder, and prime number. The other ba-sic structure of real numbers is ordering, as in which is greater and which is lesser. These reflect our intuitions about the relative size of quantities and provide a basis for making sensible estimates.
The accessibility and usefulness of arithmetic is greatly enhanced by our efficient means for representing numbers: the Hindu-Arabic decimal place value system. In its full devel-opment, this remarkable system includes decimal fractions, which let us approximate any real number as closely as we wish. Decimal notation allows us to do arithmetic by means of simple routine algorithms and it also makes size comparisons and estimation easy. The decimal system achieves its efficiency through sophistication as all the basic algebraic operations are implicitly used in writing decimal numbers. To represent ratios of two whole numbers exactly, we supplement decimal notation with fractions.
Comfort in dealing with numbers effectively is called number sense. It includes firm intu-itions about what numbers tell us; an understanding of the ways to represent them sym-bolically (including facility with converting between different representations); ability to calculate, either exactly or approximately, and by several means (mentally, with paper and pencil, or with calculator, as appropriate); and skill in estimation. Ability to deal with proportion (including percent) is another important part of number sense.
Number sense is a major expectation of the 2009 NAEP. In fourth grade, students are ex-pected to have a solid grasp of whole numbers as represented by the decimal system and to have the beginnings of understanding fractions. By eighth grade, they should be com-fortable with rational numbers, represented either as decimal fractions (including per-cents) or as common fractions, and should be able to use them to solve problems involv-ing proportionality and rates. At this level, numbers should also begin to coalesce with geometry by extending students’ understanding of the number line. This concept should be connected with ideas of approximation and the use of scientific notation. Eighth graders should also have some acquaintance with naturally occurring irrational numbers such as square roots and pi. By 12th grade, students should be comfortable dealing with all types of real numbers and various representations such as exponents or logarithms. Students at the 12th-grade level should be familiar with complex numbers and be able to establish the validity of numerical properties using mathematical arguments.
8
Exhibit 3. Number properties and operations1) Number senseGrade 4 Grade 8 Grade 12a) Identify place value and actual value of digits in whole numbers.
a) Use place value to model and describe integers and decimals.
b) Represent numbers using models such as base 10 representations, number lines, and two-dimensional models.
b) Model or describe rational numbers or numerical relationships using number lines and diagrams.
c) Compose or decompose whole quantities by place value (e.g., write whole numbers in expanded notation using place value: 342 = 300 + 40 + 2).
d) Write or rename whole numbers (e.g., 10: 5 + 5, 12 – 2, 2 5).
d) Write or rename rational numbers.
d) Represent, interpret, or compare expressions for real numbers, including expressions using exponents and logarithms.
e) Connect model, number word, or number using various models and representations for whole numbers, fractions, and decimals.
e) Recognize, translate be-tween, or apply multiple repre-sentations of rational numbers (fractions, decimals, and per-cents) in meaningful contexts.
f) Express or interpret numbers using scientific notation from real-life contexts.
f) Represent or interpret expressions involving very large or very small numbers in scientific notation.
g) Find or model absolute value or apply to problem situations.
g) Represent, interpret, or compare expressions or problem situations involving absolute values.
h) Order or compare rational numbers (fractions, decimals, percents, or integers) using various models and repre-sentations (e.g., number line).
i) Order or compare whole numbers, decimals, or fractions.
i) Order or compare rational numbers including very large and small integers, and deci-mals and fractions close to zero.
i) Order or compare real numbers, including very large and very small real numbers.
Exhibit 3. Number properties and operations (cont.)
9

2) EstimationGrade 4 Grade 8 Grade 12a) Use benchmarks (well-known numbers used as meaningful points for comparison) for whole numbers, decimals, or fractions in contexts (e.g., ½ and .5 may be used as benchmarks for fractions and decimals between 0 and 1.00).
a) Establish or apply benchmarks for rational numbers and common irrational numbers (e.g., π) in contexts.
b) Make estimates appropriate to a given situation with whole numbers, fractions, or decimals by Knowing when to estimate, Selecting the appropriate
type of estimate, including overestimate, underestimate, and range of estimate, or
Selecting the appropriate method of estimation (e.g., rounding).
b) Make estimates appropriate to a given situation by: Identifying when
estimation is appropriate, Determining the level of
accuracy needed, Selecting the appropriate
method of estimation, or Analyzing the effect of an
estimation method on the accuracy of results.
b) Identify situations where estimation is appropriate, determine the needed degree of accuracy, and analyze* the effect of the estimation method on the accuracy of results.
c) Verify solutions or determine the reasonableness of results in meaningful contexts.
c) Verify solutions or determine the reasonableness of results in a variety of situations, including calculator and computer results.
c) Verify solutions or determine the reasonableness of results in a variety of situations.
d) Estimate square or cube
roots of numbers less than 1,000 between two whole numbers.
d) Estimate square or cube roots of numbers less than 1,000 between two whole numbers.
10

Exhibit 3. Number properties and operations (cont.)3) Number operationsGrade 4 Grade 8 Grade 12a) Add and subtract: Whole numbers, or Fractions with like
denominators, or Decimals through
hundredths.
a) Perform computations with rational numbers.
a) Find integral or simple fractional powers of real numbers.
b) Multiply whole numbers: No larger than two digit by
two digit with paper and pencil computation, or
Larger numbers with use of calculator.
b) Perform arithmetic operations with real numbers, including common irrational numbers.
c) Divide whole numbers: Up to three digits by one
digit with paper and pencil computation, or
Up to five digits by two digits with use of calculator.
c) Perform arithmetic operations with expressions involving absolute value.
d) Describe the effect of operations on size (whole numbers).
d) Describe the effect of multiplying and dividing by numbers including the effect of multiplying or dividing a rational number by: Zero, or A number less than zero,
or A number between zero
and one, One, or A number greater than one.
d) Describe the effect of multiplying and dividing by numbers including the effect of multiplying or dividing a real number by: Zero, or A number less than zero,
or A number between zero
and one, or One, or A number greater than one.
e) Interpret whole number operations and the relationships between them.
e) Interpret rational number operations and the relationships between them.
f) Solve application problems involving numbers and operations.
f) Solve application problems involving rational numbers and operations using exact answers or estimates as appropriate.
f) Solve application problems involving numbers, including rational and common irrationals.
Exhibit 3. Number properties and operations (cont.)4) Ratios and proportional reasoningGrade 4 Grade 8 Grade 12a) Use simple ratios to describe a) Use ratios to describe
11

4) Ratios and proportional reasoningGrade 4 Grade 8 Grade 12problem situations. problem situations. b) Use fractions to represent
and express ratios and proportions.
c) Use proportional reasoning to model and solve problems (including rates and scaling).
c) Use proportions to solve problems (including rates of change).
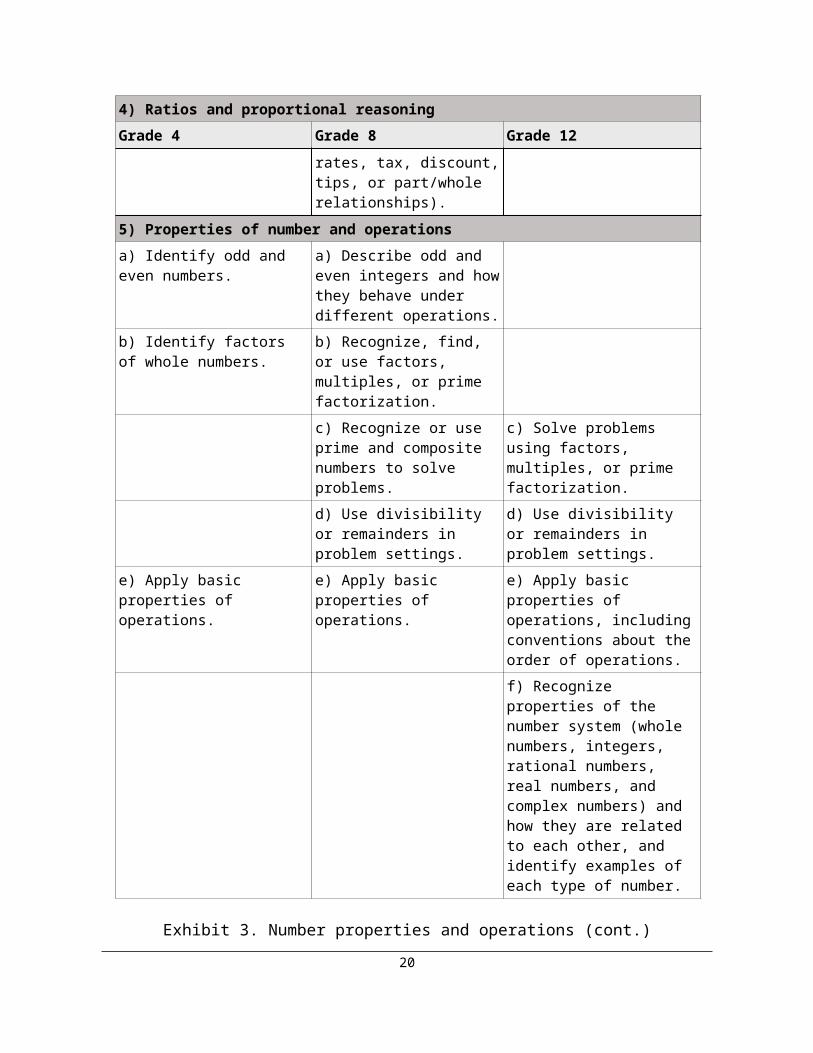
d) Solve problems involving percentages (including percent increase and decrease, interest rates, tax, discount, tips, or part/whole relationships).
d) Solve multistep problems involving percentages, including compound percentages.
5) Properties of number and operationsa) Identify odd and even numbers.
a) Describe odd and even integers and how they behave under different operations.
b) Identify factors of whole numbers.
b) Recognize, find, or use factors, multiples, or prime factorization.
c) Recognize or use prime and composite numbers to solve problems.
c) Solve problems using factors, multiples, or prime factorization.
d) Use divisibility or remainders in problem settings.
d) Use divisibility or remainders in problem settings.
e) Apply basic properties of operations.
e) Apply basic properties of operations.
e) Apply basic properties of operations, including conventions about the order of operations. f) Recognize properties of the number system (whole numbers, integers, rational numbers, real numbers, and complex numbers) and how they are related to each other, and identify examples of each type of number.
Exhibit 3. Number properties and operations (cont.)6) Mathematical reasoning using numberGrade 4 Grade 8 Grade 12a) Explain or justify a mathematical concept or
a) Explain or justify a mathematical concept or
a) Give a mathematical argument to establish the
12

relationship (e.g., explain why 15 is an odd number or why 7–3 is not the same as 3–7).
relationship (e.g., explain why 17 is prime).
validity of a simple numerical property or relationship.
b) Provide a mathematical argument to explain operations with two or more fractions.
b) * Analyze or interpret a proof by mathematical induction of a simple numerical relationship.
MEASUREMENT
Measuring is the process by which numbers are assigned to describe the world quantita-tively. This process involves selecting the attribute of the object or event to be measured, comparing this attribute to a unit, and reporting the number of units. For example, in measuring a child, we may select the attribute of height and the inch as the unit for the comparison. In comparing the height to the inch, we may find that the child is about 42 inches. If considering only the domain of whole numbers, we would report that the child is 42 inches tall. However, since height is a continuous attribute, we may consider the do-main of rational numbers and report that the child is 413/16 inches tall (to the nearest 16th of the inch). Measurement also allows us to model positive and negative numbers as well as the irrational numbers.
This connection between measuring and number makes measuring a vital part of the school curriculum. Measurement models are often used when students are learning about number and operations. For example, area and volume models can help students under-stand multiplication and its properties. Length models, especially the number line, can help students understand ordering and rounding numbers. Measurement also has a strong connection to other areas of school mathematics and to the other subjects in the school curriculum. Problems in algebra are often drawn from measurement situations. One can also consider measurement to be a function or a mapping of an attribute to a set of num-bers. Geometry as taught in U.S. schools often focuses on the measurement aspect of geometric figures. Statistics also provides ways to measure and to compare sets of data. These are just some of the ways that measurement is intertwined with the other four con-tent areas.
In this NAEP mathematics framework, attributes such as capacity, weight/mass, time, and temperature are included as are the geometric attributes of length, area, and volume. Although many of these attributes are included in the grade 4 framework, the emphasis there is on length, including perimeter, distance, and height. More emphasis is placed on areas and angles in grade 8. By grade 12, volumes and rates constructed from other at-tributes, such as speed, are emphasized.
The NAEP assessment includes nonstandard, customary, and metric units. At grade 4, common customary units such as inch, quart, pound, and hour and common metric units such as centimeter, liter, and gram are emphasized. Grades 8 and 12 include the use of both square and cubic units for measuring area, surface area, and volume, degrees for measuring angles, and constructed units such as miles per hour. Converting from one unit
13

in a system to another, such as from minutes to hours, is an important aspect of measure-ment included in problem situations. Understanding and using the many conversions available is an important skill. There are a limited number of common, everyday equiva-lencies that students are expected to know (see Assessment and Item Specifications for more detail).
Items classified in this content area depend on some knowledge of measurement. For ex-ample, an item that asks the difference between a 3-inch and a 1¾-inch line segment is a number item, whereas an item comparing a 2-foot segment with an 8-inch line segment is a measurement item. In many secondary schools, measurement becomes an integral part of geometry; this is reflected in the proportion of items recommended for these two areas.
Exhibit 4. Measurement1) Measuring physical attributesGrade 4 Grade 8 Grade 12a) Identify the attribute that is appropriate to measure in a given situation.
b) Compare objects with respect to a given attribute, such as length, area, volume, time, or temperature.
b) Compare objects with respect to length, area, volume, angle measurement, weight, or mass.
b) Determine the effect of proportions and scaling on length, area, and volume.
c) Estimate the size of an object with respect to a given measurement attribute (e.g., length, perimeter, or area using a grid).
c) Estimate the size of an object with respect to a given measurement attribute (e.g., area).
c) Estimate or compare perimeters or areas of two-dimensional geometric figures.
d) Solve problems of angle measure, including those involving triangles or other polygons or parallel lines cut by a transversal.
14

Exhibit 4. Measurement (cont.)
1) Measuring physical attributes (cont.)Grade 4 Grade 8 Grade 12e) Select or use appropriate measurement instruments such as ruler, meter stick, clock, thermometer, or other scaled instruments.
e) Select or use appropriate measurement instrument to determine or create a given length, area, volume, angle, weight, or mass.
f) Solve problems involving perimeter of plane figures.
f) Solve mathematical or real-world problems involving perimeter or area of plane figures such as triangles, rectangles, circles, or composite figures.
f) Solve problems involving perimeter or area of plane figures such as polygons, circles, or composite figures.
g) Solve problems involving area of squares and rectangles.
h) Solve problems involving volume or surface area of rectangular solids, cylinders, prisms, or composite shapes.
h) Solve problems by determining, estimating, or comparing volumes or surface areas of three-dimensional figures.
i) Solve problems involving rates such as speed or population density.
i) Solve problems involving rates such as speed, density, population density, or flow rates.
2) Systems of measurementa) Select or use an appropriate type of unit for the attribute being measured such as length, time, or temperature.
a) Select or use an appropriate type of unit for the attribute being measured such as length, area, angle, time, or volume.
a) Recognize that geometric measurements (length, area, perimeter, and volume) depend on the choice of a unit, and apply such units in expressions, equations, and problem solutions.
15

Exhibit 4. Measurement (cont.)2) Systems of measurement (cont.)Grade 4 Grade 8 Grade 12b) Solve problems involving conversions within the same measurement system such as conversions involving inches and feet or hours and minutes.
b) Solve problems involving conversions within the same measurement system such as conversions involving square inches and square feet.
b) Solve problems involving conversions within or between measurement systems, given the relationship between the units.
c) Estimate the measure of an object in one system given the measure of that object in another system and the approximate conversion factor. For example: Distance conversion: 1
kilometer is approximately 5/8 of a mile.
Money conversion: U.S. dollars to Canadian dollars.
Temperature conversion: Fahrenheit to Celsius.
d) Determine appropriate size of unit of measurement in problem situation involving such attributes as length, time, capacity, or weight.
d) Determine appropriate size of unit of measurement in problem situation involving such attributes as length, area, or volume.
d) Understand that numerical values associated with measurements of physical quantities are approximate, are subject to variation, and must be assigned units of measurement.
e) Determine situations in which a highly accurate measurement is important.
e) Determine appropriate accuracy of measurement in problem situations (e.g., the accuracy of each of several lengths needed to obtain a specified accuracy of a total length) and find the measure to that degree of accuracy.
e) Determine appropriate accuracy of measurement in problem situations (e.g., the accuracy of measurement of the dimensions to obtain a specified accuracy of area) and find the measure to that degree of accuracy.
f) Construct or solve problems involving scale drawings.
16
Exhibit 4. Measurement (cont.)3) Measurement in trianglesGrade 4 Grade 8 Grade 12
a) Solve problems involving indirect measurement such as finding the height of a building by comparing its shadow with the height and shadow of a known object.
a) Solve problems involving indirect measurement.
b) Solve problems using the fact that trigonometric ratios (sine, cosine, and tangent) stay constant in similar triangles.c) Use the definitions of sine, cosine, and tangent as ratios of sides in a right triangle to solve problems about length of sides and measure of angles. d) Interpret and use the identity sin2 + cos2 = 1 for angles between 0° and 90°; recognize this identity as a special representation of the Pythagorean theorem.e) * Determine the radian measure of an angle and explain how radian measurement is related to a circle of radius 1.
f) * Use trigonometric formulas such as addition and double angle formulas.g) * Use the law of cosines and the law of sines to find unknown sides and angles of a triangle.
GEOMETRY
Geometry began as a practical collection of rules for calculating lengths, areas, and vol-umes of common shapes. In classical times, the Greeks turned it into a subject for reason-ing and proof, and Euclid organized their discoveries into a coherent collection of results, all deduced using logic from a small number of special assumptions, called postulates. Euclid’s Elements stood as a pinnacle of human intellectual achievement for more than 2,000 years.
17

The 19th century saw a new flowering of geometric thought, going beyond Euclid, and leading to the idea that geometry is the study of the possible structures of space. This had its most striking application in Einstein’s theories of relativity, which described the be-havior of light and gravity in terms of a four-dimensional geometry, which combines the usual three dimensions of space with time as an additional dimension.
A major insight of the 19th century is that geometry is intimately related to ideas of sym-metry and transformation. The symmetry of familiar shapes under simple transformations—that our bodies look more or less the same if reflected across the middle or that a square looks the same if rotated by 90 degrees—is a matter of everyday experience. Many of the standard terms for triangles (scalene, isosceles, equilateral) and quadrilater-als (parallelogram, rectangle, rhombus, square) refer to symmetry properties. Also, the behavior of figures under changes of scale is an aspect of symmetry with myriad practical consequences. At a deeper level, the fundamental ideas of geometry itself (for example, congruence) depend on transformation and invariance. In the 20th century, symmetry ideas were also seen to underlie much of physics, including not only Einstein’s relativity theories but also atomic physics and solid-state physics (the field that produced computer chips).
Geometry as taught in U.S. schools roughly mirrors historical development through Greek times with some modern additions, most notably symmetry and transformations. By grade 4, students are expected to be familiar with a library of simple figures and their attributes, both in the plane (lines, circles, triangles, rectangles and squares) and in space (cubes, spheres, and cylinders). In middle school, understanding of these shapes deepens, with study of cross-sections of solids and the beginnings of an analytical understanding of properties of plane figures, especially parallelism, perpendicularity, and angle relations in polygons. Schools introduce right angles and the Pythagorean theorem, and geometry becomes more and more mixed with measurement. Study of the number lines lays the ba-sis for analytic geometry. In secondary school, instruction gives attention to Euclid’s legacy and the power of rigorous thinking. Students are expected to make, test, and vali-date conjectures. Via analytic geometry, the key areas of geometry and algebra merge into a powerful tool that provides a basis for calculus and the applications of mathematics that helped create the modern technological world in which we live.
Symmetry is an increasingly important component of geometry. Elementary students are expected to be familiar with the basic types of symmetry transformations of plane figures, including flips (reflection across lines), turns (rotations around points), and slides (trans-lations). In middle school, this knowledge becomes more systematic and analytical, with each type of transformation distinguished from other types by their qualitative effects. For example, a rigid motion of a plane that leaves at least two points fixed (but not all points) must be a reflection in a line. In high school, students are expected to be able to represent transformations algebraically. Some students may also gain insight into their systematic structure such as the classification of rigid motions of the plane as reflections, rotations, translations, or glide reflections, and what happens when two or more isome-tries are performed in succession (composition).
18

Exhibit 5. Geometry1) Dimension and shapeGrade 4 Grade 8 Grade 12a) Explore properties of paths between points.
a) Draw or describe a path of shortest length between points to solve problems in context.
b) Identify or describe (informally) real-world objects using simple plane figures (e.g., triangles, rectangles, squares, and circles) and simple solid figures (e.g., cubes, spheres, and cylinders).
b) Identify a geometric object given a written description of its properties.
c) Identify or draw angles and other geometric figures in the plane.
c) Identify, define, or describe geometric shapes in the plane and in three-dimensional space given a visual representation.
c) Give precise mathematical descriptions or definitions of geometric shapes in the plane and in three-dimensional space.
d) Draw or sketch from a written description polygons, circles, or semicircles.
d) Draw or sketch from a written description plane figures and planar images of three-dimensional figures.
e) Represent or describe a three-dimensional situation in a two-dimensional drawing from different views.
e) Use two-dimensional representations of three-dimensional objects to visualize and solve problems.
f) Describe attributes of two- and three-dimensional shapes.
f) Demonstrate an understanding about the two- and three-dimensional shapes in our world through identifying, drawing, modeling, building, or taking apart.
f) Analyze properties of three-dimensional figures including spheres and hemispheres.
19

Exhibit 5. Geometry (cont.)2) Transformation of shapes and preservation of propertiesGrade 4 Grade 8 Grade 12a) Identify whether a figure is symmetrical or draw lines of symmetry.
a) Identify lines of symmetry in plane figures or recognize and classify types of symmetries of plane figures.
a) Recognize or identify types of symmetries (e.g., point, line, rotational, self-congruence) of two- and three-dimensional figures.
b) Give or recognize the precise mathematical relationship (e.g., congruence, similarity, orientation) between a figure and its image under a transformation.
c) Identify the images resulting from flips (reflections), slides (translations), or turns (rotations).
c) Recognize or informally describe the effect of a transformation on two-dimensional geometric shapes (reflections across lines of symmetry, rotations, translations, magnifications, and contractions).
c) Perform or describe the effect of a single transformation on two- and three-dimensional geometric shapes (reflections across lines of symmetry, rotations, translations, and dilations).
d) Recognize which attributes (such as shape and area) change or do not change when plane figures are cut up or rearranged.
d) Predict results of combining, subdividing, and changing shapes of plane figures and solids (e.g., paper folding, tiling, cutting up and rearranging pieces).
d) Identify transformations, combinations, or subdivisions of shapes that preserve the area of two-dimensional figures or the volume of three-dimensional figures.
e) Match or draw congruent figures in a given collection.
e) Justify relationships of congruence and similarity and apply these relationships using scaling and proportional reasoning.
e) Justify relationships of congruence and similarity and apply these relation-ships using scaling and proportional reasoning.
f) For similar figures, identify and use the relationships of conservation of angle and of proportionality of side length and perimeter.
g) Perform or describe the effects of successive transformations.
20
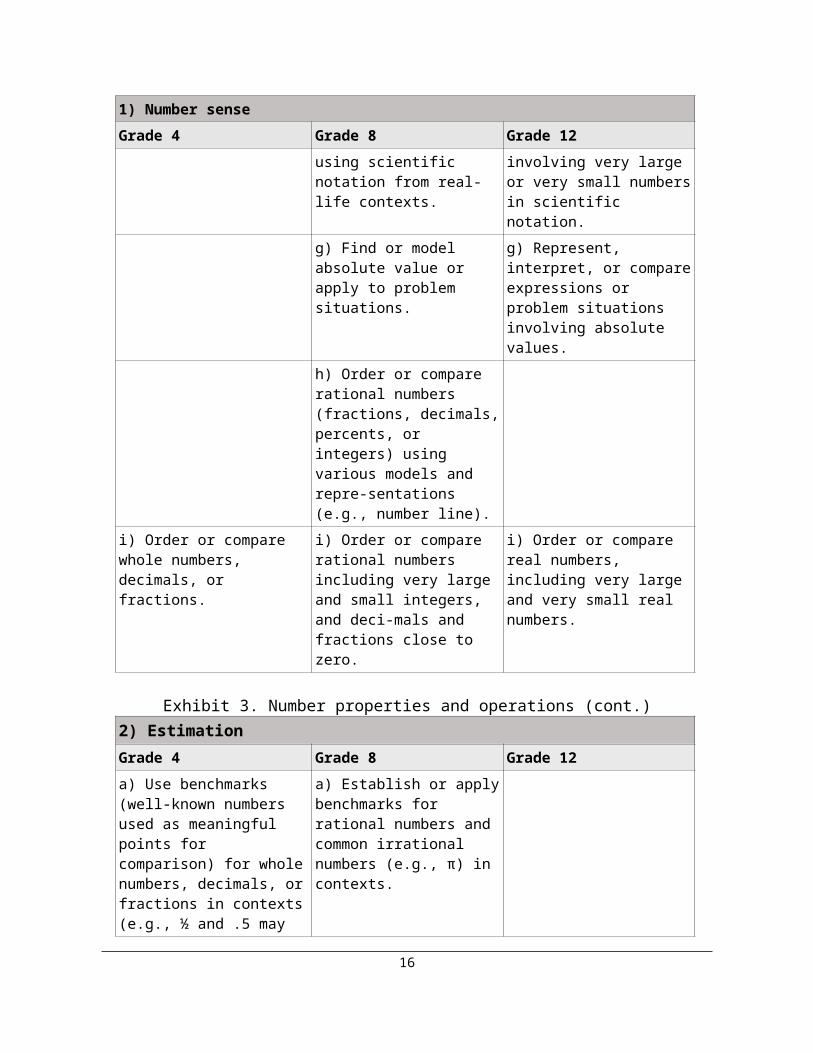
Exhibit 5. Geometry (cont.)3) Relationships between geometric figuresGrade 4 Grade 8 Grade 12a) Analyze or describe patterns of geometric figures by increasing number of sides, changing size or orientation (e.g., polygons with more and more sides).
b) Assemble simple plane shapes to construct a given shape.
b) Apply geometric properties and relationships in solving simple problems in two and three dimensions.
b) Apply geometric properties and relationships to solve problems in two and three dimensions.
c) Recognize two-dimensional faces of three-dimensional shapes.
c) Represent problem situations with simple geometric models to solve mathematical or real-world problems.
c) Represent problem situations with geometric models to solve mathematical or real-world problems.
d) Use the Pythagorean theorem to solve problems.
d) Use the Pythagorean theorem to solve problems in two- or three-dimensional situations. e) Recall and interpret definitions and basic properties of congruent and similar triangles, circles, quadrilaterals, polygons, parallel, perpendicular and intersecting lines, and associated angle relationships.
f) Describe and compare properties of simple and compound figures composed of triangles, squares, and rectangles.
f) Describe or analyze simple properties of, or relationships between, triangles, quadrilaterals, and other polygonal plane figures.
f) Analyze properties or relationships of triangles, quadrilaterals, and other polygonal plane figures.
21

Exhibit 5. Geometry (cont.)3) Relationships between geometric figures (cont.)Grade 4 Grade 8 Grade 12 g) Describe or analyze
properties and relationships of parallel or intersecting lines.
g) Analyze properties and relationships of parallel, perpendicular, or intersecting lines including the angle relationships that arise in these cases. h) Analyze properties of circles and the intersections of lines and circles (inscribed angles, central angles, tangents, secants, and chords).
4) Position, direction, and coordinate geometrya) Describe relative positions of points and lines using the geometric ideas of parallelism or perpendicularity.
a) Describe relative positions of points and lines using the geometric ideas of midpoint, points on common line through a common point, parallelism, or perpendicularity.
a) Solve problems involving the coordinate plane such as the distance between two points, the midpoint of a segment, or slopes of perpendicular or parallel lines.
b) Describe the intersection of two or more geometric figures in the plane (e.g., intersection of a circle and a line).
b) Describe the intersections of lines in the plane and in space, intersections of a line and a plane, or of two planes in space.
c) Visualize or describe the cross section of a solid.
c) Describe or identify conic sections and other cross sections of solids.
d) Construct geometric figures with vertices at points on a coordinate grid.
d) Represent geometric figures using rectangular coordinates on a plane.
d) Represent two-dimensional figures algebraically using coordinates and/or equations.
e) * Use vectors to represent velocity and direction; multiply a vector by a scalar and add vectors both algebraically and graphically.
22

Exhibit 5. Geometry (cont.)4) Position, direction, and coordinate geometry (cont.)Grade 4 Grade 8 Grade 12
f) Find an equation of a circle given its center and radius and, given an equation of a circle, find its center and radius. g) * Graph ellipses and hyperbolas whose axes are parallel to the coordinate axes and demonstrate understanding of the relationship between their standard algebraic form and their graphical characteristics.h) * Represent situations and solve problems involving polar coordinates.
5) Mathematical reasoning in geometrya) Distinguish which objects in a collection satisfy a given geometric definition and explain choices.
a) Make and test a geometric conjecture about regular polygons.
a) Make, test, and validate geometric conjectures using a variety of methods including deductive reasoning and counterexamples.b) Determine the role of hypotheses, logical implications, and conclusion in proofs of geometric theorems.c) Analyze or explain a geometric argument by contradiction. d) Analyze or explain a geometric proof of the Pythagorean theorem.e) Prove basic theorems about congruent and similar triangles and circles.
23

DATA ANALYSIS, STATISTICS, AND PROBABILITY
Data analysis and statistics covers the entire process of collecting, organizing, summariz-ing, and interpreting data. This is the heart of the discipline called statistics and is in evi-dence whenever quantitative information is used to determine a course of action. To em-phasize the spirit of statistical thinking, data analysis should begin with a question to be answered: not with the data. Data should be collected only with a specific question (or questions) in mind and only after a plan (usually called a design) for collecting data rele-vant to the question is thought out. Beginning at an early age, students should grasp the fundamental principle that looking for questions in an existing data set is far different from the scientific method of collecting data to verify or refute a well-posed question. A pattern can be found in almost any data set if one looks hard enough; however, a pattern discovered in this way is often meaningless, especially from the point of view of statisti-cal inference.
In the context of data analysis or statistics, probability can be thought of as the study of potential patterns in outcomes that have not yet been observed. We say that the probabil-ity of a balanced coin coming up heads when flipped is one half because we believe that about half of the flips would turn out to be heads if we flipped the coin many times. Un-der random sampling, patterns for outcomes of designed studies can be anticipated and used as the basis for making decisions. If the coin actually turned up heads 80 percent of the time, we would suspect that it was not balanced. The whole probability distribution of all possible outcomes is important in most statistics problems because the key to deci-sionmaking is to decide whether or not a particular observed outcome is unusual (located in a tail of the probability distribution) or not. For example, four as a grade-point average is unusually high among most groups of students, four as the pound weight of a baby is unusually low, and four as the number of runs scored in a baseball game is not unusual in either direction.
By grade 4, students should be expected to apply their understanding of number and quantity to pose questions that can be answered by collecting appropriate data. They should be expected to organize data in a table or a plot and summarize the essential fea-tures of center, spread, and shape both verbally and with simple summary statistics. Sim-ple comparisons can be made between two related data sets but more formal inference based on randomness should come later. The basic concept of chance and statistical rea-soning can be built into meaningful contexts, such as “If I draw two names from among those of the students in the room, am I likely to get two girls?” Such problems can be ad-dressed through simulation.
Building on the same definition of data analysis and the same principles of describing data distributions through center, spread, and shape, grade 8 students should be expected to be able to use a wider variety of organizing and summarizing techniques. They can also begin to analyze statistical claims through designed surveys and experiments that in-volve randomization, with simulation being the main tool for making simple statistical in-
24
ferences. They will begin to use more formal terminology related to probability and data analysis.
Students in grade 12 should be expected to use a wide variety of statistical techniques for all phases of the data analysis process, including a more formal understanding of statisti-cal inference (still with simulation as the main inferential analysis tool). In addition to comparing univariate data sets, students at this level should be able to recognize and de-scribe possible associations between two variables by looking at two-way tables for cate-gorical variables or scatterplots for measurement variables. Association between vari-ables is related to the concepts of independence and dependence and an understanding of these ideas requires knowledge of conditional probability. These students should be able to use statistical models (linear and nonlinear equations) to describe possible associations between measurement variables and should be familiar with techniques for fitting models to data.
Exhibit 6. Data analysis, statistics, and probability1) Data representationGrade 4 Grade 8 Grade 12The following representations of data are indicated for each grade level. Objectives in which only a subset of these representations is applicable are indicated in the parenthesis associated with the objective.Pictographs, bar graphs, circle graphs, line graphs, line plots, tables, and tallies.
Histograms, line graphs, scatterplots, box plots, bar graphs, circle graphs, stem and leaf plots, frequency distributions, and tables.
Histograms, line graphs, scatterplots, box plots, bar graphs, circle graphs, stem and leaf plots, frequency distributions, and tables, including two-way tables.
a) Read or interpret a single set of data.
a) Read or interpret data, including interpolating or extrapolating from data.
a) Read or interpret graphical or tabular representations of data.
b) For a given set of data, complete a graph (limits of time make it difficult to construct graphs completely).
b) For a given set of data, complete a graph and then solve a problem using the data in the graph (histograms, line graphs, scatterplots, circle graphs, and bar graphs).
b) For a given set of data, complete a graph and solve a problem using the data in the graph (histograms, scatterplots, and line graphs).
25

Exhibit 6. Data analysis, statistics, and probability (cont.)1) Data representation (cont.)Grade 4 Grade 8 Grade 12c) Solve problems by estimating and computing within a single set of data.
c) Solve problems by estimating and computing with data from a single set or across sets of data.
c) Solve problems involving univariate or bivariate data.
d) Given a graph or a set of data, determine whether information is represented effectively and appropriately (histograms, line graphs, scatterplots, circle graphs, and bar graphs).
d) Given a graphical or tabular representation of a set of data, determine whether information is represented effectively and appropriately.
e) Compare and contrast the effectiveness of different representations of the same data.
e) Compare and contrast different graphical representations of univariate and bivariate data.f) Organize and display data in a spreadsheet in order to recognize patterns and solve problems.
2) Characteristics of data sets a) Calculate, use, or interpret
mean, median, mode, or range. a) Calculate, interpret, or use summary statistics for distributions of data including measures of typical value (mean, median), position (quartiles, percentiles), and spread (range, interquartile range, variance, and standard deviation).
b) Given a set of data or a graph, describe the distribution of data using median, range, or mode.
b) Describe how mean, median, mode, range, or interquartile ranges relate to distribution shape.
b) Recognize how linear transformations of one-variable data affect mean, median, mode, range, interquartile range, and standard deviation.
c) Identify outliers and determine their effect on mean, median, mode, or range.
c) Determine the effect of outliers on mean, median, mode, range, interquartile range, or standard deviation.
26
Exhibit 6. Data analysis, statistics, and probability (cont.)2) Characteristics of data sets (cont.)Grade 4 Grade 8 Grade 12d) Compare two sets of related data.
d) Using appropriate statistical measures, compare two or more data sets describing the same characteristic for two different populations or subsets of the same population.
d) Compare data sets using summary statistics (mean, median, mode, range, interquartile range, or standard deviation) describing the same characteristic for two different populations or subsets of the same population.
e) Visually choose the line that best fits given a scatterplot and informally explain the meaning of the line. Use the line to make predictions.
e) Approximate a trend line if a linear pattern is apparent in a scatterplot or use a graphing calculator to determine a least-squares regression line and use the line or equation to make predictions.
f) Recognize that the correlation coefficient is a number from –1 to +1 that measures the strength of the linear relationship between two variables; visually estimate the correlation coefficient (e.g., positive or negative, closer to 0, .5, or 1.0) of a scatterplot. g) Know and interpret the key characteristics of a normal distribution such as shape, center (mean), and spread (standard deviation).
27

Exhibit 6. Data analysis, statistics, and probability (cont.)3) Experiments and samplesGrade 4 Grade 8 Grade 12 a) Given a sample, identify
possible sources of bias in sampling.
a) Identify possible sources of bias in sample surveys and describe how such bias can be controlled and reduced.
b) Distinguish between a random and nonrandom sample.
b) Recognize and describe a method to select a simple random sample.
c) * Draw inferences from samples, such as estimates of proportions in a population, estimates of population means, or decisions about differences in means for two “”treatments”.”
d) Evaluate the design of an experiment.
d) Identify or evaluate the characteristics of a good survey or of a well-designed experiment. e) * Recognize the differences in design and in conclusions between randomized experiments and observational studies.
4) Probabilitya) Use informal probabilistic thinking to describe chance events (i.e., likely and unlikely, certain and impossible).
a) Analyze a situation that involves probability of an independent event.
a) Recognize whether two events are independent or dependent.
b) Determine a simple probability from a context that includes a picture.
b) Determine the theoretical probability of simple and compound events in familiar contexts.
b) Determine the theoretical probability of simple and compound events in familiar or unfamiliar contexts.
28
Exhibit 6. Data analysis, statistics, and probability (cont.)4) Probability (cont.)Grade 4 Grade 8 Grade 12
c) Estimate the probability of simple and compound events through experimentation or simulation.
c) Given the results of an experiment or simulation, estimate the probability of simple or compound events in familiar or unfamiliar contexts.
d) Use theoretical probability to evaluate or predict experimental outcomes.
d) Use theoretical probability to evaluate or predict experimental outcomes.
e) List all possible outcomes of a given situation or event.
e) Determine the sample space for a given situation.
e) Determine the number of ways an event can occur using tree diagrams, formulas for combinations and permutations, or other counting techniques.
f) Use a sample space to determine the probability of possible outcomes for an event.
g) Represent the probability of a given outcome using a picture or other graphic.
g) Represent the probability of a given outcome using fractions, decimals, and percents.
h) Determine the probability of independent and dependent events. (Dependent events should be limited to a small sample size.)
h) Determine the probability of independent and dependent events.
i) Determine conditional probability using two-way tables.
j) Interpret probabilities within a given context.
j) Interpret and apply probability concepts to practical situations.k) * Use the binomial theorem to solve problems.
29
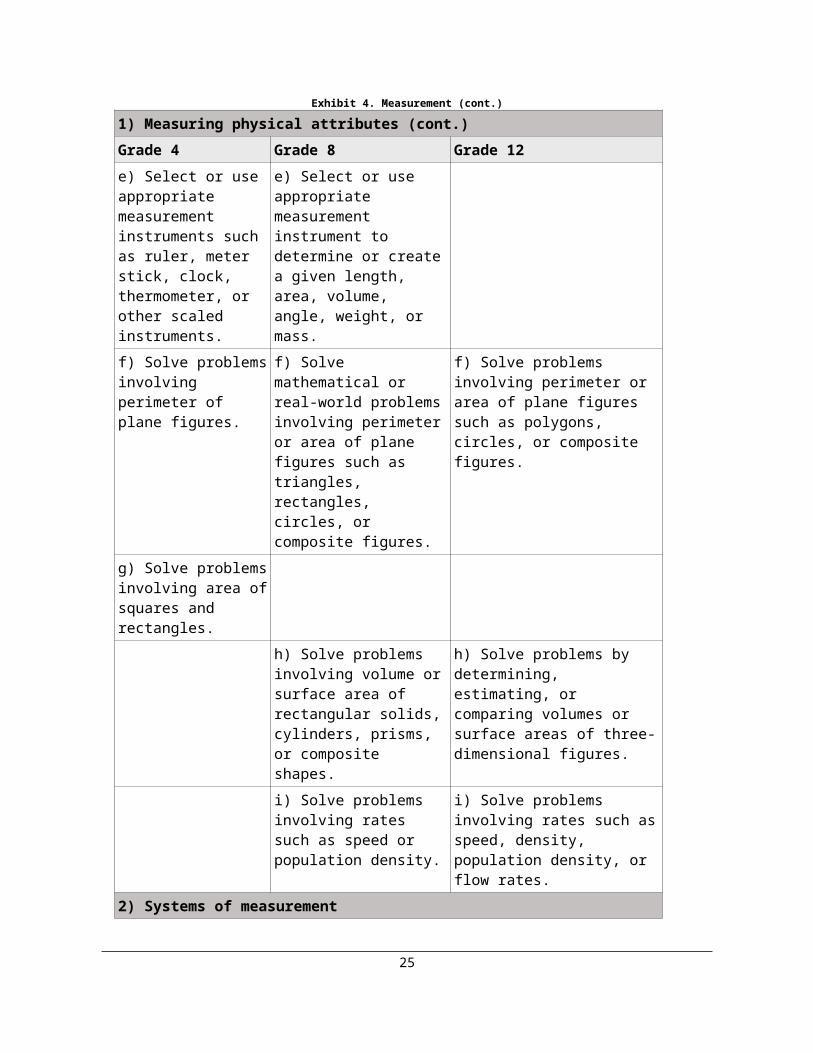
Exhibit 6. Data analysis, statistics, and probability (cont.)5) Mathematical reasoning with dataGrade 4 Grade 8 Grade 12
a) Identify misleading uses of data in real-world settings and critique different ways of presenting and using information.b) Distinguish relevant from irrelevant information, identify missing information, and either find what is needed or make appropriate approximations. c) * Recognize, use, and distinguish between the processes of mathematical (deterministic) and statistical modeling.d) Recognize when arguments based on data confuse correlation with causation.e) * Recognize and explain the potential errors caused by extrapolating from data.
ALGEBRA
Algebra was pioneered in the Middle Ages by mathematicians in the Middle East and Asia as a method of solving equations easily and efficiently by manipulation of symbols, rather than by the earlier geometric methods of the Greeks. The two approaches were eventually united in the analytic geometry of René Descartes. Modern symbolic notation, developed in the Renaissance, greatly enhanced the power of the algebraic method and from the 17th century forward, algebra in turn promoted advances in all branches of mathematics and science.
The widening use of algebra led to study of its formal structure. Out of this were gradu-ally distilled the “rules of algebra,” a compact summary of the principles behind algebraic manipulation. A parallel line of thought produced a simple but flexible concept of func-tion and also led to the development of set theory as a comprehensive background for mathematics. When taken liberally to include these ideas, algebra reaches from the foun-dations of mathematics to the frontiers of current research.
These two aspects of algebra, as a powerful representational tool and as a vehicle for comprehensive concepts such as function, form the basis for the expectations throughout the grades. By grade 4, students are expected to be able to recognize and extend simple
30
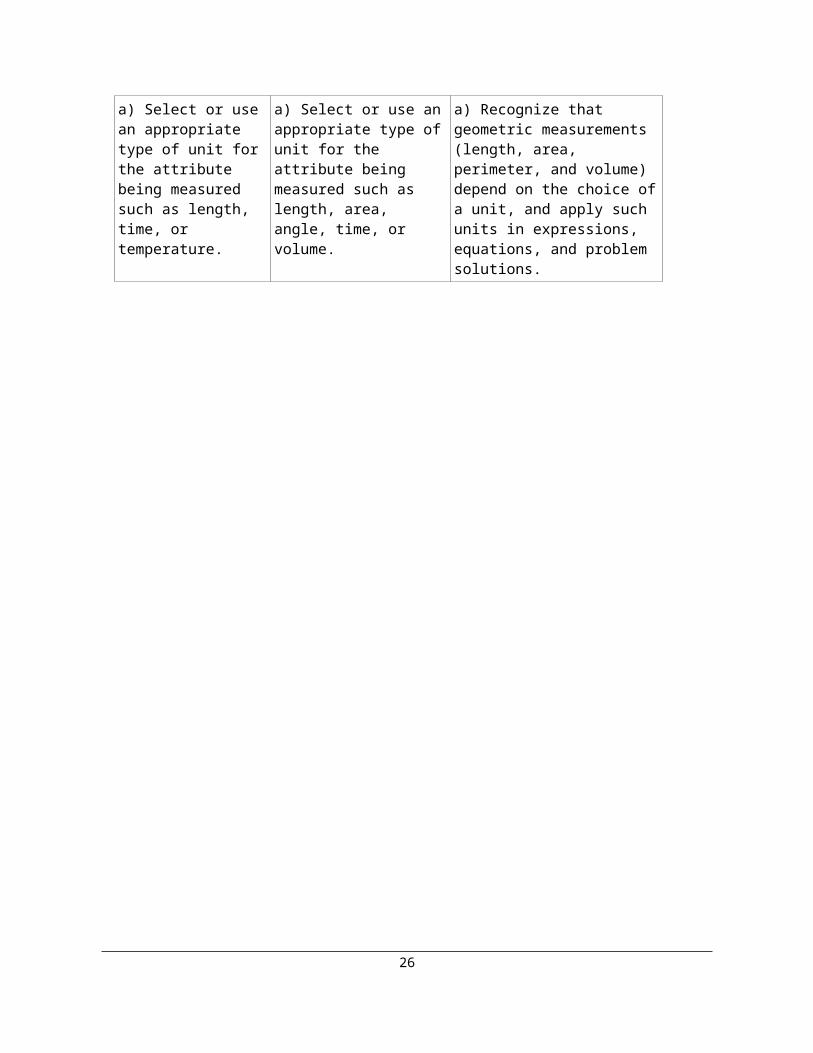
numeric patterns as one foundation for a later understanding of function. They can begin to understand the meaning of equality and some of its properties as well as the idea of an unknown quantity as a precursor to the concept of variable.
As students move into middle school, the ideas of function and variable become more im-portant. Representation of functions as patterns, via tables, verbal descriptions, symbolic descriptions, and graphs can combine to promote a flexible grasp of the idea of function. Linear functions receive special attention. They connect to the ideas of proportionality and rate, forming a bridge that will eventually link arithmetic to calculus. Symbolic ma-nipulation in the relatively simple context of linear equations is reinforced by other means of finding solutions, including graphing by hand or with calculators.
In high school, students should become comfortable in manipulating and interpreting more complex expressions. The rules of algebra should come to be appreciated as a basis for reasoning. Nonlinear functions, especially quadratic, power, and exponential func-tions, are introduced to solve real-world problems. Students should become accomplished at translating verbal descriptions of problem situations into symbolic form. Students should encounter expressions involving several variables, systems of linear equations, and solutions to inequalities by grade 12.
Exhibit 7. Algebra1) Patterns, relations, and functionsGrade 4 Grade 8 Grade 12a) Recognize, describe, or extend numerical patterns.
a) Recognize, describe, or extend numerical and geometric patterns using tables, graphs, words, or symbols.
a) Recognize, describe, or extend numerical patterns, including arithmetic and geometric progressions.
b) Given a pattern or sequence, construct or explain a rule that can generate the terms of the pattern or sequence.
b) Generalize a pattern appearing in a numerical sequence, table, or graph using words or symbols.
b) Express linear and exponential functions in recursive and explicit form given a table, verbal description, or some terms of a sequence.
c) Given a description, extend or find a missing term in a pattern or sequence.
c) Analyze or create patterns, sequences, or linear functions given a rule.
31

Exhibit 7. Algebra (cont.)1) Patterns, relations, and functions (cont.)Grade 4 Grade 8 Grade 12d) Create a different representation of a pattern or sequence given a verbal description.
e) Recognize or describe a relationship in which quantities change proportionally.
e) Identify functions as linear or nonlinear or contrast distinguishing properties of functions from tables, graphs, or equations.
e) Identify or analyze distinguishing properties of linear, quadratic, rational, exponential, or *trigonometric functions from tables, graphs, or equations.
f) Interpret the meaning of slope or intercepts in linear functions.
g) Determine whether a relation, given in verbal, symbolic, tabular, or graphical form, is a function.
h) Recognize and analyze the general forms of linear, quadratic, rational, exponential, or *trigonometric functions.
i) Determine the domain and range of functions given in various forms and contexts.j) * Given a function, determine its inverse if it exists and explain the contextual meaning of the inverse for a given situation.
32
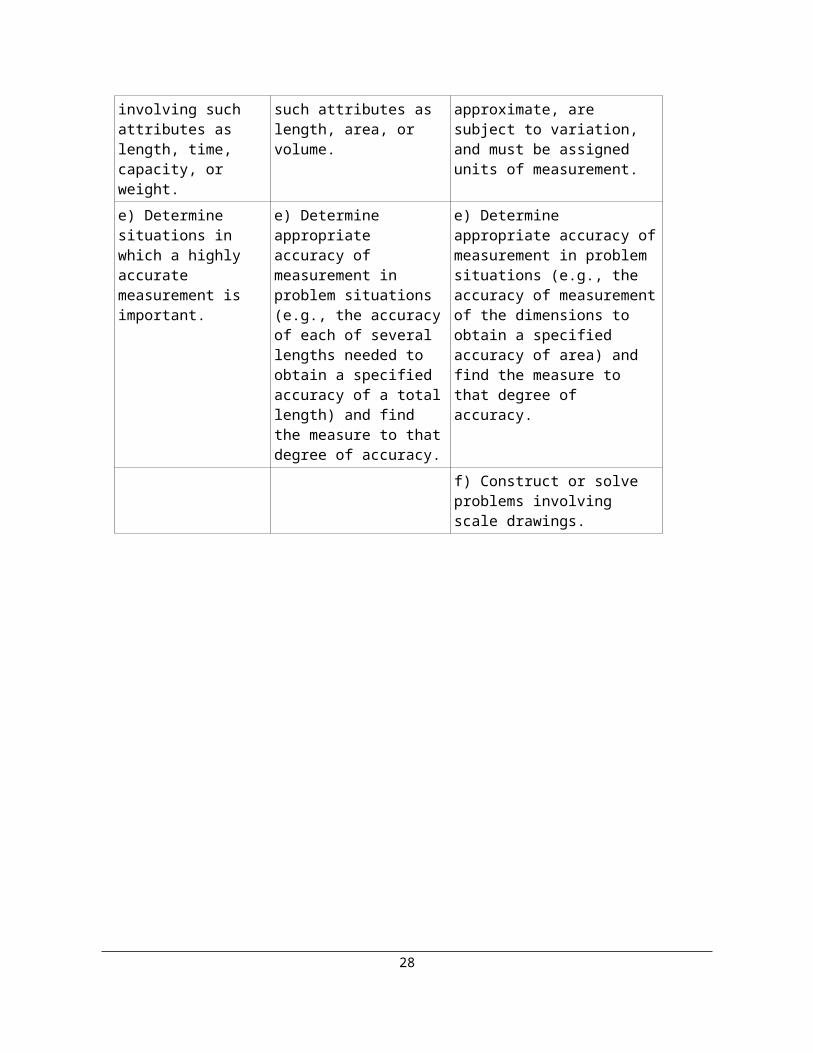
Exhibit 7. Algebra (cont.)2) Algebraic representationsGrade 4 Grade 8 Grade 12a) Translate between the different forms of representations (symbolic, numerical, verbal, or pictorial) of whole number relationships (such as from a written description to an equation or from a function table to a written description).
a) Translate between different representations of linear expressions using symbols, graphs, tables, diagrams, or written descriptions.
a) Create and translate between different repre-sentations of algebraic ex-pressions, equations, and inequalities (e.g., linear, quadratic, exponential, or *trigonometric) using sym-bols, graphs, tables, diagrams, or written descriptions.
b) Analyze or interpret linear relationships expressed in symbols, graphs, tables, diagrams, or written descriptions.
b) Analyze or interpret relationships expressed in symbols, graphs, tables, diagrams (including Venn diagrams), or written descriptions and evaluate the relative advantages or disadvantages of different representations to answer specific questions.
c) Graph or interpret points with whole number or letter coordinates on grids or in the first quadrant of the coordinate plane.
c) Graph or interpret points represented by ordered pairs of numbers on a rectangular coordinate system.
d) Solve problems involving coordinate pairs on the rectangular coordinate system.
d) Perform or interpret transformations on the graphs of linear, quadratic, exponential, and *trigonometric functions.
e) Make inferences or predictions using an algebraic model of a situation.
33

Exhibit 7. Algebra (cont.)2) Algebraic representations (cont.)Grade 4 Grade 8 Grade 12 f) Identify or represent
functional relationships in meaningful contexts including proportional, linear, and common nonlinear (e.g., compound interest, bacterial growth) in tables, graphs, words, or symbols.
f) Given a real-world situation, determine if a linear, quadratic, rational, exponential, logarithmic, or *trigonometric function fits the situation.
g) Solve problems involving exponential growth and decay.h) *Analyze properties of exponential, logarithmic, and rational functions.
3) Variables, expressions, and operationsa) Use letters and symbols to represent an unknown quantity in a simple mathematical expression.
b) Express simple mathematical relationships using number sentences.
b) Write algebraic expressions, equations, or inequalities to represent a situation.
b) Write algebraic expressions, equations, or inequalities to represent a situation.
c) Perform basic operations, using appropriate tools, on linear algebraic expressions (including grouping and order of multiple operations involving basic operations, exponents, roots, simplifying, and expanding).
c) Perform basic operations, using appropriate tools, on algebraic expressions including polynomial and rational expressions.
d) Write equivalent forms of algebraic expressions, equations, or inequalities to represent and explain mathematical relationships.
34

Exhibit 7. Algebra (cont.)3) Variables, expressions, and operations (cont.)Grade 4 Grade 8 Grade 12
e) Evaluate algebraic expressions including polynomials and rational expressions. f) Use function notation to evaluate a function at a specified point in its domain and combine functions by addition, subtraction, multiplication, division, and composition.g) * Determine the sum of finite and infinite arithmetic and geometric series.h) Use basic properties of exponents and *logarithms to solve problems.
4) Equations and inequalitiesa) Find the value of the unknown in a whole number sentence.
a) Solve linear equations or inequalities (e.g., ax + b = c or ax + b = cx + d or ax + b > c).
a) Solve linear, rational, or quadratic equations or inequalities, including those involving absolute value.
b) Interpret “=” as an equivalence between two expressions and use this interpretation to solve problems.
c) Analyze situations or solve problems using linear equations and inequalities with rational coefficients sym-bolically or graphically (e.g., ax + b = c or ax + b = cx + d).
c) Analyze situations, develop mathematical models, or solve problems using linear, quadratic, exponential, or logarithmic equations or inequalities symbolically or graphically.
35
Exhibit 7. Algebra (cont.)4) Equations and inequalities (cont.)Grade 4 Grade 8 Grade 12 d) Interpret relationships
between symbolic linear expressions and graphs of lines by identifying and computing slope and intercepts (e.g., know in y = ax + b, that a is the rate of change and b is the vertical intercept of the graph).
d) Solve (symbolically or graphically) a system of equations or inequalities and recognize the relationship between the analytical solution and graphical solution.
e) Use and evaluate common formulas (e.g., relationship between a circle’s circumference and diameter [C = pi d], distance and time under constant speed).
e) Solve problems involving special formulas such as: A = P(I + r)t, A = Pert.
f) Solve an equation or formula involving several variables for one variable in terms of the others.
g) Solve quadratic equations with complex roots.
5) Mathematical reasoning in algebraa) Verify a conclusion using algebraic properties.
a) Make, validate, and justify conclusions and generalizations about linear relationships.
a) Use algebraic properties to develop a valid mathematical argument.
b) Determine the role of hypotheses, logical implications, and conclusions in algebraic argument.
c) Explain the use of relational conjunctions (and, or) in algebraic arguments.
36

CHAPTER THREEMATHEMATICAL COMPLEXITY OF ITEMS
Each NAEP item assesses an objective that can be associated with a content area of math-ematics, such as Number Properties and Operations or Geometry. Each item also makes certain demands on students’ thinking. These demands determine the mathematical com-plexity of an item, which is the second dimension of the mathematics framework. The three levels of mathematical complexity in NAEP assessment are low, moderate, and high.
The demands on thinking that an item expects—what it asks the student to recall, under-stand, reason about, and do—assume that students are familiar with the mathematics of the task. For example, a task with low complexity might ask students simply to state the formula to find the distance between two points. Those students who had never learned anything about distance formula would not be successful on the task even though the de-mands were low. Items are developed for administration at a given grade level on the ba-sis of the framework and complexity of those items is independent of the particular cur-riculum a student has experienced.
Mathematical complexity deals with what the students are asked to do in a task. It does not take into account how they might undertake it. In the distance formula task, for instance, students who had studied the formula might simply reproduce it from memory. Others, however, who could not recall the exact formula, might end up deriving it from the Pythagorean theorem, engaging in a different kind of thinking than the task presupposed.
The categories—low complexity, moderate complexity, and high complexity—form an ordered description of the demands an item may make on a student. Items at the low level of complexity, for example, may ask a student to recall a property. At the moderate level, an item may ask the student to make a connection between two properties; at the high level, an item may ask a student to analyze the assumptions made in a mathematical model. This is an example of the distinctions made in item complexity to provide balance in the item pool. The ordering is not intended to imply that mathematics is learned or should be taught in such an ordered way. Using levels of complexity to describe that di-mension of each item allows for a balance of mathematical thinking in the design of the assessment.
The mathematical complexity of an item is not directly related to its format (multiple-choice, short constructed response, or extended constructed response). Items requiring that the student generate a response tend to make somewhat heavier demands on students than items requiring a choice among alternatives but that is not always the case. Any type of item can deal with mathematics of greater or less depth and sophistication. There are
37

multiple-choice items that assess complex mathematics, and constructed response items can be crafted to assess routine mathematical ideas.
The remainder of this chapter gives brief descriptions of each level of complexity as well as examples from previous NAEP assessments to illustrate each level. A brief rationale is included to explain why an item is so classified. All example items found in this chapter can also be found in Assessment and Item Specifications for the 2009 NAEP Mathematics Assessment, where they are accompanied by full scoring rubrics. That document also con-tains further examples and more detailed discussion of the complexity levels.
Items in the NAEP assessment should be balanced according to levels of complexity as described in more detail in chapter five. The ideal balance should be as follows.
Exhibit 8. Percent of testing time at each level of complexity
LOW COMPLEXITY
Low-complexity items expect students to recall or recognize concepts or procedures specified in the framework. Items typically specify what the student is to do, which is of-ten to carry out some procedure that can be performed mechanically. The student is not left to come up with an original method or to demonstrate a line of reasoning. The fol-lowing examples have been classified at the low-complexity level.
Example1: Low Complexity Source: 1996 NAEP 4M9 #1Grade 4 Percent correct: 50%Number Properties and Operations: Number sense No calculator
How many fourths make a whole?
Answer: _________
Rationale: This item is of low complexity since it explicitly asks students to recognize an example of a concept (four-fourths make a whole).
Example 2: Low Complexity Source: 2005 NAEP 4M12 #12
38
5025Moderate
complexity
High complexity
25 Lowcomplexity
Correct answer: 4

Grade 4 Percent correct: 54%Geometry: Transformations of shapes No calculator
A piece of metal in the shape of a rectangle was folded as shown above. In the figure on the right, the “?” symbol represents what length?
A. 3 inches B. 6 inchesC. 8 inchesD. 11 inches
Rationale: Although this is a visualization task, it is of low complexity since it requires only a straightforward recognition of the change in the figure. Students in the fourth grade are expected to be familiar with sums such as 11 + 3, so this does not increase the complexity level for these students.
Example 3: Low Complexity Source: 2005 NAEP 8M12 #17Grade 8 Percent correct: 54%Algebra: Algebraic representations No calculator
x 0 1 2 3 10y –1 2 5 8 29
Which of the following equations represents the relationship between x and y shown in the table above?
A. y = x2 + 1B. y = x + 1C. y = 3x – 1 D. y = x2 – 3E. y = 3 x2 – 1
Rationale: This item would be at the moderate level if it were written as follows, “Write the equation that represents the relationship between x and y.” In generating the equation students would first have to decide if the relationship was linear.
Example 4: Low Complexity Source: 2005 NAEP 8M12 #6Grade 8 Percent correct: 51%Data Analysis, Statistics, and Probability: Characteristics of data sets No calculator
39
Correct answer: B
Correct answer: C

The prices of gasoline in a certain region are $1.41, $1.36, $1.57, and $1.45 per gallon. What is the median price per gallon for gasoline in this region?
A. $1.41B. $1.43C. $1.44 D. $1.45E. $1.47
Rationale: Students do not have to decide what to do, but rather, they need to recall the concept of a median and the procedure for handling a set of data with an even number of entries.
Example 5: Low Complexity Source: 2005 NAEP B3M3#12Grade 12 Percent correct: 31%Algebra: Equations and inequalities No calculator
x + 2y = 17x – 2y = 3
The graphs of the two equations shown above intersect at the point (x, y).What is the value of x at the point of intersection?
A. 3½B. 5C. 7 D. 10E. 20
Rationale: This item is of low complexity since it involves a procedure that should be carried out mechanically by grade 12.
40
Correct answer: B
Correct answer: D 1010

Example 6: Low Complexity Source: 2005 NAEP B3M3 #16Grade 12 Percent correct: 26%Algebra: Variables, expressions, and operations No calculator
If f(x) = x2 + x and g(x) = 2x + 7, what is the expression for f(g(x))?
Rationale: Although the content of the task could be considered advanced, it involves recognizing the notation for composition of two functions and carrying out a procedure.
Example 7: Low Complexity Source: 2005 NAEP B3M3 #11Grade 12 Percent correct: 39%Data Analysis, Statistics, and Probability: Data representation No calculator
According to the box-and-whisker plot above, three-fourths of the cars made by Company X got fewer than how many miles per gallon.
A. 20B. 24C. 27 D. 33E. 40
Rationale: This item is of low complexity since it requires reading a graph and recalling that the four sections of the box-and-whisker plot are quartiles (each represents one-fourth of the data).
41
Correct answer: 4x2 + 30x + 56
Correct answer: D

MODERATE COMPLEXITY
Items in the moderate-complexity category involve more flexibility of thinking and choice among alternatives than do those in the low-complexity category. The student is expected to decide what to do and how to do it, bringing together concepts and processes from various domains. For example, the student may be asked to represent a situation in more than one way, to draw a geometric figure that satisfies multiple conditions, or to solve a problem involving multiple unspecified operations. Students might be asked to show or explain their work but would not be expected to justify it mathematically. The following examples are items that have been classified at the moderate complexity level.
EXAMPLE 8: Moderate Complexity Source: 2005 NAEP 4M4 #12Grade 4 Percent correct: 34% (full credit), Algebra: Equations and inequalities 22% (partial credit)
No calculator, tiles provided
Questions 11–14 [these questions included this item] refer to the number tiles or the paper strip. Please remove the 10 number tiles and the paper strip from your packet and put them on your desk.
Jan entered four numbers less than 10 on his calculator. He forgot what his sec-ond and fourth numbers were. This is what he remembered doing.
8 + – 7 + = 10
List a pair of numbers that could have been the second and fourth numbers. (You may use the number tiles to help you.)
________ , ________ List a different pair that could have been the second and fourth numbers.
________ , ________
Rationale: This item is of moderate complexity because students have to decide what to do and how to do it. It requires some flexibility in thinking since students at this grade level are not expected to have a routine method to determine two missing numbers and they also have to find two different solutions.
Example 9: Moderate Complexity Source: 2005 NAEP 4M12 #11
42
Correct answer: Any two of these combinations:
(0,9) (9,0)(1,8) (8,1)(2,7) (7,2)(3,6) (6,3)(4,5) (5,4)

Grade 4 Percent correct: 52%Data Analysis, Statistics, and Probability: Data representation No calculator
Jim made the graph above. Which of these could be the title for the graph?
A. Number of students who walked to school on Monday through FridayB. Number of dogs in five statesC. Number of bottles collected by three studentsD. Number of students in 10 clubs
Rationale: Students must analyze the graph and the choices for a title and eliminate choices because of knowledge of dogs and clubs and the structure of the graph (five sets of data) in order to choose an appropriate title for the graph.
Example 10: Moderate Complexity Source: 2005 NAEP 8M3 #3Grade 8 Percent correct: 44% (full credit), Measurement: Measuring physical attributes 13% (partial credit)
No calculator, ruler provided
The figure above shows a picture and its frame.
In the space below, draw a rectangular picture 2 inches by 3 inches and draw a 1-inch wide frame around it.
Rationale: Students must plan their drawing, decide whether to begin with the inside or outside rectangle, and determine how the other rectangle is related to the one chosen. Often creating a drawing that satisfies several conditions is more complex than describing a given figure.
43
Correct answer: A
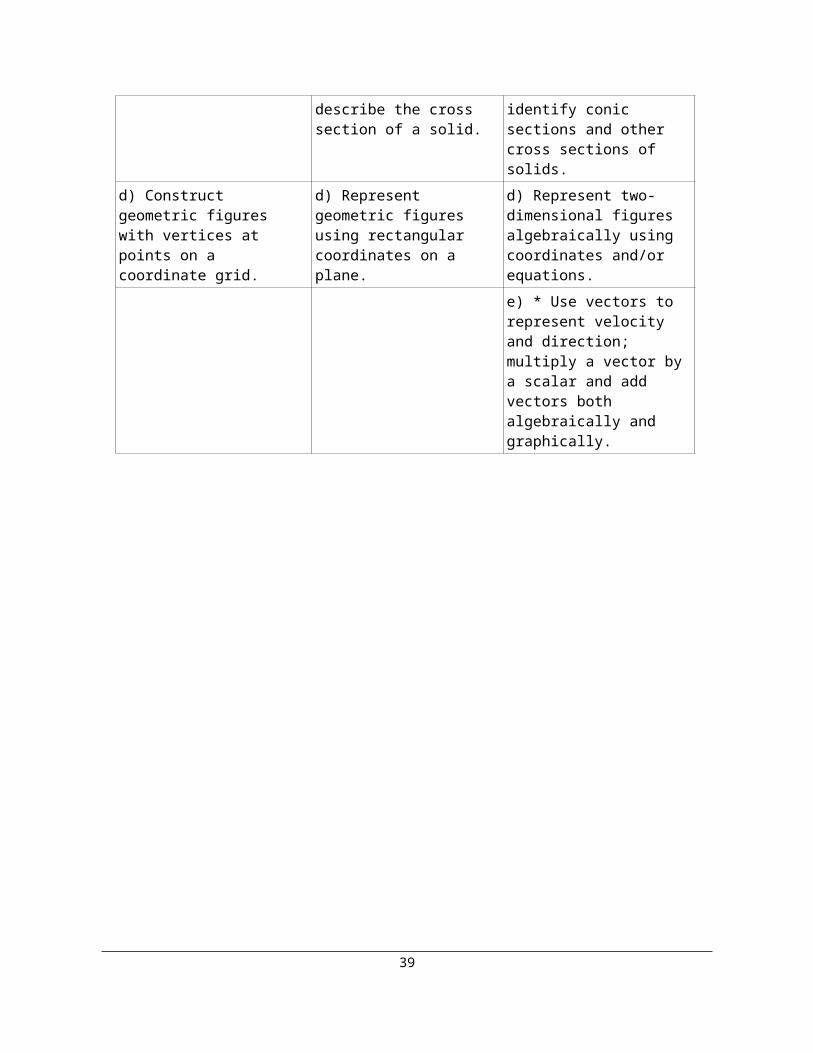
Example 11: Moderate Complexity Source: 2005 NAEP 8M3 #10Grade 8 Percent correct: 34%Algebra: Patterns, relations, and functions No calculator
In the equation y = 4x, if the value of x is increased by 2, what is the effect on the value of y?
A. It is 8 more than the original amountB. It is 6 more than the original amountC. It is 2 more than the original amountD. It is 16 times the original amountE. It is 8 times the original amount
Rationale: This item is of moderate complexity because it involves more flexibility and a choice of alternative ways to approach the problem rather than a low complexity level which more clearly states what to be done. At grade 8, students have not learned a procedure for answering this type of question.
Example 12: Moderate Complexity Source: 2005 NAEP 8M3 #14Grade 8 Percent correct: 28%Geometry: Relationships in geometric figures No calculator
A certain 4-sided figure has the following properties.
• Only one pair of opposite sides are parallel
• Only one pair of opposite sides are equal in length
• The parallel sides are not equal in length
Which of the following must be true about the sides that are equal in length?
A. They are perpendicular to each otherB. They are each perpendicular to an adjacent sideC. They are equal in length to one of the other two sidesD. They are not equal in length to either of the other two sidesE. They are not parallel
Rationale: This item is of moderate complexity since it requires some visualization and reasoning but no mathematical justification for the answer chosen.
Example 13: Moderate Complexity Source: 2005 NAEP B3M3 Grade 12 Percent correct: 22%
44
Correct answer: A
Correct answer: E

Number Properties and Operations: Number operations No calculator
The remainder when a number n is divided by 7 is 2. Which of the following is the remainder when 2n + 1 is divided by 7?
A. 1B. 2C. 3 D. 4E. 5
Rationale: Although the problem could be approached algebraically (n = 7m + 2, for some whole number m, and 2n + 1= 2(7m + 2) + 1 or 14 m + 5, so the remainder is 5), students can solve the problem by using a value for n that satisfies the condition that it has a remainder of 2 when divided by 7. If the students were asked to justify their solution algebraically, then this would be an item of high complexity.
Example 14: Moderate Complexity Source: 2005 NAEP B3M12 #15 Grade 12 Percent correct: 41%Measurement: Measuring physical attributes Calculator available
A cat lies crouched on level ground 50 feet away from the base of a tree. The cat can see a bird’s nest directly above the base of the tree. The angle of elevation from the cat to the bird’s nest is 40°. To the nearest foot, how far above the base of the tree is the bird’s nest?
A. 32B. 38C. 42 D. 60E. 65
Rationale: Students must draw or visualize the situation, recall the appropriate trigonometric function, and use a calculator to determine the value of that function.
45
Correct answer: E
Correct answer: C

Example 15: Moderate Complexity Source: 2005 NAEP B3M12 #16 Grade 12 Percent correct: 12%Data Analysis, Statistics, and Probability: Characteristics of datasets Calculator available
A clock manufacturer has found that the amount of time their clocks gain or lose per week is normally distributed with a mean of 0 minutes and a standard deviation of 0.5 minute, as shown below.
In a random sample of 1,500 of their clocks, which of the following is closest to the expected number of clocks that would gain or lose more than 1 minute per week?
A. 15B. 30C. 50 D. 70E. 90
Rationale: Students must recall information about the normal curve (that the region between the mean standard deviations contains 95 percent of the data), and apply that information to solve the problem.
HIGH COMPLEXITY
High-complexity items make heavy demands on students, because they are expected to use reasoning, planning, analysis, judgment, and creative thought. Students may be ex-pected to justify mathematical statements or construct a mathematical argument. Items might require students to generalize from specific examples. Items at this level take more time than those at other levels due to the demands of the task, not due to the number of
46
Correct answer: D
parts or steps. In the example items at the moderate level, several suggestions were made in the rationale that would make the items at a high level of complexity. The following examples are items that have been classified at the high-complexity level.
Example 16: High Complexity Source: 2003 NAEP 4M7 #20Grade 4 Percent correct: 3% (extended),Algebra: Patterns, relations, and functions 6% (satisfactory), 13% (partial),
27% (minimal)Calculator available
The table below shows how the chirping of a cricket is related to the tempera-ture outside. For example, a cricket chirps 144 times each minute when the tem-perature is 76°.
Number of Chirps Per Minute
Temperature
144 76°152 78°160 80°168 82°176 84°
What would be the number of chirps per minute when the temperature outside is 90° if this pattern stays the same? Answer: _________________________
Explain how you figured out your answer.
Rationale: To receive full credit for this item, students must give the correct number of chirps and explain that for every 2-degree rise in the temperature, the number of chirps increases by eight. The item requires creative thought for students at this grade as well as planning a solution strategy. Additionally, it requires a written justification of their answer, more than just showing work.
47
Correct answer: 200

Example 17: High Complexity Source: 2005 NAEP 8M4 #11 Grade 8 Percent correct: 12% (full credit), Algebra: Patterns, relations, and functions 24% (partial credit)
No calculator
If the grid in Question 10 [the previous question] were large enough and the beetle continued to move in the same pattern [over 2 and up 1], would the point that is 75 blocks up and 100 blocks over from the starting point be on the beetle’s path?
Give a reason for your answer.
Rationale: Students must justify their yes or no answer by using the concept of slope showing that moving over 2 and up 1 repeatedly would result in the beetle being at a point 100 blocks over and 50 blocks up. This requires analysis of the situation as well as a mathematical explanation of the thinking. Since it is not realistic to extend the grid, students are expected to generalize about the ratio.
48

Example 18: High Complexity MODIFIED NAEP itemGrade 12 No protractorGeometry: Mathematical reasoning
Each of the 12 sides of the regular figure above has the same length.
1. Which of the following angles has a measure of 90°? A. Angle ABIB. Angle ACGC. Angle ADFD. Angle ADIE. Angle AEH
2. Prove that no angle formed by joining three vertices of the figure could have a measure of 50 degrees
Modification: This item (2005 NAEP B3M3 #1) has been modified to illustrate a high-complexity item. The original item allowed the use of protractor and did not ask for a proof.Rationale: There are several ways to approach part 1 of this problem, so students must decide which method to use. Part 2 raises the complexity to high since it requires students to present a mathematical argument requiring creative thought and the bringing together of information about circle arcs and inscribed angles. They could argue that no angle can be 50° because all angles must be multiples of 15°.
49
Correct answer: B
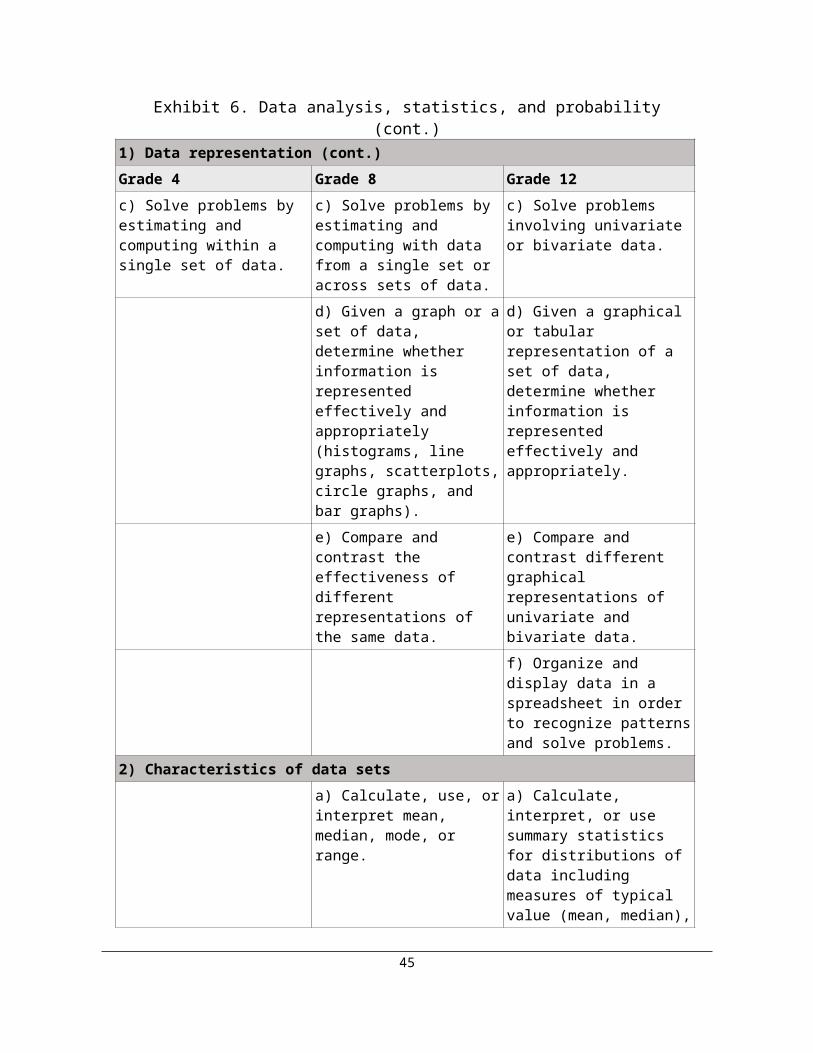
Example 19: High Complexity Modified ItemGrade 12 No calculatorNumber Properties and Operations: Number sense
Which of the following is false for all values of x if x is any real number?
A. x < x2 < x3
B. x3 < x < x2 C. x2 < x < x3
D. x < x3 < x2’
E. x3 < x2 < x
Rationale: This multiple-choice item requires planning, deciding what strategy to use, and reasoning about which statement is always false.
Additional examples of items and their classifications can be found in 2009 NAEP Math-ematics Assessment and Item Specifications as well as on the National Center for Educa-tion Statistics’ website: http://nces.ed.gov/nationsreportcard/itmrls/. All the released items from recent mathematics assessments can be accessed from this site. The complex-ity classification is available only for items beginning with the 2005 assessment since this was the first year that the framework specified this dimension.
50
Correct answer: C

CHAPTER FOURITEM FORMATS
Central to the development of the NAEP assessment in mathematics is the careful selec-tion of items. Since 1992, the mathematics assessment has used three formats or item types: multiple choice, short constructed response, and extended constructed response. Testing time on NAEP is divided evenly between multiple-choice items and both types of constructed-response items, as shown below.
Exhibit 9. Percent of testing time by item formats
MULTIPLE-CHOICE ITEMS
Multiple-choice items require students to read, reflect, or compute and then to select the alternative that best expresses the answer. This format is appropriate for quickly deter-mining whether students have achieved certain knowledge and skills. A carefully con-structed multiple-choice item can assess any of the levels of mathematical complexity (described in chapter three) from simple procedures to more sophisticated concepts. Such items, however, are limited in the extent to which they can provide evidence of the depth of students’ thinking. Multiple-choice items for grade 4 have four choices, and at grades 8 and 12, there are five choices. These items are scored as either correct or incorrect.
The types of item formats are illustrated in this chapter. The presentations of the items of-ten have been reduced, but students have ample space to work and to respond in the ac-tual NAEP test booklet.
Example 1: Multiple Choice Source: 2005 NAEP 4M12 #2 Grade 4 Percent correct: 53%Number Properties and Operations: Number operations No calculator
A. 3B. 3/6C. 3/0D. 5/6
51
50 50Multiple choice
Constructed response
Correct answer: B

Example 2: Multiple Choice Source: 2005 NAEP 3M4 #13Grade 12 Percent correct: 25%Geometry: Relationships between geometric figures No calculator
Which of the right triangles below could NOT be a 30°-60°-90° triangle?
SHORT CONSTRUCTED-RESPONSE ITEMS
To provide more reliable and valid opportunities for extrapolating about students’ ap-proaches to problems, NAEP assessments include items often referred to as short con-structed-response items. These are short-answer items that require students to give either a numerical result or the correct name or classification for a group of mathematical ob-jects, draw an example of a given concept, or possibly write a brief explanation for a given result. Short constructed-response items may be scored correct/incorrect or par-
52
A.
B.
C.
D.
E.
Correct answer: B
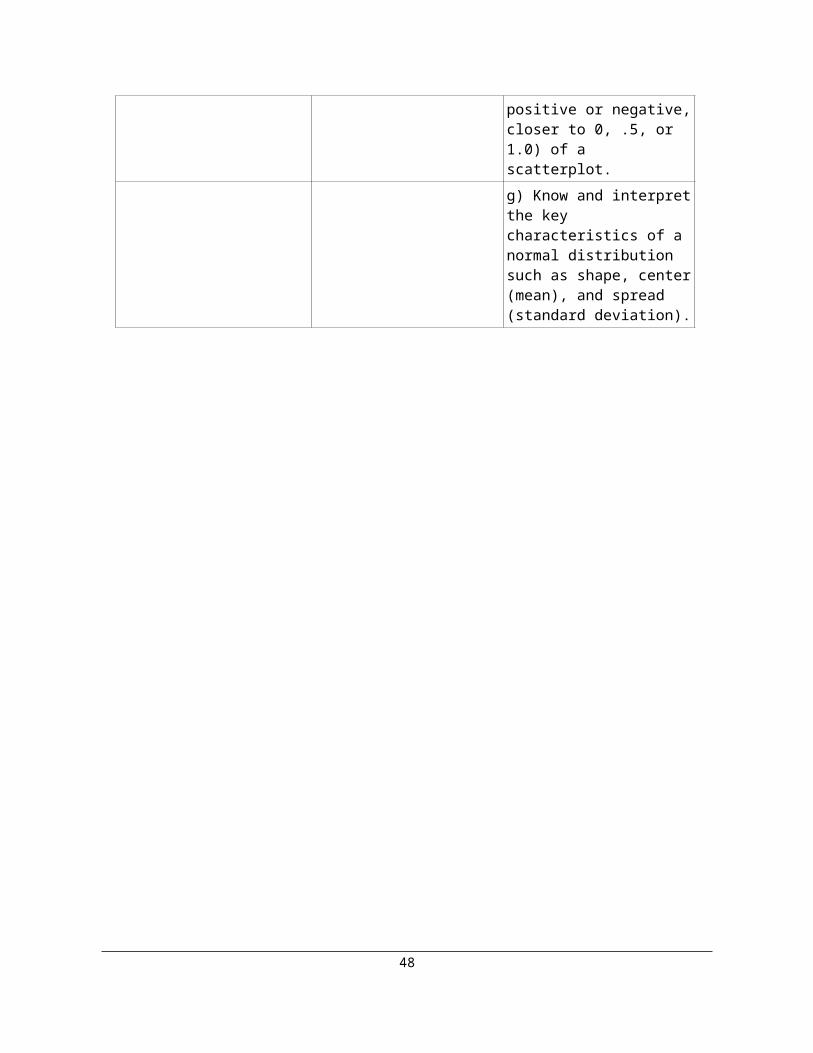
tially correct, depending on the nature of the problem and the information gained from students’ responses.
Example 3: Short Constructed Response Source: 2003 NAEP 8M7 #13Grade 8 Percent correct: 19%Data Analysis, Statistics, and Probability: Characteristics of data sets Calculator available
Score Number of Students90 180 370 460 050 3
The table above shows the scores of a group of 11 students on a history test. What is the average (mean) score of the group to the nearest whole number? Answer: _________________________
The scoring guide below describes one correct answer.
Scoring Guide
1 – Correct response: 69
0 – Incorrect
53

Example 4: Short Constructed Response Source: 2003 NAEP 4M7 #6Grade 4 Percent: 29% (correct ), 51% Al-gebra: Patterns, relations, and functions (incorrect), 17% (partial)
Calculator available
A schoolyard contains only bicycles and wagons like those in the figure below.
On Tuesday, the total number of wheels in the schoolyard was 24. There are several ways this could happen. a. How many bicycles and how many wagons could there be for this to
happen?Number of bicycles ________Number of wagons ________
b. Find another way that this could happen.Number of bicycles ________Number of wagons ________
Scoring Guide Solution:Any two of the following correct responses:0 bicycles, 6 wagons2 bicycles, 5 wagons4 bicycles, 4 wagons6 bicycles, 3 wagons8 bicycles, 2 wagons10 bicycles, 1 wagon12 bicycles, 0 wagons2 - CorrectTwo correct responses1 - PartialOne correct response, for either part a or part bORSame correct response in both parts0 - Incorrect Any incorrect or incomplete response
54

EXTENDED CONSTRUCTED-RESPONSE ITEMS
Extended constructed-response items require students to consider a situation that requires more than a numerical response or a short verbal communication. Extended constructed re-sponse items have more parts to the response and the student is expected to take more time to complete them. The student may be asked, for example, to describe a situation, analyze a graph or table of values or an algebraic equation, or compute specific numerical values. Ex-tended constructed response items are scored at either four or five levels.
Example 5: Extended Constructed Response Source: 2005 NAEP 8M3 #18Grade 8 Percent correct: 9% (extended credit), Measurement: Measuring physical attributes 5% (satisfactory), 4% (partial),
5% (minimal)No calculator
The floor of a room in the figure above is to be covered with tiles. One box of floor tiles will cover 25 square feet. Use your ruler to determine how many boxes of these tiles must be bought to cover the entire floor.
___________ boxes of tiles__________________________________________________
55
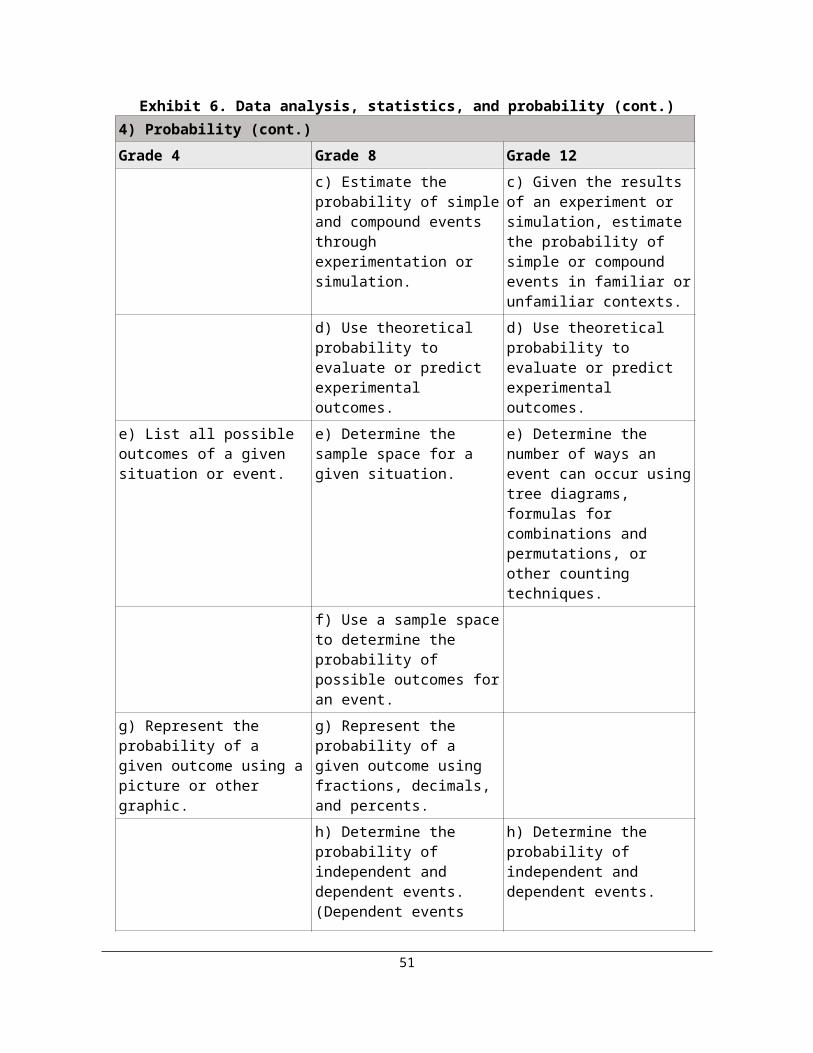
The scoring guide has five possible levels ranging from the most complete and mathe-matically correct response to a response that was incorrect.
Scoring Guide Solution:
7 boxesCorrect process for solution includes evidence of each of the following (may be implied
or explicit):a) measuring dimensions correctly (getting 2.5 inches and 4 inches) (if centimeters are used the measure must be exact)b) converting to feet correctly (getting 10 feet and 16 feet)c) finding the area (160 square feet)d) dividing by 25 to find the number of boxes (6.4)
(Note: Steps b and c may be interchanged; if done this would yield 10 square inches and 160 square feet, respectively)
4 - ExtendedCorrect response
3 - SatisfactoryResponse contains correct complete process as outlined above (a through d) but has a minor error (such as dimensions, in inches, are measured incorrectly OR the answer to the scale conversion is incorrect OR one other minor computational error OR does not round)
2 - Partial 7 with no explanation OR response contains correct complete process as outlined
above (a through d) but has a major conceptual error (such as use of incorrect conver-sion factor or use of perimeter, 52, instead of area) OR perceives the floor as a square and performs all 4 steps
1 - Minimal6.4 with no explanation
ORMeasures 2.5 inches and 4 inches correctly and gets 10 square inches for area
ORMeasures 2.5 inches correctly and converts correctly to 10 feet and 16 feet (may also indicate area is 160 square feet.)
0 - Incorrect Any incorrect response
56

SCORING CONSTRUCTED-RESPONSE ITEMS
Since 1996, each constructed-response item has had a unique scoring guide that defines the criteria used to evaluate students’ responses. Many of the short constructed-response items are rated according to guides that permit partial credit as seen previously in Exam-ple 4: Short constructed-response. Other short constructed-response items are scored as either correct or incorrect.
The extended constructed-response items are evaluated with scoring guides refined from a sample of actual student responses from pilot testing. The scoring guide used follows a multiple-point format similar to one shown for Example 5: Extended Constructed Re-sponse in this chapter.
Additional information about the NAEP mathematics assessment can be found at www.-nagb.org and nces.ed.gov/nationsreportcard, including additional samples of each of the item types described in this chapter.
57
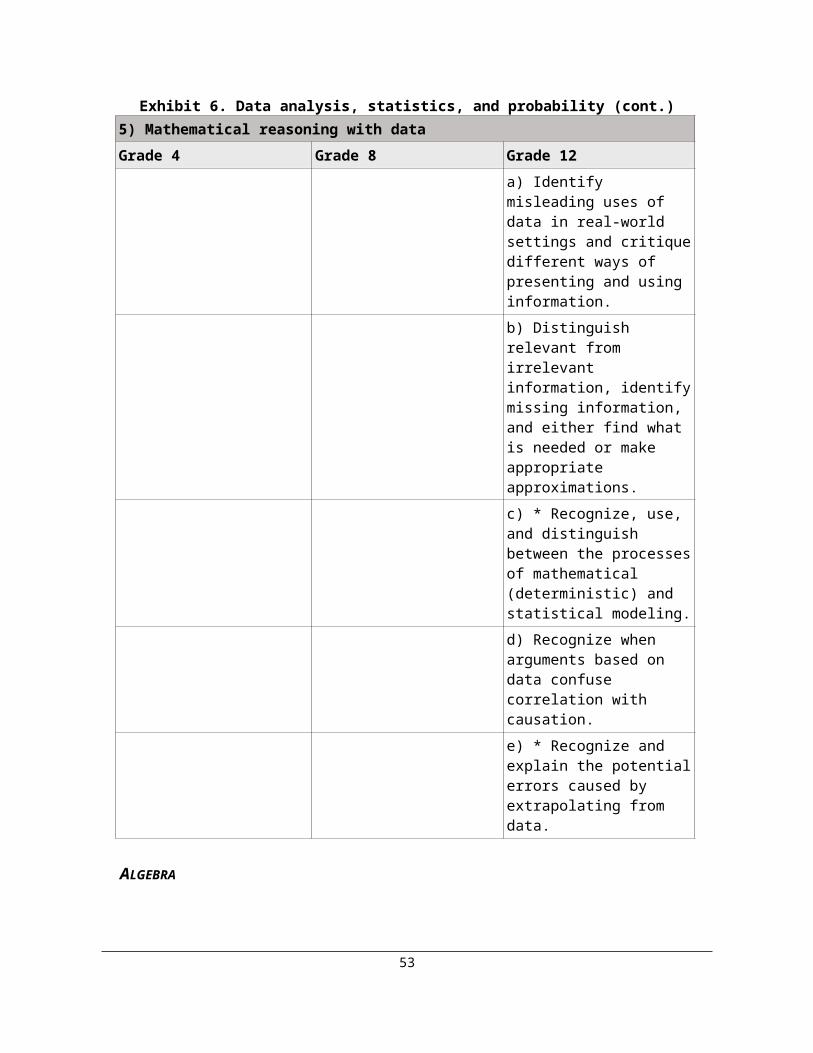
CHAPTER FIVEDESIGN OF TEST AND ITEMS
The NAEP mathematics assessment is complex in its structure. The design of the assess-ment demands that multiple features stay in balance. The test items should adequately cover a broad range of content, balanced at each grade level according to the required dis-tribution for each content area. At the same time, items make differing demands on stu-dents according to how mathematically complex they are. This, too, requires balance. The assessments also need to be balanced according to three item formats: multiple choice, short constructed response, and extended constructed response. An additional balance is-sue involves the mathematical setting of the item, whether it is purely mathematical or set in a real-world context.
Other features of both the test and the items are important in the design of a valid and re-liable assessment. These include how sampling is used in the design of NAEP, the use of calculators, and the use of manipulatives and other tools. Of critical importance is the is-sue of accessibility for all students, which is addressed in several different ways. A final design feature is the use of families of items. This chapter describes each of these features and issues.
BALANCE OF CONTENT
As described in chapter two, each NAEP mathematics item is developed to measure one of the objectives, which are organized into five major content areas. The table below shows the distribution of items by grade and content area. See chapter two for more de-tails.
Exhibit 10. Percent distribution of items by grade and content areaContent Area Grade 4 Grade 8 Grade 12
Number Properties and Operations 40 20 10
Measurement 20 1530
Geometry 15 20
Data Analysis, Statistics, and Probability 10 15 25
Algebra 15 30 35
59

BALANCE OF MATHEMATICAL COMPLEXITY
As described in chapter three, items are classified according to the level of demands they make on students; this is known as mathematical complexity. Each item is considered to be at one of three levels of complexity: low, moderate, or high.
The ideal balance sought for the 2009 NAEP is not necessarily the balance one would wish for curriculum or instruction in mathematics education. Balance here must be con-sidered in the context of the constraints of an assessment such as NAEP. These con-straints include the timed nature of the test and its paper-and-pencil format. Items of high complexity, for example, often take more time to complete. At the same time, some items of all three types are essential to assess the full range of students’ mathematical achieve-ment.
The ideal balance would be that half of the total testing time on the assessment is spent on items of moderate complexity, with the remainder of the total time spent equally on items of low and high complexity. This balance would apply for all three grade levels.
Exhibit 11. Percent of testing time at each level of complexity
BALANCE OF ITEM FORMATS
Items consist of three formats: multiple choice, short constructed response, and extended constructed response (see chapter three for an indepth discussion of each type). Testing time on NAEP is divided evenly between multiple-choice items and both types of con-structed-response items as shown below.
Exhibit 12. Percent of testing time by item formats
The design of the assessment, then, must take into account the amount of time students are expected to spend on each format.
60
50 50Multiple choice
Constructed response
5025Moderate
complexityHigh complexity
25Low complexity

BALANCE OF ITEM CONTEXTS
Just as mathematics can be separated into pure and applied mathematics, NAEP items should seek a balance of items that measure students’ knowledge within both realms. Therefore, some items will deal with purely mathematical ideas and concepts, whereas others will be set in the context of real-world problems.
In the two pairs of examples below, the first item is purely mathematical, whereas the second is set in the context of a real-world problem.
Example Pair 1: Pure Mathematical Setting Source: 2005 NAEP 4M4 #1Grade 4 Percent correct: 76% Number Properties and Operations: Number operations No calculator
Subtract:
972 – 46
Answer: ______________________
Example Pair 1: Contextual Mathematical Setting Source: 2005 NAEP 4M12 #4Grade 4 Percent correct: 80%Number Properties and Operations: Number operations No calculator
There are 30 people in the music room. There are 74 people in the cafeteria. How many more people are in the cafeteria than the music room?
A. 40B. 44C. 54D. 104
Both items involve computation. In the first item the operation is specified. In the other item, the students must interpret the contextual situation, recognizing that it calls for the finding the difference between 74 and 30, and then compute.
61
Correct answer: 926
Correct answer: B
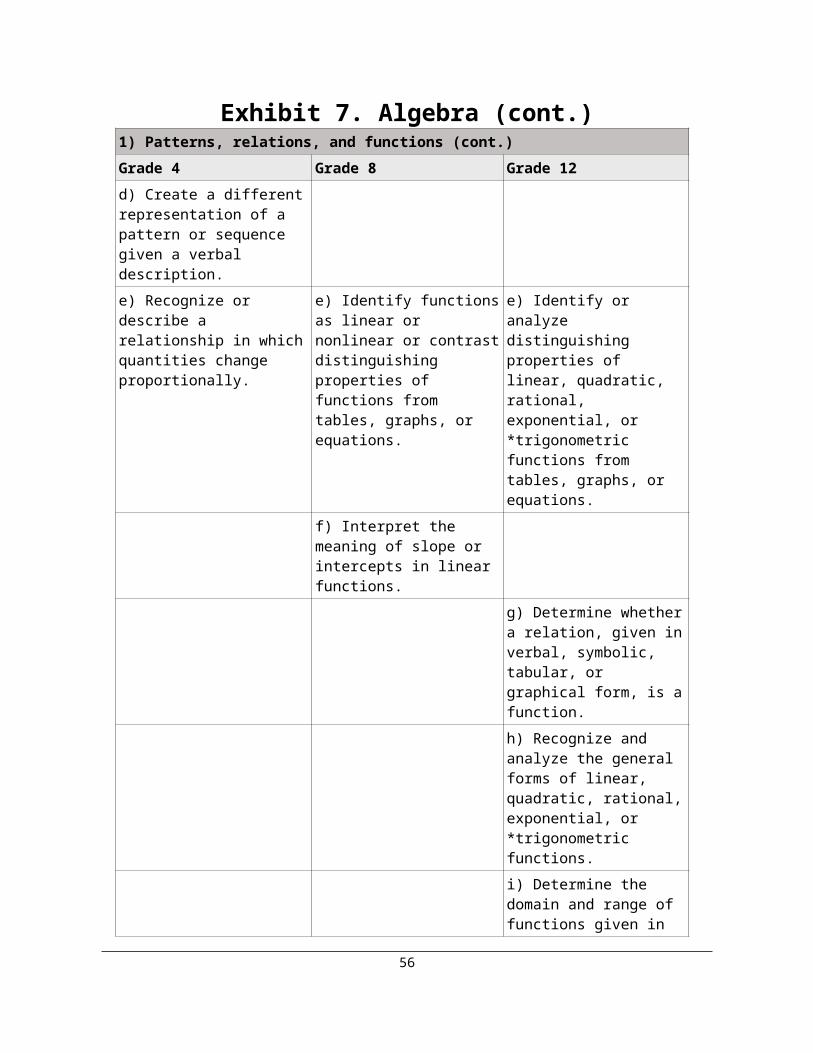
Example Pair 2: Pure Mathematical Setting Modified ItemGrade 12Measurement: Measuring physical attributes Calculator available
In the triangle below feet and °.
What is the length of to the nearest foot? Answer: ____________________
Example Pair 2: Contextual Mathematical Problem Source: 2005 NAEP B3M12#15Grade 12 Percent correct: 41%Measurement: Measuring physical attributes Calculator available
A cat lies crouched on level ground 50 feet away from the base of a tree. The cat can see a bird’s nest directly above the base of the tree. The angle of elevation from the cat to the bird’s nest is 40°. To the nearest foot, how far above the base of the tree is the bird’s nest?
A. 32B. 38C. 42 D. 60E. 65
SAMPLING
The set of content objectives described in chapter two would constitute too many items for a single test given to all students. The design of NAEP, fortunately, allows for matrix sampling. This means that there are multiple forms of the test booklets. Items are distrib-uted across booklets so that students taking part in the assessment do not all receive the same items. In NAEP mathematics, students take two 25-minute blocks (sets of items). Matrix sampling greatly increases the capacity to obtain information across a much broader range of the objectives than would otherwise be possible. Not only items, but also schools and students, are sampled. See the 2009 NAEP Mathematics Assessment and
62
Correct answer: 42 feet
Correct answer: C
A
B
C

Item Specifications for more details about how the representative samples of schools and students are chosen.
CALCULATORS
The assessment contains blocks of items for which calculators are not allowed, and other blocks that contain some items that would be difficult to solve without a calculator. At each grade level, approximately two-thirds of the blocks measure students’ mathematical knowledge and skills without access to a calculator; the other third allow a calculator’s use. The type of calculator students may use varies by grade level, as follows:
At grade 4, a four-function calculator is supplied to students, with training at the time of administration.
At grade 8, a scientific calculator is supplied to students, with training at the time of administration.
At grade 12, students are allowed to bring whatever calculator, graphing or other-wise, they are accustomed to using in the classroom with some restrictions for test security purposes. For students who do not bring a calculator to use on the assess-ment, NAEP will provide a scientific calculator.
No items on the 2009 NAEP at either grade 8 or grade 12 will be designed to provide an advantage to students with a graphing calculator. Estimated time required for any item should be based on the assumption that students are not using a graphing calculator. Items are categorized according to the degree to which a calculator is useful in respond-ing to the item:
A calculator inactive item is one whose solution neither requires nor suggests the use of a calculator.
Example: Calculator Inactive Item Source: 2005 NAEP 8M3 #4Grade 8 Percent correct: 86% Geometry: Transformation of shapes and preservation of properties Calculator available
The paper tube in the figure above is to be cut along the dotted line and opened up. What will be the shape of the flattened piece of paper?
Answer: _________________________
A calculator is not necessary for solving a calculator neutral item; however, given the option, some students might choose to use one.
EXAMPLE: Calculator Neutral Item Source: 2005 NAEP 8M3 #12Grade 8 Percent correct: 60%
63
Correct answers: Rectangle or square

Algebra: Patterns, relations, and functions Calculator available
1 + 3 = 41 + 3 + 5 = 9
1 + 3 + 5 + 7 = 161 + 3 + 5 + 7 + 9 = 25
According to the pattern suggested by the four examples above, how many consecutive odd integers are required to give a sum of 144?
A. 9B. 12C. 15D. 36E. 72
A calculator is necessary or very helpful in solving a calculator active item; a student would find it very difficult to solve the problem without the aid of a calculator.
Example: Calculator Active Item Source: 2005 NAEP 3M12 #15Grade 12 Percent correct: 41%Measurement: Measuring physical attributes Calculator available
A cat lies crouched on level ground 50 feet away from the base of a tree. The cat can see a bird’s nest directly above the base of the tree. The angle of elevation from the cat to the bird’s nest is 40°. To the nearest foot, how far above the base of the tree is the bird’s nest?
A. 32B. 38C. 42D. 60E. 65
MANIPULATIVES AND TOOLS
The assessment uses reasonable manipulative materials, where possible, in measuring students’ ability to represent their understandings and to use tools to solve problems. Such manipulative materials and accompanying tasks are carefully chosen to cause mini-
64
Correct answer: B
Correct answer: C

mal disruption of the test administration process. Examples include number tiles, geomet-ric shapes, rulers, and protractors.
In the following example, number tiles are provided to the student.
Example: Number Tiles Provided Source: 2005 NAEP 4M4 #11Grade 4 Percent correct: 47% (correct),
42% (partially correct)Number Properties and Operations: Number operations No calculator, tiles provided
This question refers to the number tiles. Please remove the 10 number tiles and the paper strip from your packet and put them on your desk. Audrey used only the number tiles with the digits 2, 3, 4, 6, and 9. She placed one tile in each box below so the difference was 921.
Write the numbers in the boxes below to show where Audrey placed the tiles.
65
Correct answer:
9 6 3
4 2

In the next example, students are provided with a protractor.
Example: Protractor Provided Source: 2005 NAEP 8M3 #2Grade 8 Percent correct: 21%,
47% (partially correct) Measurement: Measuring physical attributes No calculator, protractor provided
The weather service reported a tornado 75° south of west. On the figure below, use your protractor to draw an arrow from P in the direction in which the tornado was sighted.
ACCESSIBILITY
The NAEP mathematics assessment is designed to measure the achievement of students across the nation. Therefore, it should allow students who have learned mathematics in a variety of ways, following different curricula and using different instructional materials; students who have mastered the content to varying degrees; students with disabilities; and students who are English language learners to demonstrate their content knowledge and skill. The related design issue is to determine a reasonable way to measure mathematics in the same way for students who come to the assessment with different experiences, strengths, and challenges, who approach mathematics from different perspectives, and who have different ways of displaying their knowledge and skill.
Two methods NAEP uses to design an accessible assessment program are developing the standard assessment so that it is accessible and providing accommodations for students with special needs. The first is addressed by careful item design. For many students with disabilities and students whose native language is other than English, the standard admin-istration of the NAEP assessment will be most appropriate. For other students with dis-abilities and some English language learners, the NAEP mathematics accommodations policy allows for a variety of accommodations, which can be used alone or in combina-tion. These include, but are not limited to, the following:
66
Correct Answer:

One-on-one testing Small group testing Extended time Oral reading of directions Large-print booklets Bilingual English/Spanish booklets Use of an aide to transcribe responses
For more detailed information about item design and accommodations see Assessment and Item Specifications for the 2009 NAEP Mathematics Assessment.
ITEM FAMILIES
Item families are groups of related items designed to measure the depth of student knowl-edge within a particular content area (vertical item families) or the breadth of student un-derstanding of specific concepts, principles, or procedures across content areas (horizon-tal item families). Within a family, items may cross content areas, vary in mathematical complexity, and cross grade levels.
Using item families in different ways provides for a more indepth analysis of student per-formance than would a collection of discrete, unrelated items. For example, a family of items might be designed to see how students use proportional thinking in different mathe-matical contexts such as geometry, algebra, and measurement. Another family might be designed to explore students’ knowledge of a concept and their ability to apply that knowledge in increasingly sophisticated problem situations.
67
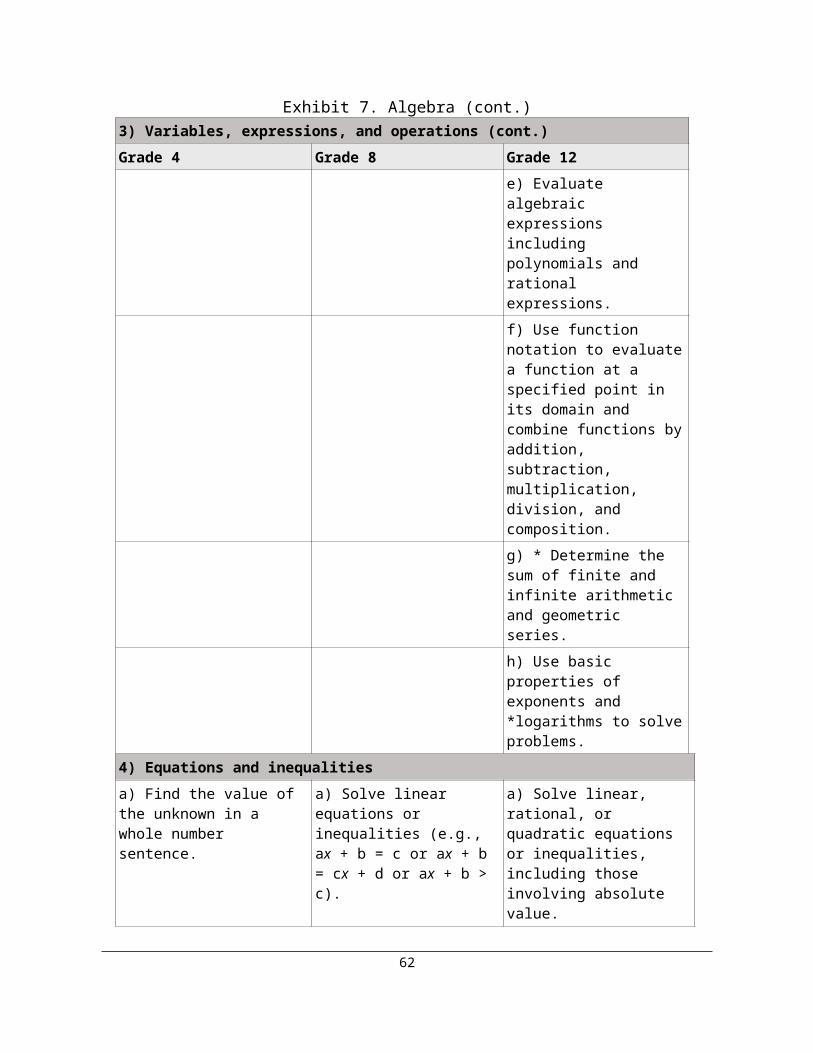
BIBLIOGRAPHYAchieve, Inc. (2000). Foundations for Success: Mathematics for the Middle Grades (consul-
tation draft). Washington, DC: Mathematics Achievement Partnership.Anderson, N.E., F.F. Jenkins, and K.E. Miller (1995). NAEP Inclusion Criteria and Testing
Accommodations: Findings From the NAEP 1995 Field Test in Mathematics. Princeton, NJ: Educational Testing Service.
Blank, R., L.D. Wilson. (1999). Improving Mathematics Education Using Results From NAEP and TIMSS. Washington, DC: Council of Chief State School Officers.
Bourque, M.L., and S. Byrd. (2000). Student Performance Standards on the National Assess-ment of Educational Progress: Affirmation and Improvements. Washington, DC: Na-tional Assessment Governing Board.
Braswell, J., A. Lutkus, W. Grigg, S. Santapau, B. Tay-Lim, and M. Johnson. (August 2001). The Nation’s Report Card: Mathematics 2000. Washington, DC: National Center for Ed-ucation Statistics.
Carlson, J.E., A.D. Lutkus, J. Mazzeo, and K.E. Voelkl (2000). Increasing the Participation of Special Needs Students in NAEP. Jessup, MD: U.S. Department of Education, Office of Educational Research and Improvement.
Council for Basic Education (November 8, 2000). Issues in Mathematics Education Assess-ment: NAEP Mathematics 2005. Washington, DC: Council of Chief State School Offi-cers.
Diperna, P., and T. Loveless. (2000). The Brown Center Report on American Education: How Well Are American Students Learning? Washington, DC: The Brookings Institution.
Dossey, J.A., J. Mazzeo, K.E. Miller, and C.M. Reese. (1997). NAEP 1996 Mathematics Re-port Card for the Nation and the States. Washington, DC: Educational Testing Service and National Center for Education Statistics.
Educational Testing Service (1988). Mathematics Objectives 1990 Assessment. Princeton, NJ: Author.
Findell, B., J. Kilpatrick, and J. Swafford. (2001). Adding It Up: Helping Children Learn Mathematics. Washington, DC: National Research Council.
Kenney, P.A. (1999). An Analysis of the 1996 NAEP Mathematics Framework and Items for grade 8. Pittsburgh, PA: University of Pittsburgh, Learning Research and Development Center.
Kenney, P.A., E.A. Silver, C. Alacaci, and J.S. Zawojewski, J.S. (1998). Content Analysis Project-State and NAEP Mathematics Assessment (final report). Pittsburgh, PA: Univer-sity of Pittsburgh, Learning Research and Development Center.
Mazzeo, J., J. Carlson, K. Voelkl, and A. Lutkus (1999). Increasing the Participation of Spe-cial Needs Students in NAEP: A report on 1996 research Activities (NCES Publication No. 2000-473). Washington, DC: National Center for Education Statistics.
Mitchell, J., E.F. Hawkins, F.B. Stancavage, and J. Dossey (1999). Estimation Skills, Mathe-matics-in-Context, and Advanced Skills in Mathematics. Washington, DC: National Cen-ter for Education Statistics.
Mullis, I.V.S., M.O. Martin,, T.A. Smith, R.A. Garden, K.D. Gregory, E.J. Gonzalez, S.J. Chrostowski, and K.M. O’Connor (2001). TIMSS Assessment Frameworks and Specifica-tions 2003. Boston: Boston College, International Study Center.
69
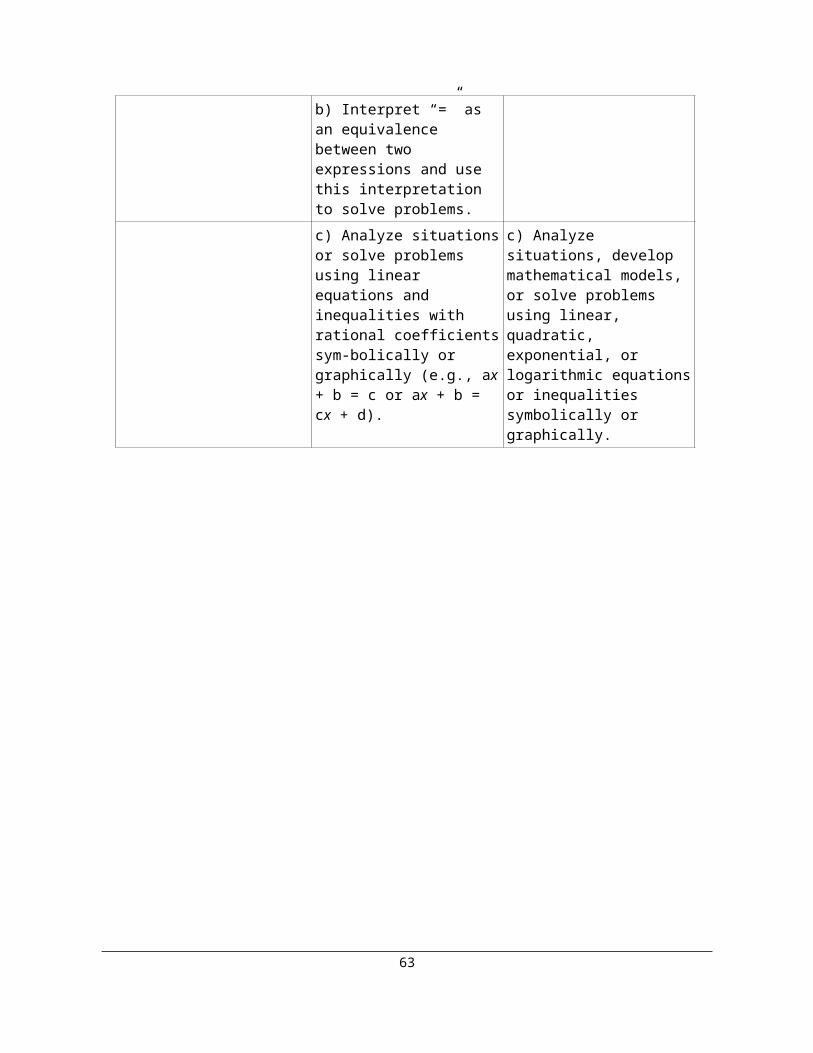
National Assessment Governing Board (2005). 2005 National Assessment of Educational Progress Mathematics Assessment Framework. Washington, DC: Author.
National Assessment Governing Board (2005). 2005 National Assessment of Educational Progress Mathematics Assessment and Item Specifications. Washington, DC: Author.
National Assessment Governing Board (1992). 1994 National Assessment of Educational Progress: Mathematics Assessment Framework and Specifications. Washington, DC: The College Board and Author.
National Assessment Governing Board (1994). Mathematics Framework for the 1996 and 2000 National Assessment of Educational Progress. Washington, DC: Author.
Olson, J.F., and A.A. Goldstein (1997). The Inclusion of Students With Disabilities and Lim-ited English Proficient Students in Large-Scale Assessments: A Summary of Recent Progress (NCES Publication No. 97-482). Washington, DC: National Center for Educa-tion Statistics.
Silver, E., and P. Kenney (eds.) (2000). Results From the Seventh Mathematics Assessment of the National Assessment of Educational Progress. Reston, VA: National Council of Teachers of Mathematics.
U.S. Department of Education (1999). The NAEP Guide: A Description of the Content and Methods of the 1999 and 2000 Assessments. Washington, DC: National Center for Educa-tion Statistics and U.S. Department of Education, Office of Educational Research and Im-provement.
U. S. Department of Education. (2000). Before It’s Too Late. Washington, DC: U.S. Depart-ment of Education, National Commission of Mathematics and Science Teaching for the 21st Century.
70

APPENDIX ANAEP MATHEMATICS ACHIEVEMENT LEVEL DESCRIPTIONS
The achievement levels are cumulative; therefore, students performing at the Proficient level also display the competencies associated with the Basic level, and students at the Advanced level also demonstrate the skills and knowledge associated with both the Basic and the Profi-cient levels. The cut score indicating the lower end of the score range for each level is noted in parentheses.
NAEP MATHEMATICS ACHIEVEMENT LEVELS—GRADE 4
Basic(214)
Fourth-grade students performing at the Basic level should show some evidence of understanding the mathematical concepts and procedures in the five NAEP content areas.
Fourth graders performing at the Basic level should be able to estimate and use basic facts to perform simple computations with whole numbers; show some understand-ing of fractions and decimals; and solve some simple real-world problems in all NAEP content areas. Students at this level should be able to use—although not al-ways accurately—four-function calculators, rulers, and geometric shapes. Their written responses are often minimal and presented without supporting information.
Proficient(249)
Fourth-grade students performing at the Proficient level should consistently apply integrated procedural knowledge and conceptual understanding to prob-lem solving in the five NAEP content areas.
Fourth graders performing at the Proficient level should be able to use whole num-bers to estimate, compute, and determine whether results are reasonable. They should have a conceptual understanding of fractions and decimals; be able to solve real-world problems in all NAEP content areas; and use four-function calculators, rulers, and geometric shapes appropriately. Students performing at the Proficient level should employ problem-solving strategies such as identifying and using appro-priate information. Their written solutions should be organized and presented both with supporting information and explanations of how they were achieved.
Advanced (282)
Fourth-grade students performing at the Advanced level should apply inte-grated procedural knowledge and conceptual understanding to complex and nonroutine real-world problem solving in the five NAEP content areas.
Fourth graders performing at the Advanced level should be able to solve complex nonroutine real-world problems in all NAEP content areas. They should display mastery in the use of four-function calculators, rulers, and geometric shapes. These students are expected to draw logical conclusions and justify answers and solution processes by explaining why, as well as how, they were achieved. They should go beyond the obvious in their interpretations and be able to communicate their thoughts clearly and concisely.
71

NAEP MATHEMATICS ACHIEVEMENT LEVELS—GRADE 8
Basic(262)
Eighth-grade students performing at the Basic level should exhibit evidence of conceptual and procedural understanding in the five NAEP content areas. This level of performance signifies an understanding of arithmetic operations—in-cluding estimation—on whole numbers, decimals, fractions, and percents.
Eighth graders performing at the Basic level should complete problems correctly with the help of structural prompts such as diagrams, charts, and graphs. They should be able to solve problems in all NAEP content areas through the appropriate selection and use of strategies and technological tools—including calculators, computers, and geometric shapes. Students at this level also should be able to use fundamental alge-braic and informal geometric concepts in problem solving. As they approach the Proficient level, students at the Basic level should be able to de-termine which of the available data are necessary and sufficient for correct solutions and use them in problem solving. However, these eighth-graders show limited skill in communicating mathematically.
Proficient (299)
Eighth-grade students performing at the Proficient level should apply mathe-matical concepts and procedures consistently to complex problems in the five NAEP content areas. Eighth graders performing at the Proficient level should be able to conjecture, defend their ideas, and give supporting examples. They should understand the connections among fractions, percents, decimals, and other mathematical topics such as algebra and functions. Students at this level are expected to have a thorough understanding of Basic level arithmetic operations—an understanding sufficient for problem solving in practical situations. Quantity and spatial relationships in problem solving and reasoning should be famil-iar to them and they should be able to convey underlying reasoning skills beyond the level of arithmetic. They should be able to compare and contrast mathematical ideas and generate their own examples. These students should make inferences from data and graphs; apply properties of informal geometry; and accurately use the tools of technology. Students at this level should understand the process of gathering and or-ganizing data and be able to calculate, evaluate, and communicate results within the domain of statistics and probability.
Advanced(333)
Eighth-grade students performing at the Advanced level should be able to reach beyond the recognition, identification, and application of mathematical rules in order to generalize and synthesize concepts and principles in the five NAEP con-tent areas. Eighth graders performing at the Advanced level should be able to probe examples and counterexamples in order to shape generalizations from which they can develop models. Eighth graders performing at the Advanced level should use number sense and geometric awareness to consider the reasonableness of an answer. They are ex-pected to use abstract thinking to create unique problem-solving techniques and ex-plain the reasoning processes underlying their conclusions.
72

NAEP MATHEMATICS ACHIEVEMENT LEVELS—GRADE 12
Basic(141)
Twelfth-grade students performing at the Basic level should be able to solve mathematical problems that require the direct application of concepts and pro-cedures in familiar situations.
Students at grade 12 should be able to perform computations with real numbers and estimate the results of numerical calculations. These students should also be able to estimate, calculate, and compare measures and identify and compare properties of two- and three-dimensional figures, and solve simple problems using two-dimen-sional coordinate geometry.
At this level, students should be able to identify the source of bias in a sample and make inferences from sample results; calculate, interpret, and use measures of cen-tral tendency; and compute simple probabilities. They should understand the use of variables, expressions, and equations to represent unknown quantities and relation-ships among unknown quantities. They should be able to solve problems involving linear relations using tables, graphics, or symbols, and solve linear equations involv-ing one variable.
Proficient(176)
Twelfth-grade students performing at the Proficient level should be able to select strategies to solve problems and integrate concepts and procedures. These students should be able to interpret an argument, justify a mathematical process, and make comparisons dealing with a wide variety of mathematical tasks. They should also be able to perform calculations involving similar figures including right triangle trigonometry. They should understand and apply properties of geomet-ric figures and relationships between figures in two and three dimensions.
Students at this level should select and use appropriate units of measure as they ap-ply formulas to solve problems. Students performing at this level should be able to use measures of central tendency and variability of distributions to make decisions and predictions, calculate combinations and permutations to solve problems, and un-derstand the use of the normal distribution to describe real-world situations. Stu-dents performing at the Proficient level should be able to identify, manipulate, graph, and apply linear, quadratic, exponential, and inverse functions (y = k/x); solve routine and non-routine problems involving functions expressed in algebraic, verbal, tabular, and graphical forms; and solve quadratic and rational equations in one variable and solve systems of linear equations.
Advanced(216)
Twelfth-grade students performing at the Advanced level should demonstrate indepth knowledge of the mathematical concepts and procedures represented in the framework. Students should be able to integrate knowledge to solve complex problems and jus-tify and explain their thinking. These students should be able to analyze, make and justify mathematical arguments, and communicate their ideas clearly. Advanced level students should be able to describe the intersections of geometric figures in two and three dimensions, and use vectors to represent velocity and direction. They should also be able to describe the impact of linear transformations and outliers on
73
measures of central tendency and variability, analyze predictions based on multiple data sets, and apply probability and statistical reasoning in more complex problems. Students performing at the Advanced level should be able to solve or interpret sys-tems of inequalities and formulate a model for a complex situation (e.g., exponential growth and decay) and make inferences or predictions using the mathematical model.
74


