21
Mathematics GCSE Higher Student Booklet Year 10 Name....................... Form........
Mathematics GCSE
Higher
Student Booklet Year 10
Name....................... Form........
2
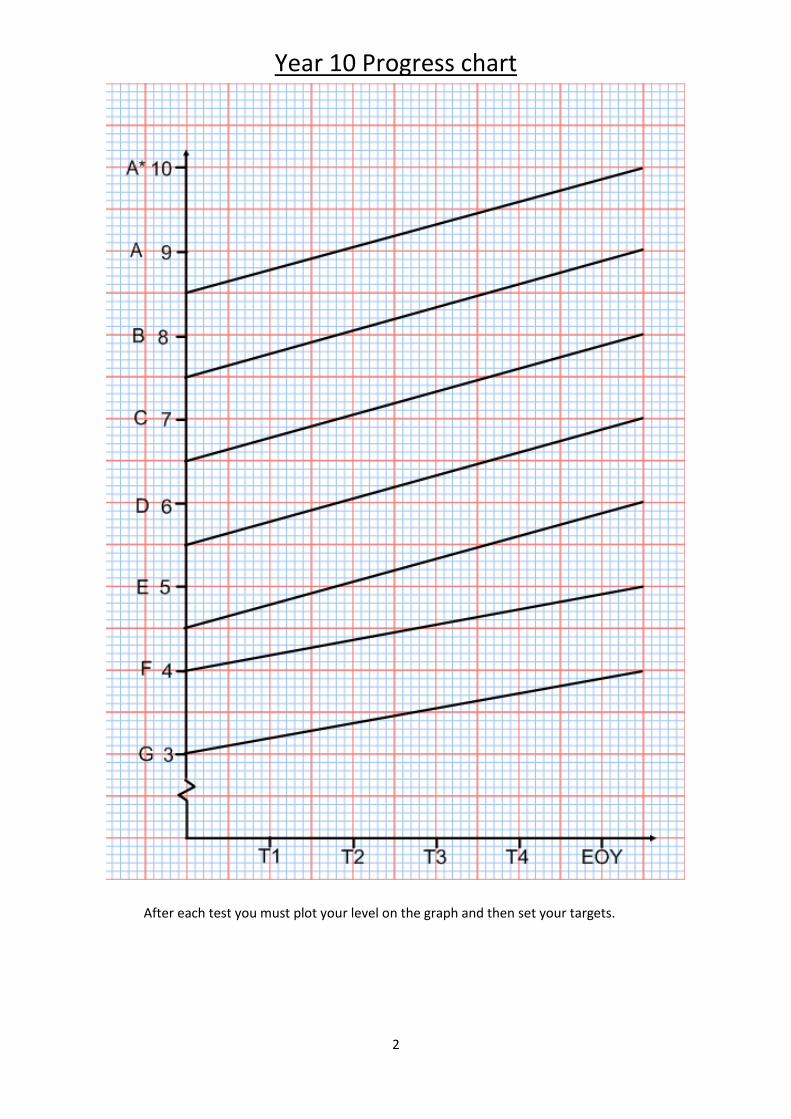
Year 10 Progress chart
After each test you must plot your level on the graph and then set your targets.
3
TEST TARGETS
1
2
3
4
EOY
4
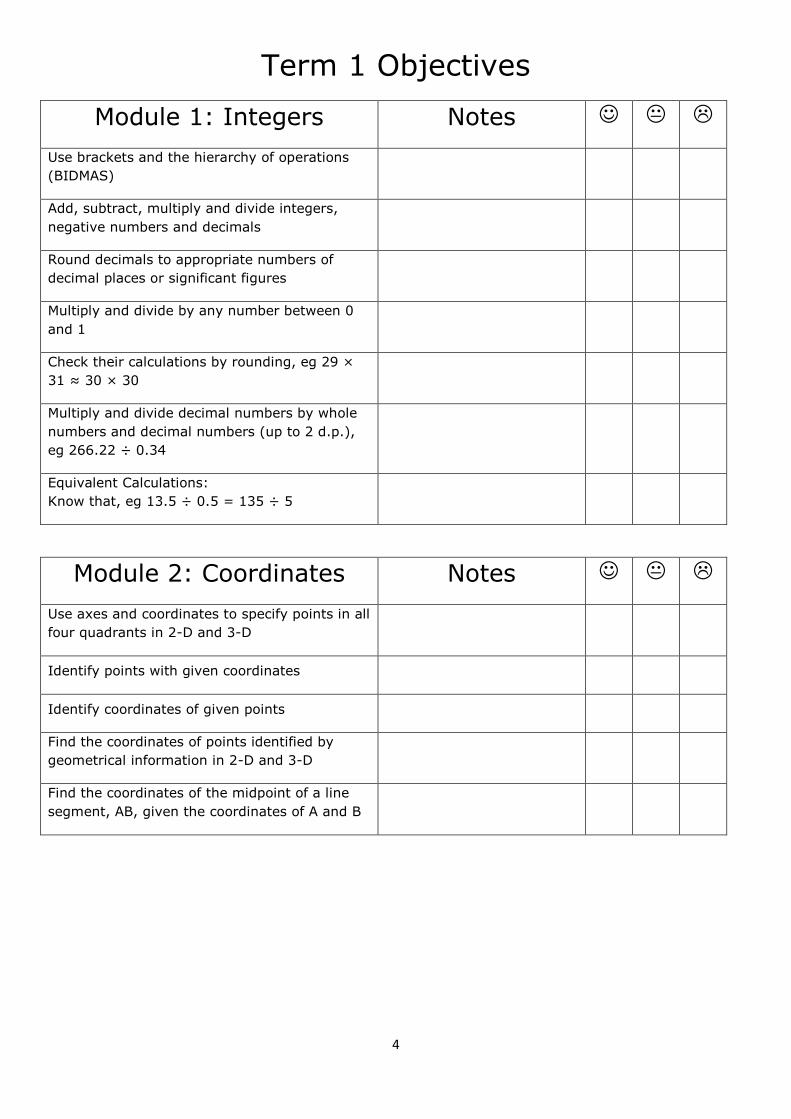
Term 1 Objectives
Module 1: Integers Notes
Use brackets and the hierarchy of operations
(BIDMAS)
Add, subtract, multiply and divide integers,
negative numbers and decimals
Round decimals to appropriate numbers of
decimal places or significant figures
Multiply and divide by any number between 0
and 1
Check their calculations by rounding, eg 29 ×
31 ≈ 30 × 30
Multiply and divide decimal numbers by whole
numbers and decimal numbers (up to 2 d.p.),
eg 266.22 ÷ 0.34
Equivalent Calculations:
Know that, eg 13.5 ÷ 0.5 = 135 ÷ 5
Module 2: Coordinates Notes
Use axes and coordinates to specify points in all
four quadrants in 2-D and 3-D
Identify points with given coordinates
Identify coordinates of given points
Find the coordinates of points identified by
geometrical information in 2-D and 3-D
Find the coordinates of the midpoint of a line
segment, AB, given the coordinates of A and B
5
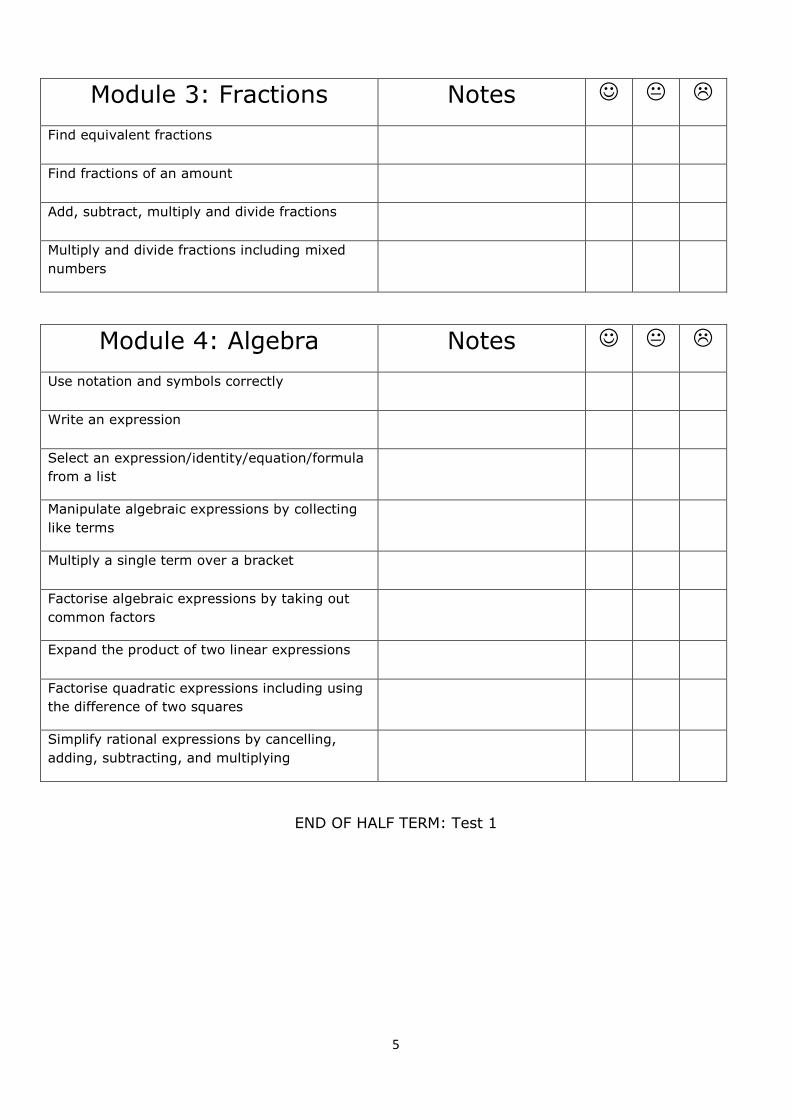
Module 3: Fractions Notes
Find equivalent fractions
Find fractions of an amount
Add, subtract, multiply and divide fractions
Multiply and divide fractions including mixed
numbers
Module 4: Algebra Notes
Use notation and symbols correctly
Write an expression
Select an expression/identity/equation/formula
from a list
Manipulate algebraic expressions by collecting
like terms
Multiply a single term over a bracket
Factorise algebraic expressions by taking out
common factors
Expand the product of two linear expressions
Factorise quadratic expressions including using
the difference of two squares
Simplify rational expressions by cancelling,
adding, subtracting, and multiplying
END OF HALF TERM: Test 1
6
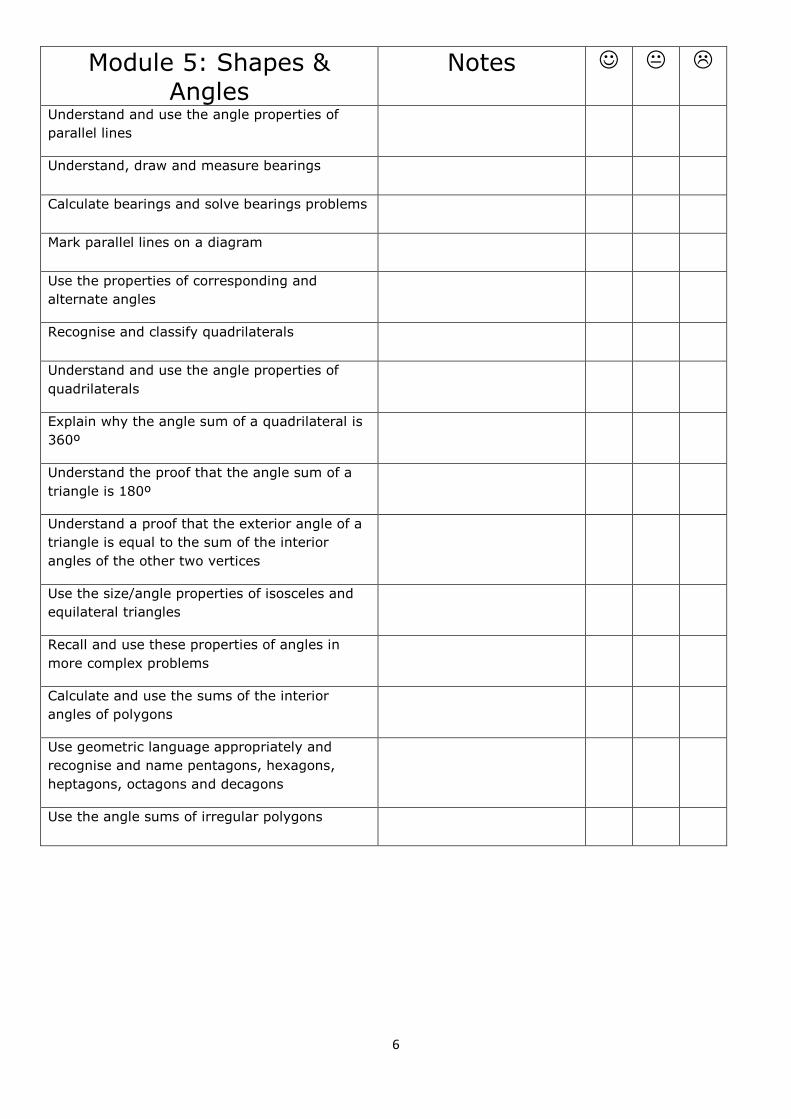
Module 5: Shapes & Angles
Notes
Understand and use the angle properties of
parallel lines
Understand, draw and measure bearings
Calculate bearings and solve bearings problems
Mark parallel lines on a diagram
Use the properties of corresponding and
alternate angles
Recognise and classify quadrilaterals
Understand and use the angle properties of
quadrilaterals
Explain why the angle sum of a quadrilateral is
360º
Understand the proof that the angle sum of a
triangle is 180º
Understand a proof that the exterior angle of a
triangle is equal to the sum of the interior
angles of the other two vertices
Use the size/angle properties of isosceles and
equilateral triangles
Recall and use these properties of angles in
more complex problems
Calculate and use the sums of the interior
angles of polygons
Use geometric language appropriately and
recognise and name pentagons, hexagons,
heptagons, octagons and decagons
Use the angle sums of irregular polygons

7
Calculate and use the angles of regular
polygons
Use the sum of the interior angles of an n sided
polygon
Use the sum of the exterior angles of any
polygon is 360º
Use the sum of the interior angle and the
exterior angle is 180º
Find the size of each interior angle or the size
of each exterior angle or the number of sides of
a regular polygon
Understand tessellations of regular and
irregular polygons and combinations of
polygons
Explain why some shapes tessellate when other
shapes do not
8
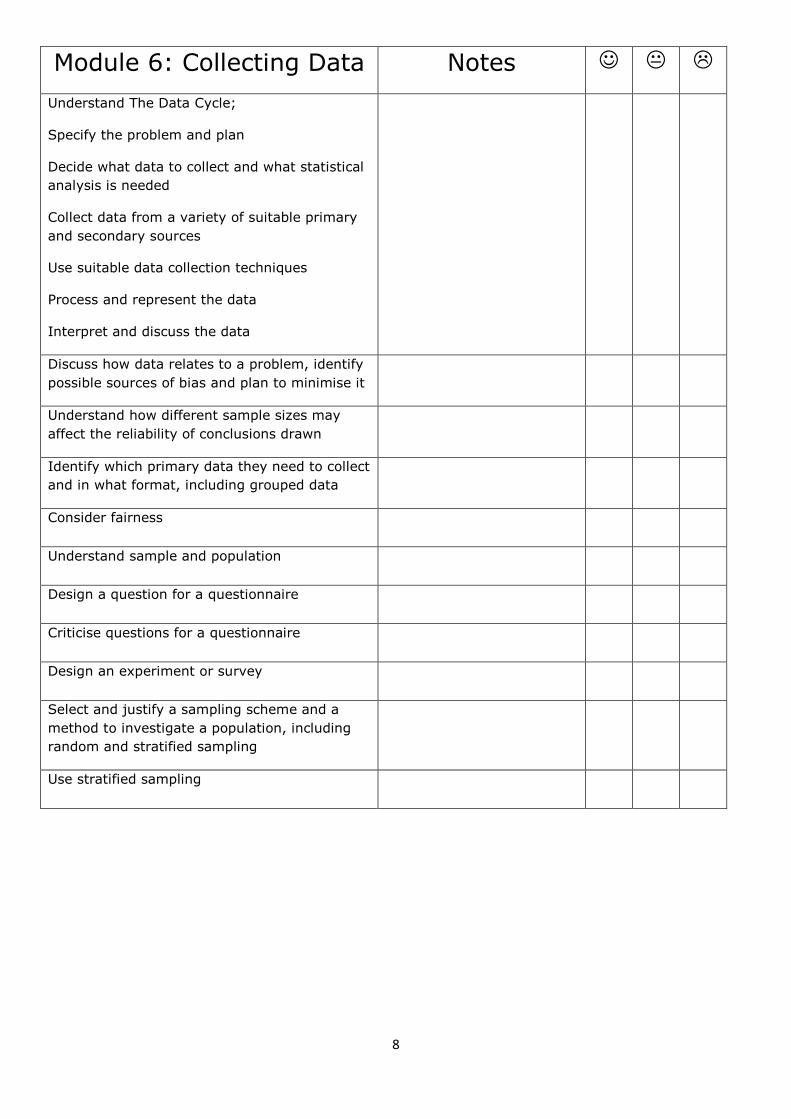
Module 6: Collecting Data Notes
Understand The Data Cycle;
Specify the problem and plan
Decide what data to collect and what statistical
analysis is needed
Collect data from a variety of suitable primary
and secondary sources
Use suitable data collection techniques
Process and represent the data
Interpret and discuss the data
Discuss how data relates to a problem, identify
possible sources of bias and plan to minimise it
Understand how different sample sizes may
affect the reliability of conclusions drawn
Identify which primary data they need to collect
and in what format, including grouped data
Consider fairness
Understand sample and population
Design a question for a questionnaire
Criticise questions for a questionnaire
Design an experiment or survey
Select and justify a sampling scheme and a
method to investigate a population, including
random and stratified sampling
Use stratified sampling
9
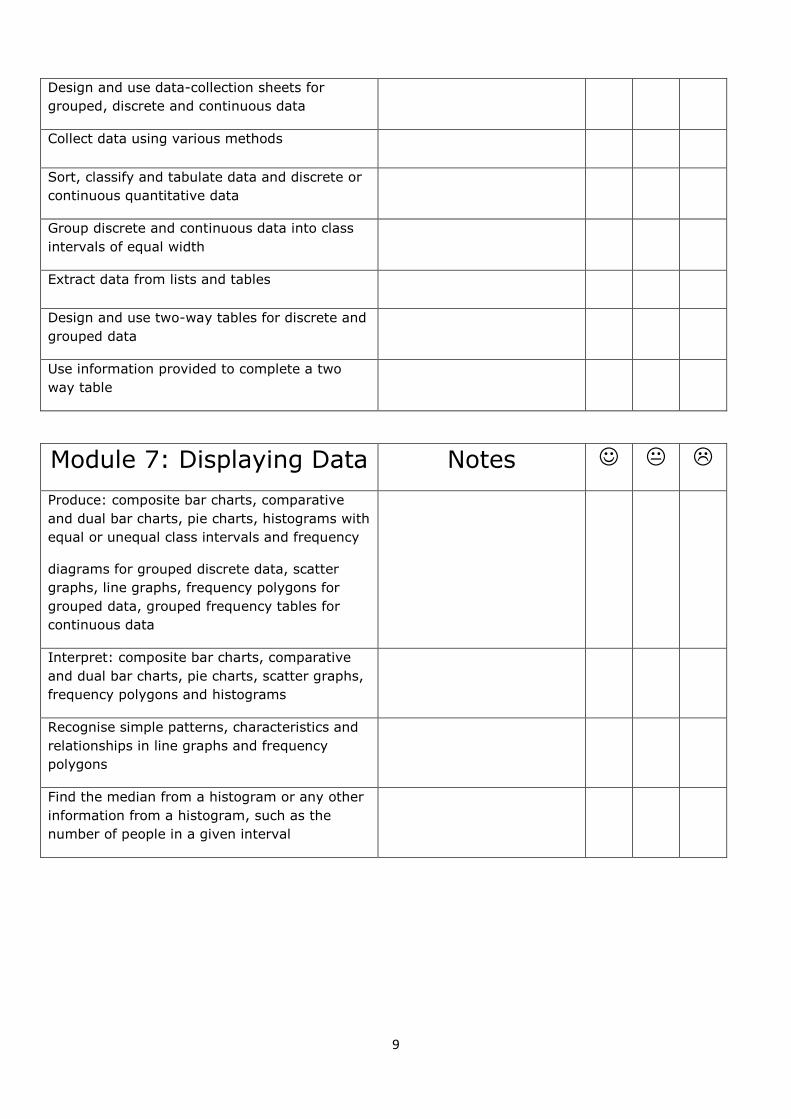
Design and use data-collection sheets for
grouped, discrete and continuous data
Collect data using various methods
Sort, classify and tabulate data and discrete or
continuous quantitative data
Group discrete and continuous data into class
intervals of equal width
Extract data from lists and tables
Design and use two-way tables for discrete and
grouped data
Use information provided to complete a two
way table
Module 7: Displaying Data Notes
Produce: composite bar charts, comparative
and dual bar charts, pie charts, histograms with
equal or unequal class intervals and frequency
diagrams for grouped discrete data, scatter
graphs, line graphs, frequency polygons for
grouped data, grouped frequency tables for
continuous data
Interpret: composite bar charts, comparative
and dual bar charts, pie charts, scatter graphs,
frequency polygons and histograms
Recognise simple patterns, characteristics and
relationships in line graphs and frequency
polygons
Find the median from a histogram or any other
information from a histogram, such as the
number of people in a given interval
10
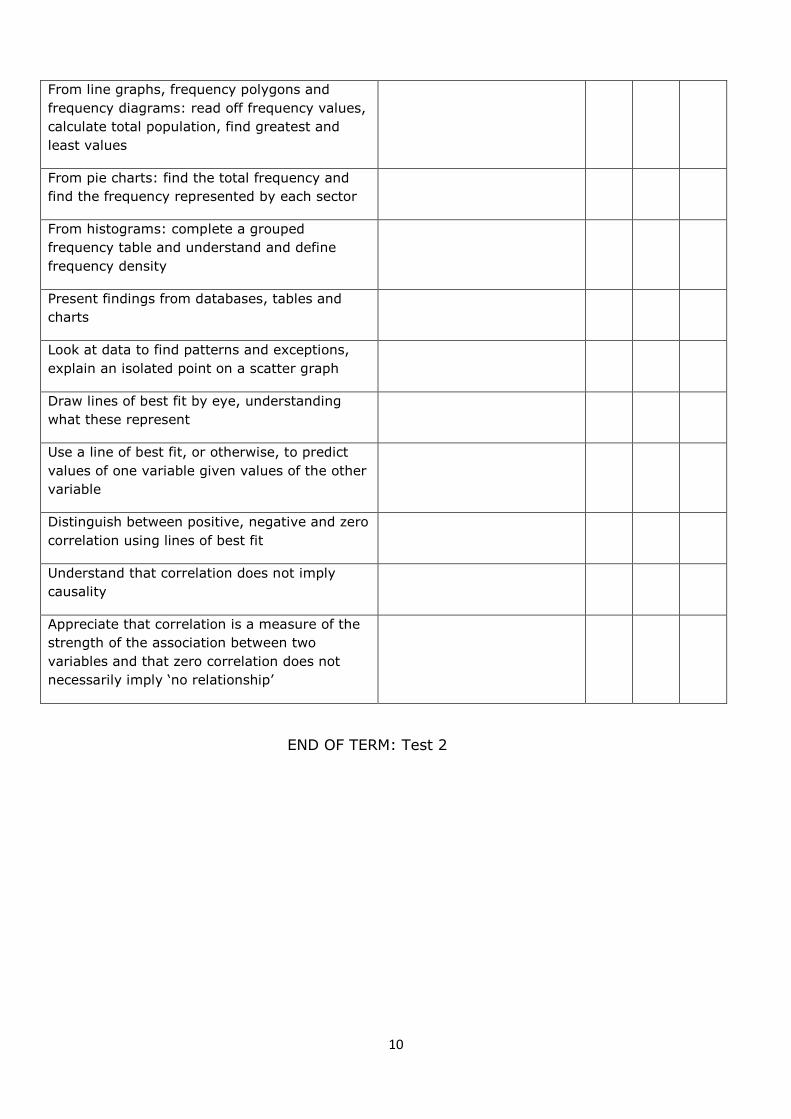
From line graphs, frequency polygons and
frequency diagrams: read off frequency values,
calculate total population, find greatest and
least values
From pie charts: find the total frequency and
find the frequency represented by each sector
From histograms: complete a grouped
frequency table and understand and define
frequency density
Present findings from databases, tables and
charts
Look at data to find patterns and exceptions,
explain an isolated point on a scatter graph
Draw lines of best fit by eye, understanding
what these represent
Use a line of best fit, or otherwise, to predict
values of one variable given values of the other
variable
Distinguish between positive, negative and zero
correlation using lines of best fit
Understand that correlation does not imply
causality
Appreciate that correlation is a measure of the
strength of the association between two
variables and that zero correlation does not
necessarily imply ‘no relationship’
END OF TERM: Test 2
11
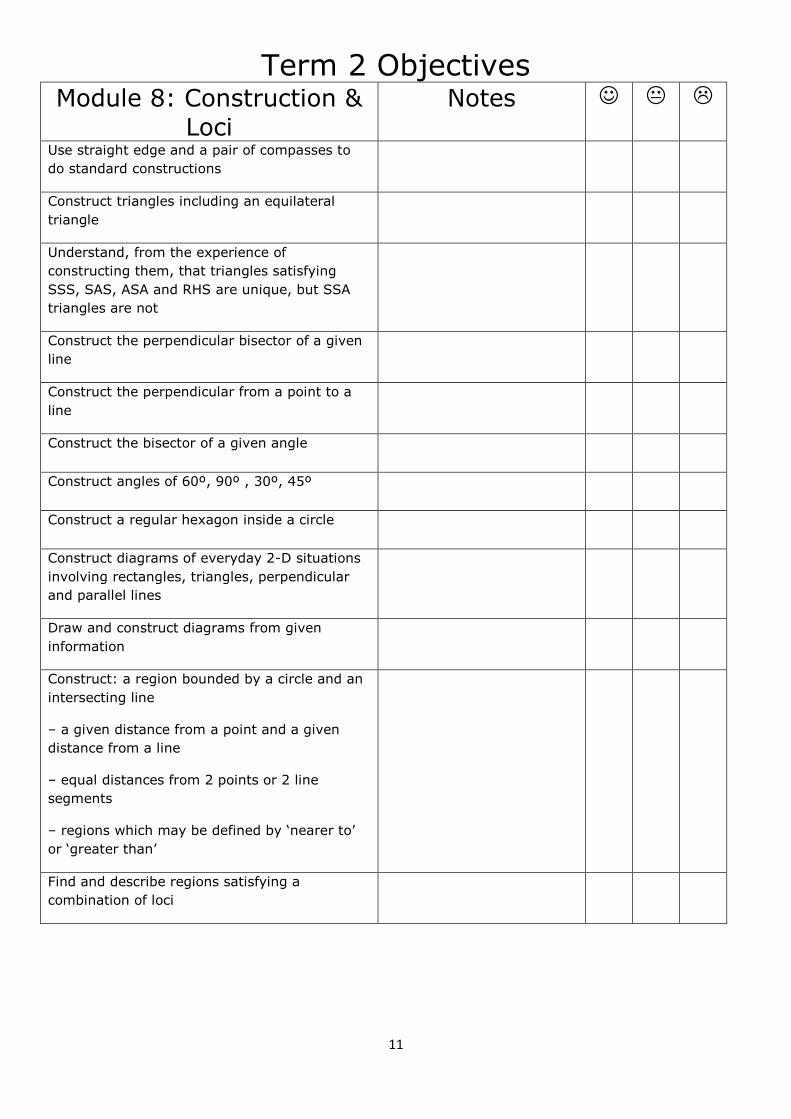
Term 2 Objectives Module 8: Construction &
Loci Notes
Use straight edge and a pair of compasses to
do standard constructions
Construct triangles including an equilateral
triangle
Understand, from the experience of
constructing them, that triangles satisfying
SSS, SAS, ASA and RHS are unique, but SSA
triangles are not
Construct the perpendicular bisector of a given
line
Construct the perpendicular from a point to a
line
Construct the bisector of a given angle
Construct angles of 60º, 90º , 30º, 45º
Construct a regular hexagon inside a circle
Construct diagrams of everyday 2-D situations
involving rectangles, triangles, perpendicular
and parallel lines
Draw and construct diagrams from given
information
Construct: a region bounded by a circle and an
intersecting line
– a given distance from a point and a given
distance from a line
– equal distances from 2 points or 2 line
segments
– regions which may be defined by ‘nearer to’
or ‘greater than’
Find and describe regions satisfying a
combination of loci
12
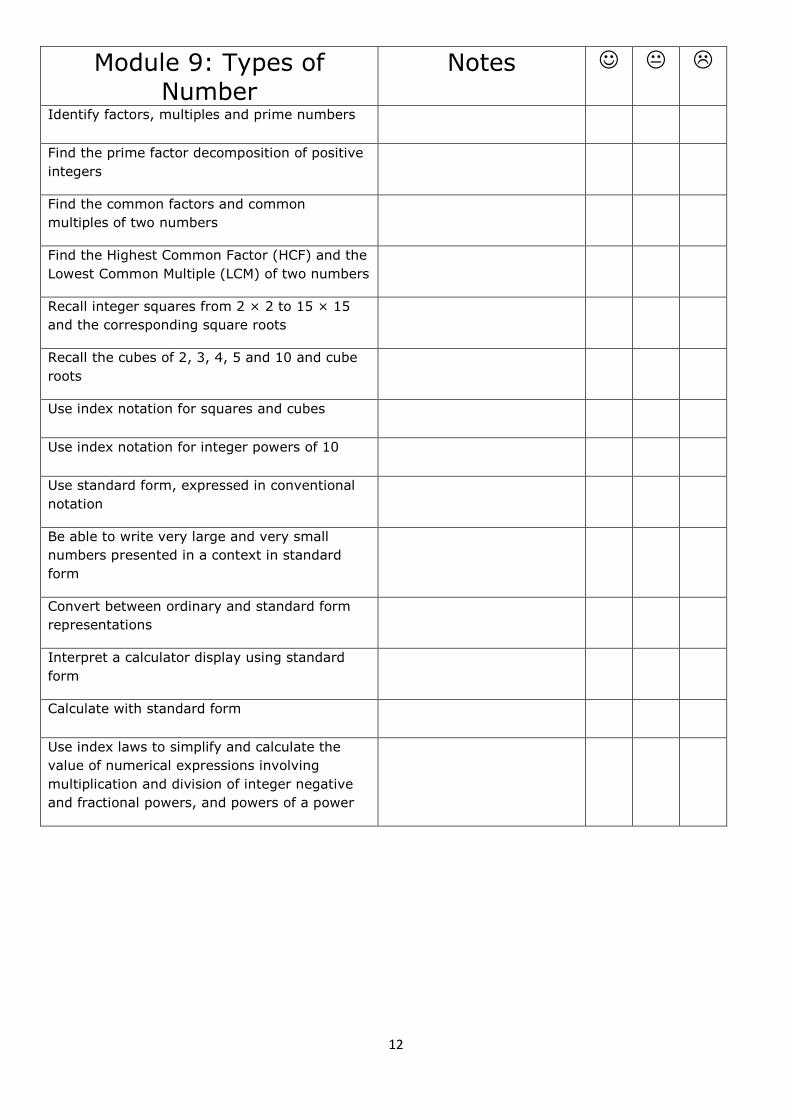
Module 9: Types of Number
Notes
Identify factors, multiples and prime numbers
Find the prime factor decomposition of positive
integers
Find the common factors and common
multiples of two numbers
Find the Highest Common Factor (HCF) and the
Lowest Common Multiple (LCM) of two numbers
Recall integer squares from 2 × 2 to 15 × 15
and the corresponding square roots
Recall the cubes of 2, 3, 4, 5 and 10 and cube
roots
Use index notation for squares and cubes
Use index notation for integer powers of 10
Use standard form, expressed in conventional
notation
Be able to write very large and very small
numbers presented in a context in standard
form
Convert between ordinary and standard form
representations
Interpret a calculator display using standard
form
Calculate with standard form
Use index laws to simplify and calculate the
value of numerical expressions involving
multiplication and division of integer negative
and fractional powers, and powers of a power

13
Module 10: Patterns & Sequences
Notes
Recognise sequences of odd and even numbers
Generate simple sequences of numbers,
squared integers and sequences derived from
diagrams
Describe the term-to-term definition of a
sequence in words
Identify which terms cannot be in a sequence
Generate specific terms in a sequence using the
position-to-term and term-to-term rules
Find the nth term of an arithmetic sequence
Use the nth term of an arithmetic sequence
Module 11: 2D & 3D Shapes
Notes
Use 2-D representations of 3-D shapes
Use isometric grids
Draw nets and show how they fold to make a
3-D solid
Understand and draw front and side elevations
and plans of shapes made from simple solids
Given the front and side elevations and the
plan of a solid, draw a sketch of the 3-D solid
END OF HALF TERM: Test 3

14
Module 12: Perimeter & Area
Notes
Recall and use the formulae for the area of a
triangle, rectangle and a parallelogram
Find the area of a trapezium
Calculate perimeter and area of compound
shapes made from triangles, rectangles and
other shapes
Find the surface area of simple shapes (prisms)
using the formulae for triangles and rectangles,
and other shapes
Find circumferences of circles and areas
enclosed by circles
Recall and use the formulae for the
circumference of a circle and the area enclosed
by a circle
Use π ≈ 3.142 or use the π button on a
calculator
Give an exact answer to a question involving
the area or a circumference of a circle
Find the perimeters and areas of semicircles
and quarter circles
Calculate the lengths of arcs and the areas of
sectors of circles
Find the surface area of a cylinder
Find the area of a segment of a circle given the
radius and length of the chord
Convert between metric units of area

15
Module 13: Fractions, Decimals & Percentages
Notes
Understand that a percentage is a fraction in
hundredths
Convert between fractions, decimals and percentages
Convert between recurring decimals and exact
fractions and use proof
Write one number as a percentage of another
number
Calculate the percentage of a given amount
Find a percentage increase/decrease of an amount
Reverse percentage, eg find the original cost of an
item given the cost after a 10% deduction
Use a multiplier to increase by a given percentage
over a given time , eg 1.18 × 64 increases 64 by 10%
over 8 years
Calculate simple and compound interest
END OF TERM: Test 4
16
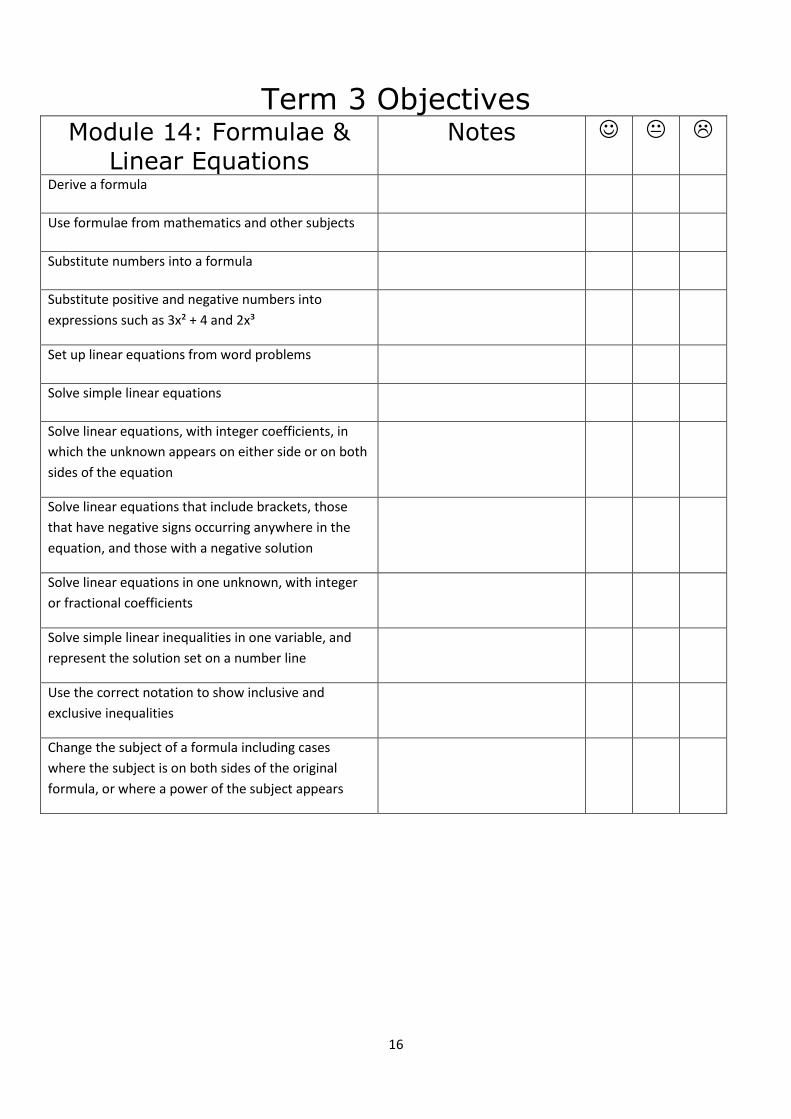
Term 3 Objectives
Module 14: Formulae & Linear Equations
Notes
Derive a formula
Use formulae from mathematics and other subjects
Substitute numbers into a formula
Substitute positive and negative numbers into
expressions such as 3x² + 4 and 2x³
Set up linear equations from word problems
Solve simple linear equations
Solve linear equations, with integer coefficients, in
which the unknown appears on either side or on both
sides of the equation
Solve linear equations that include brackets, those
that have negative signs occurring anywhere in the
equation, and those with a negative solution
Solve linear equations in one unknown, with integer
or fractional coefficients
Solve simple linear inequalities in one variable, and
represent the solution set on a number line
Use the correct notation to show inclusive and
exclusive inequalities
Change the subject of a formula including cases
where the subject is on both sides of the original
formula, or where a power of the subject appears
17
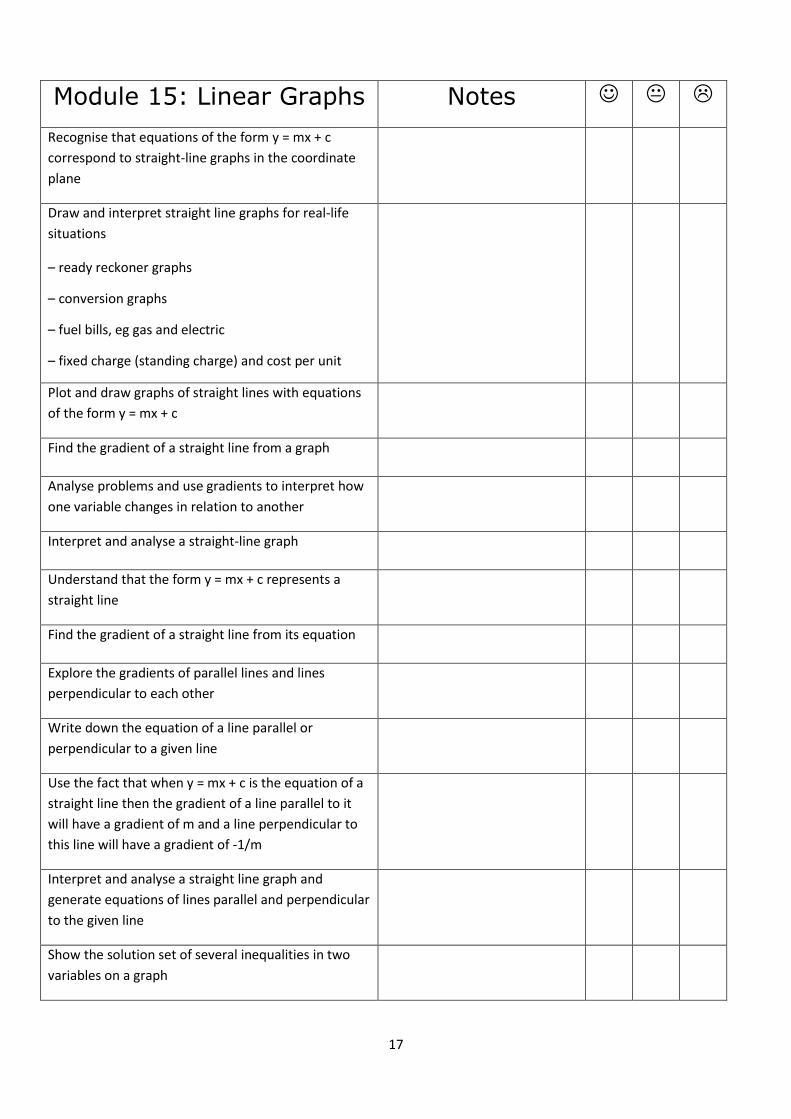
Module 15: Linear Graphs Notes
Recognise that equations of the form y = mx + c
correspond to straight-line graphs in the coordinate
plane
Draw and interpret straight line graphs for real-life
situations
– ready reckoner graphs
– conversion graphs
– fuel bills, eg gas and electric
– fixed charge (standing charge) and cost per unit
Plot and draw graphs of straight lines with equations
of the form y = mx + c
Find the gradient of a straight line from a graph
Analyse problems and use gradients to interpret how
one variable changes in relation to another
Interpret and analyse a straight-line graph
Understand that the form y = mx + c represents a
straight line
Find the gradient of a straight line from its equation
Explore the gradients of parallel lines and lines
perpendicular to each other
Write down the equation of a line parallel or
perpendicular to a given line
Use the fact that when y = mx + c is the equation of a
straight line then the gradient of a line parallel to it
will have a gradient of m and a line perpendicular to
this line will have a gradient of -1/m
Interpret and analyse a straight line graph and
generate equations of lines parallel and perpendicular
to the given line
Show the solution set of several inequalities in two
variables on a graph
18
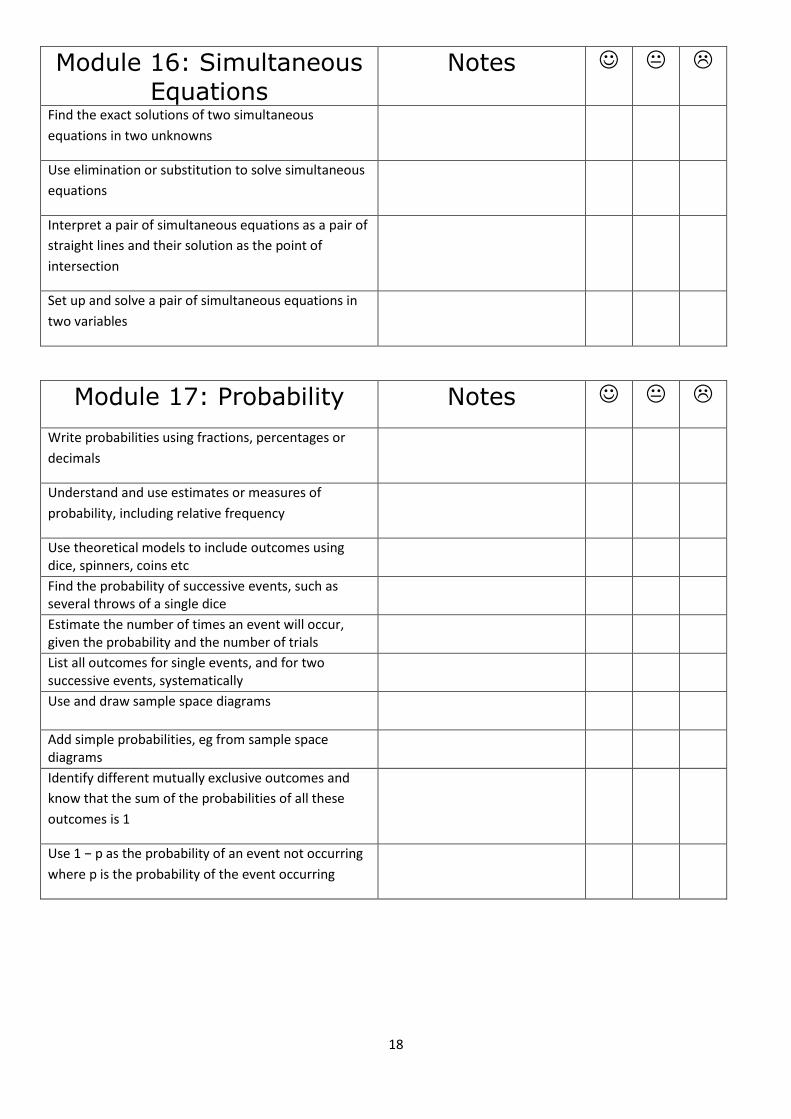
Module 16: Simultaneous Equations
Notes
Find the exact solutions of two simultaneous
equations in two unknowns
Use elimination or substitution to solve simultaneous
equations
Interpret a pair of simultaneous equations as a pair of
straight lines and their solution as the point of
intersection
Set up and solve a pair of simultaneous equations in
two variables
Module 17: Probability Notes
Write probabilities using fractions, percentages or
decimals
Understand and use estimates or measures of
probability, including relative frequency
Use theoretical models to include outcomes using dice, spinners, coins etc
Find the probability of successive events, such as several throws of a single dice
Estimate the number of times an event will occur, given the probability and the number of trials
List all outcomes for single events, and for two successive events, systematically
Use and draw sample space diagrams
Add simple probabilities, eg from sample space diagrams
Identify different mutually exclusive outcomes and
know that the sum of the probabilities of all these
outcomes is 1
Use 1 − p as the probability of an event not occurring
where p is the probability of the event occurring
19
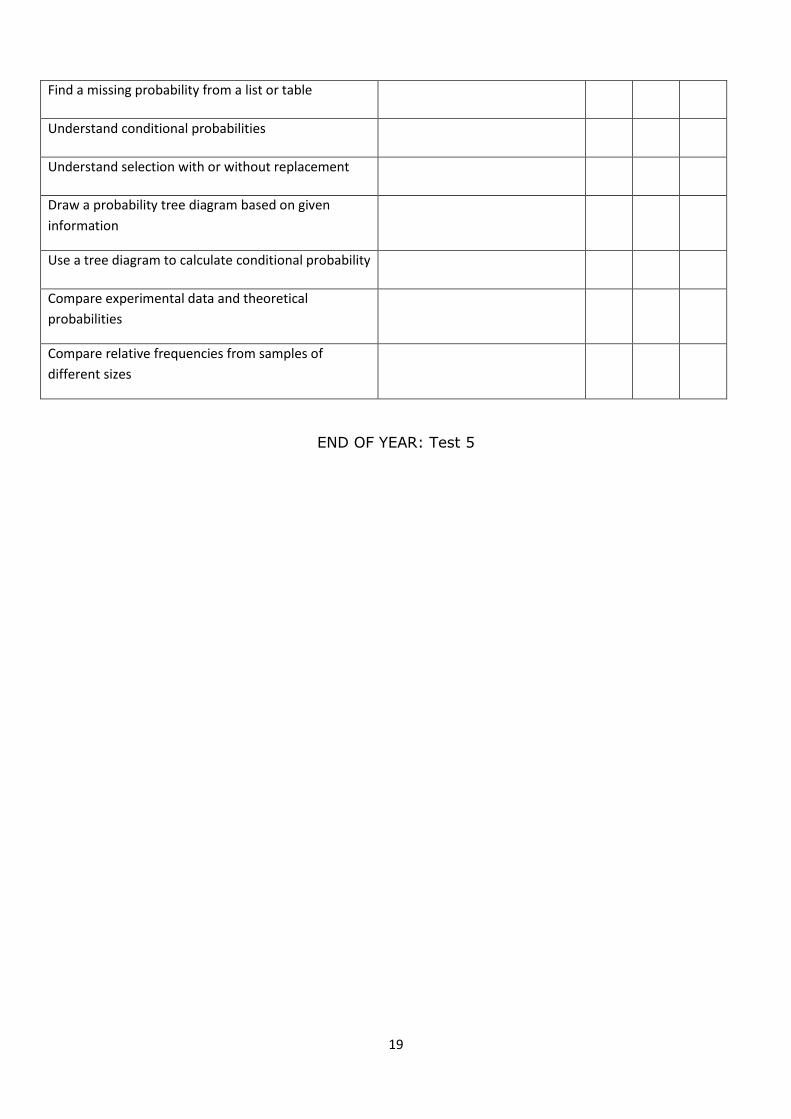
Find a missing probability from a list or table
Understand conditional probabilities
Understand selection with or without replacement
Draw a probability tree diagram based on given
information
Use a tree diagram to calculate conditional probability
Compare experimental data and theoretical
probabilities
Compare relative frequencies from samples of
different sizes
END OF YEAR: Test 5
20
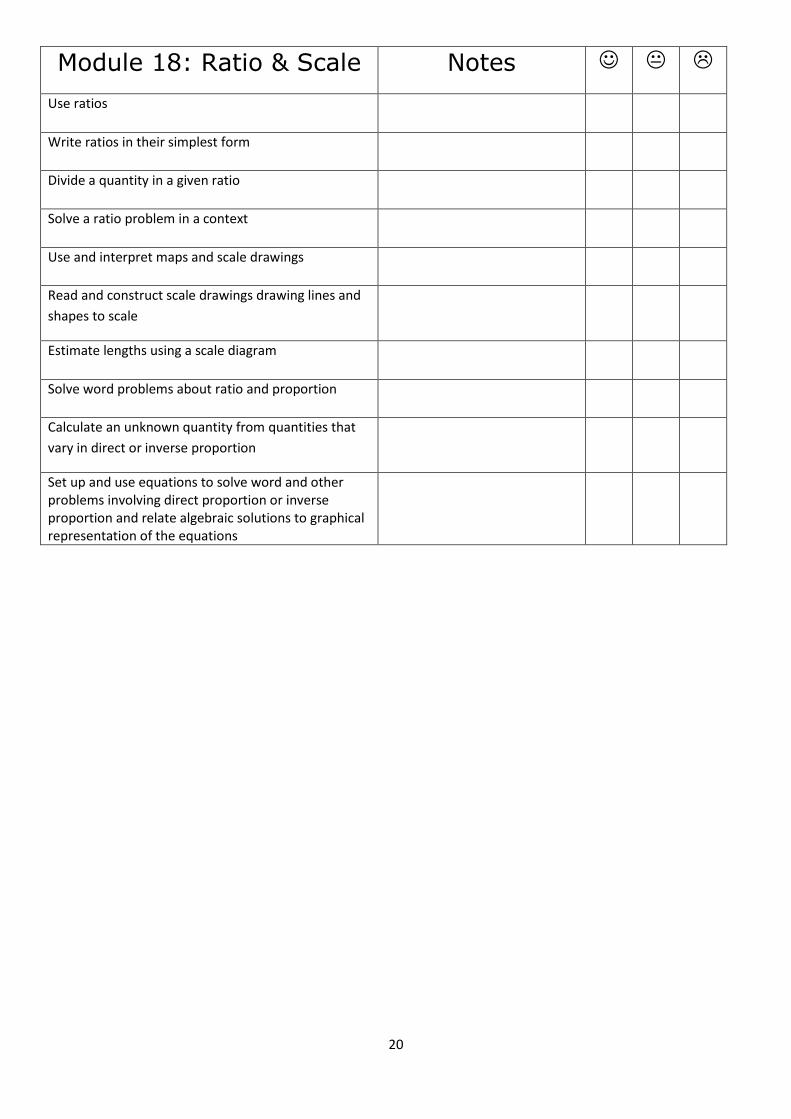
Module 18: Ratio & Scale Notes
Use ratios
Write ratios in their simplest form
Divide a quantity in a given ratio
Solve a ratio problem in a context
Use and interpret maps and scale drawings
Read and construct scale drawings drawing lines and
shapes to scale
Estimate lengths using a scale diagram
Solve word problems about ratio and proportion
Calculate an unknown quantity from quantities that
vary in direct or inverse proportion
Set up and use equations to solve word and other problems involving direct proportion or inverse proportion and relate algebraic solutions to graphical representation of the equations

21
Module 19: Averages & Range
Notes
Calculate mean, mode, median and range for small data sets
Recognise the advantages and disadvantages between measures of average
Produce ordered stem and leaf diagrams and use them to find the range and averages
Calculate averages and range from frequency tables (Use Σx and Σfx)
Estimate the mean for large data sets with grouped data (and understand that it is an estimate)
Draw and interpret cumulative frequency tables and graphs
Use cumulative frequency graphs to find median, quartiles and interquartile range
Draw box plots from a cumulative frequency graph
Compare the measures of spread between a pair of
box plots/cumulative frequency graphs
Interpret box plots to find median, quartiles, range
and interquartile range
Find the median from a histogram
Compare distributions and make inferences, using the
shapes of distributions and measures of average and
spread, including median and quartiles
Find quartile and interquartile range from data
Find modal class and interval containing the median
END OF YEAR 10 WORK


