Solar Integration Workshop, Berlin, 24.10.2017 Mathias Schoeneberger, Sören Patzack, Hendrik Vennegeerts Forschungsgemeinschaft für elektrische Analgen und Stromwirtschaft e.V. (FGH) Marco Lindner, Rolf Witzmann Technical University of Munich (TUM) Derivation of a Q(U)-control tolerance band for inverters in order to meet voltage quality criteria
Transcript
Solar Integration Workshop, Berlin, 24.10.2017
Mathias Schoeneberger, Sören Patzack, Hendrik Vennegeerts
Forschungsgemeinschaft für elektrische Analgen und Stromwirtschaft e.V. (FGH)
Marco Lindner, Rolf Witzmann
Technical University of Munich (TUM)
Derivation of a Q(U)-control toleranceband for inverters in order to meetvoltage quality criteria
FGH e.V. | M. Schoeneberger | Derivation of a Q(U)-control tolerance band in order to meet voltage quality criteria 2
SIW 2016
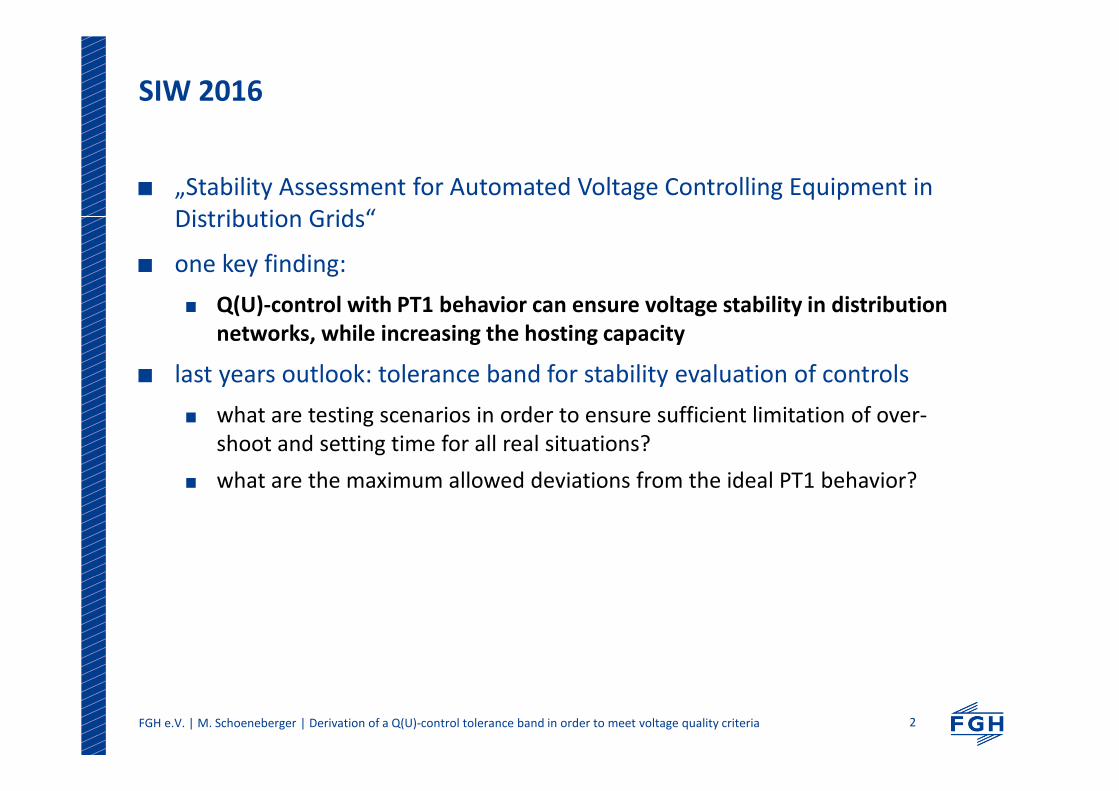
„Stability Assessment for Automated Voltage Controlling Equipment in
Distribution Grids“
one key finding:
Q(U)-control with PT1 behavior can ensure voltage stability in distribution
networks, while increasing the hosting capacity
last years outlook: tolerance band for stability evaluation of controls
what are testing scenarios in order to ensure sufficient limitation of over-
shoot and setting time for all real situations?
what are the maximum allowed deviations from the ideal PT1 behavior?
FGH e.V. | M. Schoeneberger | Derivation of a Q(U)-control tolerance band in order to meet voltage quality criteria 3
SIW 2016
„Stability Assessment for Automated Voltage Controlling Equipment in
Distribution Grids“
one key finding:
Q(U)-control with PT1 behavior can ensure voltage stability in distribution
networks, while increasing the hosting capacity
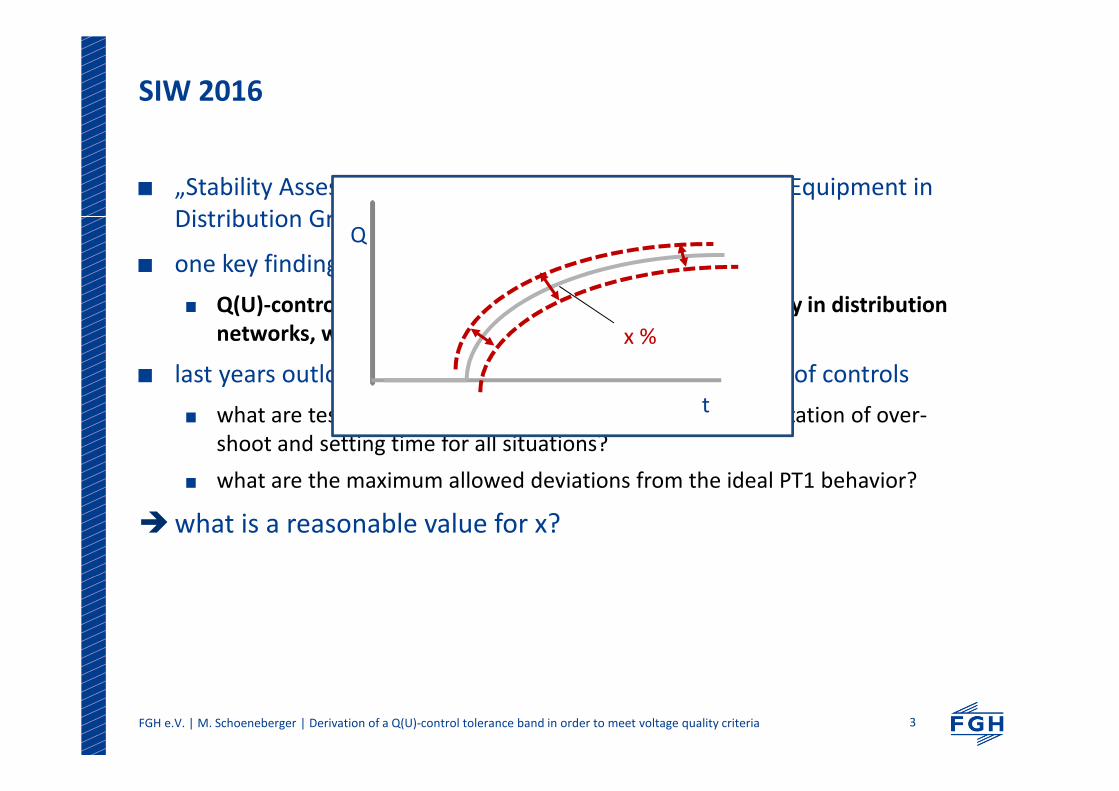
last years outlook: tolerance band for stability evaluation of controls
what are testing scenarios in order to ensure sufficient limitation of over-
shoot and setting time for all situations?
what are the maximum allowed deviations from the ideal PT1 behavior?
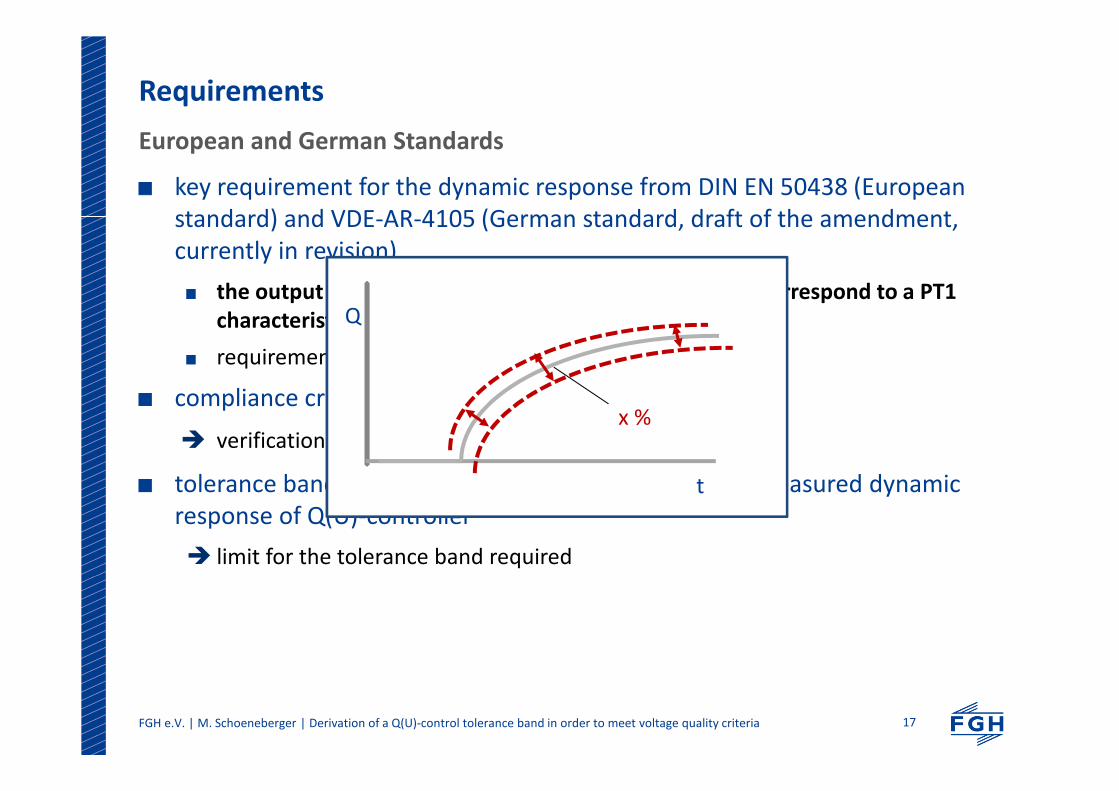
what is a reasonable value for x?
Q
t
x %
FGH e.V. | M. Schoeneberger | Derivation of a Q(U)-control tolerance band in order to meet voltage quality criteria 4
Agenda
motivation for Q(U)-control in distribution networks
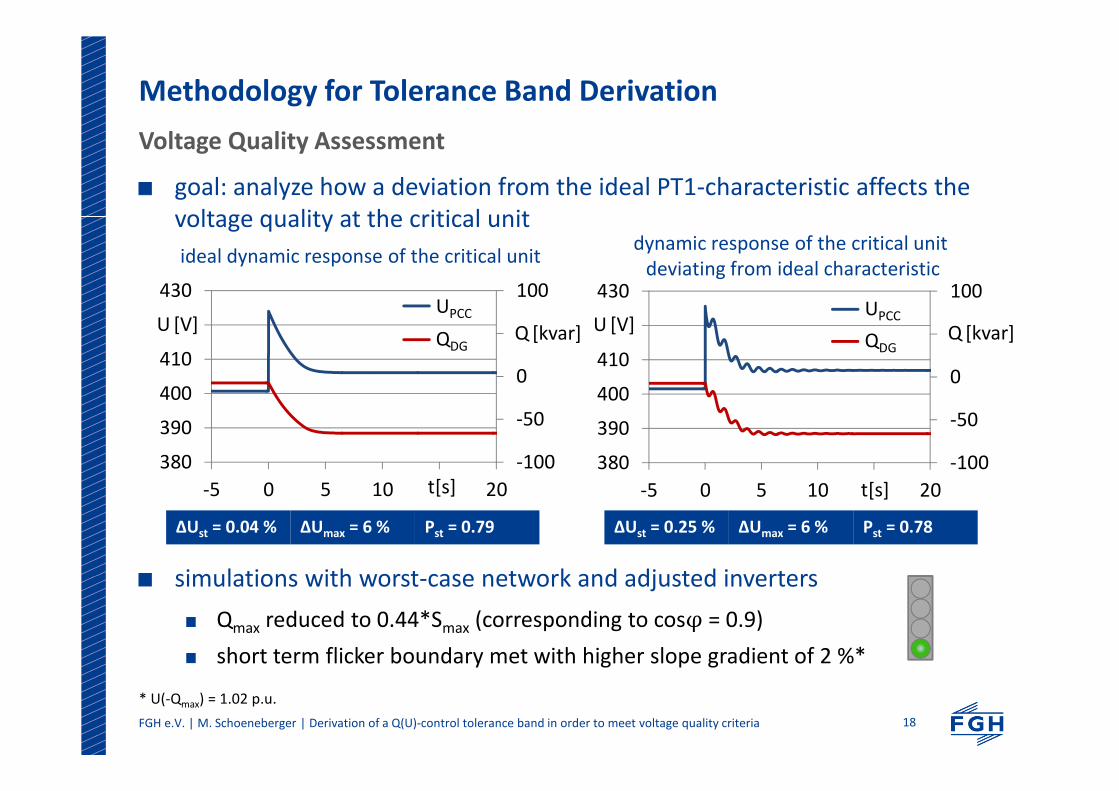
dynamic behavior, stability and voltage quality
requirements in standards for inverters with Q(U)-control
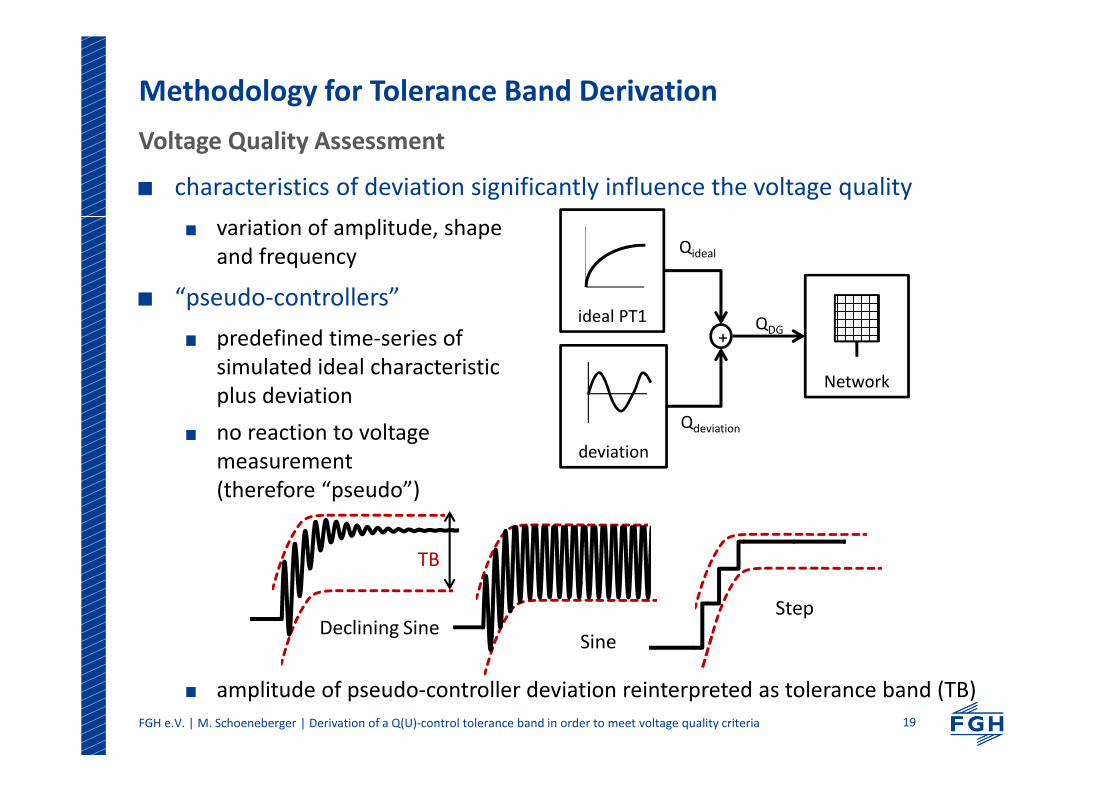
methodology for tolerance band derivation
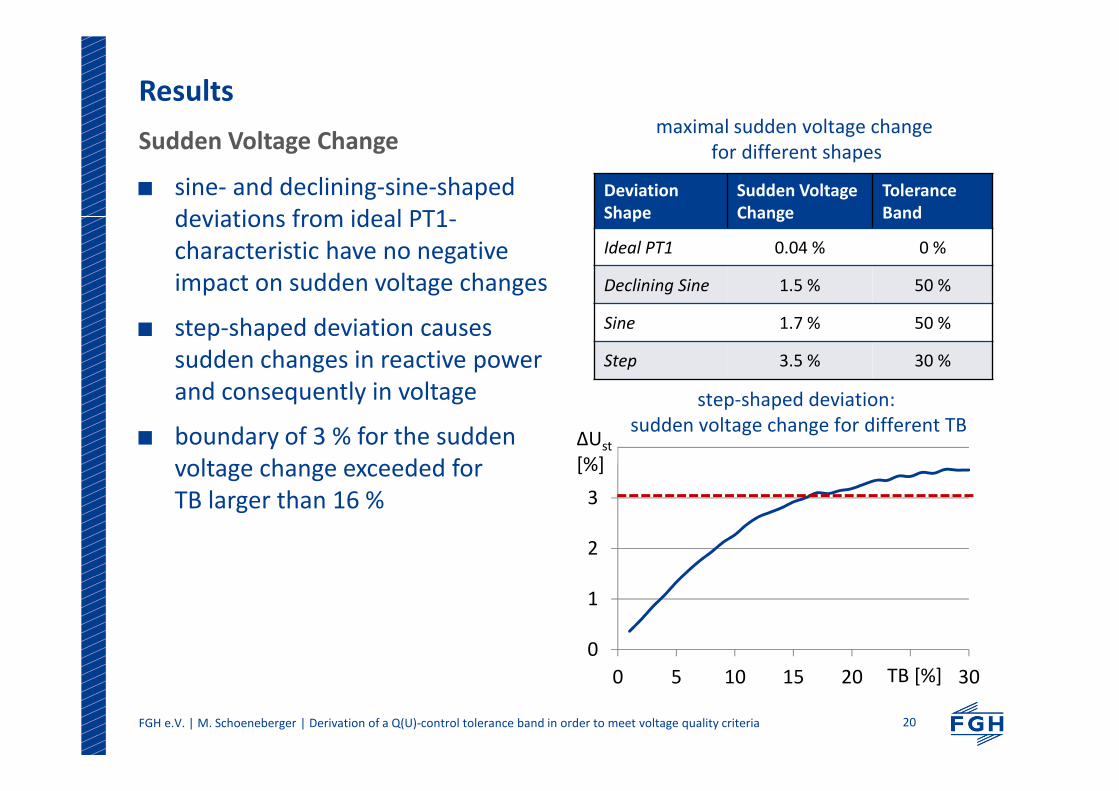
results
FGH e.V. | M. Schoeneberger | Derivation of a Q(U)-control tolerance band in order to meet voltage quality criteria 5
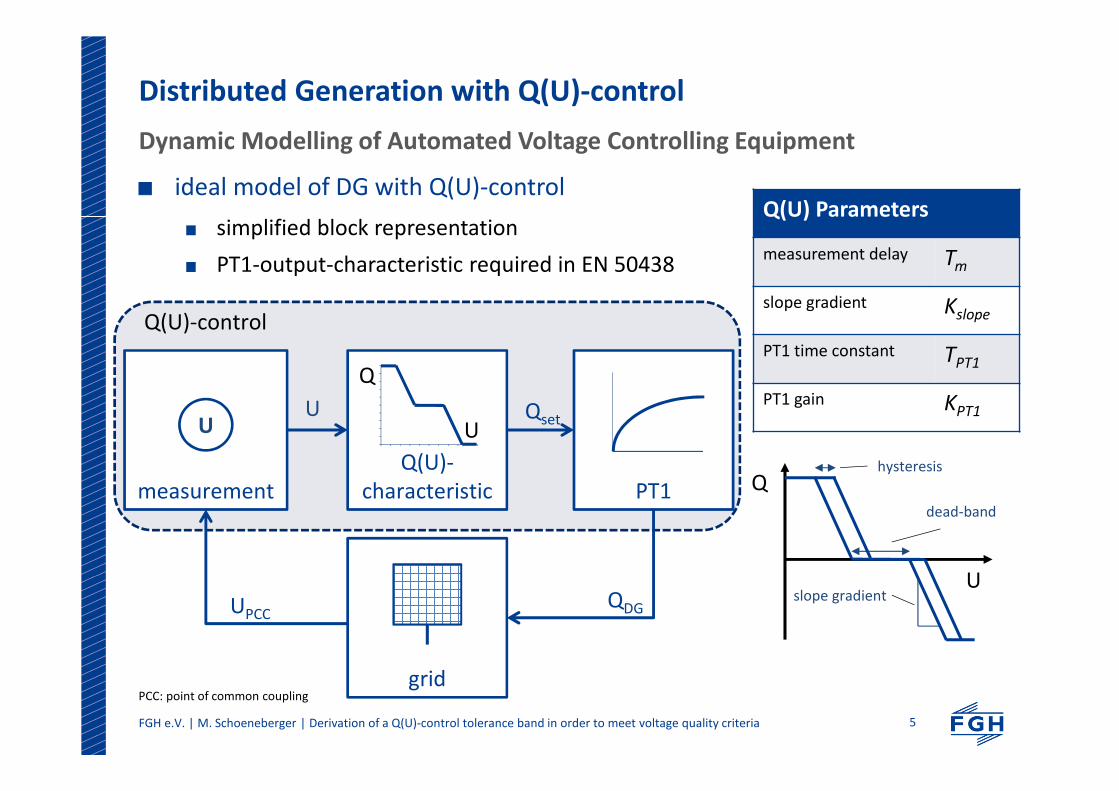
Distributed Generation with Q(U)-control
Dynamic Modelling of Automated Voltage Controlling Equipment
ideal model of DG with Q(U)-control
simplified block representation
PT1-output-characteristic required in EN 50438
slope gradient
hysteresis
Q
U
dead-band
measurement
U
QDGUPCC
Q(U)-
characteristic PT1
grid
U
Q
UQset
Q(U)-control
PCC: point of common coupling
Q(U) Parameters
measurement delay Tm
slope gradient Kslope
PT1 time constant TPT1
PT1 gain KPT1
FGH e.V. | M. Schoeneberger | Stability Assessment for Automated Voltage Controlling Equipment in Distribution Grids 6
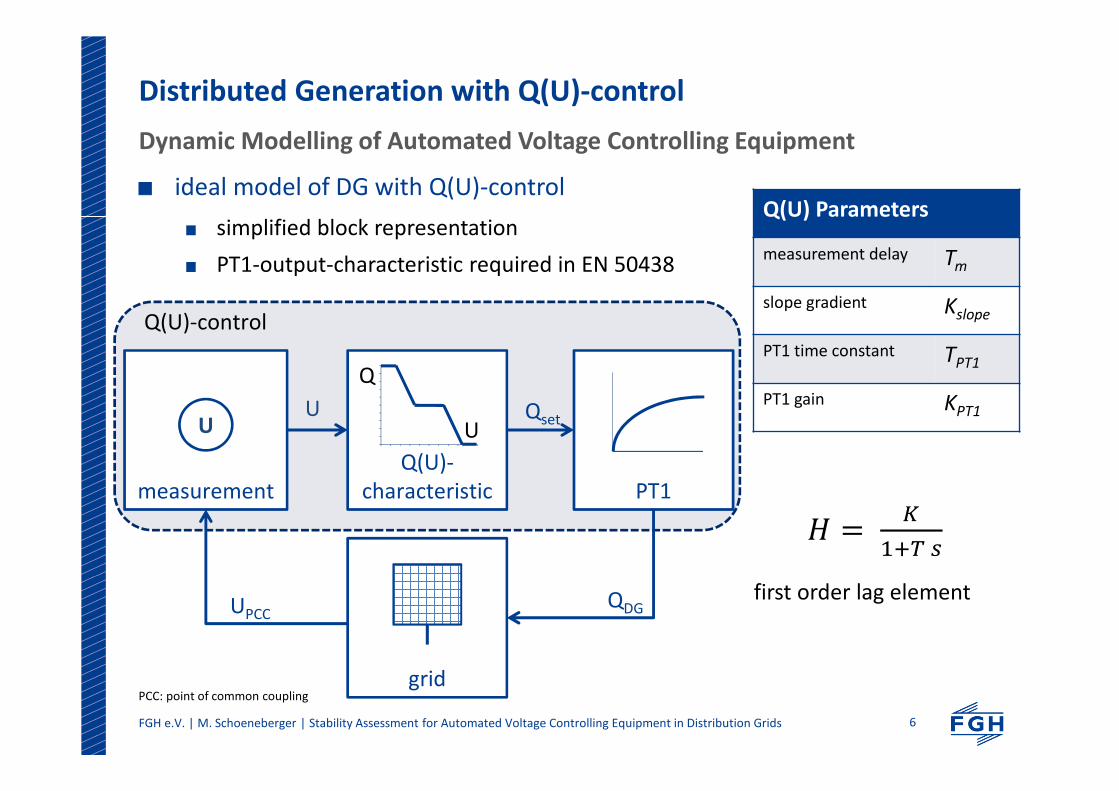
Distributed Generation with Q(U)-control
Dynamic Modelling of Automated Voltage Controlling Equipment
ideal model of DG with Q(U)-control
simplified block representation
PT1-output-characteristic required in EN 50438
Q(U) Parameters
measurement delay Tm
slope gradient Kslope
PT1 time constant TPT1
PT1 gain KPT1
measurement
U
QDGUPCC
Q(U)-
characteristic PT1
grid
U
Q
UQset
Q(U)-control
first order lag element
PCC: point of common coupling
FGH e.V. | M. Schoeneberger | Derivation of a Q(U)-control tolerance band in order to meet voltage quality criteria 7
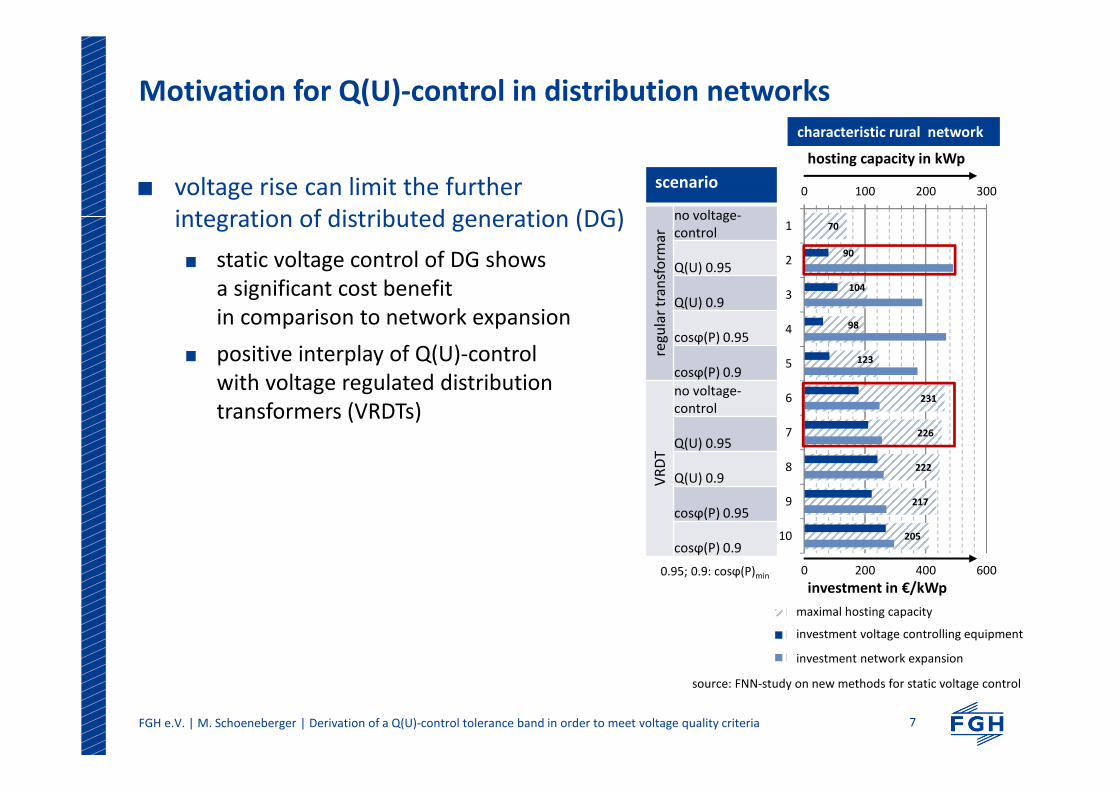
Motivation for Q(U)-control in distribution networks
characteristic rural network
scenario
reg
ula
rtr
an
sfo
rma
r
no voltage-
control
Q(U) 0.95
Q(U) 0.9
cosϕ(P) 0.95
cosϕ(P) 0.9
VR
DT
no voltage-
control
Q(U) 0.95
Q(U) 0.9
cosϕ(P) 0.95
cosϕ(P) 0.9
70
90
104
98
123
231
226
222
217
205
0 200 400 600
0 100 200 300
1
2
3
4
5
6
7
8
9
10
Maximale Netzanschlusskapazität
Investitionen Spannungshaltungskonzept
Investitionen konventioneller Netzausbau
source: FNN-study on new methods for static voltage control
investment in €/kWp
hosting capacity in kWp
maximal hosting capacity
investment voltage controlling equipment
investment network expansion
0.95; 0.9: cosϕ(P)min
voltage rise can limit the further
integration of distributed generation (DG)
static voltage control of DG shows
a significant cost benefit
in comparison to network expansion
positive interplay of Q(U)-control
with voltage regulated distribution
transformers (VRDTs)
FGH e.V. | M. Schoeneberger | Derivation of a Q(U)-control tolerance band in order to meet voltage quality criteria 8
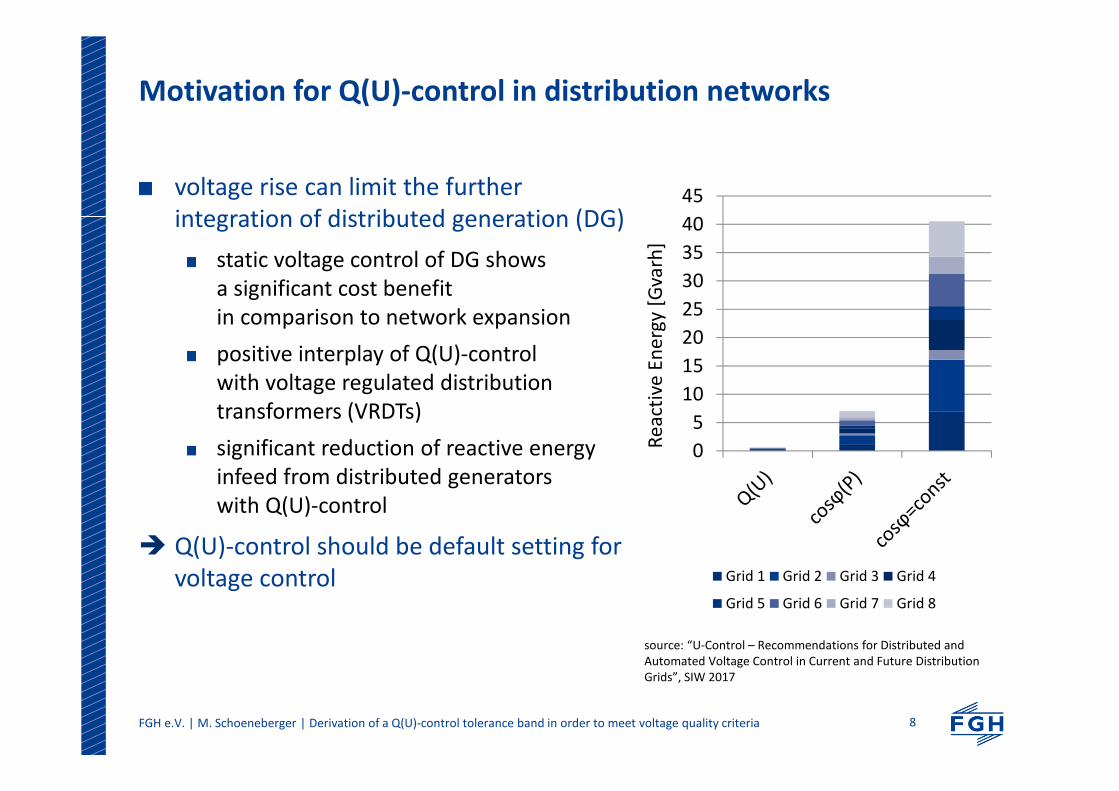
Motivation for Q(U)-control in distribution networks
0
5
10
15
20
25
30
35
40
45
Re
act
ive
En
erg
y[G
varh
]
Grid 1 Grid 2 Grid 3 Grid 4
Grid 5 Grid 6 Grid 7 Grid 8
voltage rise can limit the further
integration of distributed generation (DG)
static voltage control of DG shows
a significant cost benefit
in comparison to network expansion
positive interplay of Q(U)-control
with voltage regulated distribution
transformers (VRDTs)
significant reduction of reactive energy
infeed from distributed generators
with Q(U)-control
Q(U)-control should be default setting for
voltage control
source: “U-Control – Recommendations for Distributed and
Automated Voltage Control in Current and Future Distribution
Grids”, SIW 2017
FGH e.V. | M. Schoeneberger | Derivation of a Q(U)-control tolerance band in order to meet voltage quality criteria 9
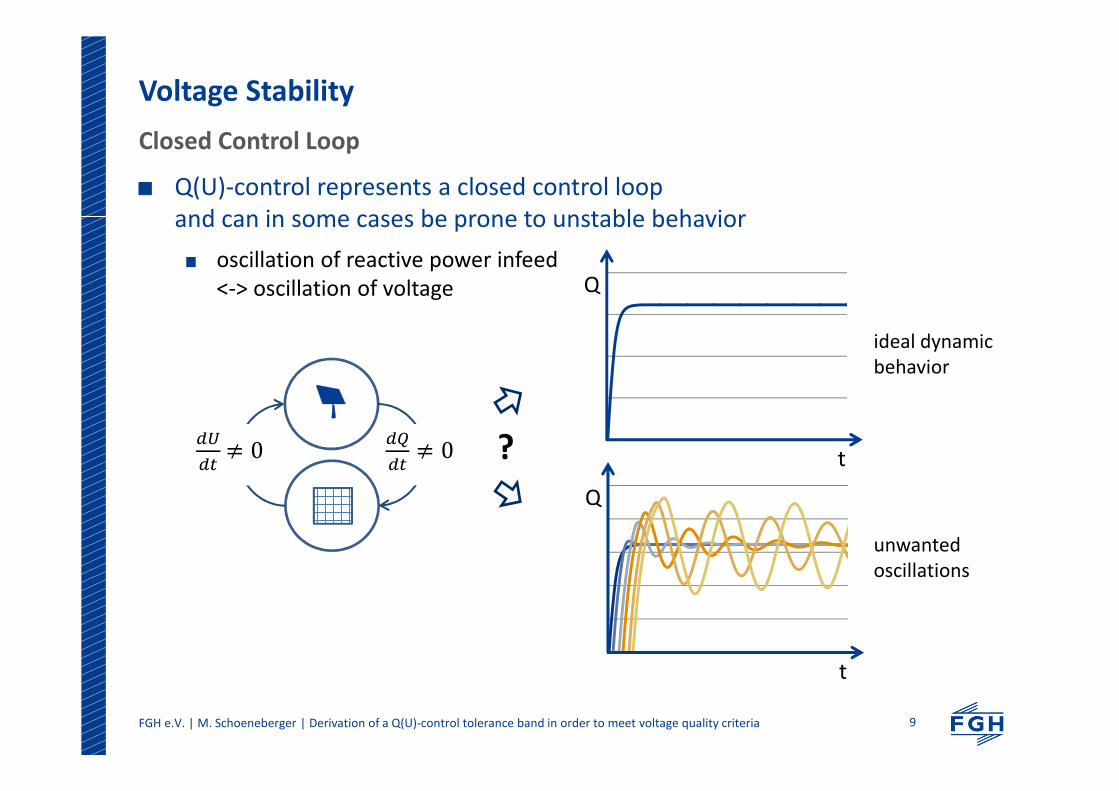
Voltage Stability
Closed Control Loop
Q(U)-control represents a closed control loop
and can in some cases be prone to unstable behavior
oscillation of reactive power infeed
<-> oscillation of voltage
0
0 ? t
Q
t
Q
ideal dynamic
behavior
unwanted
oscillations
FGH e.V. | M. Schoeneberger | Derivation of a Q(U)-control tolerance band in order to meet voltage quality criteria 10
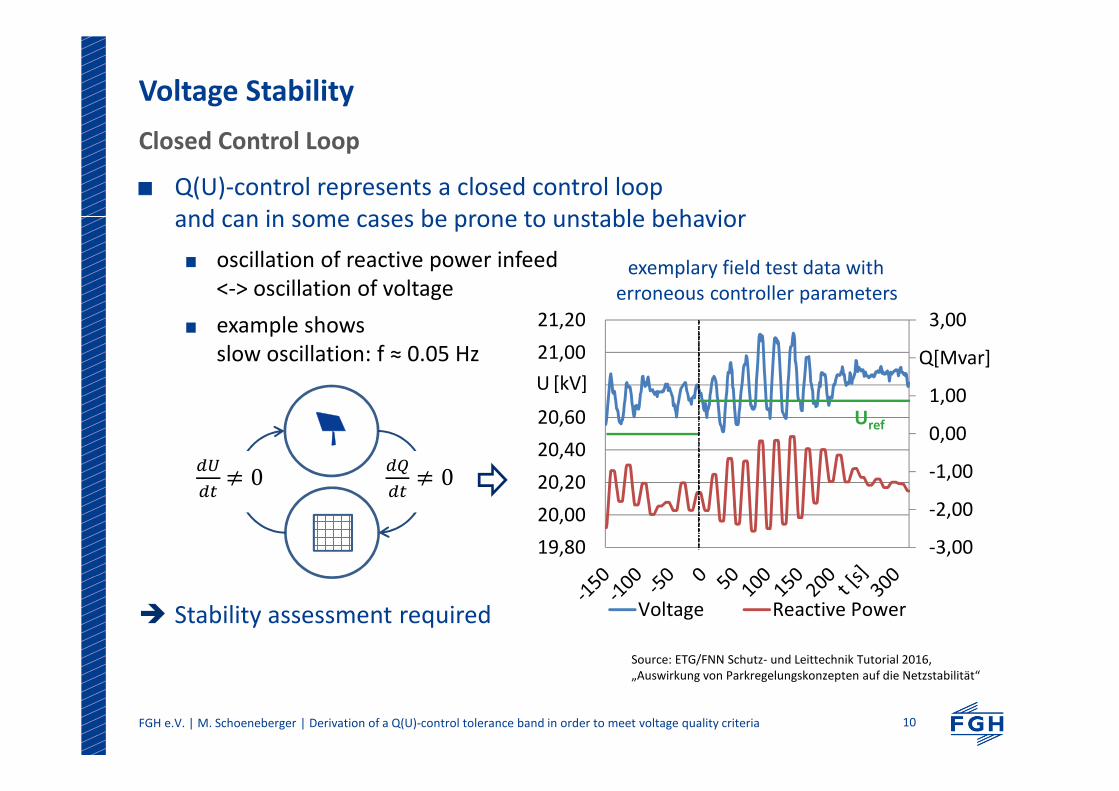
Voltage Stability
Closed Control Loop
Q(U)-control represents a closed control loop
and can in some cases be prone to unstable behavior
oscillation of reactive power infeed
<-> oscillation of voltage
example shows
slow oscillation: f ≈ 0.05 Hz
Stability assessment required
0
0
Source: ETG/FNN Schutz- und Leittechnik Tutorial 2016,
„Auswirkung von Parkregelungskonzepten auf die Netzstabilität“
-3,00
-2,00
-1,00
0,00
1,00
2,00
3,00
19,80
20,00
20,20
20,40
20,60
20,80
21,00
21,20
Voltage Reactive Power
Uref
U [kV]
Q[Mvar]
exemplary field test data with
erroneous controller parameters
FGH e.V. | M. Schoeneberger | Derivation of a Q(U)-control tolerance band in order to meet voltage quality criteria 11
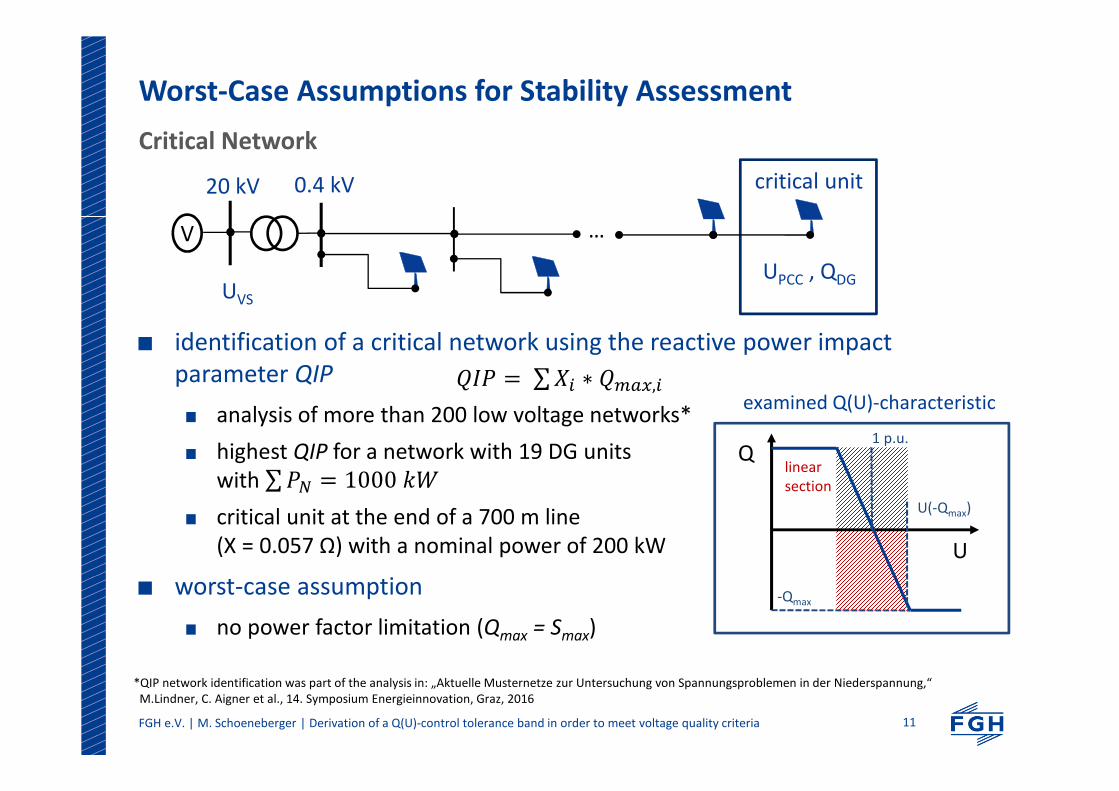
Worst-Case Assumptions for Stability Assessment
Critical Network
impact of Q(U)-control on the local voltage increases with
increasing available reactive power (Qmax)
increasing impedance (X) /increasing line length (l)
increasing slope gradient (Kslope)
identification of a critical network using the reactive power impact
parameter QIP
analysis of more than 200 low voltage networks*
highest QIP for a network with 19 DG units
with ∑ 1000
critical unit at the end of a 700 m line
(X = 0.057 Ω) with a nominal power of 200 kW
worst-case assumption
no power factor limitation (Qmax = Smax)
network parameters
controller parameter
∑ ∗ ,
*QIP network identification was part of the analysis in: „Aktuelle Musternetze zur Untersuchung von Spannungsproblemen in der Niederspannung,“
M.Lindner, C. Aigner et al., 14. Symposium Energieinnovation, Graz, 2016
20 kV 0.4 kV
V
UVS
UPCC , QDG
…
critical unit
U(-Qmax)
Q
U
-Qmax
linear
section
1 p.u.
examined Q(U)-characteristic
FGH e.V. | M. Schoeneberger | Derivation of a Q(U)-control tolerance band in order to meet voltage quality criteria 12
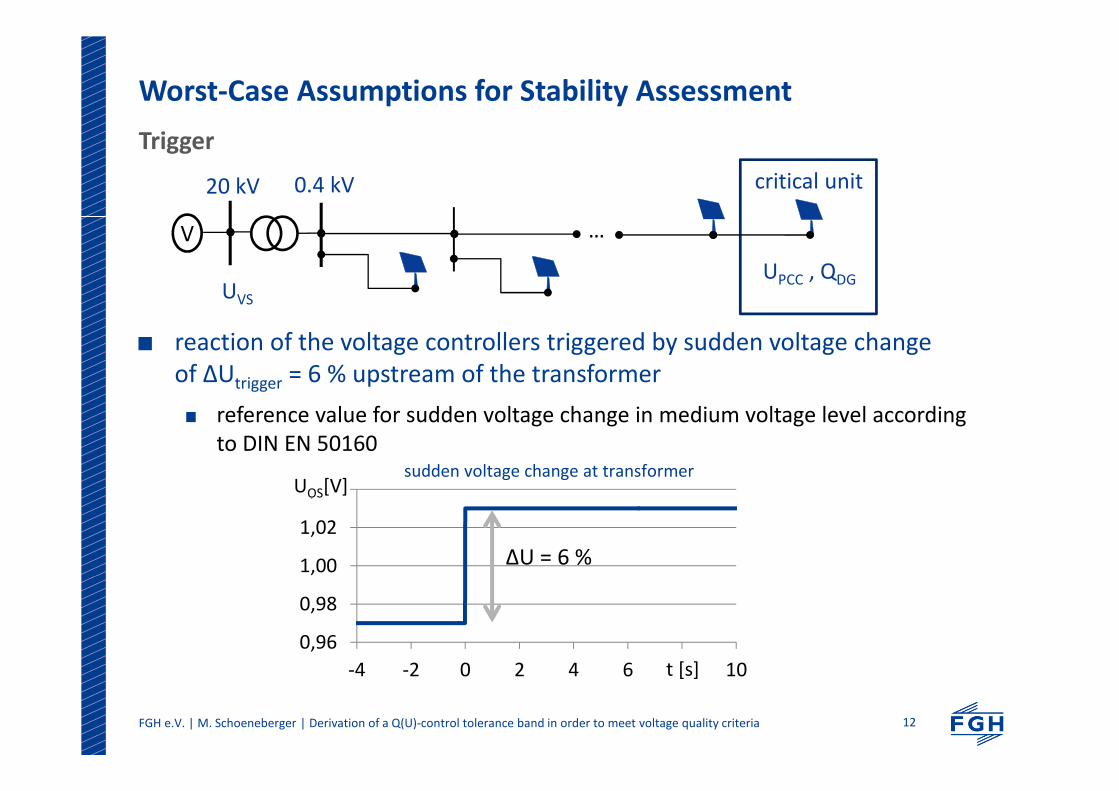
Worst-Case Assumptions for Stability Assessment
Trigger
impact of Q(U)-control on the local voltage increases with
increasing available reactive power (Qmax)
increasing impedance (X) /increasing line length (l)
increasing slope gradient (Kslope)
reaction of the voltage controllers triggered by sudden voltage change
of ∆Utrigger = 6 % upstream of the transformer
reference value for sudden voltage change in medium voltage level according
to DIN EN 50160
network parameters
controller parameter
20 kV 0.4 kV
V
UVS
UPCC , QDG
…
critical unit
0,96
0,98
1,00
1,02
1,04
-4 -2 0 2 4 6 8 10
UOS[V]
t [s]
sudden voltage change at transformer
∆U = 6 %
FGH e.V. | M. Schoeneberger | Derivation of a Q(U)-control tolerance band in order to meet voltage quality criteria 13
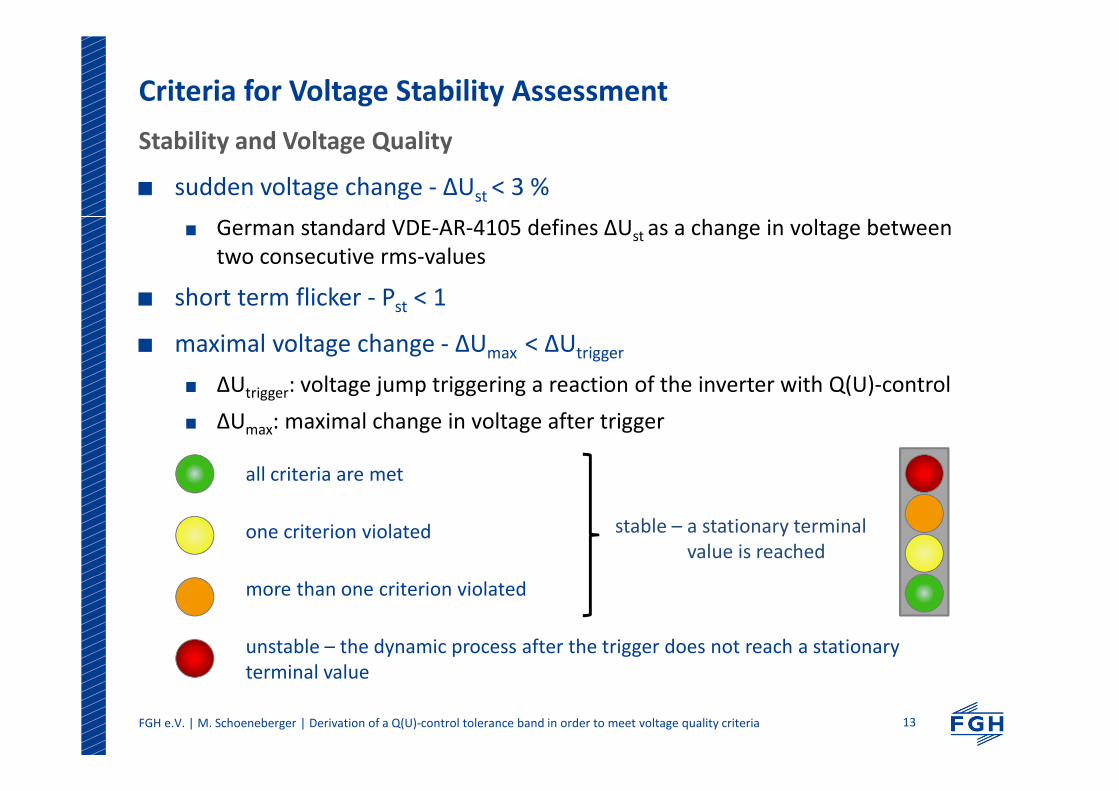
Criteria for Voltage Stability Assessment
Stability and Voltage Quality
sudden voltage change - ∆Ust < 3 %
German standard VDE-AR-4105 defines ∆Ust as a change in voltage between
two consecutive rms-values
short term flicker - Pst < 1
maximal voltage change - ∆Umax < ∆Utrigger
∆Utrigger: voltage jump triggering a reaction of the inverter with Q(U)-control
∆Umax: maximal change in voltage after trigger
all criteria are met
one criterion violated
more than one criterion violated
unstable – the dynamic process after the trigger does not reach a stationary
terminal value
stable – a stationary terminal
value is reached
FGH e.V. | M. Schoeneberger | Derivation of a Q(U)-control tolerance band in order to meet voltage quality criteria 14