34
Matric 2014 Understanding the results, interrogating the issues Nic Spaull Ed-tech discussion on Matric 2014 | 22 January 2015
| Date post: | 19-Dec-2015 |
| Category: |
Documents |
| Upload: | winifred-tyler |
| View: | 219 times |
| Download: | 1 times |
Matric 2014
Understanding the results, interrogating the issues
Nic SpaullEd-tech discussion on Matric 2014 | 22 January 2015

2
Issues
• First time the matric exams were testing CAPS curriculum
• Understanding dropout– Extent– Provincial rankings
• Subjects that students are taking• Indicators of progress/deterioration

3
Matric 2014 (relative to Gr 2 in 2004)
51%
12%
23%
14%
Did not reach matric in 2014Reached matric & failedReached matric & passedReached matric and passed with bachelors
NumbersGrade 2 (2004) 1085570Grade 9 (2011) 1049904Grade 12 (2014) 532860Passed (2014) 403874Bachelors (2014) 150752
4
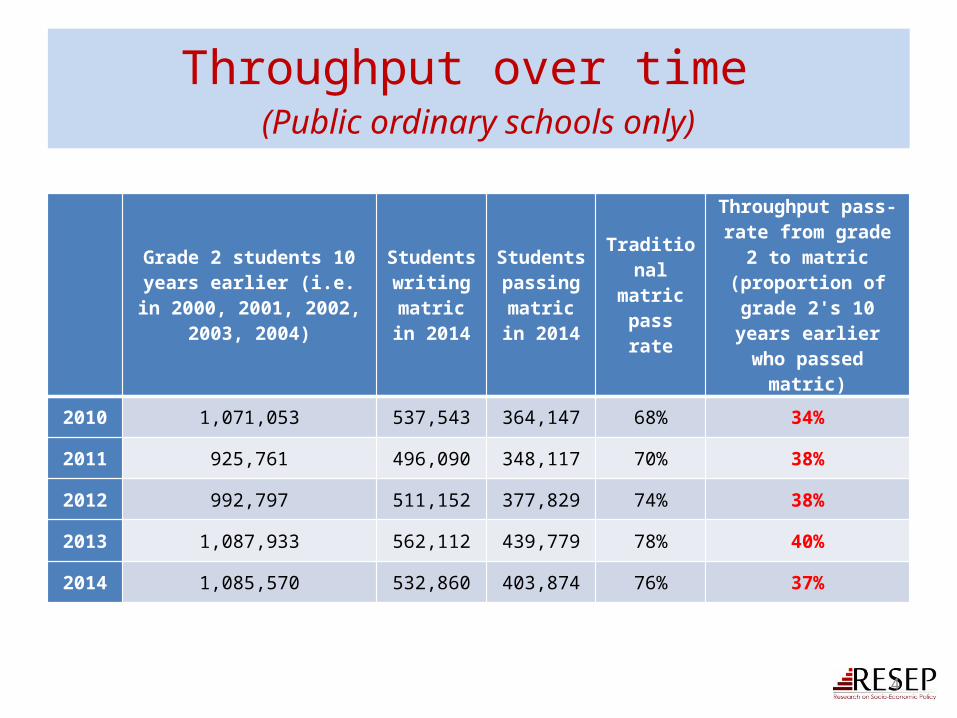
Throughput over time (Public ordinary schools only)
Grade 2 students 10 years earlier (i.e. in 2000, 2001,
2002, 2003, 2004)
Students writing
matric in 2014
Students passing
matric in 2014
Traditional matric pass
rate
Throughput pass-rate from grade 2 to matric
(proportion of grade 2's 10 years earlier who
passed matric)
2010 1,071,053 537,543 364,147 68% 34%
2011 925,761 496,090 348,117 70% 38%
2012 992,797 511,152 377,829 74% 38%
2013 1,087,933 562,112 439,779 78% 40%
2014 1,085,570 532,860 403,874 76% 37%
5
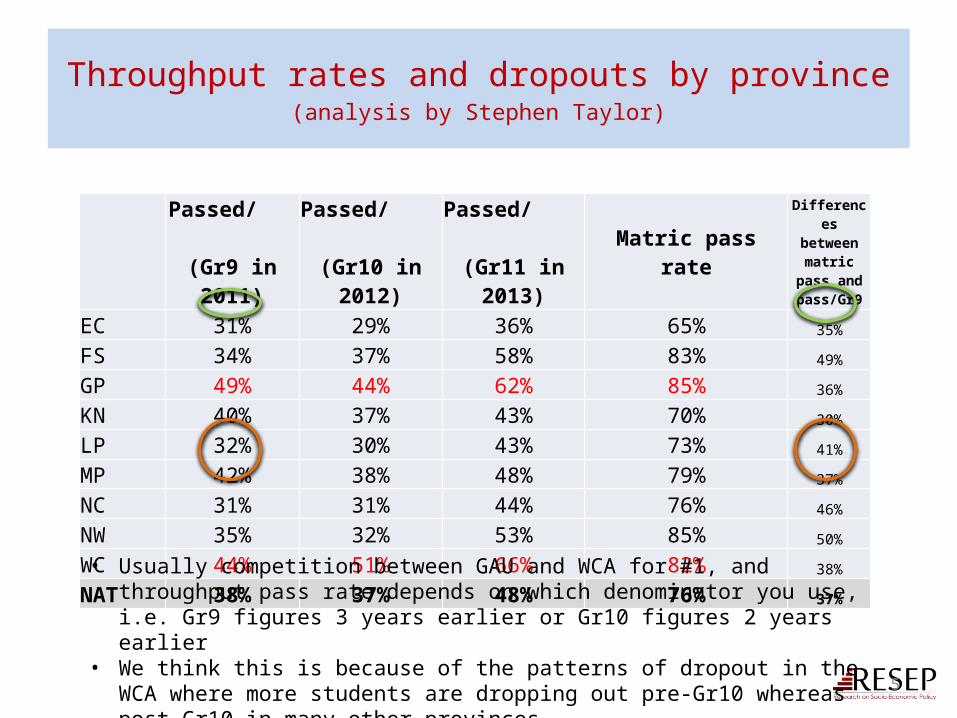
Throughput rates and dropouts by province(analysis by Stephen Taylor)
Passed/ (Gr9 in 2011)
Passed/ (Gr10 in 2012)
Passed/ (Gr11 in 2013) Matric pass rate
Differences between
matric pass and pass/Gr9
EC 31% 29% 36% 65% 35%
FS 34% 37% 58% 83% 49%
GP 49% 44% 62% 85% 36%
KN 40% 37% 43% 70% 30%
LP 32% 30% 43% 73% 41%
MP 42% 38% 48% 79% 37%
NC 31% 31% 44% 76% 46%
NW 35% 32% 53% 85% 50%
WC 44% 51% 66% 82% 38%
NAT 38% 37% 48% 76% 37%
• Usually competition between GAU and WCA for #1, and throughput pass rate depends on which denominator you use, i.e. Gr9 figures 3 years earlier or Gr10 figures 2 years earlier
• We think this is because of the patterns of dropout in the WCA where more students are dropping out pre-Gr10 whereas post-Gr10 in many other provinces
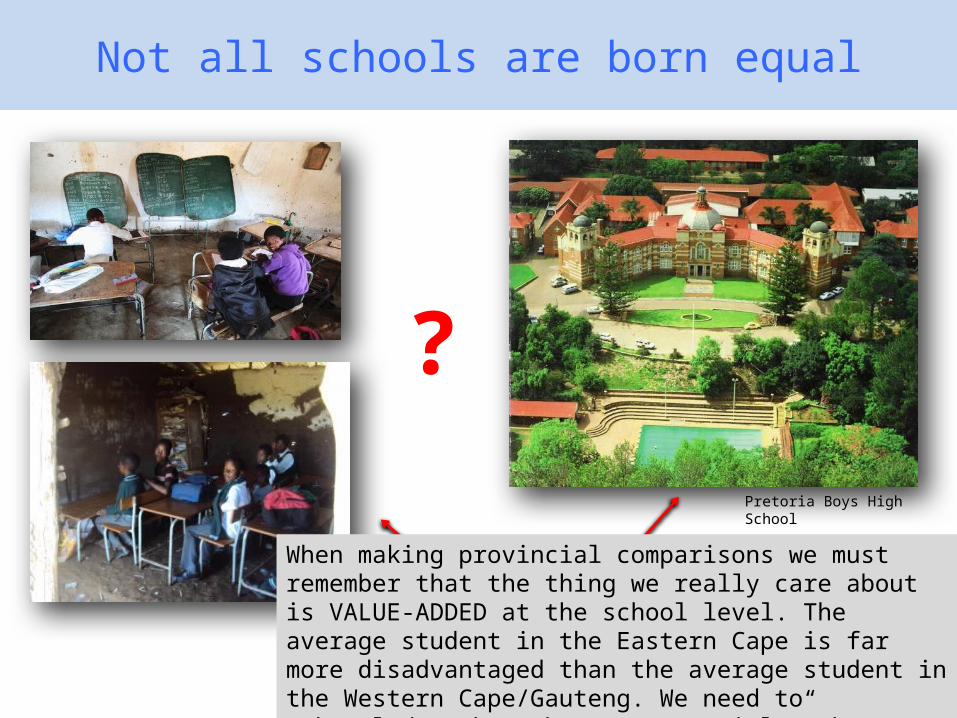
Not all schools are born equal
6
SA public schools?
?Pretoria Boys High School
When making provincial comparisons we must remember that the thing we really care about is VALUE-ADDED at the school level. The average student in the Eastern Cape is far more disadvantaged than the average student in the Western Cape/Gauteng. We need to acknowledge that the “raw materials” that schools are starting with are very, very different across contexts.

7No early cognitive stimulation
Weak culture of T&L
Low curric coverage
Low quality teachers
Low time-on-task
MATRIC
Pre-MATRIC
Matric pass rateNo. endorsements Subject choice
Throughput
Low accountability
50% dropout
HUGE learning deficits…
Quality?
What are the root causes of low and
unequal achievement?
Vested interests
Media sees only this
8
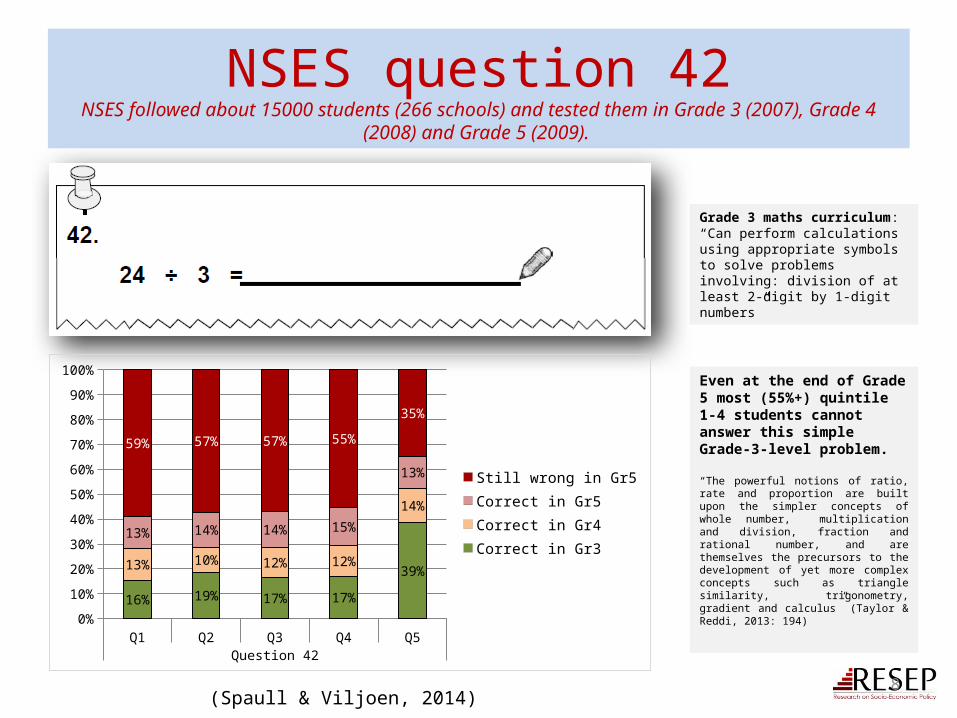
NSES question 42NSES followed about 15000 students (266 schools) and tested them in Grade 3 (2007), Grade 4 (2008)
and Grade 5 (2009).
Grade 3 maths curriculum: “Can perform calculations using appropriate symbols to solve problems involving: division of at least 2-digit by 1-digit numbers”
Q1 Q2 Q3 Q4 Q5Question 42
0%
10%
20%
30%
40%
50%
60%
70%
80%
90%
100%
16% 19% 17% 17%
39%13% 10% 12% 12%
14%
13% 14% 14% 15%
13%
59% 57% 57% 55%
35%
Still wrong in Gr5Correct in Gr5Correct in Gr4Correct in Gr3
Even at the end of Grade 5 most (55%+) quintile 1-4 students cannot answer this simple Grade-3-level problem.
“The powerful notions of ratio, rate and proportion are built upon the simpler concepts of whole number, multiplication and division, fraction and rational number, and are themselves the precursors to the development of yet more complex concepts such as triangle similarity, trigonometry, gradient and calculus” (Taylor & Reddi, 2013: 194)
(Spaull & Viljoen, 2014)
9
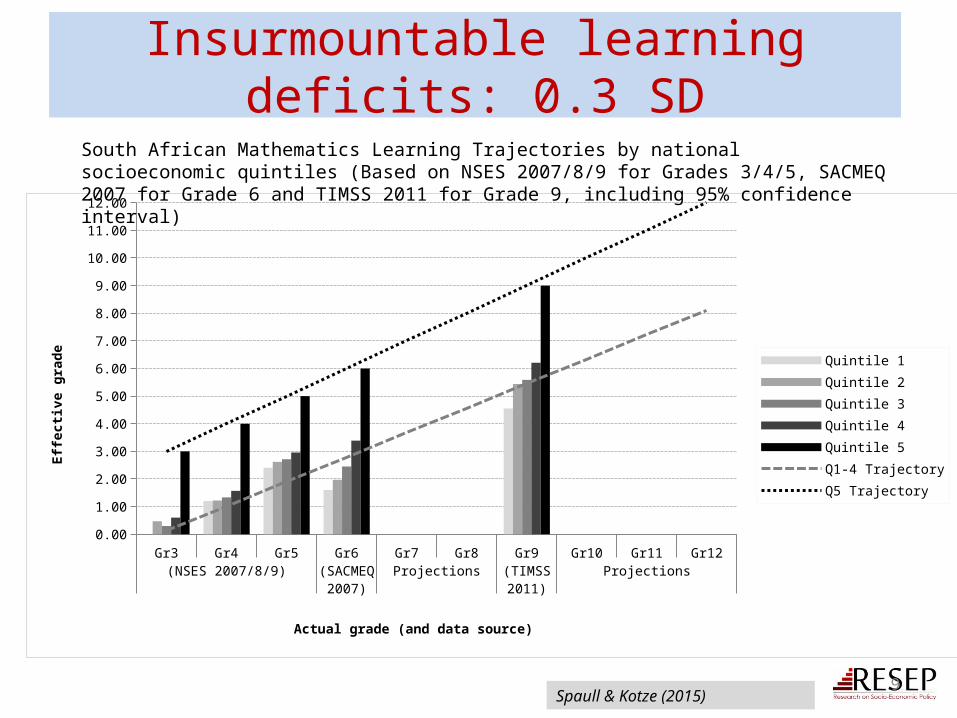
Insurmountable learning deficits: 0.3 SD
Spaull & Kotze (2015)
Gr3 Gr4 Gr5 Gr6 Gr7 Gr8 Gr9 Gr10 Gr11 Gr12(NSES 2007/8/9) (SACMEQ
2007)Projections (TIMSS
2011)Projections
0.00
1.00
2.00
3.00
4.00
5.00
6.00
7.00
8.00
9.00
10.00
11.00
12.00
Quintile 1Quintile 2Quintile 3Quintile 4Quintile 5Q1-4 TrajectoryQ5 Trajectory
Actual grade (and data source)
Effec
tive
grad
e
South African Mathematics Learning Trajectories by national socioeconomic quintiles (Based on NSES 2007/8/9 for Grades 3/4/5, SACMEQ 2007 for Grade 6 and TIMSS 2011 for Grade 9, including 95% confidence interval)
Attai
nmen
tQ
ualit
yTy
pe
10
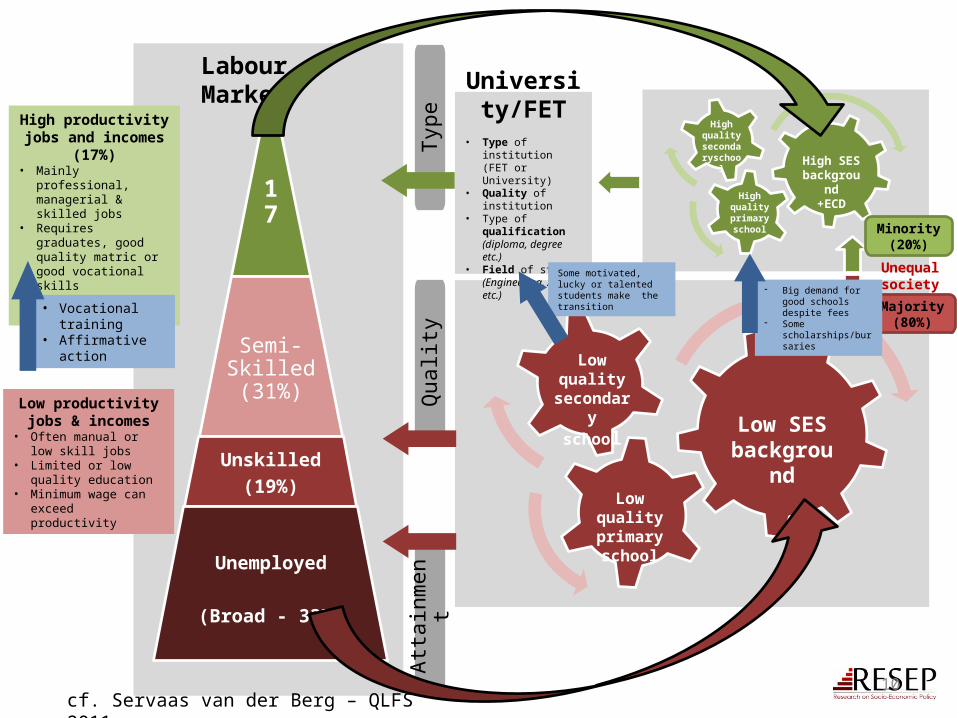
High SES background
+ECDHigh quality primary school
High quality
secondaryschool
Low SES background
Low quality primary school
Low quality secondary
school
Unequal society
17% Semi-Skilled (31%)
Unskilled(19%)
Unemployed
(Broad - 33%)
Labour Market
High productivity jobs and incomes (17%)
• Mainly professional, managerial & skilled jobs
• Requires graduates, good quality matric or good vocational skills
• Historically mainly white
Low productivity jobs & incomes
• Often manual or low skill jobs
• Limited or low quality education
• Minimum wage can exceed productivity
University/FET
• Type of institution (FET or University)
• Quality of institution • Type of qualification
(diploma, degree etc.)• Field of study
(Engineering, Arts etc.)
• Vocational training• Affirmative action
Majority (80%)
Some motivated, lucky or talented students make the transition
Minority (20%)
- Big demand for good schools despite fees
- Some scholarships/bursaries
cf. Servaas van der Berg – QLFS 2011

11
The kinds of things we SHOULD be asking
1. What proportion of students are writing matric relative to the previous year and earlier enrolments (taking into account cohort sizes),
2. What subjects are they taking and how has this changed relative to previous years? (i.e. are they taking easier or more challenging subject combinations). Are more students taking maths literacy or mathematics than previous years?
3. What level are the maths/science/language passes at and how has this changed (i.e. at 40%, at 50%, at 60% etc.) This is really important because thresholds (like a specific pass rate) can lead to a situation where there are big jumps in pass rates based on people moving just over the threshold but the underlying distribution didn’t change much.
4. How have the number of bachelor passes changed relative to previous years? Ideally we would also want to know not just how many students received bachelor passes but how many actually ‘used’ those passes and got into university. If the same number of students got bachelor passes but more of them successfully entered (and ideally completed) degreees/diplomas/certificates, this is a great thing which should be measured, announced and celebrated.
5. How have the performance levels of EFAL students changed relative to previous years? Basically everyone passes this exam but achieve at very low levels. For example in 2013 99% of students passed EFAL but only 30% scored higher than 60%. In the WCA 38% scored higher than 60%. This is a critically important subject taken by 81% of all matrics in the country.
6. For diagnostic/support/accountability purposes analyse results at the school level . Which schools have the highest number of matrics taking (and passing) mathematics by quintile. Which are the poor schools performing well in spite of poverty? Which are the ‘wealthy’ schools performing badly in spite of wealth? How many WCA schools account for 30% of all failures in mathematics? Science? Matric? Research in the US reported this and the number of schools was surprisingly low. We haven’t done the analysis on this but it is possible. What proportion of schools account for 75% of all bachelor passes? Often these numbers are quite surprising and insightful.
7. Looking at equity across the schooling system. Are more poorer schools performing better/worse? Is the gap between wealthy and poor schools/children increasing or decreasing?

12
Other issues
• Accountability and perverse incentives – “Any district that drops, even if it’s by 0.01 percent, before you give me the
results, put the resignation letter on top.” MEC Lesufi (Gauteng)
• Vocational subjects– 40% of matrics take Business Studies– 20% take Tourism– “Vast numbers of our children enrol for semi-vocational subjects that are not
teaching them either robust academic skills by building concepts and knowledge, nor preparing them for work in any meaningful way.” – Stephanie Allais (Wits)
• What to do about the pass mark– Some have suggested just reporting the mark not pass/fail,
however, pass/fail is conceptually important for accountability, especially in a system that lacks accountability
13
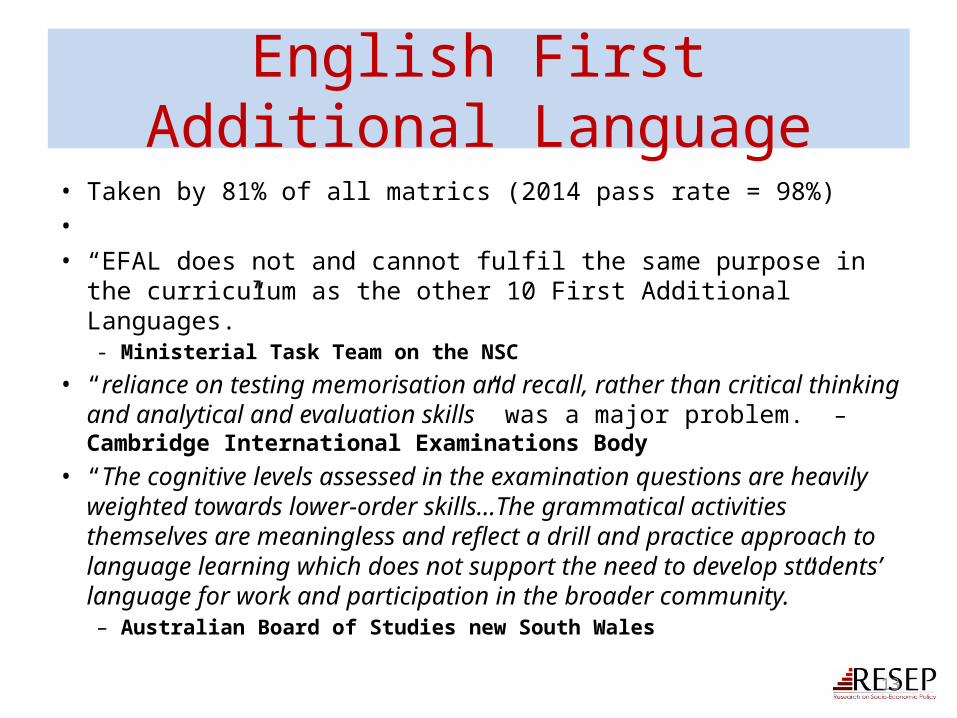
English First Additional Language• Taken by 81% of all matrics (2014 pass rate = 98%)• • “EFAL does not and cannot fulfil the same purpose in the curriculum as
the other 10 First Additional Languages.” - Ministerial Task Team on the NSC
• “reliance on testing memorisation and recall, rather than critical thinking and analytical and evaluation skills” was a major problem. – Cambridge International Examinations Body
• “The cognitive levels assessed in the examination questions are heavily weighted towards lower-order skills…The grammatical activities themselves are meaningless and reflect a drill and practice approach to language learning which does not support the need to develop students’ language for work and participation in the broader community.”
– Australian Board of Studies new South Wales

14
Conclusions
• End infantile obsession with the matric pass rate– There are other indicators which we should be placing as much emphasis on
• Matric starts in grade 1– Weak performance in matric (and dropout pre-matric) is rooted in weak
foundations in primary school• Serious need to look at EFAL as a subject (and also some of the semi-
vocational subjects)– Both assessment and curriculum
• Given that matric exams are not psychometrically calibrated to be comparable across years, and that they only reflect the performance of half the cohort, there are better measures of the “health” of the education system– Including TIMSS, PIRLS, prePIRLS, PISA-for-Development, SACMEQ
• All psychometrically calibrated to be comparable over time
15
Questions and comments?
16
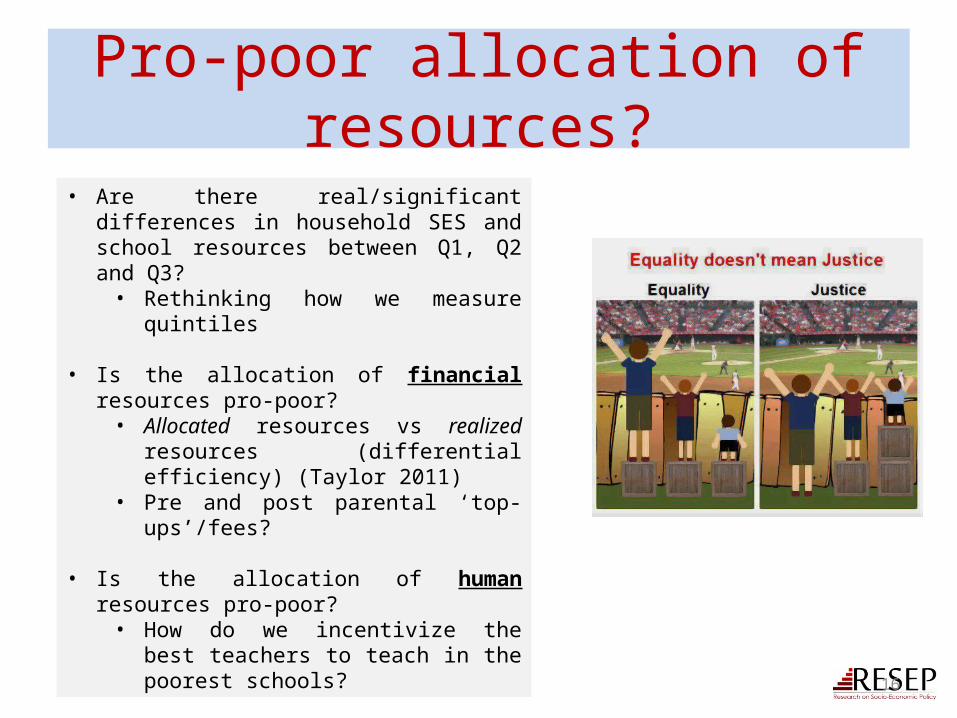
Pro-poor allocation of resources?
• Are there real/significant differences in household SES and school resources between Q1, Q2 and Q3?• Rethinking how we measure quintiles
• Is the allocation of financial resources pro-poor?• Allocated resources vs realized resources
(differential efficiency) (Taylor 2011)• Pre and post parental ‘top-ups’/fees?
• Is the allocation of human resources pro-poor?• How do we incentivize the best teachers to
teach in the poorest schools?
17
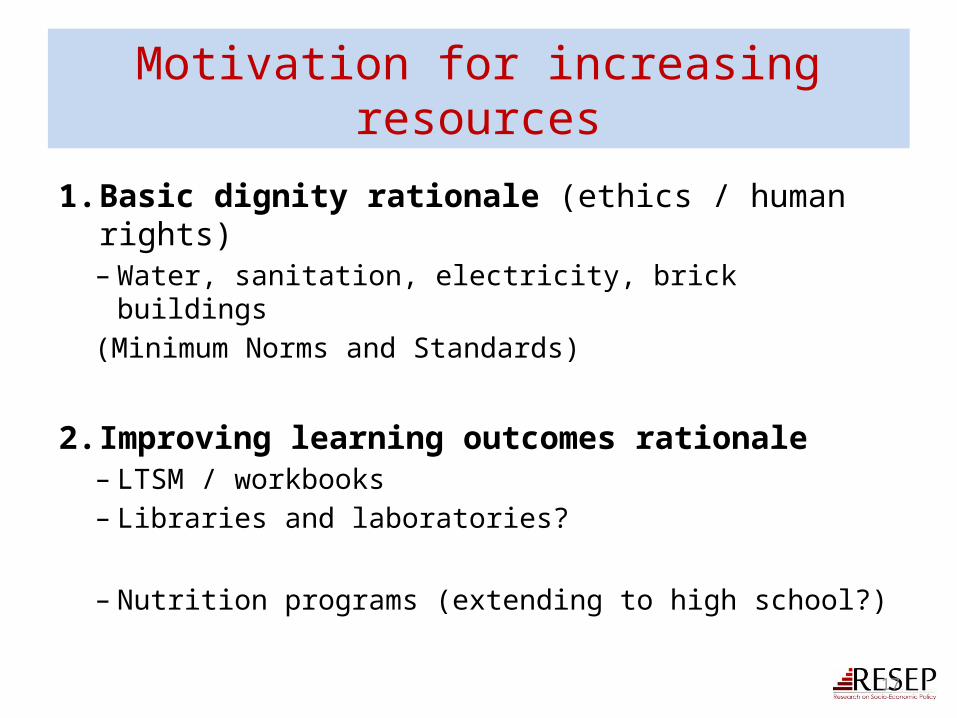
Motivation for increasing resources
1. Basic dignity rationale (ethics / human rights)– Water, sanitation, electricity, brick buildings(Minimum Norms and Standards)
2. Improving learning outcomes rationale– LTSM / workbooks– Libraries and laboratories?
– Nutrition programs (extending to high school?)
18
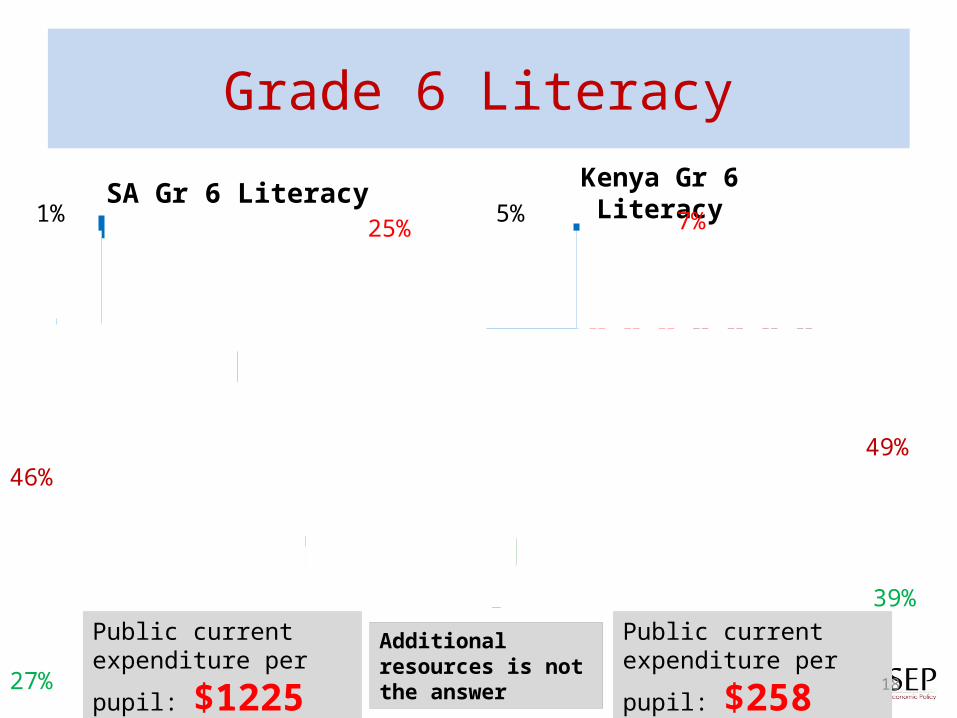
Grade 6 Literacy
SA Gr 6 Literacy Kenya Gr 6 Literacy25% 7%5%1%
46%49%
39%
27%
Public current expenditure
per pupil: $1225Public current expenditure
per pupil: $258Additional resources is not the answer
19
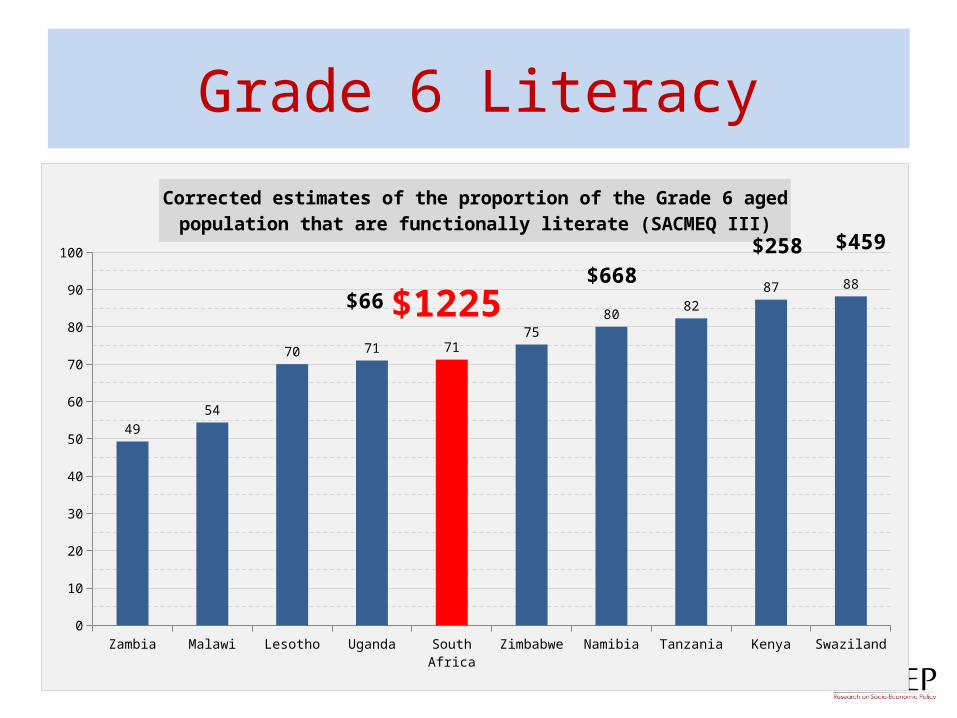
Grade 6 Literacy
Zambia Malawi Lesotho Uganda South Africa Zimbabwe Namibia Tanzania Kenya Swaziland0
10
20
30
40
50
60
70
80
90
100
49
54
70 71 7175
8082
87 88
Corrected estimates of the proportion of the Grade 6 aged population that are func-tionally literate (SACMEQ III)
$1225$66
$258 $459
$668
20
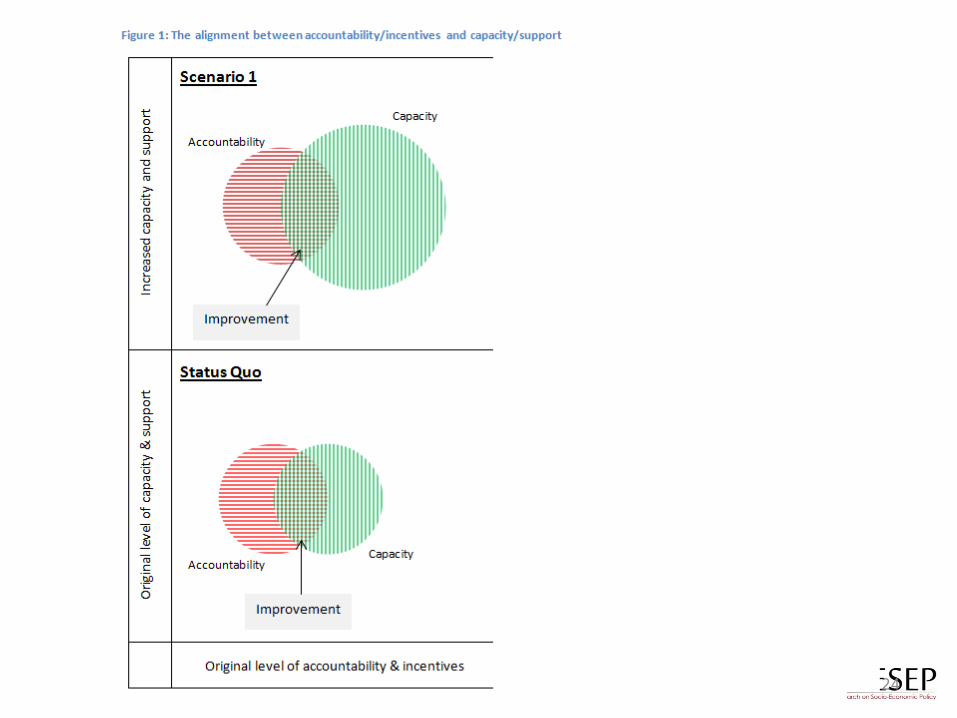
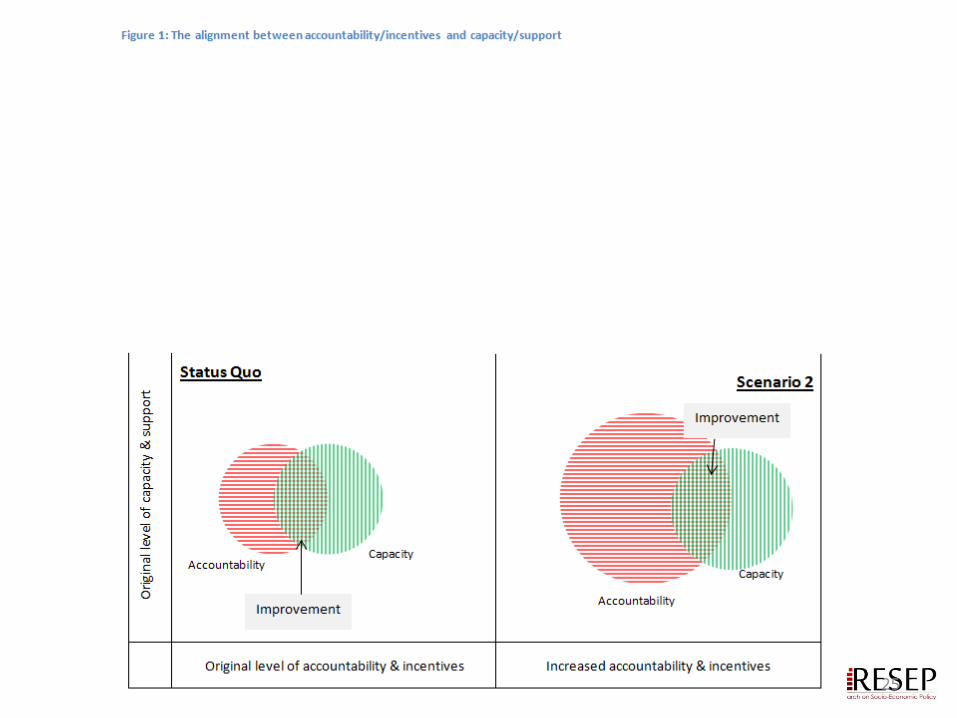
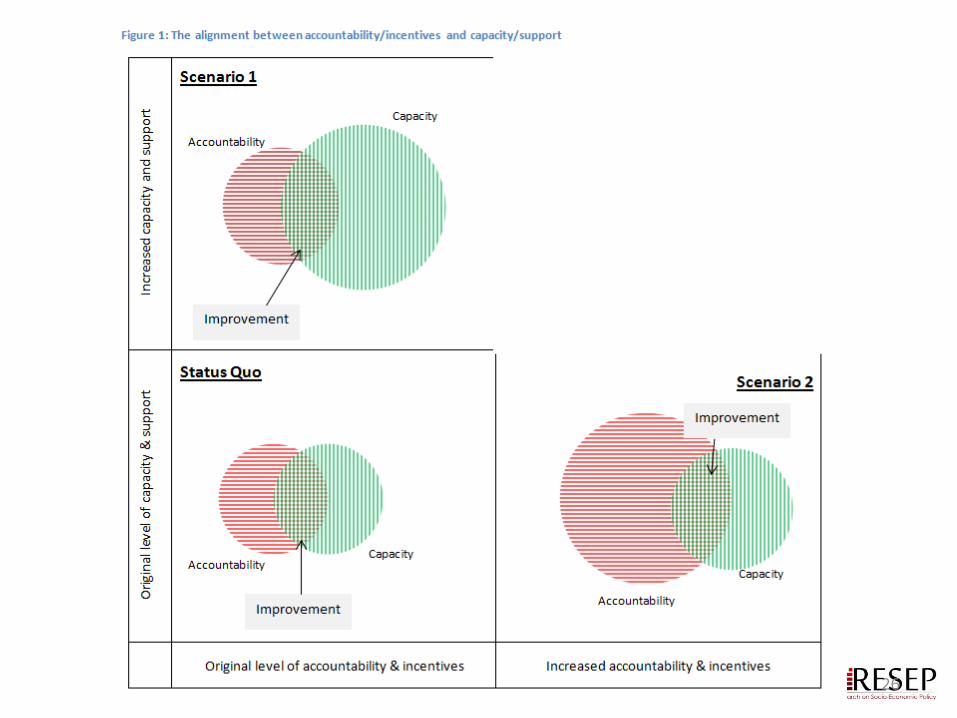
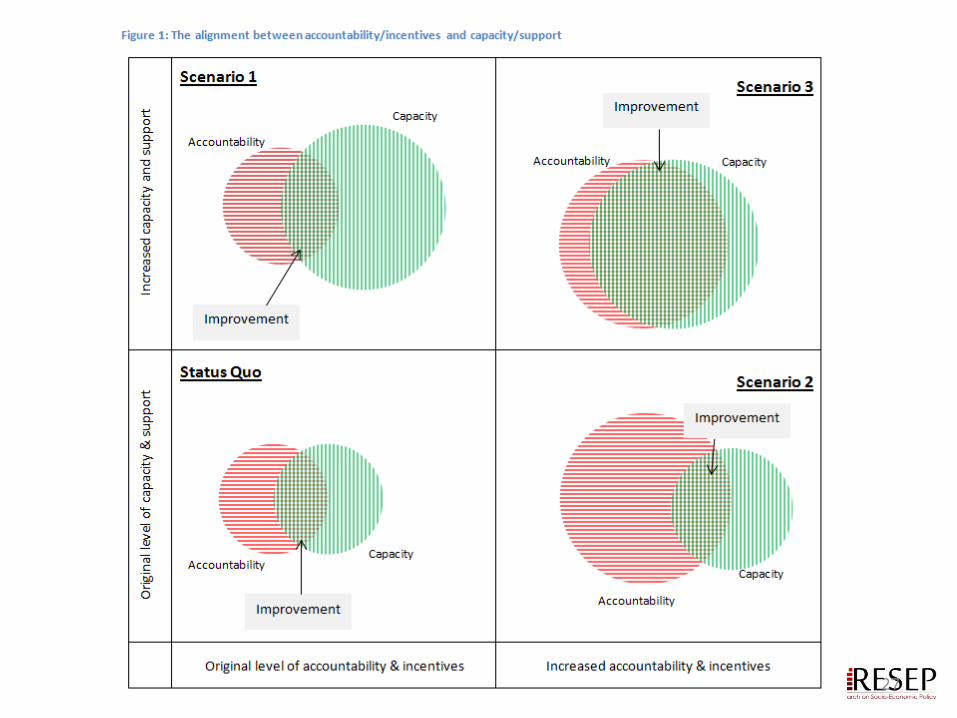
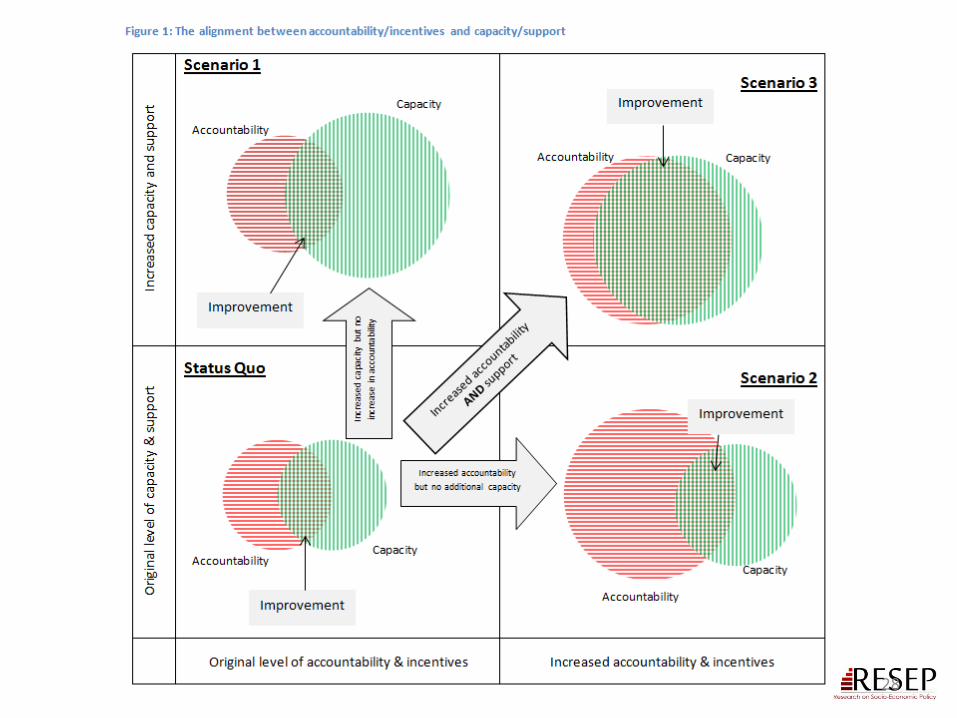
Accountability & Capacity

21
Accountability without capacity• “Accountability systems and incentive structures, no matter how well designed, are only as effective
as the capacity of the organization to respond. The purpose of an accountability system is to focus the resources and capacities of an organization towards a particular end. Accountability systems can’t mobilize resources that schools don’t have...the capacity to improve precedes and shapes schools’ responses to the external demands of accountability systems (Elmore, 2004b, p. 117).
• “If policy-makers rely on incentives for improving either a school or a student, then the question arises, incentives to do what? What exactly should educators in failing schools do tomorrow - that they do not do today - to produce more learning? What should a failing student do tomorrow that he or she is not doing today? For both parties, perhaps it is as simple as trying harder, a behavioural change ripe for incentives to influence. If the solution is not that simple, however, trying harder will lead to marginal gains. Greater gains will materialize only for those who know what to do. There will be students and teachers who try hard and fail – and they will be penalized for their failures. The spectre of that entails political risks … At the classroom level, even teachers who have been motivated to change by accountability must know what to do differently to convert struggling learners into accomplished ones…It is difficult to sanction someone for an unacceptable outcome – and, in democratically governed institutions, to justify the sanctioning as fair – when no one can describe, with reliability and precision, how to produce an acceptable outcome” (Loveless, 2005, pp. 16, 26).
22
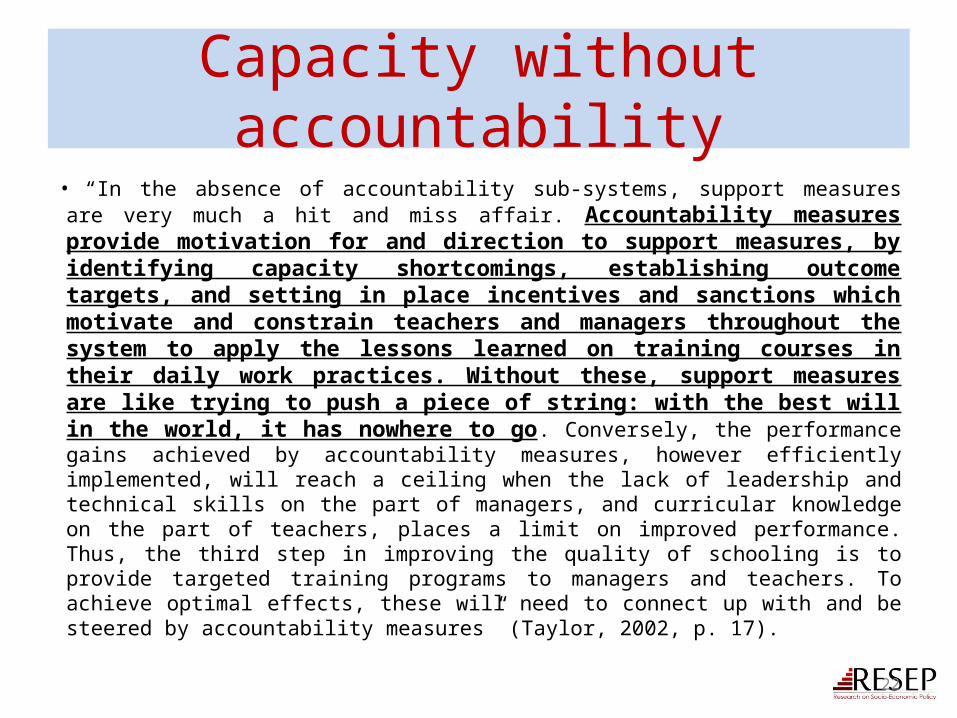
Capacity without accountability• “In the absence of accountability sub-systems, support measures are very much
a hit and miss affair. Accountability measures provide motivation for and direction to support measures, by identifying capacity shortcomings, establishing outcome targets, and setting in place incentives and sanctions which motivate and constrain teachers and managers throughout the system to apply the lessons learned on training courses in their daily work practices. Without these, support measures are like trying to push a piece of string: with the best will in the world, it has nowhere to go. Conversely, the performance gains achieved by accountability measures, however efficiently implemented, will reach a ceiling when the lack of leadership and technical skills on the part of managers, and curricular knowledge on the part of teachers, places a limit on improved performance. Thus, the third step in improving the quality of schooling is to provide targeted training programs to managers and teachers. To achieve optimal effects, these will need to connect up with and be steered by accountability measures” (Taylor, 2002, p. 17).
23
24
25
26
27
28
29
Binding constraints approach
30
Binding constraints approach

31
32
33
34
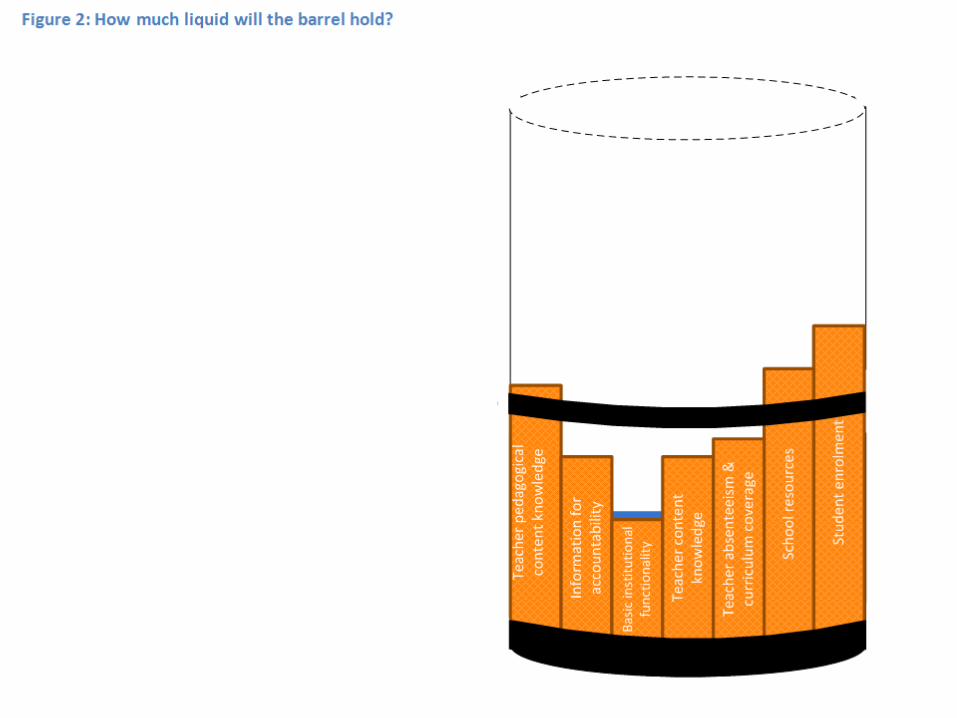
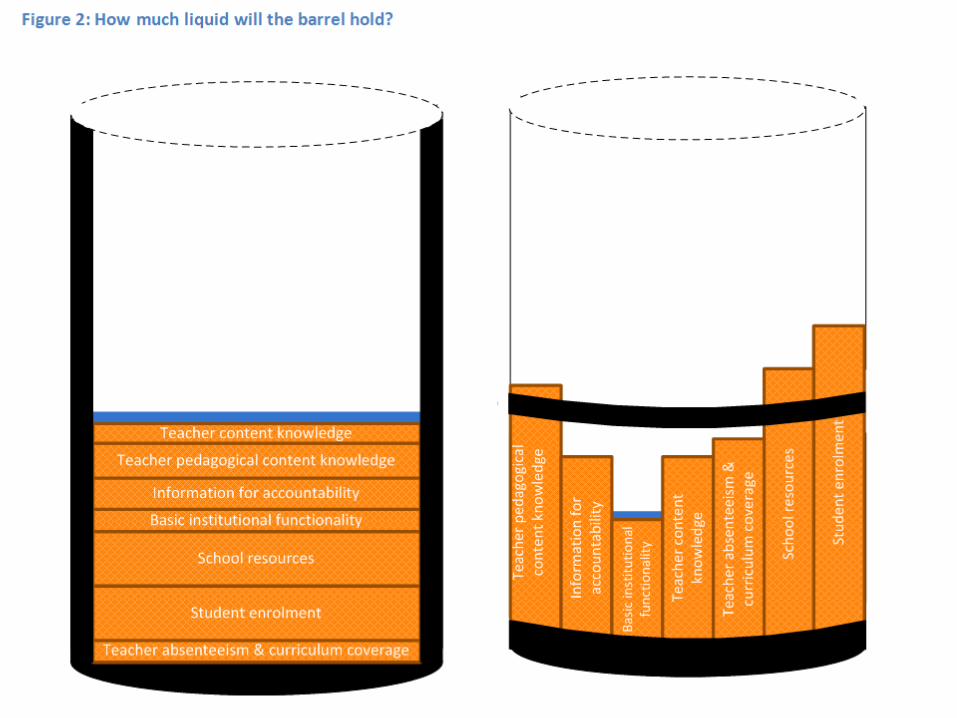
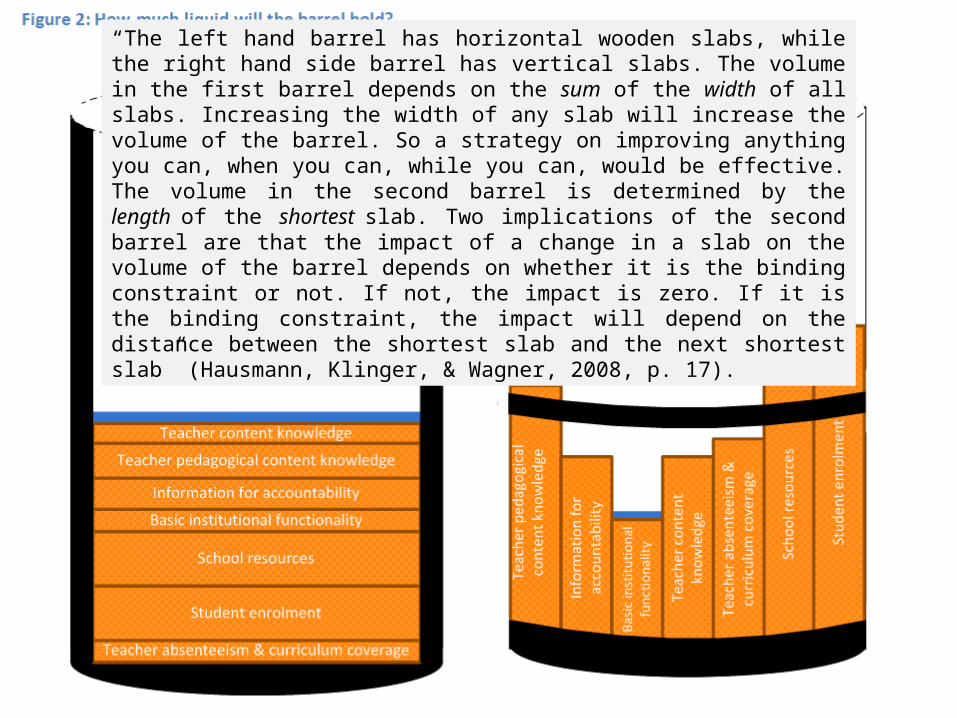
“The left hand barrel has horizontal wooden slabs, while the right hand side barrel has vertical slabs. The volume in the first barrel depends on the sum of the width of all slabs. Increasing the width of any slab will increase the volume of the barrel. So a strategy on improving anything you can, when you can, while you can, would be effective. The volume in the second barrel is determined by the length of the shortest slab. Two implications of the second barrel are that the impact of a change in a slab on the volume of the barrel depends on whether it is the binding constraint or not. If not, the impact is zero. If it is the binding constraint, the impact will depend on the distance between the shortest slab and the next shortest slab” (Hausmann, Klinger, & Wagner, 2008, p. 17).


![MATRIC-L5 [OFFICE ]...MATRIC-L5 [OFFICE ] MATRIC-S1/U1 108 MATRIC-W1 168 MATRIC-P4 278 MATRIC-A3 362 MATRIC-L1 428 DE Matric-L5 I Einbau-Lichtlinie rein direktstrahlend • Montage](https://static.documents.pub/doc/80x56/5f0518737e708231d4113d85/matric-l5-office-matric-l5-office-matric-s1u1-108-matric-w1-168-matric-p4.jpg)


