Page 1
1
MATRIX-VBS: implementing an evolving organic aerosol volatility in an
aerosol microphysics model
Chloe Y. Gao1,2, Kostas Tsigaridis3,2, Susanne E. Bauer3,2
1Department of Earth and Environmental Sciences, Columbia University, New York, NY, 10025, USA 2NASA Goddard Institute for Space Studies, New York, NY, 10025, USA 5 3Center for Climate System Research, Columbia University, New York, NY, 10025, USA
Correspondence to: K. Tsigaridis ([email protected] )
Abstract. We have implemented an existing aerosol microphysics scheme into a box model framework and
extended it to represent gas-particle partitioning and chemical ageing of semi-volatile organic aerosols. We 10
then applied this new research tool to investigate the effects of semi-volatile organic species on the growth,
composition and mixing state of aerosol particles in case studies representing several different environments.
The volatility-basis set (VBS) framework is implemented into the aerosol microphysical scheme MATRIX
(Multiconfiguration Aerosol TRacker of mIXing state), which resolves mass and number aerosol
concentrations and in multiple mixing-state classes. The new scheme, MATRIX-VBS, has the potential to 15
significantly advance the representation of organic aerosols in Earth system models by improving upon the
conventional representation as non-volatile particulate organic matter, often with also an assumed fixed size
distribution. We present results from idealized cases representing Beijing, Mexico City, a Finnish and a
Southeast U.S. forest, and investigate the evolution of mass concentrations and volatility distributions for
organic species across the gas and particle phases, as well as assessing their mixing state among aerosol 20
populations. Emitted semi-volatile primary organic aerosols evaporate almost completely in the high volatile
range, while they remain in the particle phase in the low volatility range. Their volatility distribution depends
on the applied emission factors, oxidation by OH radicals, and temperature. We also compare against parallel
simulations with the original scheme, which represented only the particulate and non-volatile component of
the organic aerosol, examining how differently the condensed phase organic matter is distributed across the 25
mixing states in the model. The results demonstrate the importance of representing organic aerosol as a semi-
volatile aerosol, and explicitly calculating the partitioning of organic species between the gas and particulate
phases.
Keywords: organic aerosols, volatility-basis set, aerosol mixing state, box model 30
1 Introduction
Atmospheric aerosols play a key role in the Earth system with great impacts on global air quality, public
Geosci. Model Dev. Discuss., doi:10.5194/gmd-2016-171, 2016Manuscript under review for journal Geosci. Model Dev.Published: 14 September 2016c© Author(s) 2016. CC-BY 3.0 License.
Page 2
2
health and climate (Boucher et al., 2013; Myhre et al., 2013; Seinfeld and Pandis, 2016). One contribution to
the large uncertainty in aerosol radiative forcing is organic aerosol (OA), which is ubiquitous in the
atmosphere and contribute to a large portion of submicron particulate mass in various regions around the
world (Zhang et al., 2007; Jimenez et al., 2009). Advancements in measurement techniques greatly improved
our understanding of the evolution of OA and lifetime in the atmosphere at the process level (Jimenez et al., 5
2009). However, OA processes in models still remain poorly constrained. Measurements imply that OA
concentrations are potentially underestimated in current models (Tsigaridis et al., 2014). Such a discrepancy
hints at large uncertainties in the prediction of aerosol-radiation interactions, their hygroscopicity, aerosol-
cloud interactions and their overall impact on climate (Petters and Kreidenweis, 2007).
Missing sources of secondary organic aerosol (SOA) in models have been suggested to be the main cause of 10
the underestimated OA formation (Heald et al., 2005; Volkamer et al., 2006; Hodzic et al., 2010; Spracklen et
al., 2011). More recently, studies have sought to investigate the underestimation of organic aerosol mass
within more advanced model frameworks, which are capable of resolving semi-volatile primary organic
aerosol (POA) and including secondary organic aerosol (SOA) from a wider set of precursors including
intermediate volatility organic compounds (IVOCs). The volatility-basis set was developed (Donahue et al., 15
2006) to provide a relatively simple framework whereby models can represent the overall behavior of the
myriad of compounds that constitute organic aerosol and their precursors. The approach involves considering
OA as being composed of a number of representative species, each with a particular volatility, spanning a
spectrum in vapor pressures from highly volatile (which essentially remains in the gas phase) to very low
vapor pressure species which partition readily into the particle phase. VBS then captures the chemical ageing 20
of the organic species in the gas phase, with hydroxyl radical oxidizing them and producing the adjacent lower
volatility class as a product. This method has been used extensively in regional studies (Robinson et al., 2007;
Shrivastava et al., 2008; Murphy and Pandis, 2009; Tsimpidi et al., 2010; Hodzic et al., 2010; Fountoukis et
al., 2011; Tsimpidi et al., 2011; Bergström et al., 2012; Athanasopoulou et al., 2013; Zhang et al., 2013;
Fountoukis et al., 2014) but less so in global models (Pye and Seinfeld, 2010; Jathar et al., 2011; Jo et al., 25
2013; Tsimpidi et al., 2014; Hodzic et al., 2015). Other studies have used the 2D-VBS (Donahue et al., 2011;
Murphy et al., 2011), an approach that on top of the volatility space it also resolves that of chemical
composition, by tracking the amount of oxygenation in the representative organic compounds. However, it is
not implemented in global models, due to its large amount of tracers and the large number of free parameters
that are involved in the parameterization. 30
The inclusion of semi-volatile organics is important for accounting for the total mass of organics in the
particulate phase, since an increase in particulate organic matter may not be the result of chemically produced
low volatility species, but simply be reflecting a temperature-driven increase in the partitioning of semi-
Geosci. Model Dev. Discuss., doi:10.5194/gmd-2016-171, 2016Manuscript under review for journal Geosci. Model Dev.Published: 14 September 2016c© Author(s) 2016. CC-BY 3.0 License.
Page 3
3
volatile organic aerosol into the particle phase. It has been established that the very low volatility organics
play a key role in particle growth, while the range of volatilities contributing to aerosol growth increases with
aerosol size (Pierce et al., 2011; Yu, 2011). Semi-volatile organics also affect aerosol size and mixing state, as
well as their impact on climate, due to changes in cloud condensation nuclei (CCN) formation rates (Petters et
al., 2006, Riipenen et al., 2011; Scott et al., 2015), hygroscopicity, and new particle formation (Metzger et al., 5
2011; Paasonen et al., 2013). Since OA emissions are on the rise from developing countries (Lamarque et al.,
2010) and no Earth system model considers anthropogenic OA as semi-volatile as measurements suggest, it is
important to include and constrain semi-volatile organics to ultimately reduce uncertainties in aerosol radiative
forcing and make climate model simulated aerosol changes more realistic.
The objective of this study is to further develop an aerosol microphysics model by including a more advanced 10
representation of organic aerosol, including semi-volatile primary OA and an evolving OA volatility during
chemical ageing in the gas phase in its calculations. This objective was achieved by implementing the VBS
framework in the aerosol microphysical scheme MATRIX (Bauer et al., 2008), which represents major aerosol
processes such as nucleation, condensation (excluding organics in its original version) and coagulation, and
explicitly tracks the mixing state of different aerosol populations. As many traditional chemistry-climate 15
models do (Tsigaridis et al., 2014), MATRIX treats POA and SOA as non-volatile (Bauer et al., 2008). By
coupling MATRIX with VBS, POA are treated as condensable semi-volatile organic compounds. These can
partition among different aerosol populations based on their volatility and aerosol population size distribution,
capturing particle growth via condensation of low volatility organic vapors, thus providing a more physically-
based calculation of aerosol microphysics. 20
The semi-volatile nature of biogenic SOA is not represented in the VBS framework in this work. Instead,
biogenic SOA are treated as non-volatile, as in the original MATRIX version, and are produced with a 10%
constant yield from terpenes emissions without any requirement for oxidation before the OA is formed
(Lathière et al., 2005; Tsigaridis et al., 2014). The inclusion of semi-volatile biogenic SOA will be
parameterized in the same way as in the VBS framework presented here in the future. 25
2 Model description
A box model is used for this study. The gas phase chemical mechanism CBM-IV (Gery et al., 1989), as used
in the NASA GISS ModelE (Shindell et al., 2001; Shindell et al., 2003), is coupled to the MATRIX aerosol
microphysics scheme, utilizing the Kinetic Pre-Processor KPP (Sandu and Sander, 2006) to solve the
differential equations of the gas phase chemistry scheme. 30
Geosci. Model Dev. Discuss., doi:10.5194/gmd-2016-171, 2016Manuscript under review for journal Geosci. Model Dev.Published: 14 September 2016c© Author(s) 2016. CC-BY 3.0 License.
Page 4
4
2.1 MATRIX box model
MATRIX (Multiconfiguration Aerosol TRacker of mIXing state; Bauer et al., 2008) is an aerosol
microphysical model based on the Quadrature Method of Moments scheme (McGraw, 1997) in the NASA
GISS ModelE Earth System Model, which can be used either as a module within the global model or as a
stand-alone box-model. Here, the stand-alone box model is used for development. The design of the code is 5
such that the box-model code can be used as-is in the global model, without any changes, allowing for
seamless transition and maximum portability. MATRIX is designed to resolve the aerosol temporal evolution
and represent the mixing states of a user-selected set of aerosol populations. It describes new particle
formation, particle growth through condensation with explicit treatment of sulfuric acid condensation and
lumped treatment of the NH4-NO3-H2O system, as well as coagulation of particles among different 10
populations. Each aerosol population has its own set of aerosol components, which may be primary (from
direct aerosol emissions), secondary (formed by nucleation or condensation of gas phase components onto
existing primary particles), or mixed (from any constituent, following condensation on primary aerosols or
coagulation between primary/secondary/mixed populations).
2.2 VBS framework 15
The volatility-basis set approach is introduced to the original model; it is an organic aerosol volatility
parameterization that separates semi-volatile organic compounds into logarithmically-spaced bins of effective
saturation concentrations, which are used for gas-particle partitioning and photochemical aging (Donahue et
al., 2006). The scheme groups organic compounds into nine surrogate VBS species according to their effective
saturation concentrations (C*) at 298 K, which are separated by factors of ten, ranging from 10-2 to 106 μg m-3. 20
Species in the 10-2 μg m-3 bin are the least volatile ones and partition almost exclusively to the particulate
phase, while species in the 106 μg m-3 bin are the most volatile ones and remain almost exclusively in the gas
phase. These compounds can become chemically aged while in the gas phase following reaction with •OH
radicals, which results in oxidizing to a species with a factor of 10 lower volatility (Donahue et al., 2006).
Parameters and names used to represent them in this study are listed in Table 1. 25
3 Model development
In the original version of the MATRIX model, organics only contribute to particle growth and mix with other
aerosol species via coagulation. Primary organic aerosols are emitted only as non-volatile particulate organic
matter, and do not exist in the gas phase or interact with other aerosol populations. Implementing the VBS
scheme adds these missing processes. Before this development, there were eight alternative configurations of 30
MATRIX available to the user, each representing a distinct set of aerosol populations whose number,
Geosci. Model Dev. Discuss., doi:10.5194/gmd-2016-171, 2016Manuscript under review for journal Geosci. Model Dev.Published: 14 September 2016c© Author(s) 2016. CC-BY 3.0 License.
Page 5
5
composition and interactions by coagulation vary. A ninth configuration with 15 selected aerosol populations
is created for this study (Table 2), which builds on top of configuration 1 in Bauer et al., 2008, in which eight
of the 14 populations, ACC, OCC, BC1, BC2, OCS, BOC, BCS, and MXX, are set to contain organics as
semi-volatile VBS species. We only included semi-volatile organics in eight populations, so that we can
examine the BC-OA-sulfate-nitrate system first, before adding them into the nucleation population AKK and 5
the dust and sea salt populations (DD1, DS1, DD2, DS2, SSA, SSC). Through coagulation, the fifteen donor
populations grow or mix and are placed into recipient populations, based on the donor population composition,
as described in Bauer et al. (2008). In a future stage, organics will also be implemented in the AKK mode to
present nanoparticle growth and we will include an additional nucleation scheme that considers the
dependence of new particle formation that involve organics (Kirkby et al. 2016, Tröstl et al. 2016). 10
Previously, each aerosol population carried up to 5 tracers – sulfate, black carbon, nonvolatile organics, dust
and sea salt. Now the eight organic-containing populations carry 9 additional semi-volatile VBS species listed
in Table 1, to up to 14 available tracers per population, with the original organics tracer representing non-
volatile OA, as it did in the original mechanism. This newly coupled model MATRIX-VBS treats POA as
semi-volatile gas phase species, which then partition into and out of the particulate phase. 15
4 Simulations
To test the newly developed model’s behavior, we simulated idealized cases representative of four different
locations of different environments: one very polluted city (Beijing), another cleaner yet still very polluted
city at high altitude (Mexico City) and closer to the tropics, a very clean Finnish forest (Hyytiälä), and an
anthropogenically-affected forest in the Southeast U.S. (Centreville, Alabama). The experiments are 20
performed for a winter (January) and a summer month (July) for ten days, and initial conditions and emission
rates for each location were extracted from a GISS ModelE simulation (similar setup as described in
Mezuman et al., 2016) for the year 2006, listed in Table 3, with no deposition and dilution, for simpler mass-
balance calculations. Semi-volatile POA, sulfate in the accumulation mode, and black carbon, are emitted in
the OCC, ACC, BC1 populations, respectively, shown in Figure 1 as yellow circles. The emission rates for the 25
VBS species were derived from the POA emission rate in the global model for the corresponding gridbox and
month, which were distributed in the volatility space by using mass-based emission factors from Shrivastava
et al. 2008 (Table 1). Adding up the 9 factors from each bin listed in Table 1, we obtain a total factor of 2.5,
which means the new scheme’s organics emission is 2.5 times that of the organics emissions in the original
scheme. The additional multiplication factor of 1.5 is applied to the emission to account for missing sources of 30
volatile organics in the IVOC volatility regime in the inventories. Hodzic et al. (2015) showed that
Geosci. Model Dev. Discuss., doi:10.5194/gmd-2016-171, 2016Manuscript under review for journal Geosci. Model Dev.Published: 14 September 2016c© Author(s) 2016. CC-BY 3.0 License.
Page 6
6
Shrivastava et al. (2008) overestimates biomass burning, which could affect the emission factors we used,
however, it is not an issue for the idealized experiments in the present study.
Black carbon is uniquely treated in MATRIX, in order to separate the coated (via condensation) from the
mixed (via coagulation) populations. It is emitted in BC1, which can grow (blue arrow in Figure 1) with
inorganic and organic coating, and as its coating volume fraction reaches 5%, it would be moved in the BC2 5
population, shown as the orange circle. The four organic-containing populations described above can
coagulate (black arrows in Figure 1) with themselves and each other and form three additional organic-
containing mixed populations, BOC, OCS and BCS, shown as green circles. This schematic includes seven of
the eight organic-containing populations in the model.
5 Results and discussion 10
The temporal evolution of the total organics mass concentrations from the new scheme and the old scheme are
presented in Figure 2 for January and Figure 3 for July in the four locations under study. They show large
changes in organics concentrations between the old scheme (black line on the right column) and the new one
(colors). The organics in the new scheme are represented and distributed by organic tracers of different
volatility, whose saturation concentration C* ranges from the least volatile 10-2 μg m-3 (“M2” in Figures 2 and 15
3) to the most volatile 106 μg m-3 (“P6” in Figures 2 and 3). They are distributed between the gas and aerosol
phases by gas-particle partitioning, whereas the organics in the original scheme are only represented by one
nonvolatile organic aerosol tracer (‘OCAR’).
As mentioned in the model description, the emission rates for organics in the each of the volatility bin in the
new scheme were derived from the mass-based emission factors, of 2.5, from Shrivastava et al. 2008. 20
Consequently, since there is no deposition and dilution in the simulations, the new scheme’s organics total
mass concentrations (shown in color in the right columns of Figures 2 and 3) always adds up to 2.5 times that
of the old scheme (shown as dash-dotted lines) throughout the simulations in both January and July.
5.1 Winter
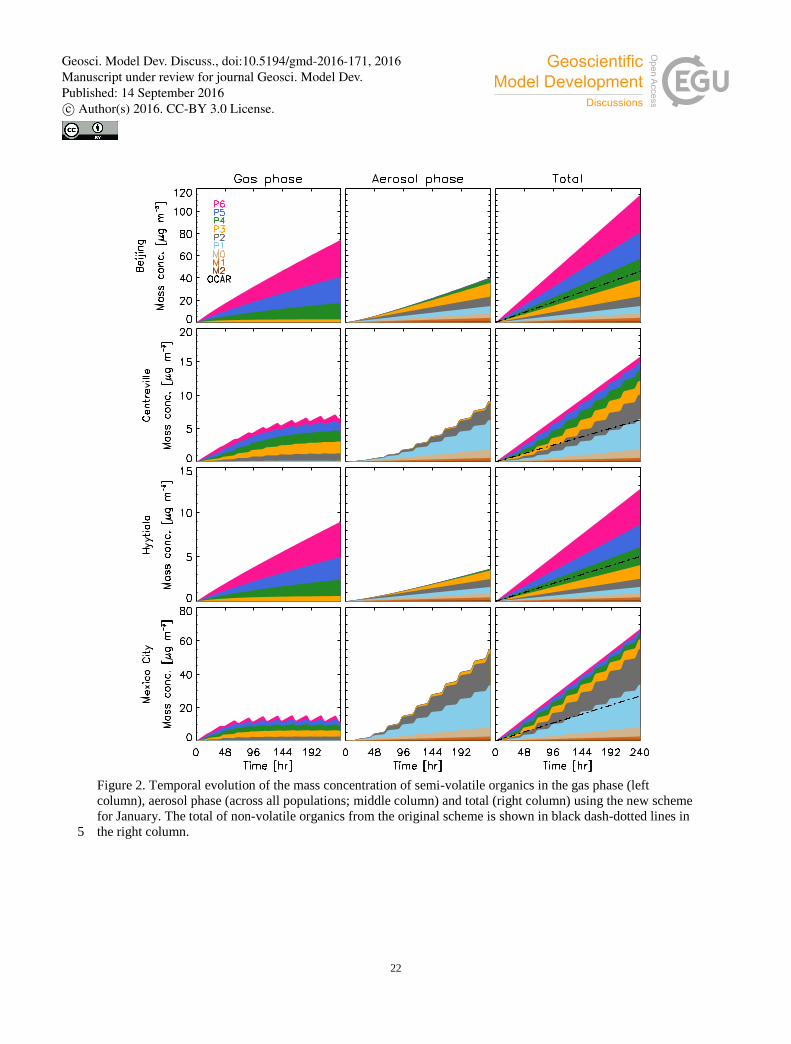
In January, the total mass concentration for organics in Beijing, Centreville, Hyytiälä and Mexico City at the 25
end of 10 days are about 115 μg/m3, 16 μg/m3, 13 μg/m3, and 65 μg/m3, respectively. Organic VBS species
partition between the gas and aerosol phases within their corresponding volatility bin. The more volatile the
species, the more it partitions into the gas phase. The concentration evolution of VBS species in the gas phase
from the four locations are shown in the left column of Figure 2 for January. From top to bottom in each panel,
volatility decreases from the most volatile species (“P6”) to the least one (“M2”). Although semi-volatile 30
organics are emitted in the aerosol phase, in the high volatility range from P6 to P4 bins, the species are so
Geosci. Model Dev. Discuss., doi:10.5194/gmd-2016-171, 2016Manuscript under review for journal Geosci. Model Dev.Published: 14 September 2016c© Author(s) 2016. CC-BY 3.0 License.
Page 7
7
volatile that they evaporate and partition into the gas phase almost completely. Volatile organics are oxidized
in the gas phase by the extremely reactive hydroxyl radicals (•OH) during daytime, and as they become more
oxidized, their volatility decreases and they move down to the adjacent lower volatility bin. This oxidation
process is called “aging” in the VBS framework. For example, species from the P6 bin are emitted in the
aerosol phase, but because they are so volatile, they evaporate immediately into the gas phase. During daytime, 5
when OH radicals are abundant, they age, become less volatile, and are placed in the lower volatility bin P5,
which has a C* one order of magnitude lower than its precursor. Similarly, as gas phase species in all
volatility bins age, they get oxidized, become less volatile, and move further down the volatility space. At
intermediate volatilities species are becoming less volatile, and they no longer completely evaporate after
emission, but are present in both the gas and the aerosol phases, following partitioning. However, they 10
continue to become even less oxidized following oxidation by OH, until they have such low volatility that
they almost exclusively partition into the aerosol phase (Figure 2 middle column).
In all four locations, almost all species in the high volatility range are in the gas phase, those in the
intermediate volatility range partition between the gas and aerosol phases, and those in the low volatility range
are in the aerosol phase in January. This is especially true for Beijing and Hyytiälä, where the volatility 15
distributions are very similar (in relative terms), where the total concentration of gas phase species is higher
than the sum of all aerosol-phase species. In Centreville, the total amount of gas phase species is about the
same with that of the aerosol phase species, whereas in Mexico City there are more species in the aerosol than
in the gas phase. In Centreville and Mexico City the species show a diurnal variability, which will be
explained later. 20
Aging can help explain the similar volatility distributions in Beijing and Hyytiälä. The •OH concentration in
both locations are low in January: Beijing’s mean •OH is about 105 molecules/cm3 and Hyytiälä’s mean •OH is
about 104 molecules/cm3. Low •OH concentrations limit the aging of high volatility organics and their ability
to move to the lower volatility bins, thus the volatility distributions do not change drastically, something that
is also evident by the lack of a daily cycle. On the other hand, much higher mean •OH concentrations in 25
Centreville (2*106 molecules/cm3) and Mexico City (5*106 molecules/cm3) provide more oxidation power,
making oxidation a significant pathway in aerosol evolution. The higher mean •OH concentrations also explain
the diurnal variability of both gas phase and aerosol phase mass concentrations we see in the two locations,
because •OH is only produced during daytime and has very low concentrations during night. Since Mexico
City has slightly higher •OH concentration than Centreville, its total gas phase reaches a dynamic equilibrium 30
after about 4 days, whereas Centreville’s total gas phase continues to rise approaching equilibrium at a slower
pace.
Looking at the total of the organics (right column of Figure 2), it is not surprising that the very polluted
Beijing has the highest concentration of total organics while the cleanest location, Hyytiälä, has the lowest;
Geosci. Model Dev. Discuss., doi:10.5194/gmd-2016-171, 2016Manuscript under review for journal Geosci. Model Dev.Published: 14 September 2016c© Author(s) 2016. CC-BY 3.0 License.
Page 8
8
what is interesting, however, is that organics at these locations share similar volatility distributions. By the end
of the 10-day simulations in the new scheme, the volatility distributions in Beijing and Hyytiälä are very
similar to the emission factors distribution among the volatility, with factor differences of less than 0.1. This
behavior is, again, a result of the low •OH concentrations in the two locations, and the low oxidation rate that
limits the change in volatility distribution. Volatility is also temperature dependent, which is also relevant to 5
the total aerosols present. In Beijing, we would expect more gas phase due to the higher temperatures.
However, the larger amount of aerosols moves the partitioning point towards the aerosol phase, which offsets
the temperature difference in the colder Hyytiälä case, and gives us similar results.
On the other hand, the volatility distributions in Centreville and Mexico City are very different from the
applied emission factor distribution, except the two bins in the lowest volatility range M2 and M1. Due to the 10
high concentrations of •OH, both sites have low gas phase organics concentrations because the high volatility
gases are more efficiently oxidized and their less-volatile products partition into the aerosol phase. Therefore,
the relative amount of organics from the high volatility range no longer resembles the applied emission factors.
The organics in the high volatility range from P6 to P4, are totaling a factor of around 0.15, which is in sharp
contrast to the factors of 0.4, 0.5, 0.8 applied to each of the respective bins. 15
5.2 Summer
The total mass concentration of organics in Beijing and Mexico City at the end of 10 days in July are about
130 μg/m3 and 67 μg/m3, very similar to the amounts in January. However, Centreville and Hyytiälä have
much more organics than they did in January, with 90 μg/m3 and 43 μg/m3. The volatility distributions for the
four locations in July (Figure 3) is also very different from that of January. Organics are all very low in the 20
high and intermediate volatility ranges and are all high in the low volatility ranges, with less than 10% of the
total organics in the gas phase in all four locations. This behavior means that at all locations oxidation is very
strong, stronger than any place during January. This sharp change in behavior is caused by the difference in
•OH concentrations during the two months. July’s concentrations are much higher than those in January
because •OH production is increased due to increased photolysis in the summer. The mean •OH concentration 25
is about 1.5*107 molecules/cm3 in Beijing and Hyytiälä, and it is about 1*107 molecules/cm3 in Centreville and
2*107 molecules/cm3 in Mexico City. More •OH leads to faster oxidation of the gas phase organics and the
consequent partitioning of the less-volatile oxidation products into the aerosol phase. This is evident in Figure
3, where the gas phase concentrations in all four locations are very low. In all cases, dynamic equilibrium was
reached after just two days. They also exhibit a strong diurnal variability, as expected from the fast •OH 30
oxidation, which decreases with decreasing volatility.
Geosci. Model Dev. Discuss., doi:10.5194/gmd-2016-171, 2016Manuscript under review for journal Geosci. Model Dev.Published: 14 September 2016c© Author(s) 2016. CC-BY 3.0 License.
Page 9
9
5.3 Mixing state
The temporal evolution of total organic aerosol mass concentration per population is shown in Figure 4
(absolute amounts) and Figure 5 (relative amounts). The first and third columns are results from the new
scheme with condensing and coagulating organics for January and July, respectively, while the second and
fourth columns are results from the old scheme with only coagulating organics from January and July, 5
respectively. The organic aerosol mass concentrations in Figure 4 correspond to the aerosol phase
concentrations in Figures 2 and 3 (middle column), except they are now separated by population, whereas in
the earlier two figures they were separated by mass tracers representing volatility. At a first glance, the
population with the highest organic mass is BOC for January and July in both schemes. BOC is the population
that contains OC, BC, and sulfate, and is the end result of coagulation of all populations in our idealized cases. 10
However, in the old scheme, populations OCC and OCS also have significant amounts of organics. This is
because in the new scheme the emitted populations are ACC, BC1 and OCC, and organics that are emitted in
the OCC population can condense on and/or coagulate with other populations, including being lost by
evaporation and then repartitioning to other populations. Thus there is an additional loss mechanism of
organics from those populations in the new scheme. In addition, there is competition between the ACC and 15
BC1 populations in both schemes, and in the new scheme, aerosol phase organics in the OCC population
could either coagulate with the ACC population to form OCS, or they could coagulate with the BC1
population to form BOC. This competition determines how much OCS and BOC are formed, and it effects
how much gas phase organics from the OCC population could condense on the two populations and the
distribution of organics among the populations. Since partitioning adds a loss mechanism to OCC, part of the 20
evaporated mass will go to BOC, making it larger, and a more efficient scavenger of other particles. As a
result, most organics coagulate with and condense on the BOC population and/or the OCS population, and
together with the emitted OCC population, hold the most organics and dominate the mass fractions.
There is some similarity between the January and July results between the new and the old schemes (Figure 5).
This similarity means that the distribution of organics among aerosol populations is not significantly affected 25
by season. This is consistent with a study by Bauer et al. (2013), where they found that the mixing state
distribution is rather a characteristic of a region and not so much of a season, although the total (absolute)
amounts by season may vary. By the end of the simulations, most locations have more organics present in the
BOC population, except those in Centreville. The reason of this is sulfate; from the sulfate and black carbon
emissions listed in Table 3, we can calculate the sulfate to black carbon ratio in Centreville to be 2:1, higher 30
than the corresponding ratios in all other locations. This high ratio helps the ACC population to survive the
competition against BC1 for coagulation with OCC. This leads to higher OCS formation, which is available
for gas phase organics to condense on, thus coagulation and condensation both bring more organics in the
Geosci. Model Dev. Discuss., doi:10.5194/gmd-2016-171, 2016Manuscript under review for journal Geosci. Model Dev.Published: 14 September 2016c© Author(s) 2016. CC-BY 3.0 License.
Page 10
10
OCS population during the first half of the simulation. These results show that the sulfate to black carbon ratio
is important for the mixing state by delaying the inevitable BOC domination. Also, comparing the distribution
fraction in Figure 5, volatile organics create rather different mixing states as those created by coagulation
alone in the original scheme, meaning that the semi-volatility did alter mixing state significantly.
5.4 Size distribution 5
Another important factor on the evolution of aerosols is their size distribution. Shown in Figures 6 and 7 are
the January size distributions from Mexico City and Centreville. The first row shows number concentration,
the second row surface area, and the third row volume. The first two columns are results from the new and old
schemes after 24 hours of simulation, and the right two columns are after 120 hours. The total number
concentration, surface area and volume from the eight populations are shown as dotted lines. Note also that 10
these plots show the total aerosol size distribution per population, which includes the contribution of species
other than organics.
The size distributions in July are very similar to January in all locations, therefore only January is shown here.
Beijing, Hyytiälä and Mexico City exhibit somewhat similar size distributions (with different absolute
amounts), just as their mass fractions. The size distribution is dominated by OCC, OCS and BOC in the first 3 15
to 4 days, but later only by BOC. On the other hand, Centreville, similar to its mixing state, is different in size
distribution of different aerosol populations from the other three locations. Therefore, only size distributions
of Mexico City and Centreville are shown here.
In the new scheme for Mexico City after 24 hours of simulation, the number concentration has two modes.
OCC has even smaller size as Aitken mode sulfate AKK does, as a result of the evaporation of organics, but 20
its number concentration is higher. OCS and BOC have started to form from coagulation of OCC with ACC
and BC1, and their diameter, number concentration, surface area and volume are very similar, almost
overlapping, with BOC slightly smaller in diameter. After 120 hours of simulation, OCC’s number
concentration has decreased significantly, from 2*106 m-3 to 0.5*106 m-3. This is because OCC is semi-volatile,
it has evaporated and condensed onto other populations, and at the same time its loss due to coagulation with 25
other populations has increased, due to the increase of their number concentration and decrease in size. OCS
size grew very slightly, but BOC grew significantly, with peaks of surface area and volume both increasing
about one order of magnitude. Its peak surface area increased from 3*105 μm2m-3 to 3*106 μm2m-3, and its
peak volume grew from about 1*105 μm3m-3 to 1*106 μm3m-3. BOC’s growing large surface area is another
reason why it has so much organics and dominates the mass concentration: the greater the surface area, the 30
more gas phase species are able to condense. This matches the mixing state results (Figure 5), where we saw
after 24 hours ACC, OCC and BOC have high mass fractions, whereas after 120 hours OCC and OCS are
negligible, and more than 90% of the total organic aerosol mass is in the BOC population.
Geosci. Model Dev. Discuss., doi:10.5194/gmd-2016-171, 2016Manuscript under review for journal Geosci. Model Dev.Published: 14 September 2016c© Author(s) 2016. CC-BY 3.0 License.
Page 11
11
In the old scheme, after 24 hours OCC has much higher number concentration (peaking at 1.2*107 m-3) and
size than in the new scheme, and higher surface area and volume, due to its greater number and diameter. OCS
and BOC are both fewer in number (peaks are 2*106 m-3 and 1*106 m-3 lower in the old scheme) but slightly
greater in diameter than they are in the new scheme. Later, after 120 hours, OCC decreases in number to a
peak at 1.2*107 m-3, due to coagulation with ACC and BC1 to form more OCS and BOC. Therefore, OCS and 5
BOC increased in number and size, with BOC seeing greater growth (the peak of number concentration
increased 6-fold, from 3*106 m-3 to 1.8*107 m-3, the peak of surface area increased from 3*105 μm2m-3 to
4.3*106 μm2m-3 and the peak of volume increased from 1*105 μm3m-3 to 1.6*106 μm2m-3). For OCS we
calculated more modest changes, with number, surface area and volume concentration peaks all increasing by
less than 50%: the number concentration from 2*106 m-3 to 3*106 m-3, surface area from 3*105 μm2m-3 to 10
4*105 μm2m-3 and volume from 0.8*105 μm3m-3 to 1*105 μm2m-3, as seen in the new scheme as well. However,
BOC’s growth in the old scheme is even greater than that in the new scheme. This slightly accelerated growth
slows down at later hours (not shown), because BOC dominates faster in the new scheme than in the old one
(Figure 4).
The Centreville size distributions tells a different story. In the early stages with the new scheme, OCS has 15
greater number concentration and size than BOC does; OCS’s peak number concentration is 2*106 m-3, more
than double than that of BOC, while its surface area and volume are 2*106 μm2m-3 and 0.5*105 μm3m-3,
whereas those of BOC are negligible. Later, OCS still outgrows BOC in number, but not in size. BOC shifts to
greater diameters, therefore it has greater surface area and volume than OCS does after 120 hours. As for the
old scheme, OCC does not decrease in number from 24 hours to 120 hours as it does in Mexico City, but its 20
number increases from 4*106 m-3 to 7*106 m-3. This means that in that period of time coagulation loss is less
than the amount of OCC emitted, which is what was also seen earlier for the mass concentrations (Figure 2).
At 120 hours, OCS has again higher number concentration than BOC does, but only slightly (peak number
concentration difference is less than 1*106 m-3) and not as much as in the case of Mexico City, and the latter’s
surface area and volume continue to be greater than those of the former due to its increasing diameter. 25
6 Conclusions
Organic aerosol volatility calculations were implemented into a new aerosol microphysics scheme, MATRIX-
VBS. Results from idealized cases in Beijing, Centreville, Hyytiälä and Mexico City during summer and
winter using the new scheme were compared against the original scheme and showed how the inclusion of
semi-volatility of organics affected aerosol mass concentration, as well as their mixing state and size 30
distribution. Emission factors, •OH oxidation, temperature and total aerosol levels are the key factors
determining organics’ volatility distribution and mass concentration. The mixing state is affected by particle
size and concentration, which determines coagulation and condensation pathways. Results from the new
Geosci. Model Dev. Discuss., doi:10.5194/gmd-2016-171, 2016Manuscript under review for journal Geosci. Model Dev.Published: 14 September 2016c© Author(s) 2016. CC-BY 3.0 License.
Page 12
12
scheme showed different mixing state distribution from the original scheme.
Going forward, the new scheme will be simplified, and we will reduce the number of tracers needed, in order
to simplify the model and save computational resources, without losing the essential information needed for
volatility. The simplified version of the box model will then be implemented in the NASA GISS ModelE
Earth System Model. While this study is purely theoretical, we will evaluate MATRIX-VBS after its 5
implementation into GISS ModelE. We will gain even better understanding of how semi-volatile organics are
altering aerosol mixing state, how meteorological conditions and pollution levels influence organics’ volatility
distribution, as well as their mixing state in the real world, and what implications these processes have on the
climate system.
10
Code Availability
This model development is part of GISS ModelE Earth System Model, which is publicly available.
Acknowledgements
We thank the NASA Modeling, Analysis, and Prediction program, which supports the GISS ModelE 15
development.
Geosci. Model Dev. Discuss., doi:10.5194/gmd-2016-171, 2016Manuscript under review for journal Geosci. Model Dev.Published: 14 September 2016c© Author(s) 2016. CC-BY 3.0 License.
Page 13
13
References
Athanasopoulou, E., Vogel, H., Vogel, B., Tsimpidi, A. P., Pandis, S. N., Knote, C., and Fountoukis, C.:
Modeling the meteorological and chemical effects of secondary organic aerosols during an EUCAARI
campaign, Atmos. Chem. Phys., 13, 625-645, doi:10.5194/acp-13-625-2013, 2013. 5
Bauer, S. E., Wright, D., Koch, D., Lewis, E. R., McGraw, R., Chang, L.-S., Schwartz, S. E. and Ruedy, R.:
MATRIX (Multiconfiguration Aerosol TRacker of mIXing state): an aerosol microphysical module for global
atmospheric models, Atmos. Chem. Phys. Discuss., 8(3), 9931–10003, doi:10.5194/acpd-8-9931-2008, 2008.
10
Bauer, S. E., Ault, A. and Prather, K. A.: Evaluation of aerosol mixing state classes in the GISS modelE‐MATRIX climate model using single‐particle mass spectrometry measurements, J. Geophys. Res. Atmos., 118,
9834–9844, doi:10.1002/jgrd.50700, 2013.
Bergström, R., Denier van der Gon, H. A. C., Prévôt, A. S. H., Yttri, K. E., and Simpson, D.: Modelling of 15
organic aerosols over Europe (2002–2007) using a volatility basis set (VBS) framework: application of
different assumptions regarding the formation of secondary organic aerosol, Atmos. Chem. Phys., 12, 8499-
8527, doi:10.5194/acp-12-8499-2012, 2012.
Boucher, O., Randall, D., Artaxo, P., Bretherton, C., Feingold, G., Forster, P., Kerminen, V.-M., Kondo, Y., 20
Liao, H., Lohmann, U., Rasch, P., Satheesh, S.K., Sherwood, S., Stevens, B., and Zhang, X.Y.: Clouds and
Aerosols. In: Climate Change 2013: The Physical Science Basis. Contribution of Working Group I to the Fifth
Assessment Report of the Intergovernmental Panel on Climate Change, edited by: Stocker, T. F., Qin, D.,
Plattner, G.-K., Tignor, M., Allen, S. K., Boschung, J., Nauels, A., Xia, Y., Bex, V., and Midgley, P. M.,
Cambridge University Press, Cambridge, UK and New York, NY, USA, 571-657 pp., 25
doi:10.1017/CBO9781107415324, 2013.
Donahue, N. M., Robinson, a. L., Stanier, C. O. and Pandis, S. N.: Coupled partitioning, dilution, and
chemical aging of semivolatile organics, Environ. Sci. Technol., 40(8), 2635–2643, doi:10.1021/es052297c,
2006. 30
Donahue, N. M., Epstein, S. A., Pandis, S. N. and Robinson, A. L.: A two-dimensional volatility basis set: 1.
organic-aerosol mixing thermodynamics, Atmos. Chem. Phys., 11(7), 3303–3318, doi:10.5194/acp-11-3303-
2011, 2011.
35
Fountoukis, C., Racherla, P. N., Denier van der Gon, H. A. C., Polymeneas, P., Charalampidis, P. E., Pilinis,
C., Wiedensohler, A., Dall'Osto, M., O'Dowd, C., and Pandis, S. N.: Evaluation of a three-dimensional
chemical transport model (PMCAMx) in the European domain during the EUCAARI May 2008 campaign,
Atmos. Chem. Phys., 11, 10331-10347, doi:10.5194/acp-11-10331-2011, 2011.
40
Fountoukis, C., Megaritis, A. G., Skyllakou, K., Charalampidis, P. E., Pilinis, C., Denier van der Gon, H. A.
C., Crippa, M., Canonaco, F., Mohr, C., Prévôt, A. S. H., Allan, J. D., Poulain, L., Petäjä, T., Tiitta, P.,
Carbone, S., Kiendler-Scharr, A., Nemitz, E., O'Dowd, C., Swietlicki, E., and Pandis, S. N.: Organic aerosol
concentration and composition over Europe: insights from comparison of regional model predictions with
aerosol mass spectrometer factor analysis, Atmos. Chem. Phys., 14, 9061-9076, doi:10.5194/acp-14-9061-45
2014, 2014.
Geosci. Model Dev. Discuss., doi:10.5194/gmd-2016-171, 2016Manuscript under review for journal Geosci. Model Dev.Published: 14 September 2016c© Author(s) 2016. CC-BY 3.0 License.
Page 14
14
Gery, M.W., Whitten, G. Z., Killus, J. P., and Dodge, M. C.: A photochemical kinetics mechanism for urban
and regional scale computer modeling, J. Geophys. Res., 94, 12925–12956, doi:10.1029/JD094iD10p12925,
1989.
Heald, C. L., Jacob, D. J., Park, R. J., Russell, L. M., Huebert, B. J., Seinfeld, J. H., Liao, H. and Weber, R. J.: 5
A large organic aerosol source in the free troposphere missing from current models, Geophys. Res. Lett.,
32(18), 1–4, doi:10.1029/2005GL023831, 2005.
Hodzic, A., Jimenez, J. L., Madronich, S., Canagaratna, M. R., Decarlo, P. F., Kleinman, L. and Fast, J.:
Modeling organic aerosols in a megacity: Potential contribution of semi-volatile and intermediate volatility 10
primary organic compounds to secondary organic aerosol formation, Atmos. Chem. Phys., 10(12), 5491–5514,
doi:10.5194/acp-10-5491-2010, 2010.
Hodzic, A., Kasibhatla, P. S., Jo, D. S., Cappa, C., Jimenez, J. L., Madronich, S., and Park, R. J.: Rethinking
the global secondary organic aerosol (SOA) budget: stronger production, faster removal, shorter lifetime, 15
Atmos. Chem. Phys. Discuss., 15, 32413-32468, doi:10.5194/acpd-15-32413-2015, 2015.
Jathar, S. H., Farina, S. C., Robinson, a. L. and Adams, P. J.: The influence of semi-volatile and reactive
primary emissions on the abundance and properties of global organic aerosol, Atmos. Chem. Phys., 11(15),
7727–7746, doi:10.5194/acp-11-7727-2011, 2011. 20
Jimenez, J. L., Canagaratna, M. R., Donahue, N. M., Prevot, a S. H., Zhang, Q., Kroll, J. H., DeCarlo, P. F.,
Allan, J. D., Coe, H., Ng, N. L., Aiken, a C., Docherty, K. S., Ulbrich, I. M., Grieshop, a P., Robinson, a L.,
Duplissy, J., Smith, J. D., Wilson, K. R., Lanz, V. a, Hueglin, C., Sun, Y. L., Tian, J., Laaksonen, a,
Raatikainen, T., Rautiainen, J., Vaattovaara, P., Ehn, M., Kulmala, M., Tomlinson, J. M., Collins, D. R., 25
Cubison, M. J., Dunlea, E. J., Huffman, J. a, Onasch, T. B., Alfarra, M. R., Williams, P. I., Bower, K., Kondo,
Y., Schneider, J., Drewnick, F., Borrmann, S., Weimer, S., Demerjian, K., Salcedo, D., Cottrell, L., Griffin, R.,
Takami, a, Miyoshi, T., Hatakeyama, S., Shimono, a, Sun, J. Y., Zhang, Y. M., Dzepina, K., Kimmel, J. R.,
Sueper, D., Jayne, J. T., Herndon, S. C., Trimborn, a M., Williams, L. R., Wood, E. C., Middlebrook, a M.,
Kolb, C. E., Baltensperger, U. and Worsnop, D. R.: Evolution of organic aerosols in the atmosphere., Science, 30
326(5959), 1525–1529, doi:10.1126/science.1180353, 2009.
Jo, D. S., Park, R. J., Kim, M. J., and Spracklen, D. V.: Effects of chemical aging on global secondary organic
aerosol using the volatility basis set approach, Atmos. Environ., 81, 230– 244, 2013.
35
Kirkby, J., Duplissy, J., Sengupta, K., Frege, C., Gordon, H., Williamson, C., Heinritzi, M., Simon, M., Yan,
C. and Almeida, J.: Ion-induced nucleation of pure biogenic particles, Nature, 533(7604), 521–526,
doi:10.1038/nature17953, 2016.
Lamarque, J. F., Bond, T. C., Eyring, V., Granier, C., Heil, A., Klimont, Z., Lee, D., Liousse, C., Mieville, A., 40
Owen, B., Schultz, M. G., Shindell, D., Smith, S. J., Stehfest, E., Van Aardenne, J., Cooper, O. R., Kainuma,
M., Mahowald, N., McConnell, J. R., Naik, V., Riahi, K. and Van Vuuren, D. P.: Historical (1850-2000)
gridded anthropogenic and biomass burning emissions of reactive gases and aerosols: Methodology and
application, Atmos. Chem. Phys., 10(15), 7017–7039, doi:10.5194/acp-10-7017-2010, 2010.
45
Lathière, J., Hauglustaine, D. A., De Noblet-Ducoudré, N., Krinner, G. and Folberth, G. A.: Past and future
changes in biogenic volatile organic compound emissions simulated with a global dynamic vegetation model,
Geophys. Res. Lett., 32(20), L20818, doi:10.1029/2005GL024164, 2005.
McGraw, R.: Description of Aerosol Dynamics by the Quadrature Method of Moments, Aerosol Sci. Technol., 50
27(2), 255–265, doi:10.1080/02786829708965471, 1997.
Geosci. Model Dev. Discuss., doi:10.5194/gmd-2016-171, 2016Manuscript under review for journal Geosci. Model Dev.Published: 14 September 2016c© Author(s) 2016. CC-BY 3.0 License.
Page 15
15
Metzger, A., Verheggen, B., Dommen, J., Duplissy, J., Prevot, A. S. H., Weingartner, E., Riipinen, I., Kulmala,
M., Spracklen, D. V., Carslaw, K. S., and Baltensperger, U.: Evidence for the role of organics in aerosol
particle formation under atmospheric conditions, P. Natl. Acad. Sci. USA, 107, 6646–6651,
doi:10.1073/pnas.0911330107, 2010. 5
Mezuman, K., Bauer, S. E., and Tsigaridis, K.: Evaluating Secondary Inorganic Aerosols in 3-Dimensions,
Atmos. Chem. Phys. Discuss., doi:10.5194/acp-2016-199, in review, 2016.
Murphy, B. N. and Pandis, S. N.: Simulating the formation of semivolatile primary and secondary organic 10
aerosol in a regional chemical transport model, Environ. Sci. Technol., 43(13), 4722–4728,
doi:10.1021/es803168a, 2009.
Murphy, B. N., Donahue, N. M., Fountoukis, C. and Pandis, S. N.: Simulating the oxygen content of ambient
organic aerosol with the 2D volatility basis set, Atmos. Chem. Phys., 11(15), 7859–7873, doi:10.5194/acp-11-15
7859-2011, 2011.
Myhre, G., Shindell, D., Bréon, F.-M., Collins, W., Fuglestvedt, J., Huang, J., Koch, D., Lamarque, J.-F., Lee,
D., Mendoza, B., Nakajima, T., Robock, A., Stephens, G., Takemura T., and Zhang, H.: Anthropogenic and
Natural Radiative Forcing. In: Climate Change 2013: The Physical Science Basis. Contribution of Working 20
Group I to the Fifth Assessment Report of the Intergovernmental Panel on Climate Change, edited by: Stocker,
T. F., Qin, D., Plattner, G.-K., Tignor, M., Allen, S. K., Boschung, J., Nauels, A., Xia, Y., Bex, V., and
Midgley, P. M., Cambridge University Press, Cambridge, UK and New York, NY, USA, 659-740 pp.,
doi:10.1017/CBO9781107415324, 2013.
25
Paasonen, P., Asmi, A., Petäjä, T., Kajos, M. K., Äijälä, M., Junninen, H., Holst, T., Abbatt, J. P. D., Arneth,
A., Birmili, W., van der Gon, H. D., Hamed, A., Hoffer, A., Laakso, L., Laaksonen, A., Richard Leaitch, W.,
Plass-Dülmer, C., Pryor, S. C., Räisänen, P., Swietlicki, E., Wiedensohler, A., Worsnop, D. R., Kerminen, V.-
M. and Kulmala, M.: Warming-induced increase in aerosol number concentration likely to moderate climate
change, Nat. Geosci., 6(6), 438–442, doi:10.1038/ngeo1800, 2013. 30
Petters, M. D., Prenni, A. J., Kreidenweis, S. M., DeMott, P. J., Matsunaga, A., Lim, Y. B., and Ziemann, P. J.:
Chemical aging and the hydrophobic-hydrophilic conversion of carbonaceous aerosol, Geophys. Res. Lett., 33,
L24806, doi:10.1029/2006GL027249, 2006.
35
Petters, M. D. and Kreidenweis, S. M.: A single parameter representation of hygroscopic growth and cloud
condensation nucleus activity, Atmos. Chem. Phys., 7, 1961-1971, doi:10.5194/acp-7-1961-2007, 2007.
Pierce, J. R., Riipinen, I., Kulmala, M., Ehn, M., Petäjä, T., Junninen, H., Worsnop, D. R. and Donahue, N. M.:
Quantification of the volatility of secondary organic compounds in ultrafine particles during nucleation events, 40
Atmos. Chem. Phys., 11(17), 9019–9036, doi:10.5194/acp-11-9019-2011, 2011.
Pye, H. O. T. and Seinfeld, J. H.: A global perspective on aerosol from low-volatility organic compounds,
Atmos. Chem. Phys., 10(9), 4377–4401, doi:10.5194/acp-10-4377-2010, 2010.
45
Riipinen, I., Pierce, J. R., Yli-Juuti, T., Nieminen, T., Häkkinen, S., Ehn, M., Junninen, H., Lehtipalo, K.,
Petäjä, T., Slowik, J., Chang, R., Shantz, N. C., Abbatt, J., Leaitch, W. R., Kerminen, V. -M., Worsnop, D. R.,
Pandis, S. N., Donahue, N. M., and Kulmala, M.: Organic condensation: a vital link connecting aerosol
formation to cloud condensation nuclei (CCN) concentrations, Atmos. Chem. Phys., 11, 3865–3878,
doi:10.5194/acp-11-3865- 2011, 2011. 50
Geosci. Model Dev. Discuss., doi:10.5194/gmd-2016-171, 2016Manuscript under review for journal Geosci. Model Dev.Published: 14 September 2016c© Author(s) 2016. CC-BY 3.0 License.
Page 16
16
Robinson, A. L., Donahue, N. M., Shrivastava, M. K., Weitkamp, E. a, Sage, A. M., Grieshop, A. P., Lane, T.
E., Pierce, J. R. and Pandis, S. N.: Rethinking organic aerosols: semivolatile emissions and photochemical
aging., Science, 315(5816), 1259–1262, doi:10.1126/science.1133061, 2007.
Sandu, A. and Sander, R.: Technical note: Simulating chemical systems in Fortran90 and Matlab with the 5
Kinetic PreProcessor KPP-2.1, Atmos. Chem. Phys., 6, 187-195, doi:10.5194/acp-6-187-2006, 2006.
Scott, C. E., Spracklen, D. V., Pierce, J. R., Riipinen, I., D'Andrea, S. D., Rap, A., Carslaw, K. S., Forster, P.
M., Artaxo, P., Kulmala, M., Rizzo, L. V., Swietlicki, E., Mann, G. W., and Pringle, K. J.: Impact of gas-to-
particle partitioning approaches on the simulated radiative effects of biogenic secondary organic aerosol, 10
Atmos. Chem. Phys., 15, 12989-13001, doi:10.5194/acp-15-12989-2015, 2015.
Seinfeld, J. H. and Pandis, S. N. : Atmospheric Chemistry and Physics: From Air Pollution to Climate Change,
third edition, John Wiley & Sons Inc., Hoboken, New Jersey, 2016.
15
Shindell, D. T., Grenfell, J. L., Rind, D., Grewe, V. and Price, C.: Chemistry-climate interactions in the
Goddard Institute for Space Studies general circulation model: 1. Tropospheric chemistry model description
and evaluation, J. Geophys. Res., 106(D8), 8047, doi:10.1029/2000JD900704, 2001.
Shindell, D. T., Faluvegi, G. and Bell, N.: Preindustrial-to-present-day radiative forcing by tropospheric ozone 20
from improved simulations with the GISS chemistry-climate GCM, Atmos. Chem. Phys. Discuss., 3(4), 3939–
3989, doi:10.5194/acpd-3-3939-2003, 2003.
Shrivastava, M. K., Lane, T. E., Donahue, N. M., Pandis, S. N. and Robinson, A. L.: Effects of gas particle
partitioning and aging of primary emissions on urban and regional organic aerosol concentrations, J. Geophys. 25
Res. Atmos., 113(18), doi:10.1029/2007JD009735, 2008.
Spracklen, D. V., Jimenez, J. L., Carslaw, K. S., Worsnop, D. R., Evans, M. J., Mann, G. W., Zhang, Q.,
Canagaratna, M. R., Allan, J., Coe, H., McFiggans, G., Rap, a. and Forster, P.: Aerosol mass spectrometer
constraint on the global secondary organic aerosol budget, Atmos. Chem. Phys., 11(23), 12109–12136, 30
doi:10.5194/acp-11-12109-2011, 2011.
Tröstl, J., Chuang, W., Gordon, H., Heinritzi, M., Yan, C., Molteni, U., Ahlm, L., Frege, C., Bianchi, F. and
Wagner, R.: The role of low-volatility organic compounds in initial particle growth in the atmosphere, Nature,
533(7604), 527–531, doi:10.1038/nature18271, 2016. 35
Tsigaridis, K., Daskalakis, N., Kanakidou, M., Adams, P. J., Artaxo, P., Bahadur, R., Balkanski, Y., Bauer, S.
E., Bellouin, N., Benedetti, A., Bergman, T., Berntsen, T. K., Beukes, J. P., Bian, H., Carslaw, K. S., Chin, M.,
Curci, G., Diehl, T., Easter, R. C., Ghan, S. J., Gong, S. L., Hodzic, A., Hoyle, C. R., Iversen, T., Jathar, S.,
Jimenez, J. L., Kaiser, J. W., Kirkevåg, A., Koch, D., Kokkola, H., H Lee, Y., Lin, G., Liu, X., Luo, G., Ma, 40
X., Mann, G. W., Mihalopoulos, N., Morcrette, J. J., Müller, J. F., Myhre, G., Myriokefalitakis, S., Ng, N. L.,
O’donnell, D., Penner, J. E., Pozzoli, L., Pringle, K. J., Russell, L. M., Schulz, M., Sciare, J., Seland, Shindell,
D. T., Sillman, S., Skeie, R. B., Spracklen, D., Stavrakou, T., Steenrod, S. D., Takemura, T., Tiitta, P., Tilmes,
S., Tost, H., Van Noije, T., Van Zyl, P. G., Von Salzen, K., Yu, F., Wang, Z., Wang, Z., Zaveri, R. A., Zhang,
H., Zhang, K., Zhang, Q. and Zhang, X.: The AeroCom evaluation and intercomparison of organic aerosol in 45
global models, Atmos. Chem. Phys., 14(19), 10845–10895, doi:10.5194/acp-14-10845-2014, 2014.
Tsimpidi, a. P., Karydis, V. a., Pozzer, a., Pandis, S. N. and Lelieveld, J.: ORACLE (v1.0): module to simulate
the organic aerosol composition and evolution in the atmosphere, Geosci. Model Dev., 7(6), 3153–3172,
doi:10.5194/gmd-7-3153-2014, 2014. 50
Geosci. Model Dev. Discuss., doi:10.5194/gmd-2016-171, 2016Manuscript under review for journal Geosci. Model Dev.Published: 14 September 2016c© Author(s) 2016. CC-BY 3.0 License.
Page 17
17
Tsimpidi, A. P., Karydis, V. A., Zavala, M., Lei, W., Molina, L., Ulbrich, I. M., Jimenez, J. L. and Pandis, S.
N.: Evaluation of the volatility basis-set approach for the simulation of organic aerosol formation in the
Mexico City metropolitan area, Atmos. Chem. Phys., 10(2), 525–546, doi:10.5194/acp-10-525-2010, 2010.
Tsimpidi, A. P., Karydis, V. A., Zavala, M., Lei, W., Bei, N., Molina, L. and Pandis, S. N.: Sources and 5
production of organic aerosol in Mexico City: Insights from the combination of a chemical transport model
(PMCAMx-2008) and measurements during MILAGRO, Atmos. Chem. Phys., 11(11), 5153–5168,
doi:10.5194/acp-11-5153-2011, 2011.
Volkamer, R., Jimenez, J. L., San Martini, F., Dzepina, K., Zhang, Q., Salcedo, D., Molina, L. T., Worsnop, D. 10
R. and Molina, M. J.: Secondary organic aerosol formation from anthropogenic air pollution: Rapid and higher
than expected, Geophys. Res. Lett., 33(17), doi:10.1029/2006GL026899, 2006.
Yu, F.: A secondary organic aerosol formation model considering successive oxidation aging and kinetic
condensation of organic compounds: Global scale implications, Atmos. Chem. Phys., 11(3), 1083–1099, 15
doi:10.5194/acp-11-1083-2011, 2011.
Zhang, Q., Jimenez, J. L., Canagaratna, M. R., Allan, J. D., Coe, H., Ulbrich, I., Alfarra, M. R., Takami, a.,
Middlebrook, a. M., Sun, Y. L., Dzepina, K., Dunlea, E., Docherty, K., DeCarlo, P. F., Salcedo, D., Onasch,
T., Jayne, J. T., Miyoshi, T., Shimono, a., Hatakeyama, S., Takegawa, N., Kondo, Y., Schneider, J., Drewnick, 20
F., Borrmann, S., Weimer, S., Demerjian, K., Williams, P., Bower, K., Bahreini, R., Cottrell, L., Griffin, R. J.,
Rautiainen, J., Sun, J. Y., Zhang, Y. M. and Worsnop, D. R.: Ubiquity and dominance of oxygenated species
in organic aerosols in anthropogenically-influenced Northern Hemisphere midlatitudes, Geophys. Res. Lett.,
34(13), 1–6, doi:10.1029/2007GL029979, 2007.
25
Zhang, Q. J., Beekmann, M., Drewnick, F., Freutel, F., Schneider, J., Crippa, M., Prevot, A. S. H.,
Baltensperger, U., Poulain, L., Wiedensohler, A., Sciare, J., Gros, V., Borbon, A., Colomb, A., Michoud, V.,
Doussin, J. F., Denier Van Der Gon, H. A. C., Haeffelin, M., Dupont, J. C., Siour, G., Petetin, H., Bessagnet,
B., Pandis, S. N., Hodzic, A., Sanchez, O., Honoré, C. and Perrussel, O.: Formation of organic aerosol in the
Paris region during the MEGAPOLI summer campaign: Evaluation of the volatility-basis-set approach within 30
the CHIMERE model, Atmos. Chem. Phys., 13(11), 5767–5790, doi:10.5194/acp-13-5767-2013, 2013.
Geosci. Model Dev. Discuss., doi:10.5194/gmd-2016-171, 2016Manuscript under review for journal Geosci. Model Dev.Published: 14 September 2016c© Author(s) 2016. CC-BY 3.0 License.
Page 18
18
Table 1. Naming convention and parameters used in the VBS implementation described here. 1
Parameter 9 Virtual VBS Species
C* μg m-3 at 298K 10-2 10-1 100 101 102 103 104 105 106
log(C*) -2 -1 0 1 2 3 4 5 6
Gas phase name1 VBSm2g VBSm1g VBSm0g VBSp1g VBSp2g VBSp3g VBSp4g VBSp5g VBSp6g
Aerosol tracer name in each
MATRIX population OCM2 OCM1 OCM0 OCP1 OCP2 OCP3 OCP4 OCP5 OCP6
Mass-based emission factors
applied to POA emissions
(Shrivastava et al., 2008)
0.03 0.06 0.09 0.14 0.18 0.30 0.40 0.50 0.80
2 1: in VBSxnp, x is m for minus and p for plus, n is the absolute value of log(C*), and p is g for the gas phase and a for the sum across all 3
populations of the aerosol-phase concentration. 4
Geosci. Model Dev. Discuss., doi:10.5194/gmd-2016-171, 2016Manuscript under review for journal Geosci. Model Dev.Published: 14 September 2016c© Author(s) 2016. CC-BY 3.0 License.
Page 19
19
Table 2. Aerosol population chemical composition in MATRIX.
Population
abbreviation
Description
Composition
(constituents other than
NH+4, NO-
3, and H2O)
AKK sulfate (Aitken mode) SO42-
ACC sulfate (accumulation mode) SO42-
OCC organic carbon OC, SO42-
BC1 fresh black carbon (<5% coating) BC, SO42-
BC2 aged (by condensation) black carbon
(>5% coating) BC, SO4
2-
BCS aged (by coagulation) black carbon BC, SO42-
BOC black and organic carbon BC, OC, SO42-
OCS organic carbon and sulfate OC, SO42-
SSA sea salt (accumulation mode) sea salt, SO42-
SSC sea salt (coarse mode) sea salt, SO42-
DD1 dust (accumulation mode; <5%
coating) mineral dust, SO4
2-
DD2 dust (coarse mode; <5% coating) mineral dust, SO42-
DS1 dust (accumulation mode; >5%
coating ) mineral dust, SO4
2-
DS2 dust (coarse mode; >5% coating) mineral dust, SO42-
MXX mixed (all components) BC,OC, mineral dust, sea
salt, SO42-
Geosci. Model Dev. Discuss., doi:10.5194/gmd-2016-171, 2016Manuscript under review for journal Geosci. Model Dev.Published: 14 September 2016c© Author(s) 2016. CC-BY 3.0 License.
Page 20
20
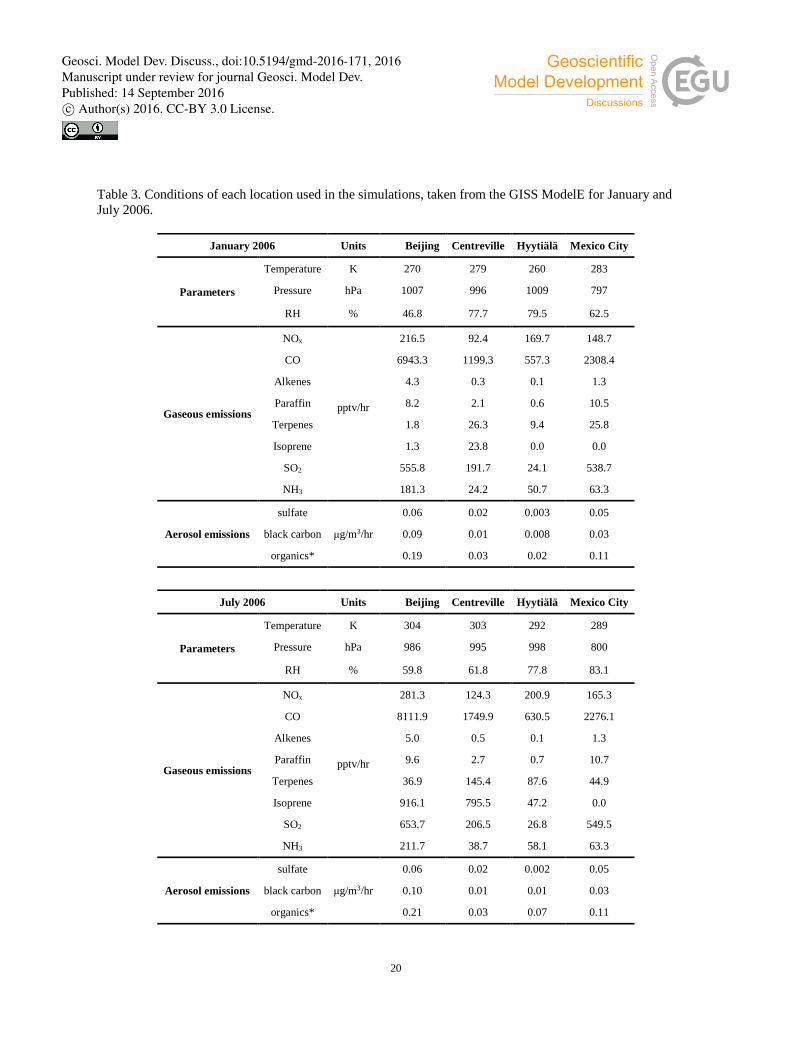
Table 3. Conditions of each location used in the simulations, taken from the GISS ModelE for January and
July 2006.
January 2006 Units Beijing Centreville Hyytiälä Mexico City
Parameters
Temperature K 270 279 260 283
Pressure hPa 1007 996 1009 797
RH % 46.8 77.7 79.5 62.5
Gaseous emissions
NOx
pptv/hr
216.5 92.4 169.7 148.7
CO 6943.3 1199.3 557.3 2308.4
Alkenes 4.3 0.3 0.1 1.3
Paraffin 8.2 2.1 0.6 10.5
Terpenes 1.8 26.3 9.4 25.8
Isoprene 1.3 23.8 0.0 0.0
SO2 555.8 191.7 24.1 538.7
NH3 181.3 24.2 50.7 63.3
Aerosol emissions
sulfate
μg/m3/hr
0.06 0.02 0.003 0.05
black carbon 0.09 0.01 0.008 0.03
organics* 0.19 0.03 0.02 0.11
July 2006 Units Beijing Centreville Hyytiälä Mexico City
Parameters
Temperature K 304 303 292 289
Pressure hPa 986 995 998 800
RH % 59.8 61.8 77.8 83.1
Gaseous emissions
NOx
pptv/hr
281.3 124.3 200.9 165.3
CO 8111.9 1749.9 630.5 2276.1
Alkenes 5.0 0.5 0.1 1.3
Paraffin 9.6 2.7 0.7 10.7
Terpenes 36.9 145.4 87.6 44.9
Isoprene 916.1 795.5 47.2 0.0
SO2 653.7 206.5 26.8 549.5
NH3 211.7 38.7 58.1 63.3
Aerosol emissions
sulfate
μg/m3/hr
0.06 0.02 0.002 0.05
black carbon 0.10 0.01 0.01 0.03
organics* 0.21 0.03 0.07 0.11
Geosci. Model Dev. Discuss., doi:10.5194/gmd-2016-171, 2016Manuscript under review for journal Geosci. Model Dev.Published: 14 September 2016c© Author(s) 2016. CC-BY 3.0 License.
Page 21
21
Figure 1. Schematic showing coagulation pathways among organic-containing aerosol populations as colored
circles, with 9 organic VBS species condensed as grey outer circles. In yellow are the emitted donor aerosol
populations, and green are the mixed recipient populations. OCC has a semi-transparent yellow core because it 5
is actually emitted as the VBS species that can serve as condensation medium for gaseous VBS species,
represented by the grey outer circles. In orange is population BC2, which contains >5% coating of sulfate and
organics, which is formed rapidly from the growth of population BC1, which has <5% sulfate/organics coating.
Geosci. Model Dev. Discuss., doi:10.5194/gmd-2016-171, 2016Manuscript under review for journal Geosci. Model Dev.Published: 14 September 2016c© Author(s) 2016. CC-BY 3.0 License.
Page 22
22
Figure 2. Temporal evolution of the mass concentration of semi-volatile organics in the gas phase (left
column), aerosol phase (across all populations; middle column) and total (right column) using the new scheme
for January. The total of non-volatile organics from the original scheme is shown in black dash-dotted lines in
the right column. 5
Geosci. Model Dev. Discuss., doi:10.5194/gmd-2016-171, 2016Manuscript under review for journal Geosci. Model Dev.Published: 14 September 2016c© Author(s) 2016. CC-BY 3.0 License.
Page 23
23
Figure 3. Same as Figure 2, for July.
Geosci. Model Dev. Discuss., doi:10.5194/gmd-2016-171, 2016Manuscript under review for journal Geosci. Model Dev.Published: 14 September 2016c© Author(s) 2016. CC-BY 3.0 License.
Page 24
24
Figure 4. Temporal evolution of organic aerosol mass concentration in each organics-containing population
from the new scheme (left two columns, first column for January, second column for July), and the old
scheme (right two columns, third column for January, fourth column for July).
5
Geosci. Model Dev. Discuss., doi:10.5194/gmd-2016-171, 2016Manuscript under review for journal Geosci. Model Dev.Published: 14 September 2016c© Author(s) 2016. CC-BY 3.0 License.
Page 25
25
Figure 5. Temporal evolution of organic aerosol mass concentration fraction in each organics-containing
population from the new scheme (left two columns, first column for January, second column for July), and the
old scheme (right two columns, third column for January, fourth column for July). 5
Geosci. Model Dev. Discuss., doi:10.5194/gmd-2016-171, 2016Manuscript under review for journal Geosci. Model Dev.Published: 14 September 2016c© Author(s) 2016. CC-BY 3.0 License.
Page 26
26
Figure 6. Organics-containing aerosol populations (except MXX) and AKK (Aitken mode sulfate) size
distributions for Mexico City in January. Top row: number concentration, middle row: surface area, bottom
row: volume. Total of all populations in dotted black lines.
Geosci. Model Dev. Discuss., doi:10.5194/gmd-2016-171, 2016Manuscript under review for journal Geosci. Model Dev.Published: 14 September 2016c© Author(s) 2016. CC-BY 3.0 License.
Page 27
27
Figure 7. Same as Figure 6 for Centreville.
5
Geosci. Model Dev. Discuss., doi:10.5194/gmd-2016-171, 2016Manuscript under review for journal Geosci. Model Dev.Published: 14 September 2016c© Author(s) 2016. CC-BY 3.0 License.