61
Matt Hallead Continuous Improvement Coordinator (Change Agent) STANADYNE AREA LEAN KAIZEN
| Date post: | 19-Jan-2017 |
| Category: |
Documents |
| Upload: | matt-hallead-mba |
| View: | 110 times |
| Download: | 0 times |
Matt Hallead
Continuous
Improvement
Coordinator
(Change Agent)
STANADYNE AREA
LEAN KAIZEN
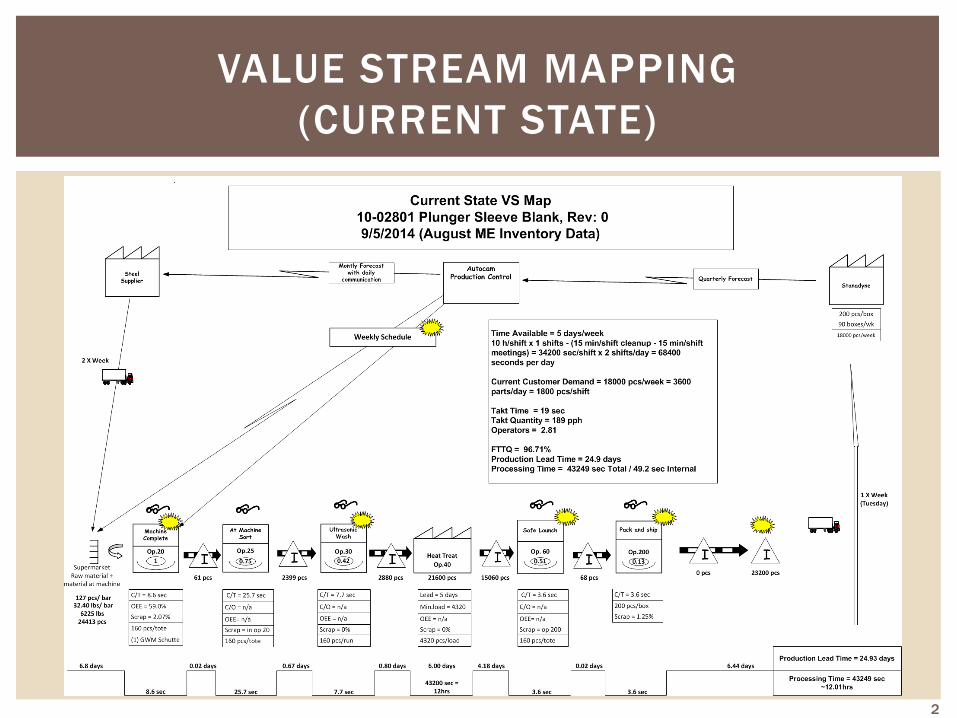
VALUE STREAM MAPPING
(CURRENT STATE)
2
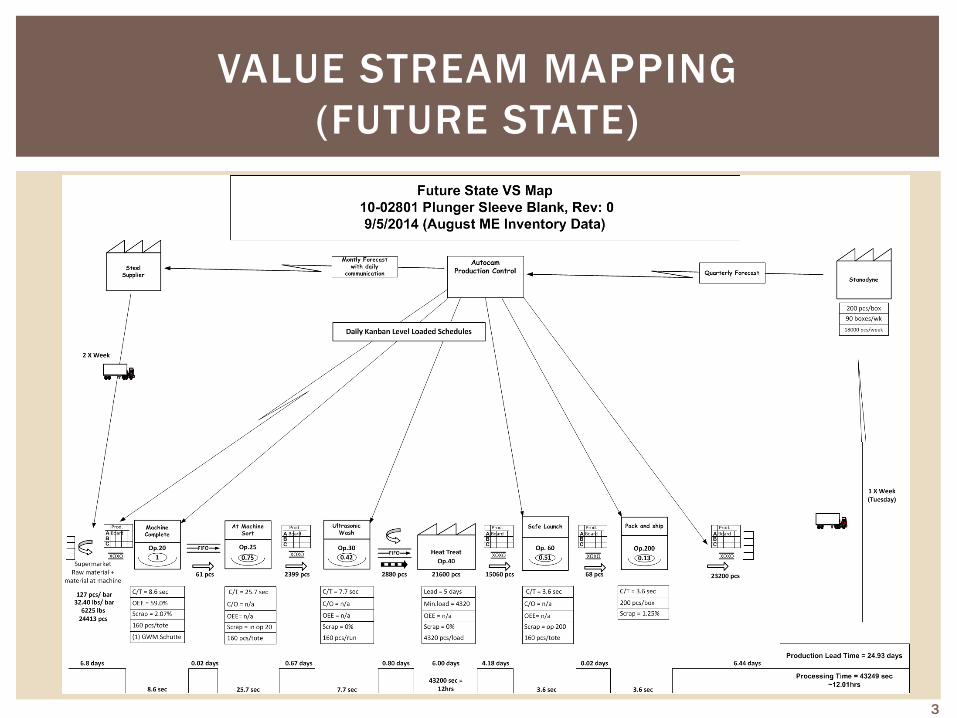
VALUE STREAM MAPPING
(FUTURE STATE)
3
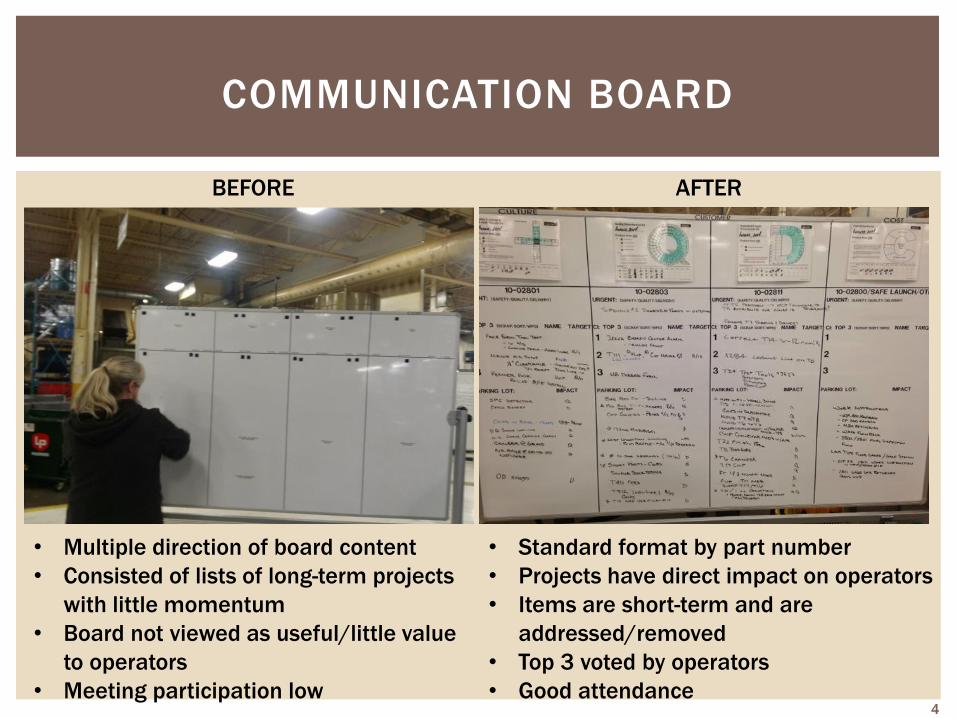
COMMUNICATION BOARD
BEFORE AFTER
• Multiple direction of board content
• Consisted of lists of long-term projects
with little momentum
• Board not viewed as useful/little value
to operators
• Meeting participation low
• Standard format by part number
• Projects have direct impact on operators
• Items are short-term and are
addressed/removed
• Top 3 voted by operators
• Good attendance 4
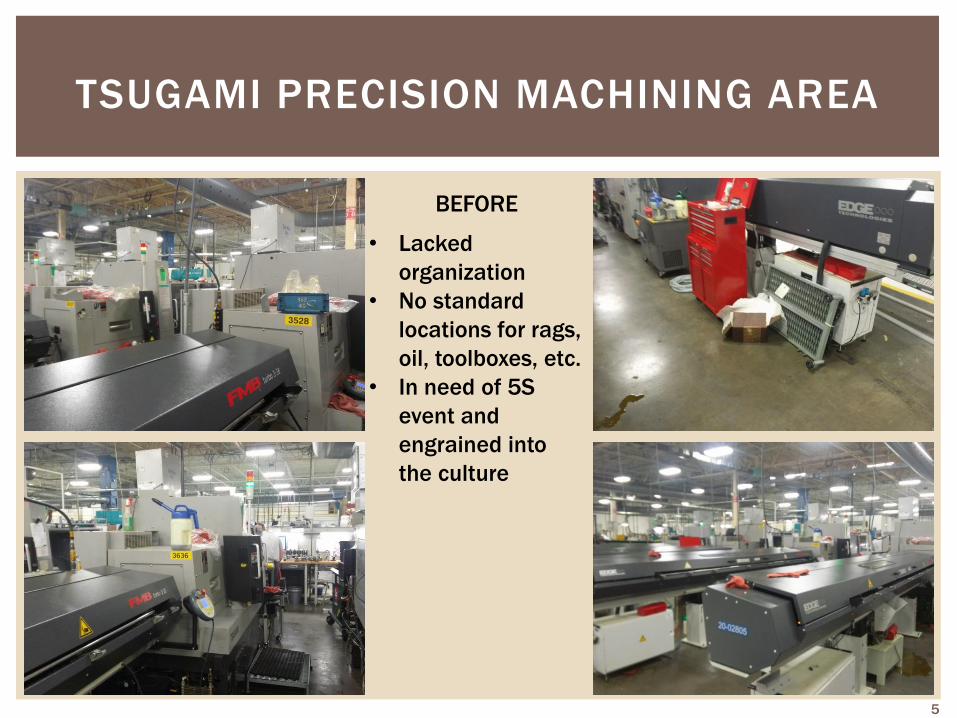
TSUGAMI PRECISION MACHINING AREA
• Lacked
organization
• No standard
locations for rags,
oil, toolboxes, etc.
• In need of 5S
event and
engrained into
the culture
BEFORE
5
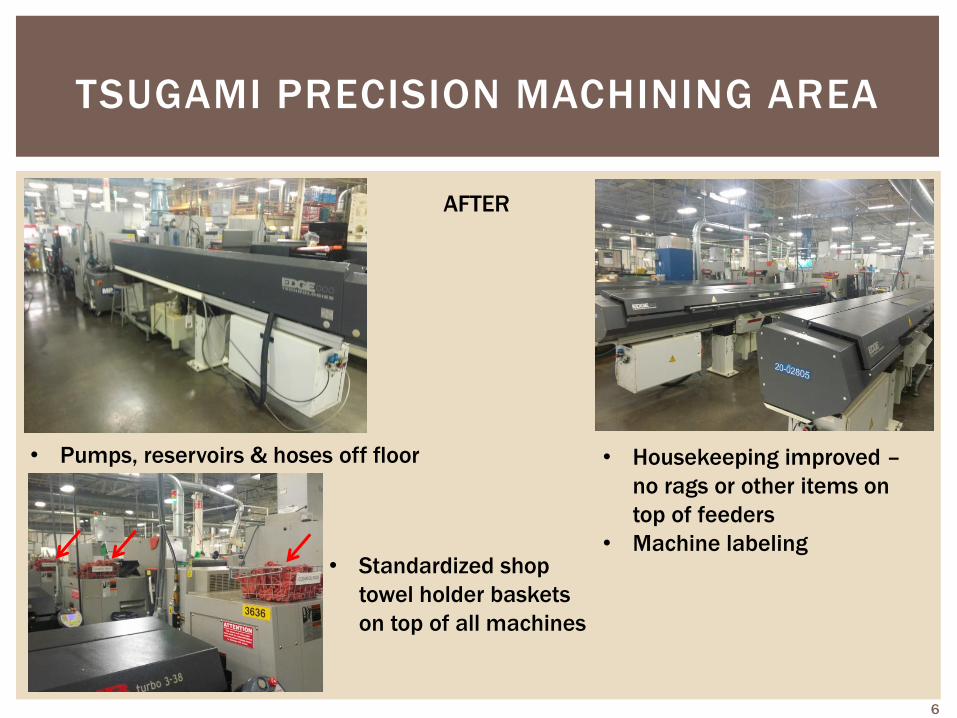
TSUGAMI PRECISION MACHINING AREA
AFTER
• Pumps, reservoirs & hoses off floor • Housekeeping improved –
no rags or other items on
top of feeders
• Machine labeling • Standardized shop
towel holder baskets
on top of all machines
6
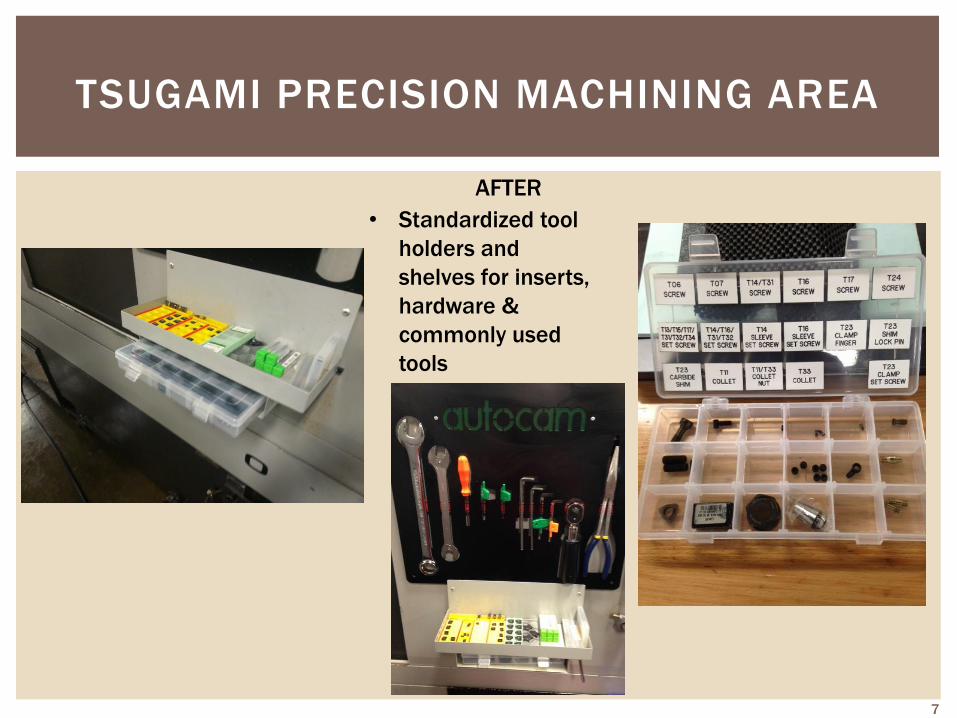
TSUGAMI PRECISION MACHINING AREA
AFTER
• Standardized tool
holders and
shelves for inserts,
hardware &
commonly used
tools
7
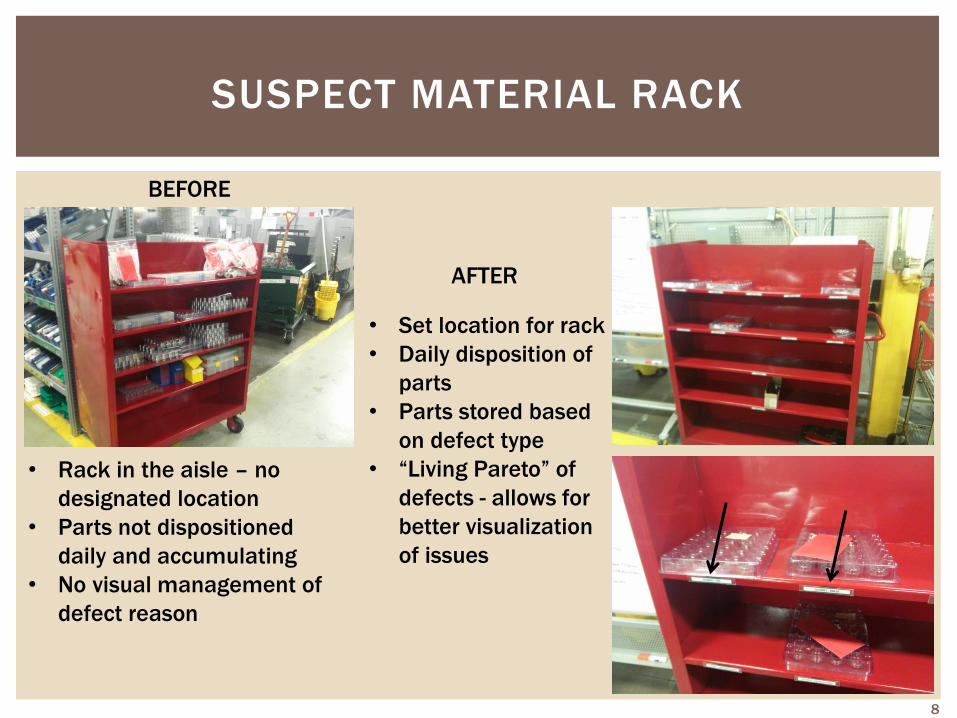
SUSPECT MATERIAL RACK
• Rack in the aisle – no
designated location
• Parts not dispositioned
daily and accumulating
• No visual management of
defect reason
• Set location for rack
• Daily disposition of
parts
• Parts stored based
on defect type
• “Living Pareto” of
defects - allows for
better visualization
of issues
BEFORE
AFTER
8
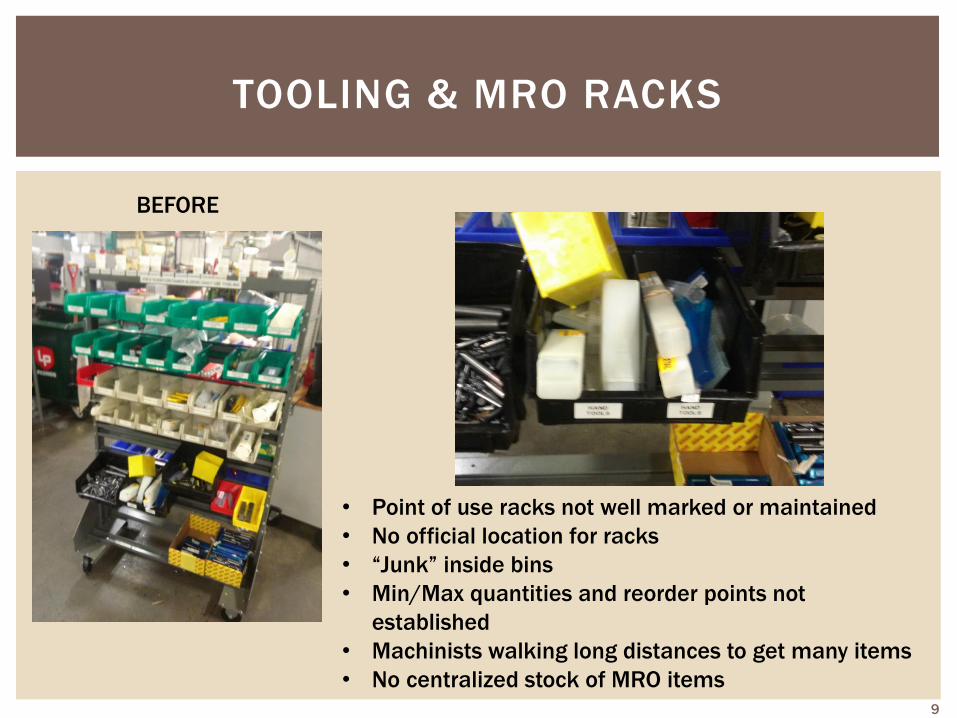
TOOLING & MRO RACKS
• Point of use racks not well marked or maintained
• No official location for racks
• “Junk” inside bins
• Min/Max quantities and reorder points not
established
• Machinists walking long distances to get many items
• No centralized stock of MRO items
BEFORE
9
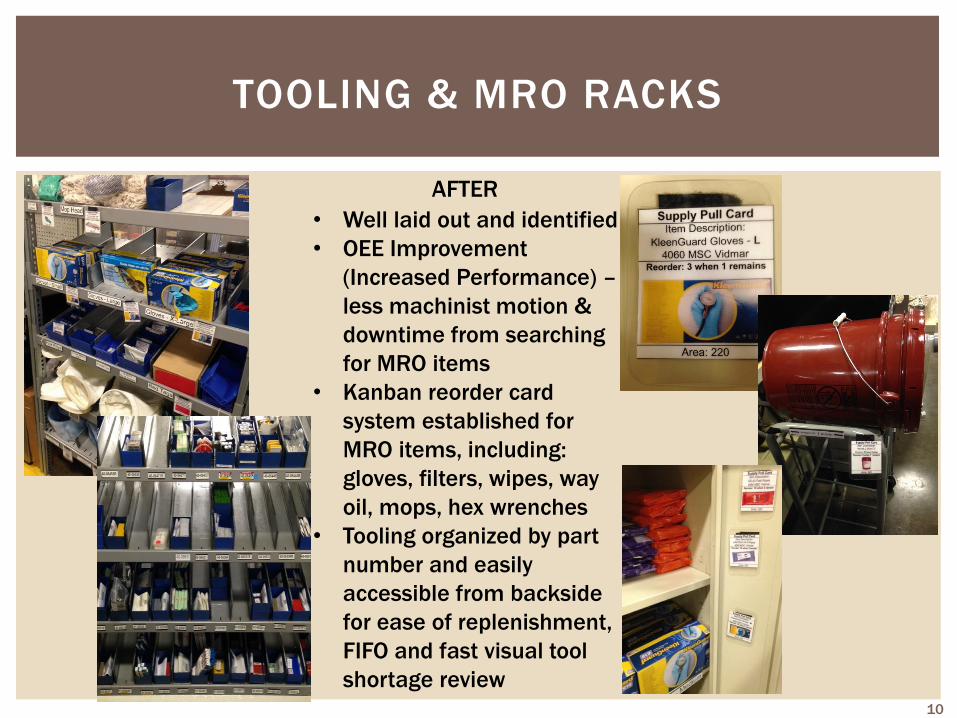
TOOLING & MRO RACKS
• Well laid out and identified
• OEE Improvement
(Increased Performance) –
less machinist motion &
downtime from searching
for MRO items
• Kanban reorder card
system established for
MRO items, including:
gloves, filters, wipes, way
oil, mops, hex wrenches
• Tooling organized by part
number and easily
accessible from backside
for ease of replenishment,
FIFO and fast visual tool
shortage review
AFTER
10
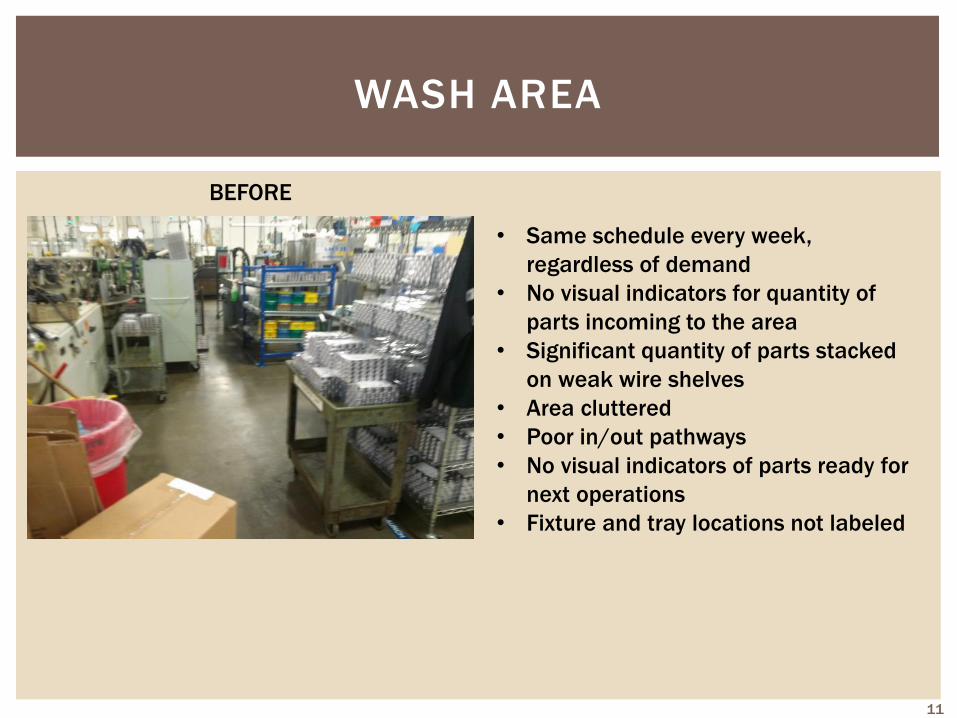
WASH AREA
• Same schedule every week,
regardless of demand
• No visual indicators for quantity of
parts incoming to the area
• Significant quantity of parts stacked
on weak wire shelves
• Area cluttered
• Poor in/out pathways
• No visual indicators of parts ready for
next operations
• Fixture and tray locations not labeled
BEFORE
11
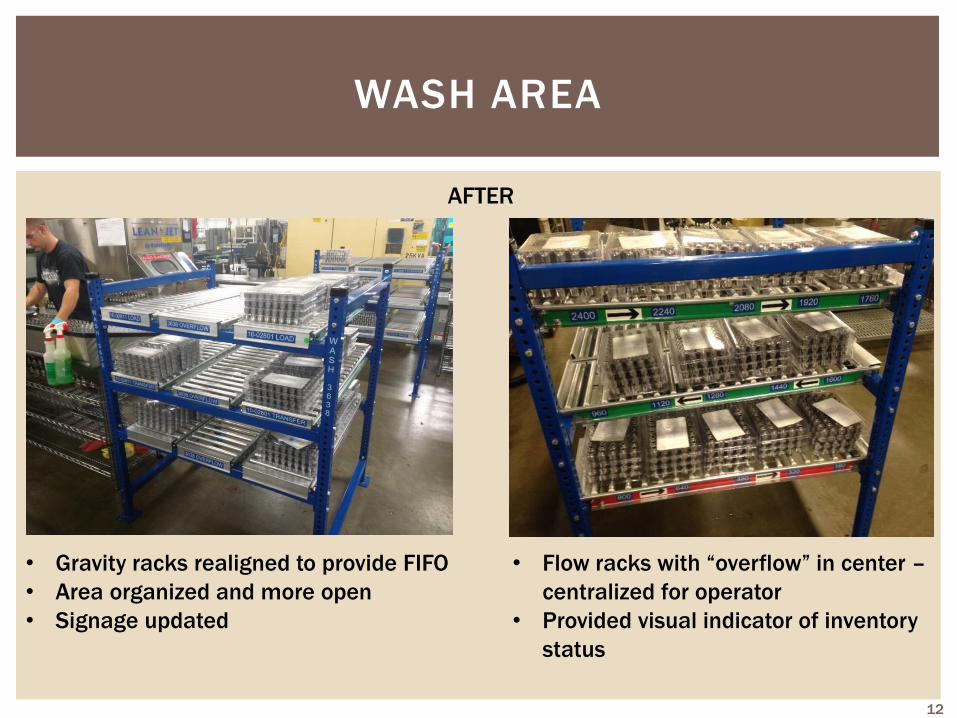
WASH AREA
• Gravity racks realigned to provide FIFO
• Area organized and more open
• Signage updated
• Flow racks with “overflow” in center –
centralized for operator
• Provided visual indicator of inventory
status
AFTER
12
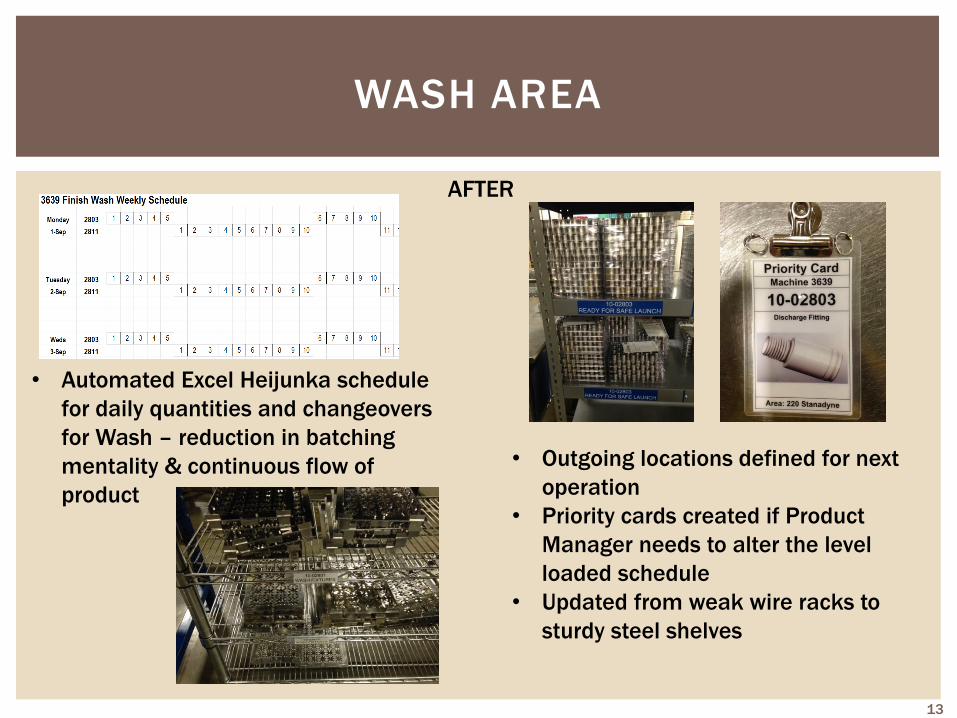
WASH AREA
• Automated Excel Heijunka schedule
for daily quantities and changeovers
for Wash – reduction in batching
mentality & continuous flow of
product
• Outgoing locations defined for next
operation
• Priority cards created if Product
Manager needs to alter the level
loaded schedule
• Updated from weak wire racks to
sturdy steel shelves
AFTER
13
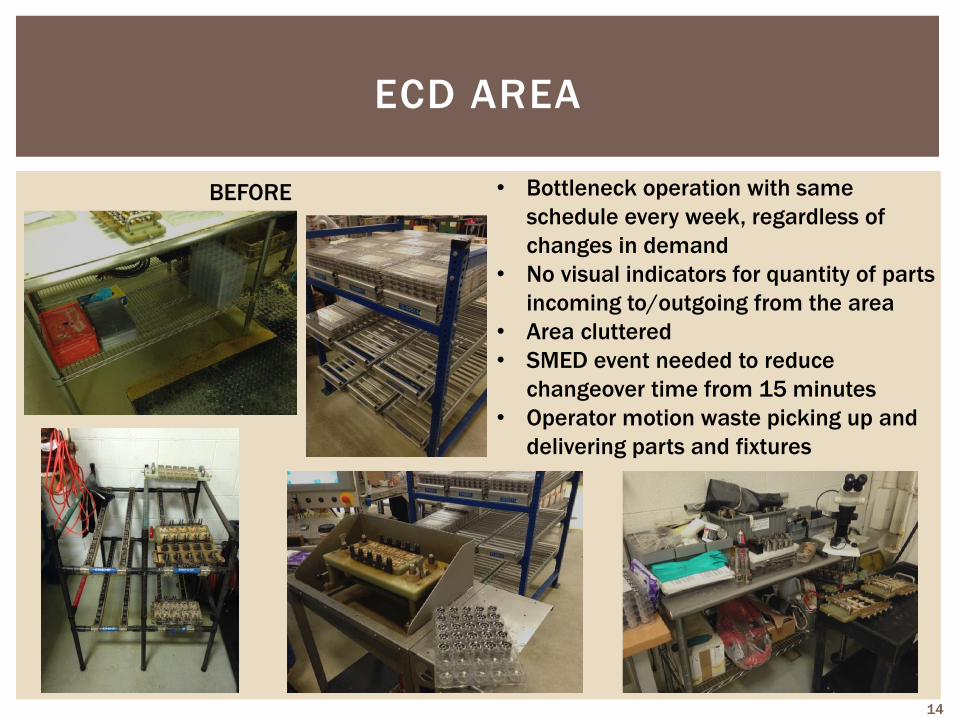
ECD AREA
• Bottleneck operation with same
schedule every week, regardless of
changes in demand
• No visual indicators for quantity of parts
incoming to/outgoing from the area
• Area cluttered
• SMED event needed to reduce
changeover time from 15 minutes
• Operator motion waste picking up and
delivering parts and fixtures
BEFORE
14
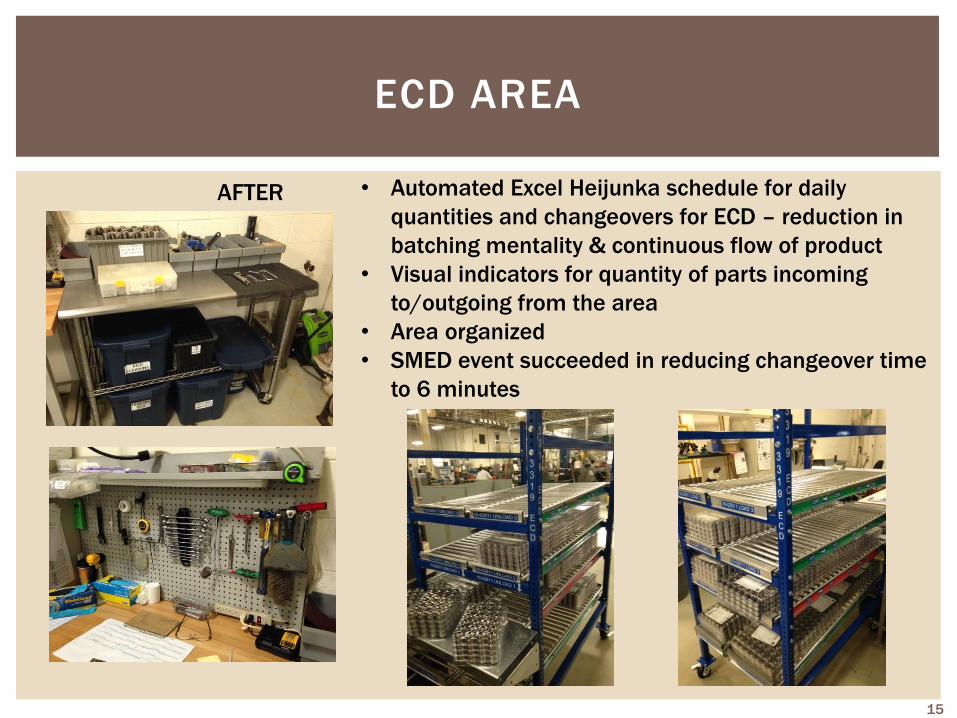
ECD AREA
AFTER • Automated Excel Heijunka schedule for daily
quantities and changeovers for ECD – reduction in
batching mentality & continuous flow of product
• Visual indicators for quantity of parts incoming
to/outgoing from the area
• Area organized
• SMED event succeeded in reducing changeover time
to 6 minutes
15
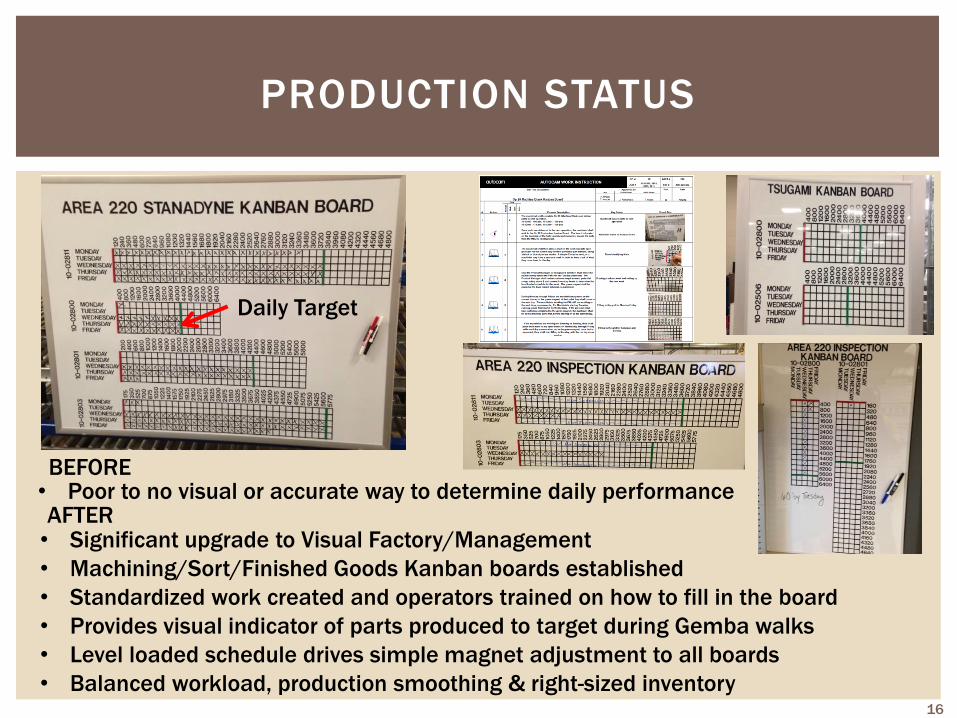
PRODUCTION STATUS
Daily Target
BEFORE
AFTER • Poor to no visual or accurate way to determine daily performance
• Significant upgrade to Visual Factory/Management
• Machining/Sort/Finished Goods Kanban boards established
• Standardized work created and operators trained on how to fill in the board
• Provides visual indicator of parts produced to target during Gemba walks
• Level loaded schedule drives simple magnet adjustment to all boards
• Balanced workload, production smoothing & right-sized inventory 16
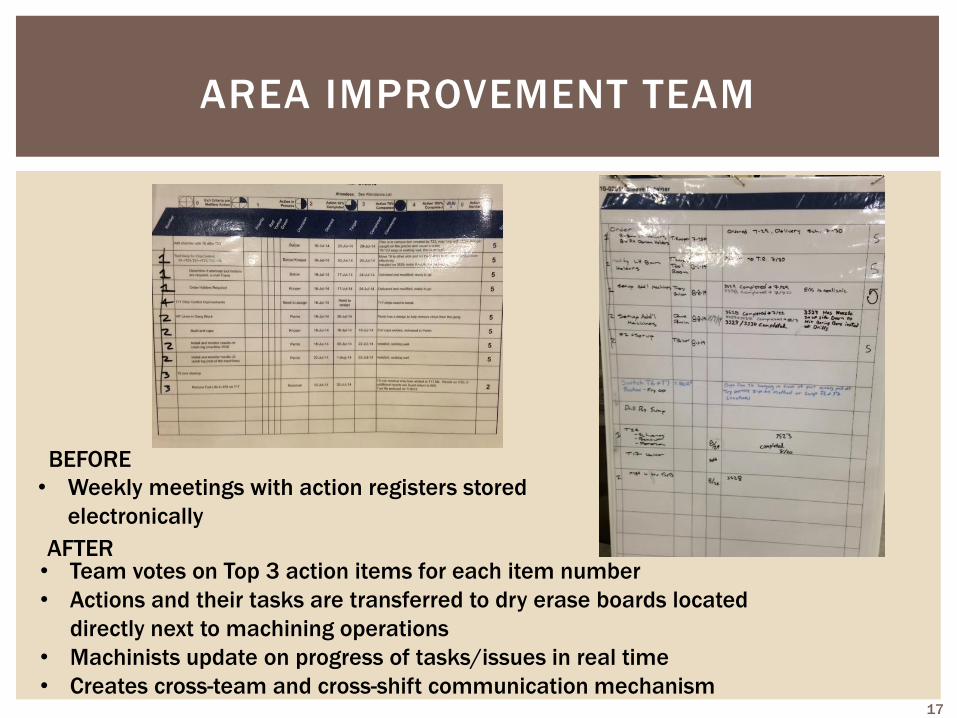
• Weekly meetings with action registers stored
electronically
AREA IMPROVEMENT TEAM
• Team votes on Top 3 action items for each item number
• Actions and their tasks are transferred to dry erase boards located
directly next to machining operations
• Machinists update on progress of tasks/issues in real time
• Creates cross-team and cross-shift communication mechanism
BEFORE
AFTER
17
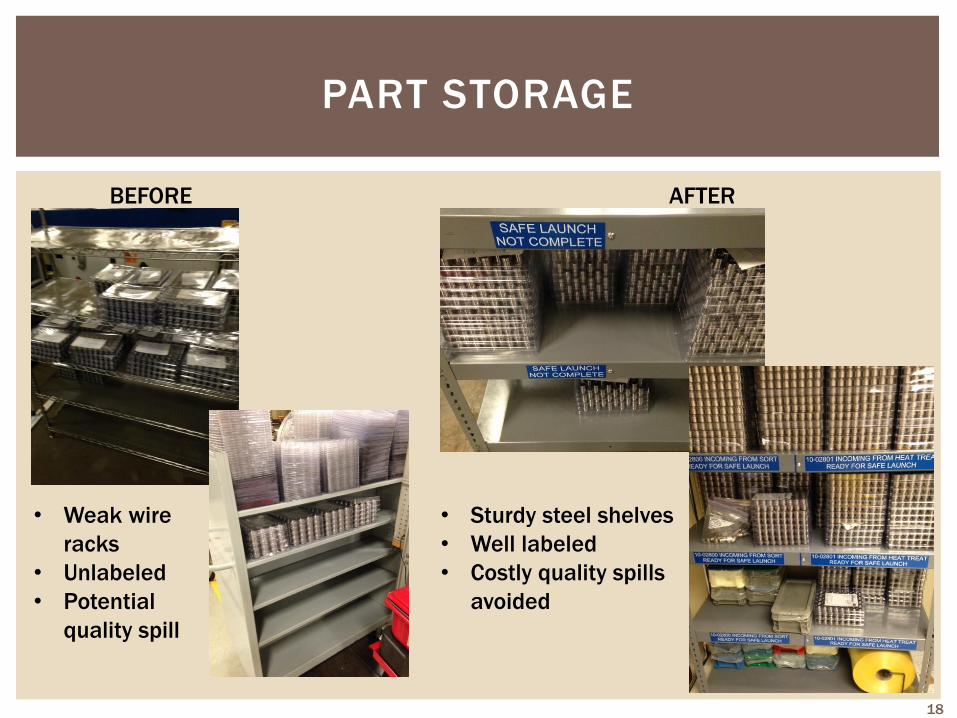
PART STORAGE
• Sturdy steel shelves
• Well labeled
• Costly quality spills
avoided
BEFORE AFTER
• Weak wire
racks
• Unlabeled
• Potential
quality spill
18
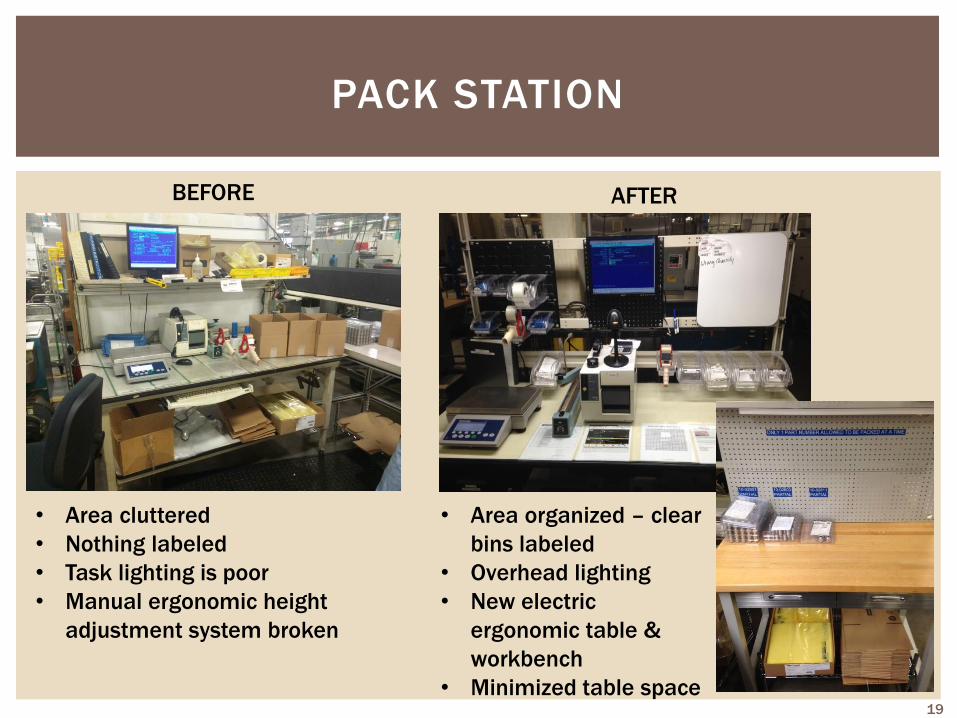
PACK STATION
• Area cluttered
• Nothing labeled
• Task lighting is poor
• Manual ergonomic height
adjustment system broken
• Area organized – clear
bins labeled
• Overhead lighting
• New electric
ergonomic table &
workbench
• Minimized table space
AFTER BEFORE
19
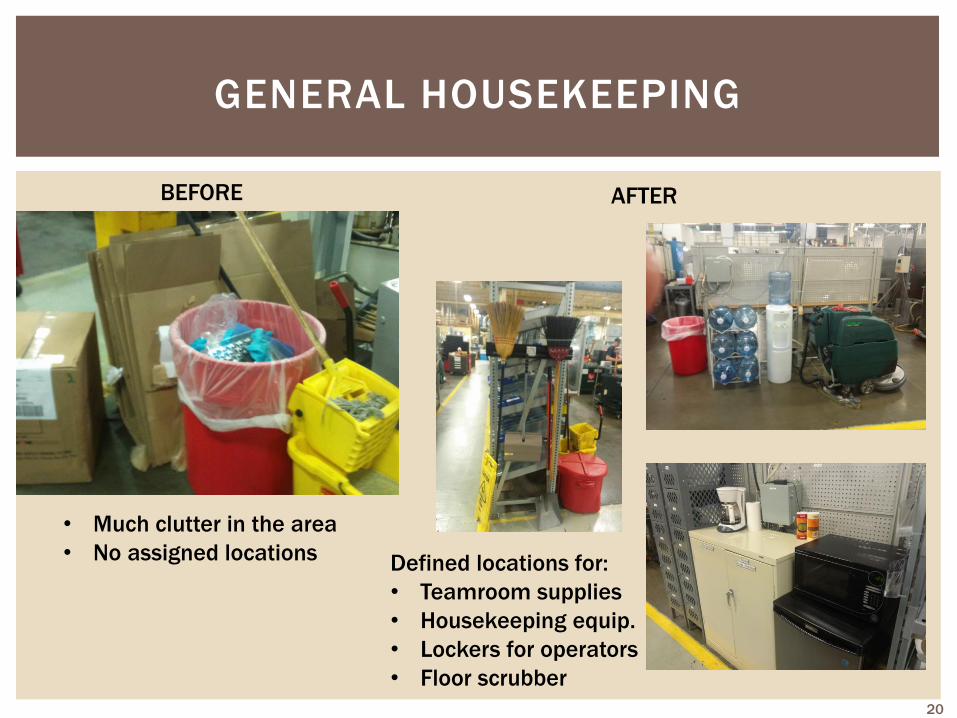
GENERAL HOUSEKEEPING
• Much clutter in the area
• No assigned locations Defined locations for:
• Teamroom supplies
• Housekeeping equip.
• Lockers for operators
• Floor scrubber
AFTER BEFORE
20
Matt Hallead • Senior Cost
Accountant
• Continuous Improvement Specia l ist
• Operat ions Superv isor
• Continuous Improvement Manager
WOODWARD
CONTRIBUTIONS
GREENVILLE, SC: SWOZZLE KAIZEN
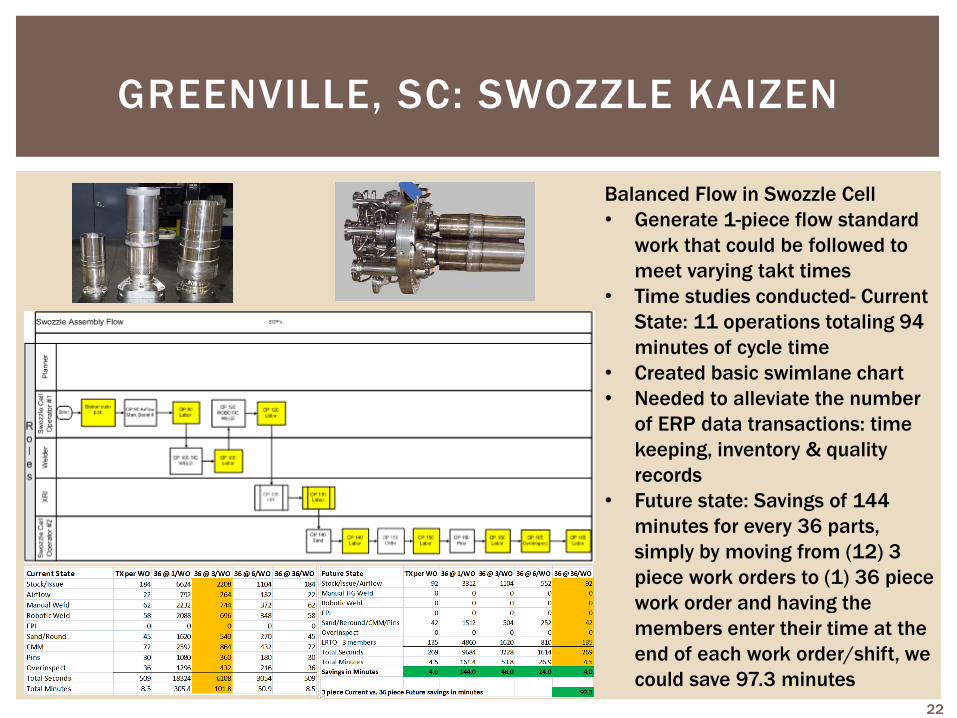
Balanced Flow in Swozzle Cell
• Generate 1-piece flow standard
work that could be followed to
meet varying takt times
• Time studies conducted- Current
State: 11 operations totaling 94
minutes of cycle time
• Created basic swimlane chart
• Needed to alleviate the number
of ERP data transactions: time
keeping, inventory & quality
records
• Future state: Savings of 144
minutes for every 36 parts,
simply by moving from (12) 3
piece work orders to (1) 36 piece
work order and having the
members enter their time at the
end of each work order/shift, we
could save 97.3 minutes
22
GREENVILLE, SC: SWOZZLE KAIZEN
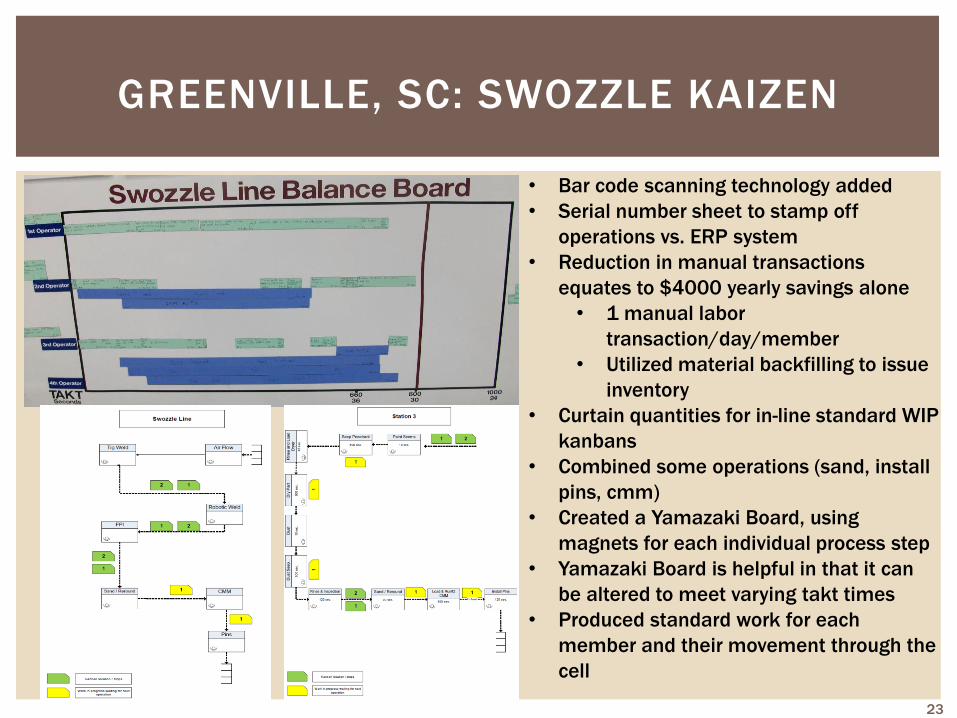
• Bar code scanning technology added
• Serial number sheet to stamp off
operations vs. ERP system
• Reduction in manual transactions
equates to $4000 yearly savings alone
• 1 manual labor
transaction/day/member
• Utilized material backfilling to issue
inventory
• Curtain quantities for in-line standard WIP
kanbans
• Combined some operations (sand, install
pins, cmm)
• Created a Yamazaki Board, using
magnets for each individual process step
• Yamazaki Board is helpful in that it can
be altered to meet varying takt times
• Produced standard work for each
member and their movement through the
cell
23
GREENVILLE, SC: SWOZZLE KAIZEN
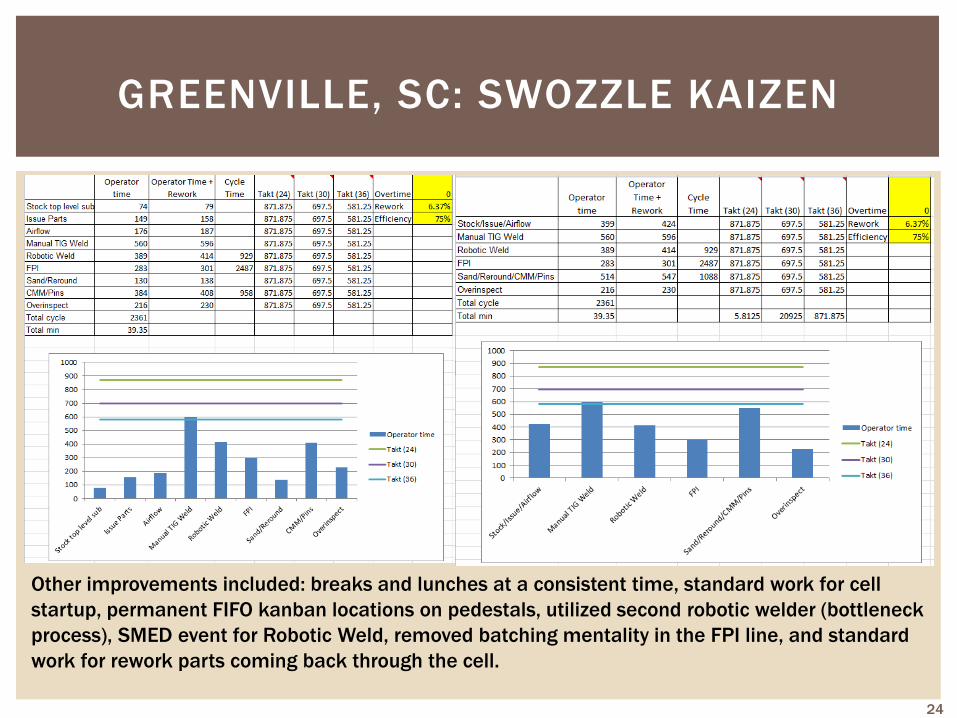
Other improvements included: breaks and lunches at a consistent time, standard work for cell
startup, permanent FIFO kanban locations on pedestals, utilized second robotic welder (bottleneck
process), SMED event for Robotic Weld, removed batching mentality in the FPI line, and standard
work for rework parts coming back through the cell.
24
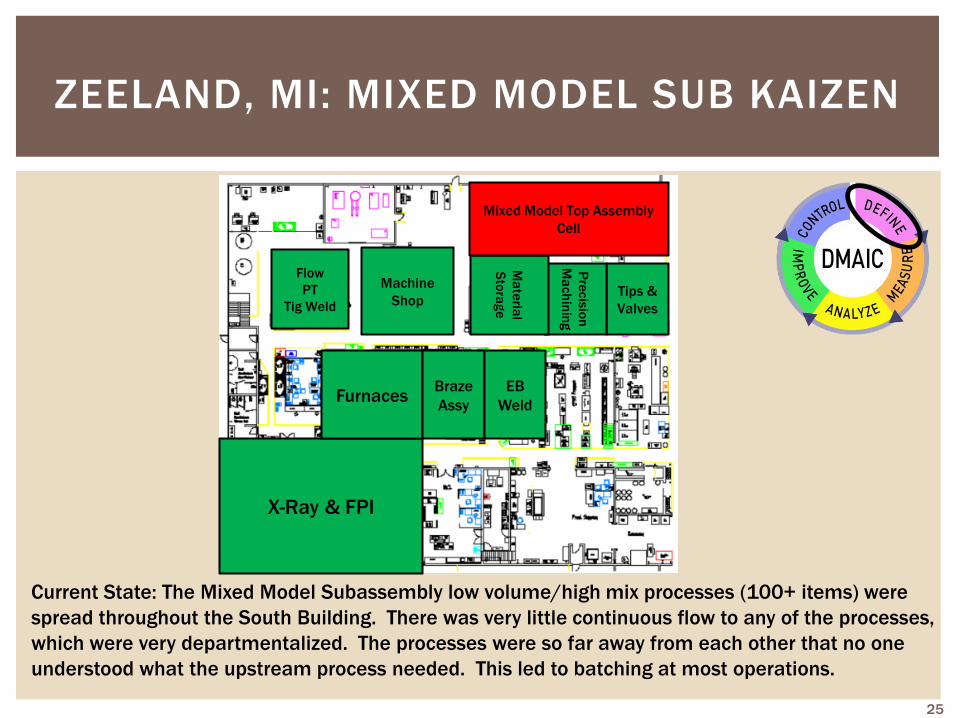
ZEELAND, MI: MIXED MODEL SUB KAIZEN
Current State: The Mixed Model Subassembly low volume/high mix processes (100+ items) were
spread throughout the South Building. There was very little continuous flow to any of the processes,
which were very departmentalized. The processes were so far away from each other that no one
understood what the upstream process needed. This led to batching at most operations.
X-Ray & FPI
Furnaces Braze
Assy
EB
Weld
Tips &
Valves
Pre
cis
ion
Ma
ch
inin
g
Ma
teria
l
Sto
rag
e
Machine
Shop
Flow
PT
Tig Weld
Mixed Model Top Assembly
Cell
25
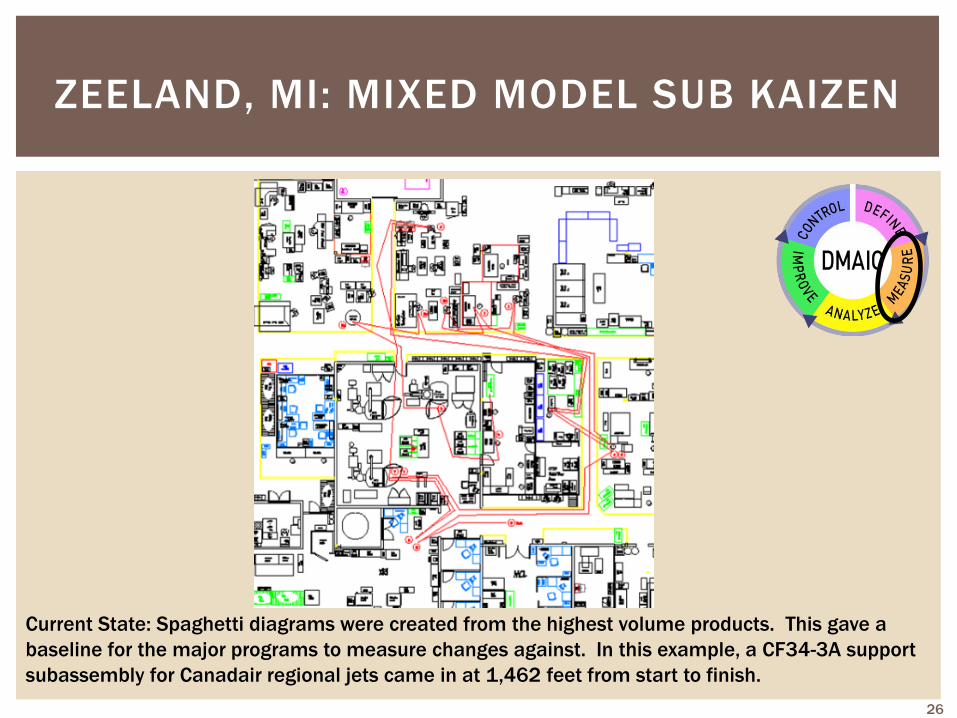
ZEELAND, MI: MIXED MODEL SUB KAIZEN
Current State: Spaghetti diagrams were created from the highest volume products. This gave a
baseline for the major programs to measure changes against. In this example, a CF34-3A support
subassembly for Canadair regional jets came in at 1,462 feet from start to finish.
26
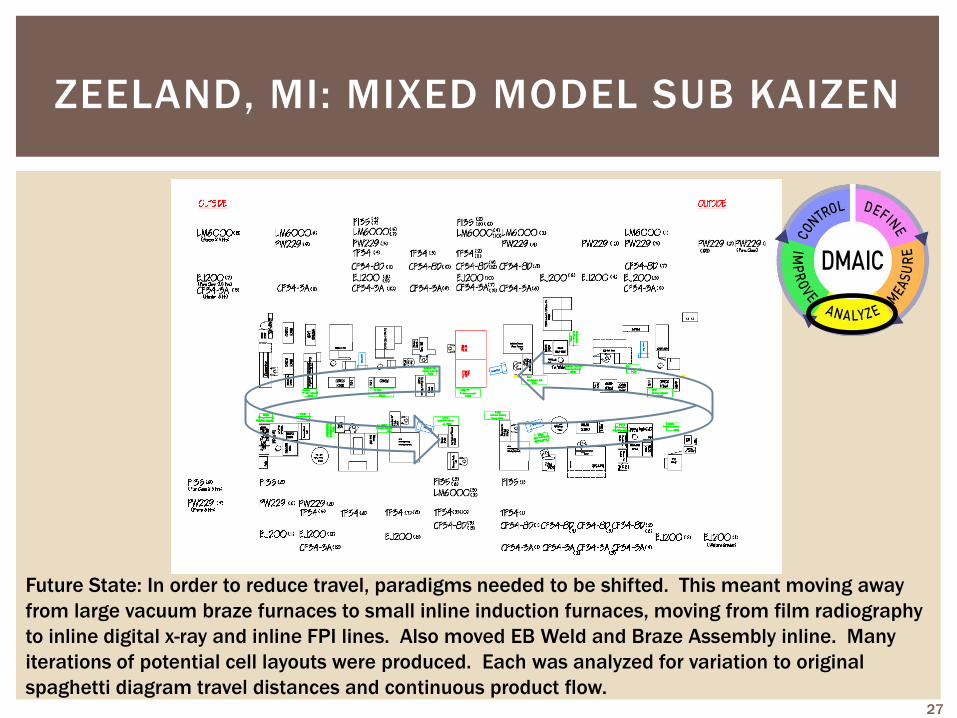
ZEELAND, MI: MIXED MODEL SUB KAIZEN
Future State: In order to reduce travel, paradigms needed to be shifted. This meant moving away
from large vacuum braze furnaces to small inline induction furnaces, moving from film radiography
to inline digital x-ray and inline FPI lines. Also moved EB Weld and Braze Assembly inline. Many
iterations of potential cell layouts were produced. Each was analyzed for variation to original
spaghetti diagram travel distances and continuous product flow. 27
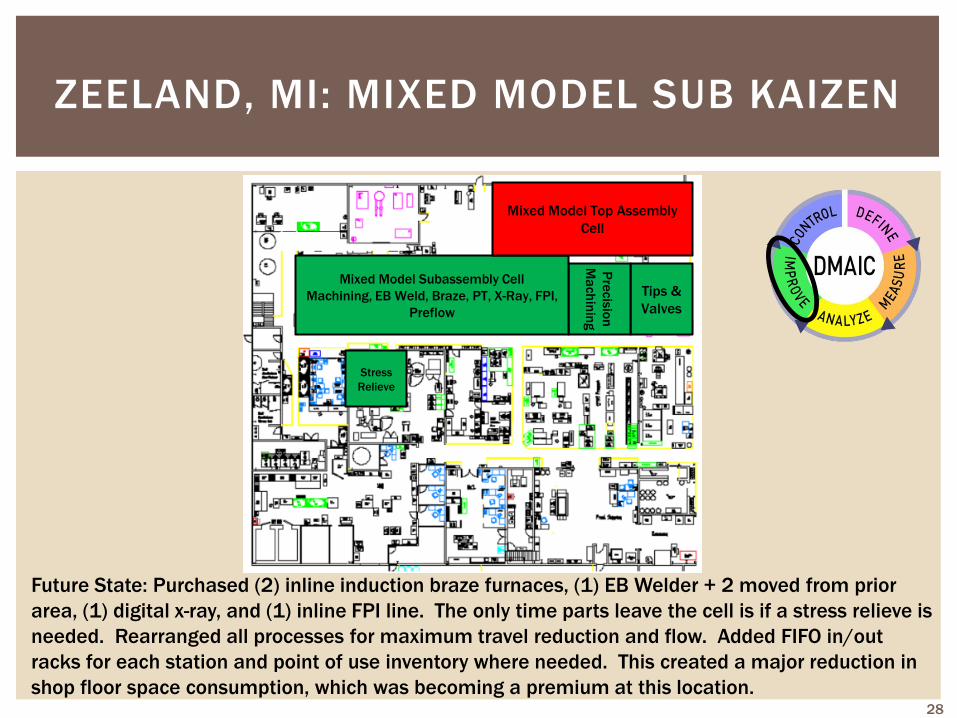
ZEELAND, MI: MIXED MODEL SUB KAIZEN
Future State: Purchased (2) inline induction braze furnaces, (1) EB Welder + 2 moved from prior
area, (1) digital x-ray, and (1) inline FPI line. The only time parts leave the cell is if a stress relieve is
needed. Rearranged all processes for maximum travel reduction and flow. Added FIFO in/out
racks for each station and point of use inventory where needed. This created a major reduction in
shop floor space consumption, which was becoming a premium at this location.
Tips &
Valves
Pre
cis
ion
Ma
ch
inin
g
Mixed Model Subassembly Cell
Machining, EB Weld, Braze, PT, X-Ray, FPI,
Preflow
Mixed Model Top Assembly
Cell
Stress
Relieve
28
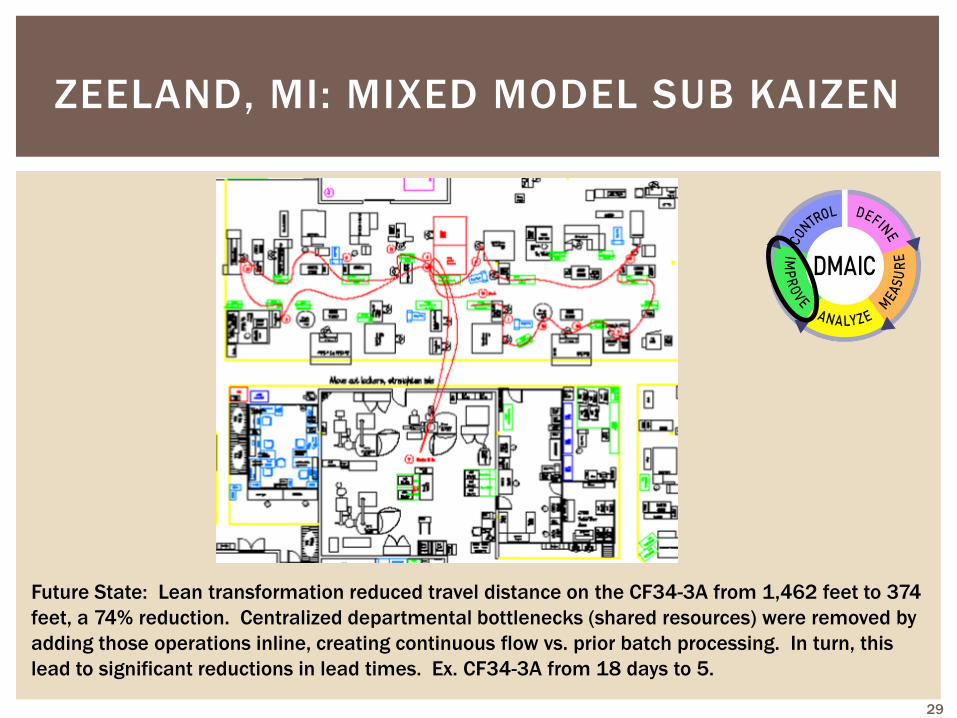
ZEELAND, MI: MIXED MODEL SUB KAIZEN
Future State: Lean transformation reduced travel distance on the CF34-3A from 1,462 feet to 374
feet, a 74% reduction. Centralized departmental bottlenecks (shared resources) were removed by
adding those operations inline, creating continuous flow vs. prior batch processing. In turn, this
lead to significant reductions in lead times. Ex. CF34-3A from 18 days to 5.
29
LEADING PERFORMANCE TEAMS
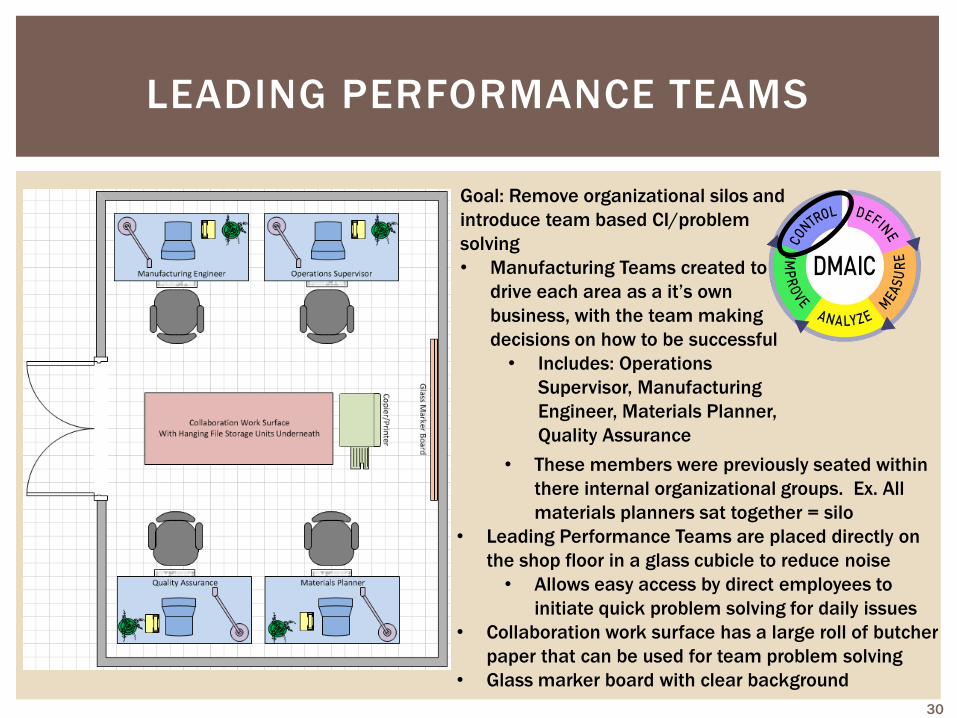
Goal: Remove organizational silos and
introduce team based CI/problem
solving
• Manufacturing Teams created to
drive each area as a it’s own
business, with the team making
decisions on how to be successful
• Includes: Operations
Supervisor, Manufacturing
Engineer, Materials Planner,
Quality Assurance
• These members were previously seated within
there internal organizational groups. Ex. All
materials planners sat together = silo
• Leading Performance Teams are placed directly on
the shop floor in a glass cubicle to reduce noise
• Allows easy access by direct employees to
initiate quick problem solving for daily issues
• Collaboration work surface has a large roll of butcher
paper that can be used for team problem solving
• Glass marker board with clear background
30
LEADING PERFORMANCE BOARDS
31
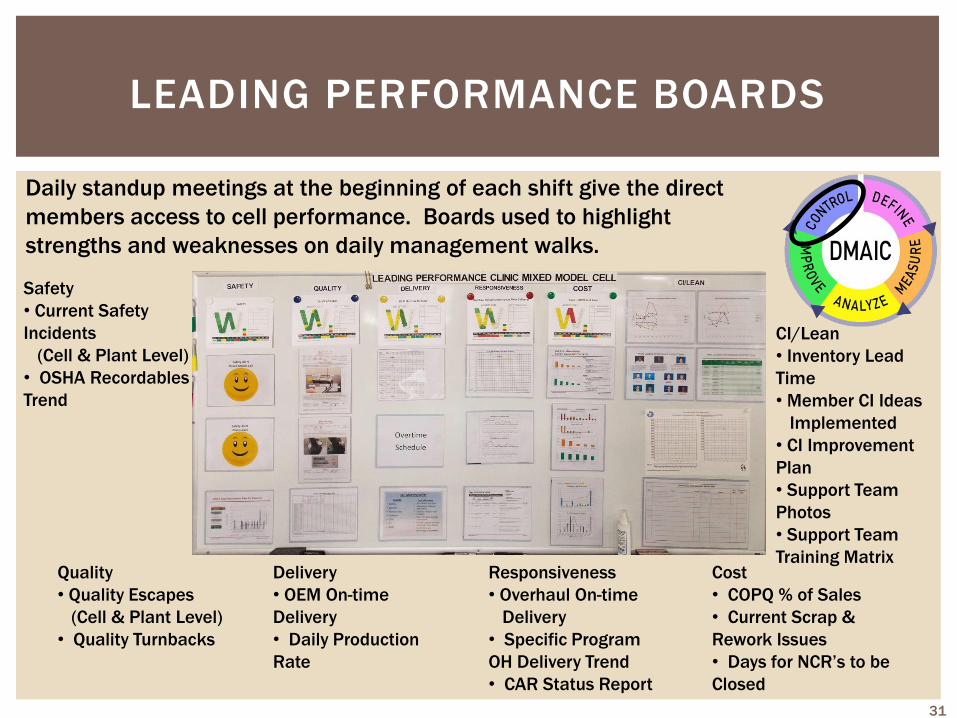
Safety
• Current Safety
Incidents
(Cell & Plant Level)
• OSHA Recordables
Trend
Quality
• Quality Escapes
(Cell & Plant Level)
• Quality Turnbacks
Delivery
• OEM On-time
Delivery
• Daily Production
Rate
Responsiveness
• Overhaul On-time
Delivery
• Specific Program
OH Delivery Trend
• CAR Status Report
Cost
• COPQ % of Sales
• Current Scrap &
Rework Issues
• Days for NCR’s to be
Closed
CI/Lean
• Inventory Lead
Time
• Member CI Ideas
Implemented
• CI Improvement
Plan
• Support Team
Photos
• Support Team
Training Matrix
Daily standup meetings at the beginning of each shift give the direct
members access to cell performance. Boards used to highlight
strengths and weaknesses on daily management walks.
LEADING PERFORMANCE CLINICS
32
Example Only Example Only
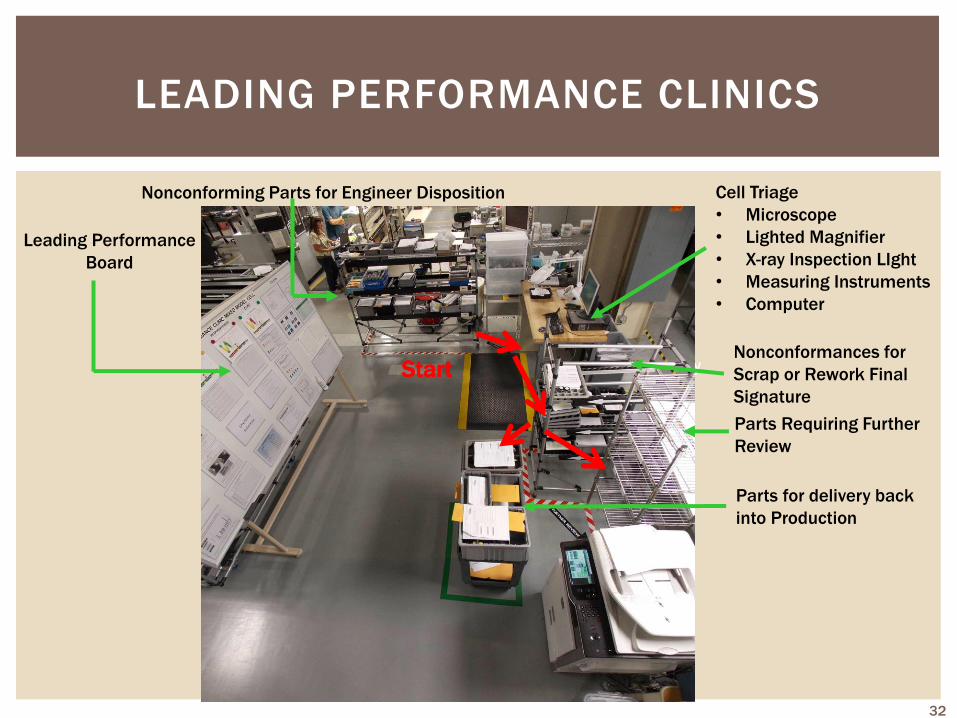
Leading Performance
Board
Cell Triage
• Microscope
• Lighted Magnifier
• X-ray Inspection LIght
• Measuring Instruments
• Computer
Nonconforming Parts for Engineer Disposition
Nonconformances for
Scrap or Rework Final
Signature
Parts for delivery back
into Production
Parts Requiring Further
Review
Start
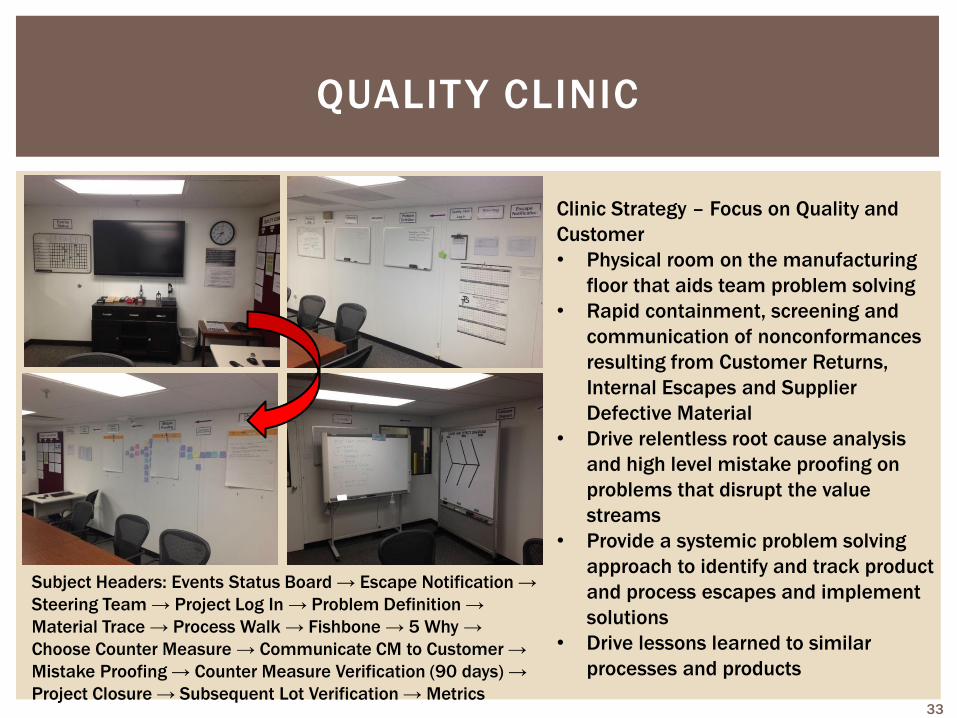
QUALITY CLINIC
Clinic Strategy – Focus on Quality and
Customer
• Physical room on the manufacturing
floor that aids team problem solving
• Rapid containment, screening and
communication of nonconformances
resulting from Customer Returns,
Internal Escapes and Supplier
Defective Material
• Drive relentless root cause analysis
and high level mistake proofing on
problems that disrupt the value
streams
• Provide a systemic problem solving
approach to identify and track product
and process escapes and implement
solutions
• Drive lessons learned to similar
processes and products
Subject Headers: Events Status Board → Escape Notification →
Steering Team → Project Log In → Problem Definition →
Material Trace → Process Walk → Fishbone → 5 Why →
Choose Counter Measure → Communicate CM to Customer →
Mistake Proofing → Counter Measure Verification (90 days) →
Project Closure → Subsequent Lot Verification → Metrics
33
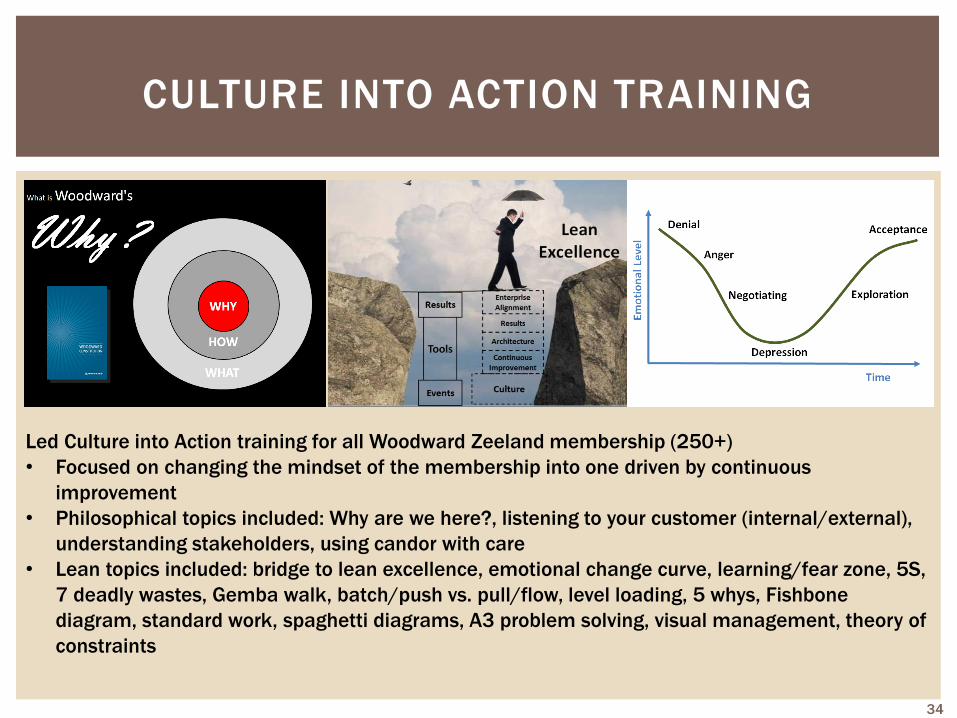
CULTURE INTO ACTION TRAINING
Led Culture into Action training for all Woodward Zeeland membership (250+)
• Focused on changing the mindset of the membership into one driven by continuous
improvement
• Philosophical topics included: Why are we here?, listening to your customer (internal/external),
understanding stakeholders, using candor with care
• Lean topics included: bridge to lean excellence, emotional change curve, learning/fear zone, 5S,
7 deadly wastes, Gemba walk, batch/push vs. pull/flow, level loading, 5 whys, Fishbone
diagram, standard work, spaghetti diagrams, A3 problem solving, visual management, theory of
constraints
34
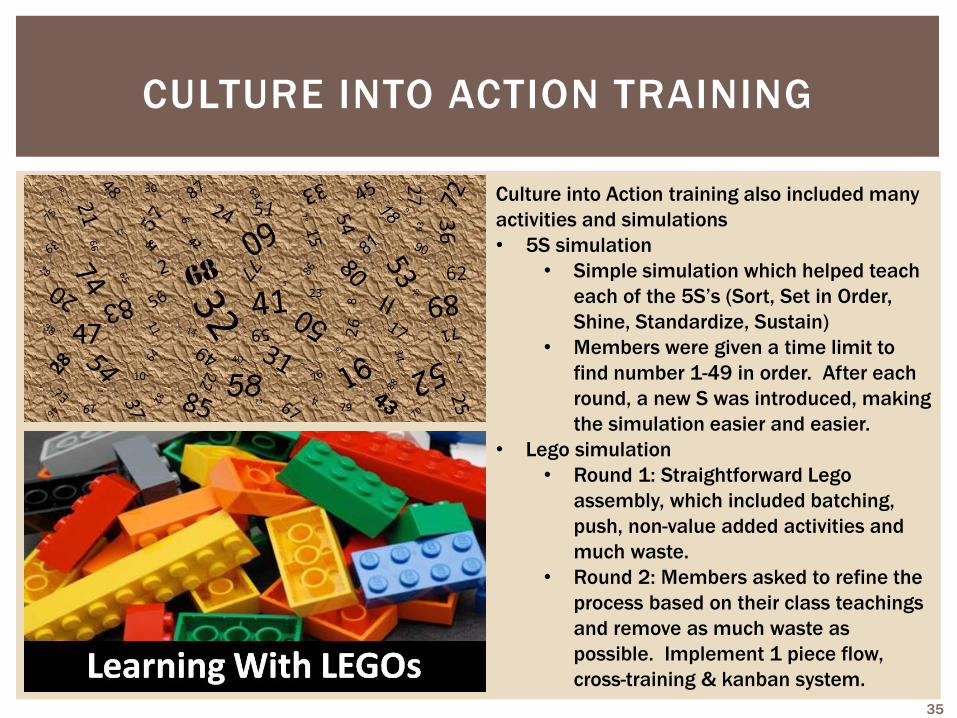
CULTURE INTO ACTION TRAINING
Culture into Action training also included many
activities and simulations
• 5S simulation
• Simple simulation which helped teach
each of the 5S’s (Sort, Set in Order,
Shine, Standardize, Sustain)
• Members were given a time limit to
find number 1-49 in order. After each
round, a new S was introduced, making
the simulation easier and easier.
• Lego simulation
• Round 1: Straightforward Lego
assembly, which included batching,
push, non-value added activities and
much waste.
• Round 2: Members asked to refine the
process based on their class teachings
and remove as much waste as
possible. Implement 1 piece flow,
cross-training & kanban system.
35
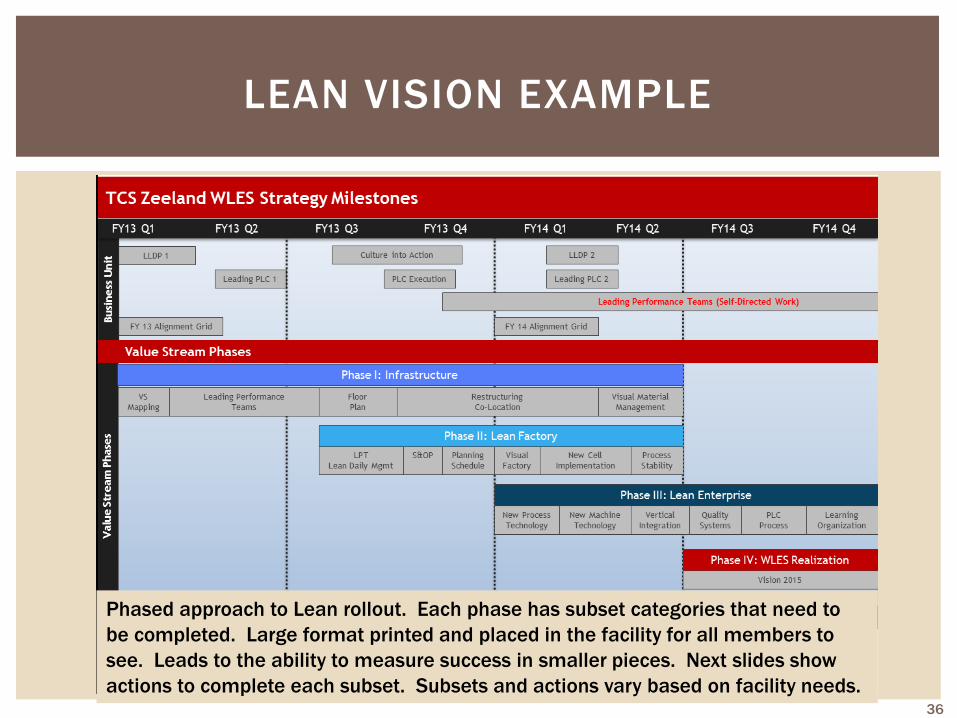
LEAN VISION EXAMPLE
Phased approach to Lean rollout. Each phase has subset categories that need to
be completed. Large format printed and placed in the facility for all members to
see. Leads to the ability to measure success in smaller pieces. Next slides show
actions to complete each subset. Subsets and actions vary based on facility needs. 36
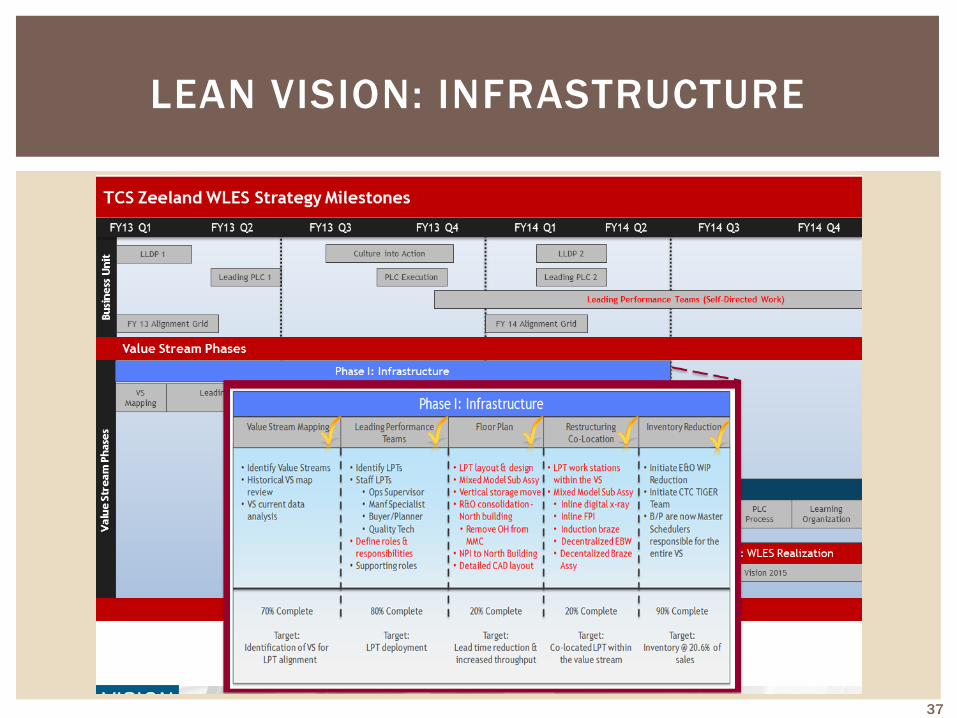
LEAN VISION: INFRASTRUCTURE
37
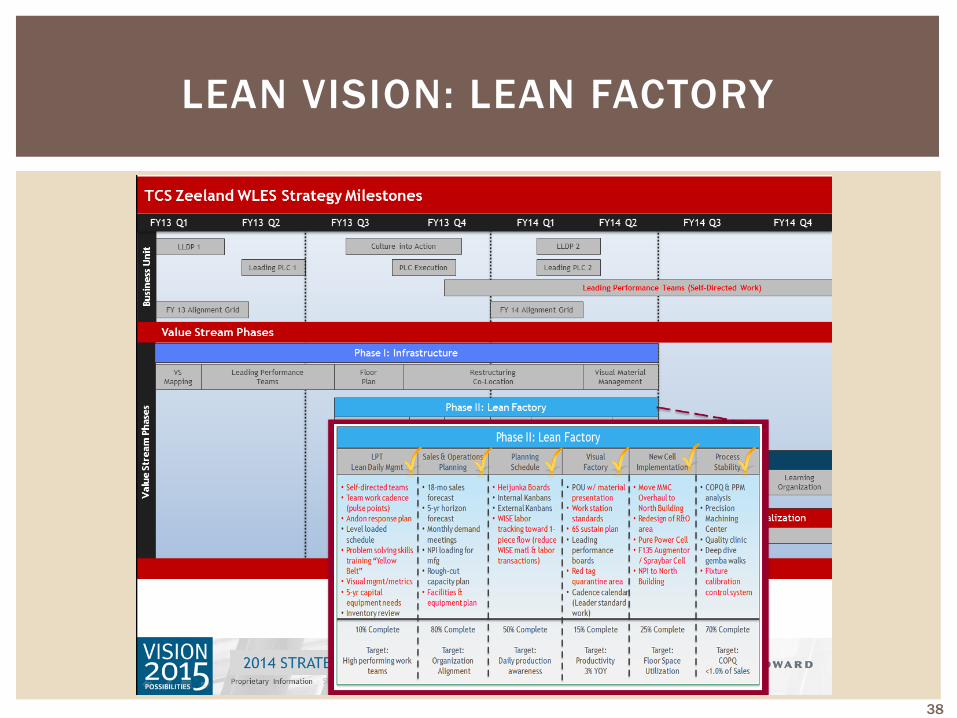
LEAN VISION: LEAN FACTORY
38
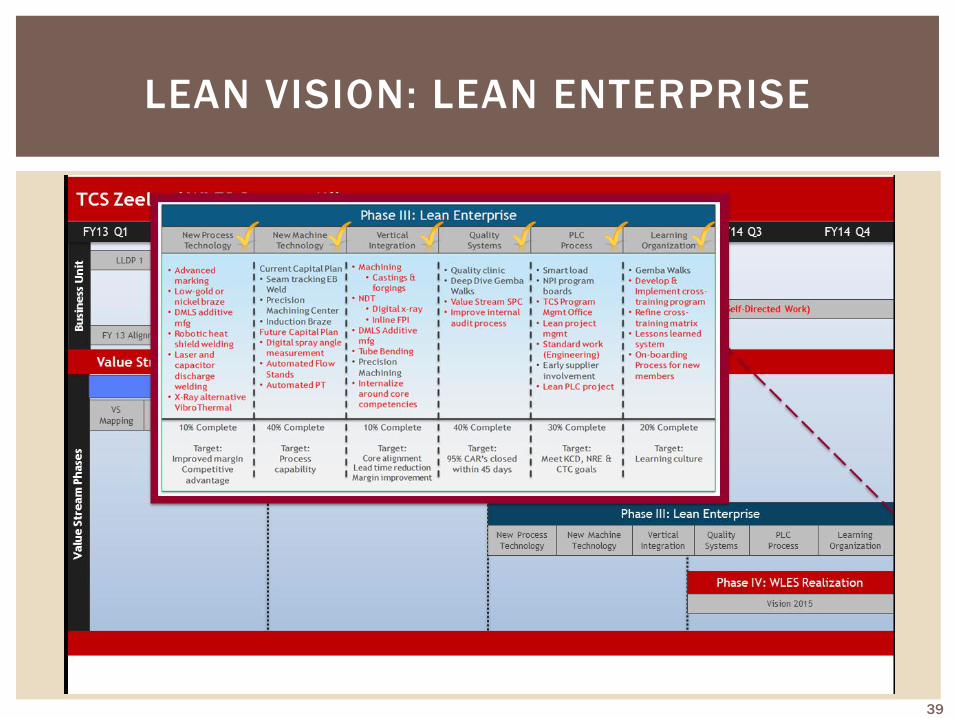
LEAN VISION: LEAN ENTERPRISE
39
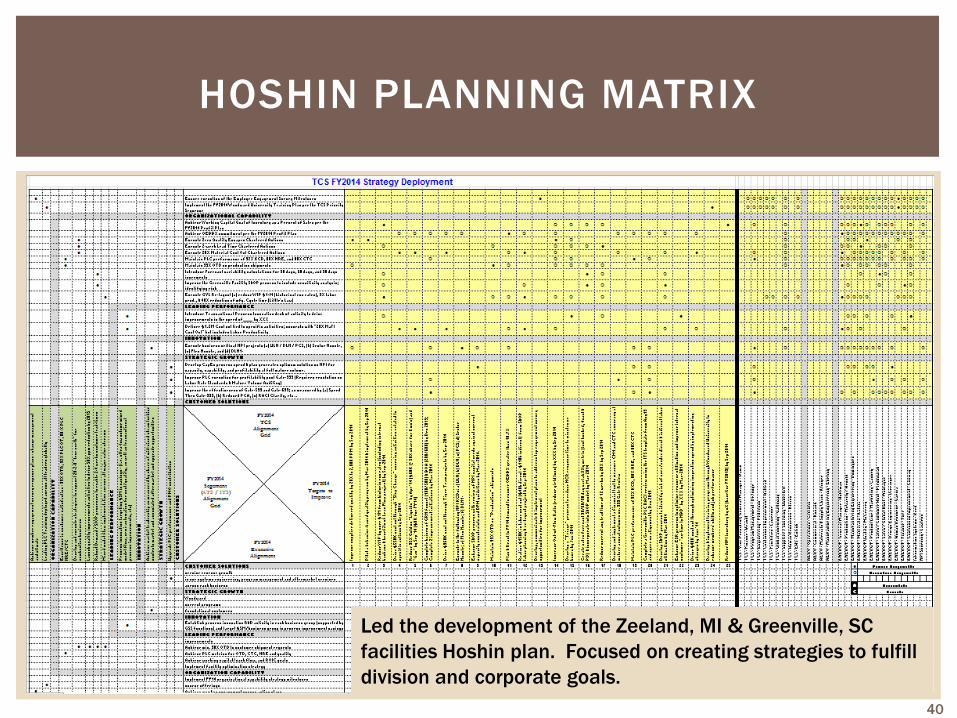
HOSHIN PLANNING MATRIX
Led the development of the Zeeland, MI & Greenville, SC
facilities Hoshin plan. Focused on creating strategies to fulfill
division and corporate goals.
40
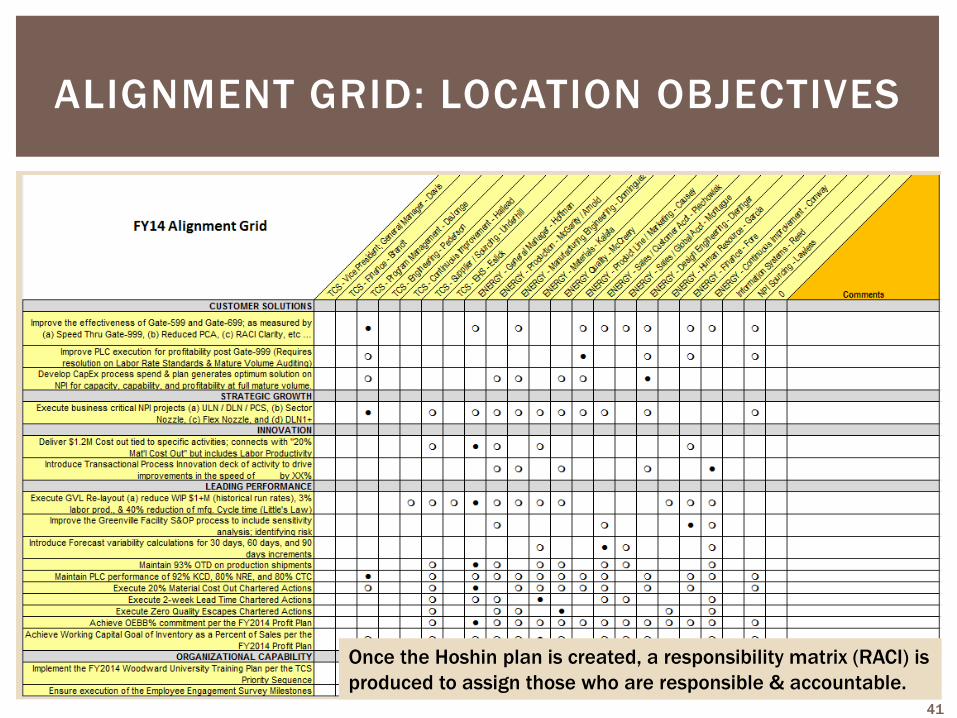
ALIGNMENT GRID: LOCATION OBJECTIVES
Once the Hoshin plan is created, a responsibility matrix (RACI) is
produced to assign those who are responsible & accountable.
41
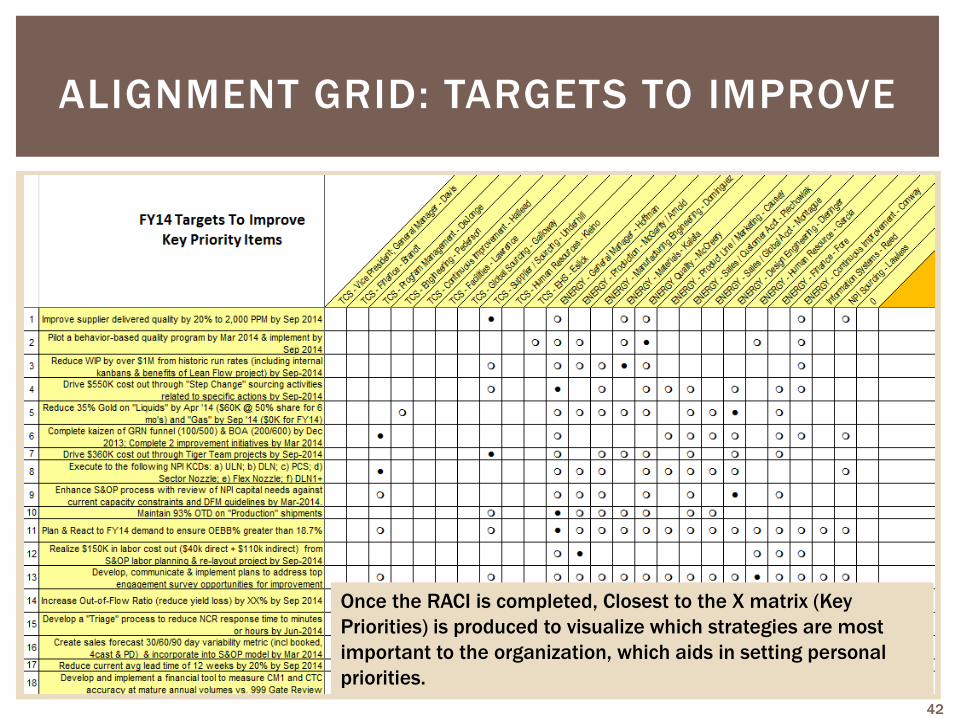
ALIGNMENT GRID: TARGETS TO IMPROVE
Once the RACI is completed, Closest to the X matrix (Key
Priorities) is produced to visualize which strategies are most
important to the organization, which aids in setting personal
priorities.
42
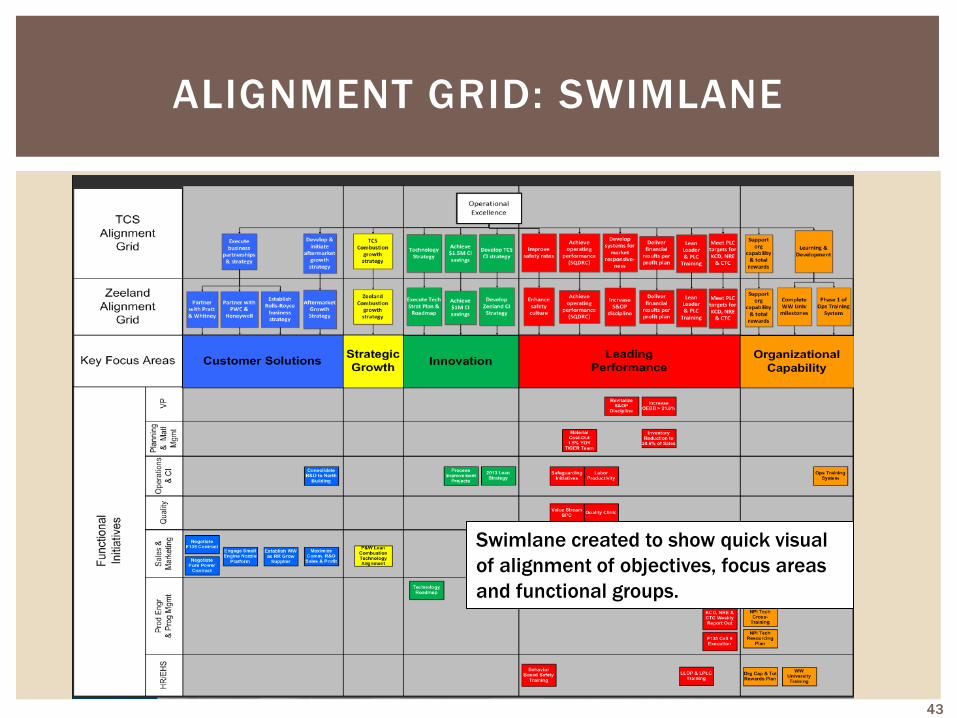
ALIGNMENT GRID: SWIMLANE
Swimlane created to show quick visual
of alignment of objectives, focus areas
and functional groups.
43
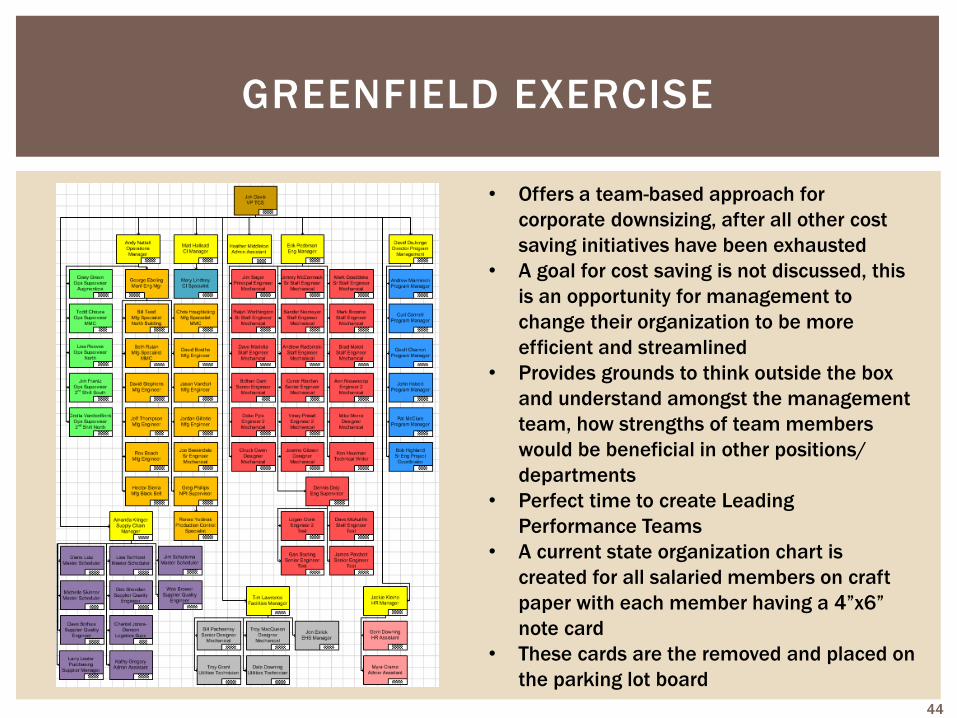
GREENFIELD EXERCISE
• Offers a team-based approach for
corporate downsizing, after all other cost
saving initiatives have been exhausted
• A goal for cost saving is not discussed, this
is an opportunity for management to
change their organization to be more
efficient and streamlined
• Provides grounds to think outside the box
and understand amongst the management
team, how strengths of team members
would be beneficial in other positions/
departments
• Perfect time to create Leading
Performance Teams
• A current state organization chart is
created for all salaried members on craft
paper with each member having a 4”x6”
note card
• These cards are the removed and placed on
the parking lot board
44
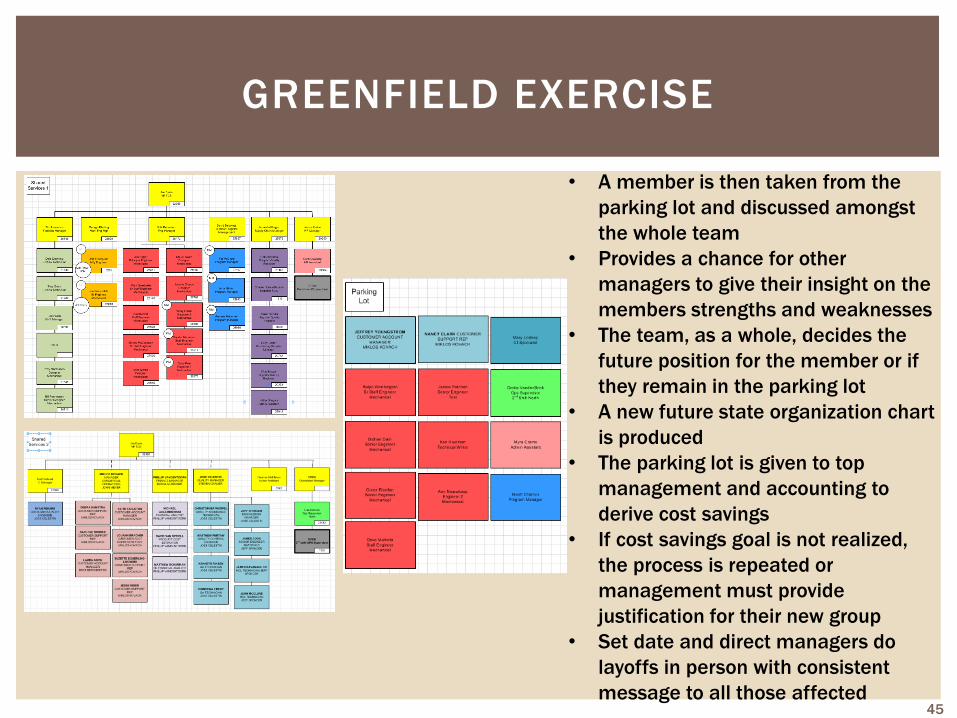
GREENFIELD EXERCISE
• A member is then taken from the
parking lot and discussed amongst
the whole team
• Provides a chance for other
managers to give their insight on the
members strengths and weaknesses
• The team, as a whole, decides the
future position for the member or if
they remain in the parking lot
• A new future state organization chart
is produced
• The parking lot is given to top
management and accounting to
derive cost savings
• If cost savings goal is not realized,
the process is repeated or
management must provide
justification for their new group
• Set date and direct managers do
layoffs in person with consistent
message to all those affected
45
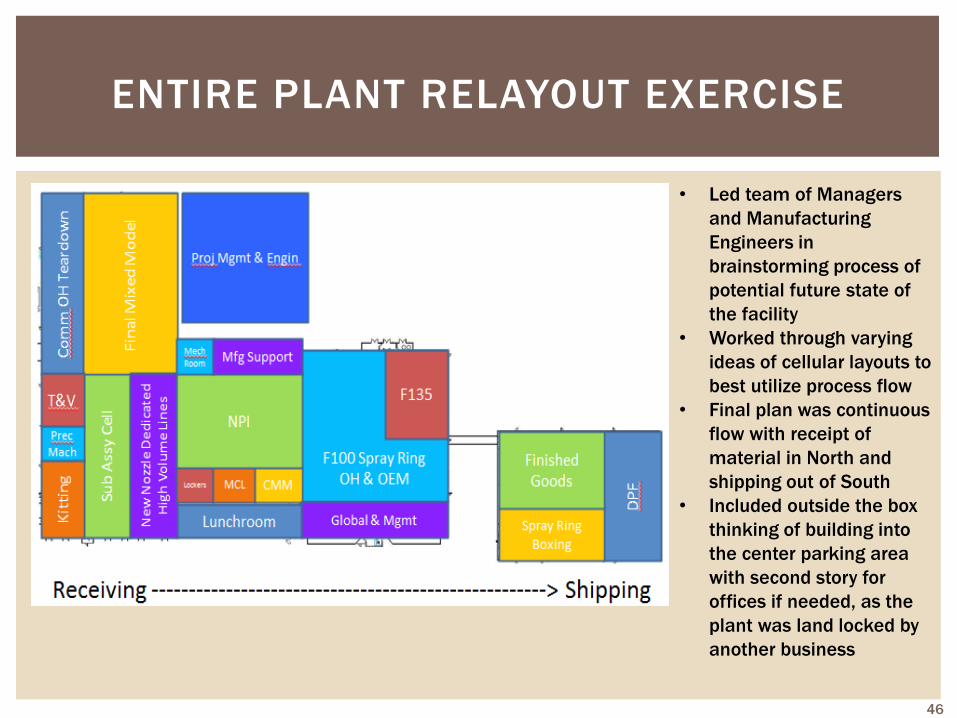
ENTIRE PLANT RELAYOUT EXERCISE
46
• Led team of Managers
and Manufacturing
Engineers in
brainstorming process of
potential future state of
the facility
• Worked through varying
ideas of cellular layouts to
best utilize process flow
• Final plan was continuous
flow with receipt of
material in North and
shipping out of South
• Included outside the box
thinking of building into
the center parking area
with second story for
offices if needed, as the
plant was land locked by
another business
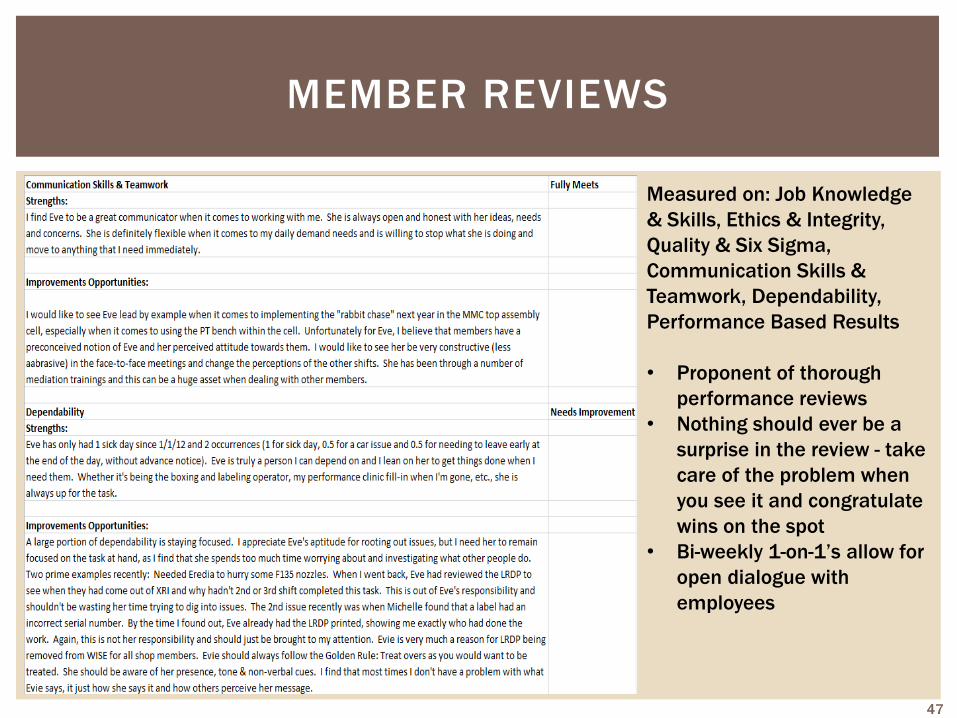
MEMBER REVIEWS
Measured on: Job Knowledge
& Skills, Ethics & Integrity,
Quality & Six Sigma,
Communication Skills &
Teamwork, Dependability,
Performance Based Results
• Proponent of thorough
performance reviews
• Nothing should ever be a
surprise in the review - take
care of the problem when
you see it and congratulate
wins on the spot
• Bi-weekly 1-on-1’s allow for
open dialogue with
employees
47
Matt Hallead
• Continuous
Improvement
Manager
CI ESSENTIALS
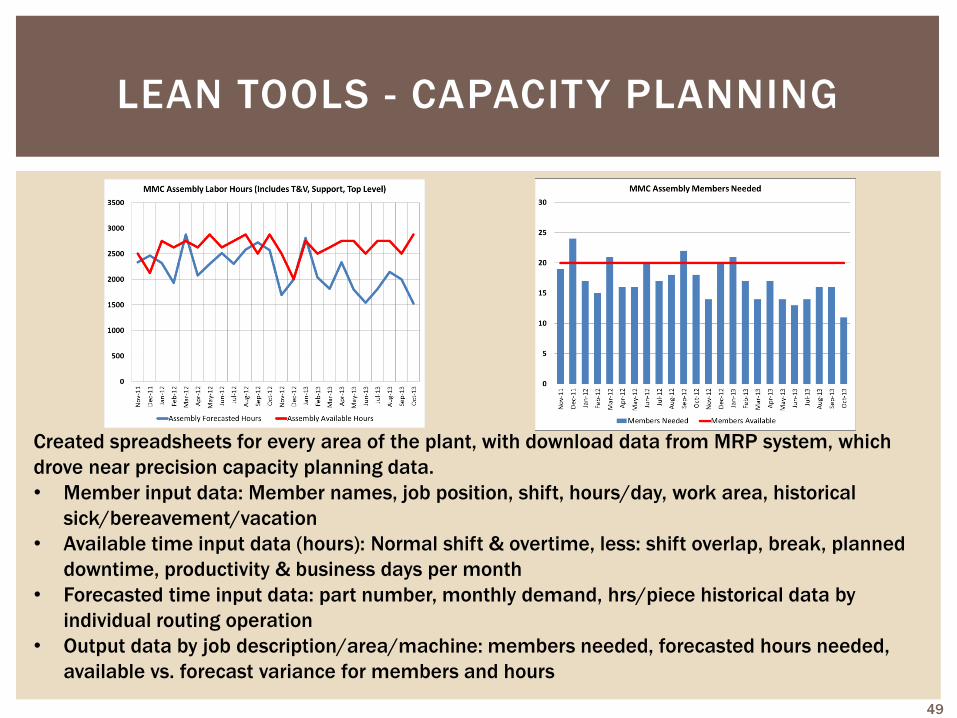
LEAN TOOLS - CAPACITY PLANNING
Created spreadsheets for every area of the plant, with download data from MRP system, which
drove near precision capacity planning data.
• Member input data: Member names, job position, shift, hours/day, work area, historical
sick/bereavement/vacation
• Available time input data (hours): Normal shift & overtime, less: shift overlap, break, planned
downtime, productivity & business days per month
• Forecasted time input data: part number, monthly demand, hrs/piece historical data by
individual routing operation
• Output data by job description/area/machine: members needed, forecasted hours needed,
available vs. forecast variance for members and hours
49
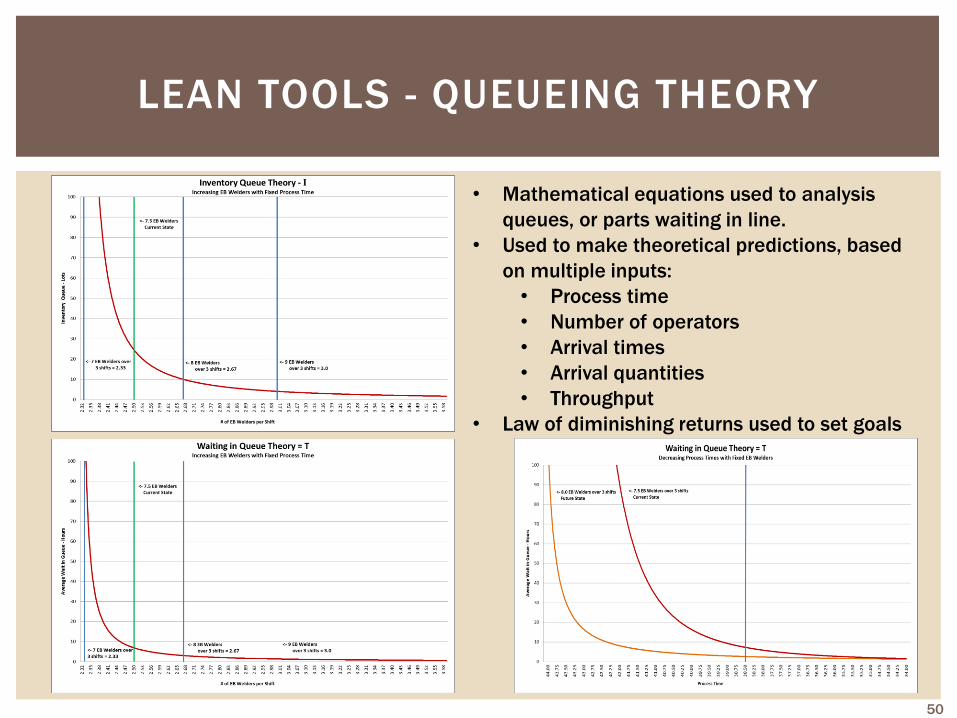
LEAN TOOLS - QUEUEING THEORY
• Mathematical equations used to analysis
queues, or parts waiting in line.
• Used to make theoretical predictions, based
on multiple inputs:
• Process time
• Number of operators
• Arrival times
• Arrival quantities
• Throughput
• Law of diminishing returns used to set goals
50
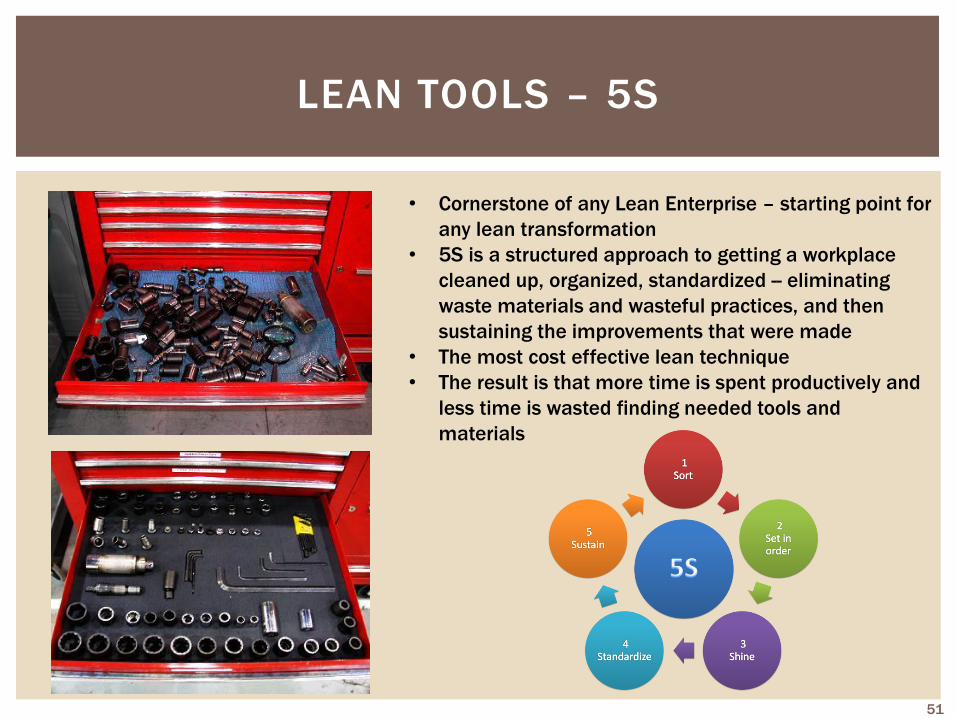
LEAN TOOLS – 5S
• Cornerstone of any Lean Enterprise – starting point for
any lean transformation
• 5S is a structured approach to getting a workplace
cleaned up, organized, standardized -- eliminating
waste materials and wasteful practices, and then
sustaining the improvements that were made
• The most cost effective lean technique
• The result is that more time is spent productively and
less time is wasted finding needed tools and
materials
51
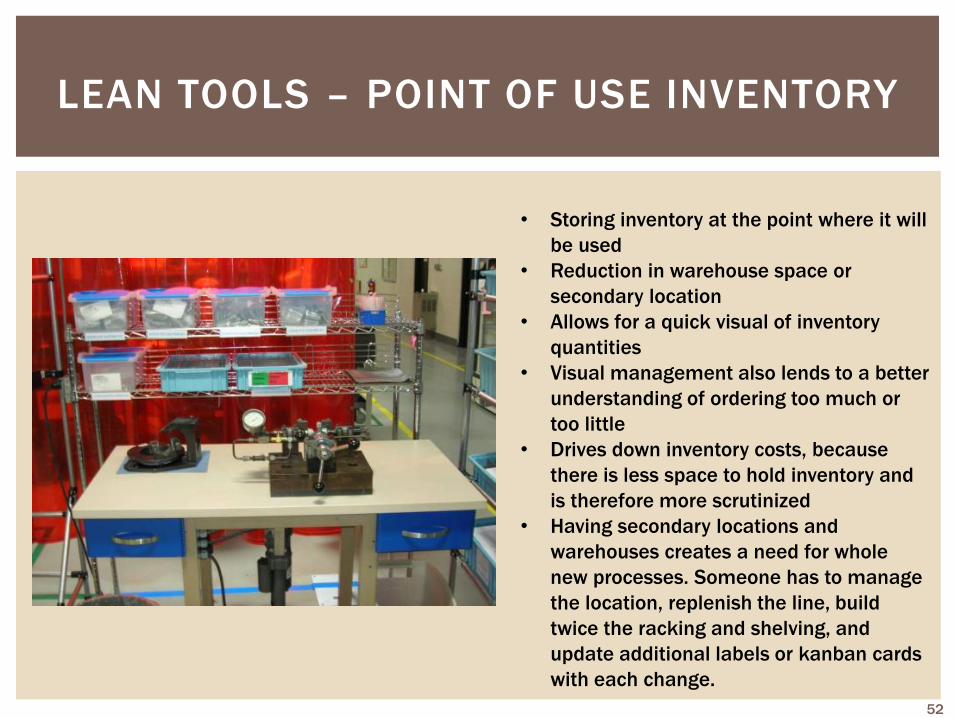
LEAN TOOLS – POINT OF USE INVENTORY
• Storing inventory at the point where it will
be used
• Reduction in warehouse space or
secondary location
• Allows for a quick visual of inventory
quantities
• Visual management also lends to a better
understanding of ordering too much or
too little
• Drives down inventory costs, because
there is less space to hold inventory and
is therefore more scrutinized
• Having secondary locations and
warehouses creates a need for whole
new processes. Someone has to manage
the location, replenish the line, build
twice the racking and shelving, and
update additional labels or kanban cards
with each change.
52
LEAN TOOLS – VISUALS AIDS
53
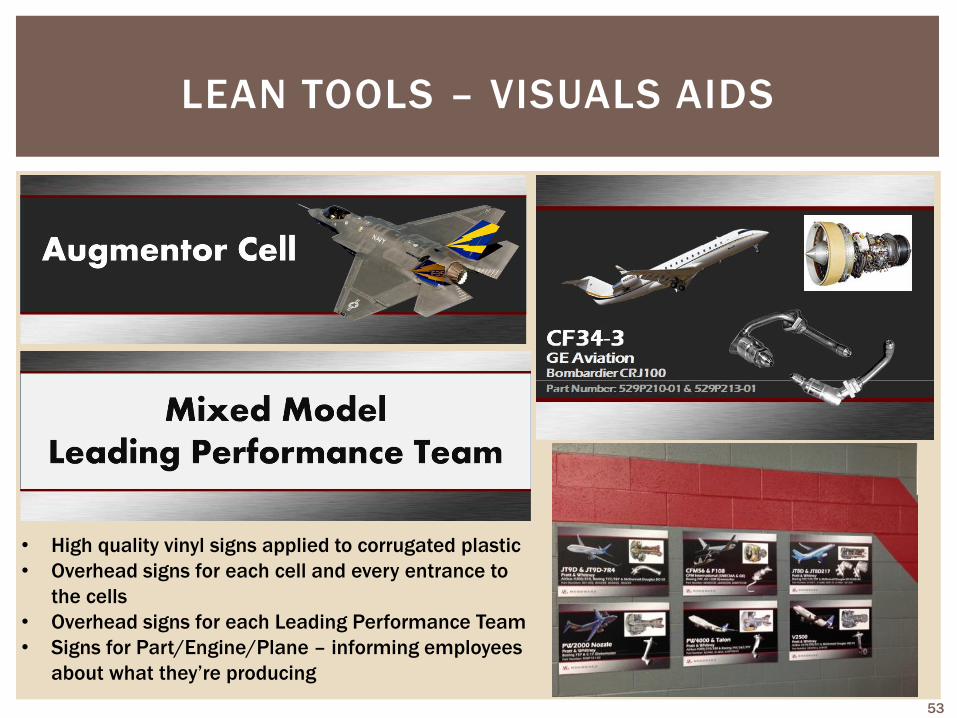
• High quality vinyl signs applied to corrugated plastic
• Overhead signs for each cell and every entrance to
the cells
• Overhead signs for each Leading Performance Team
• Signs for Part/Engine/Plane – informing employees
about what they’re producing
LEAN TOOLS – VISUALS AIDS
54
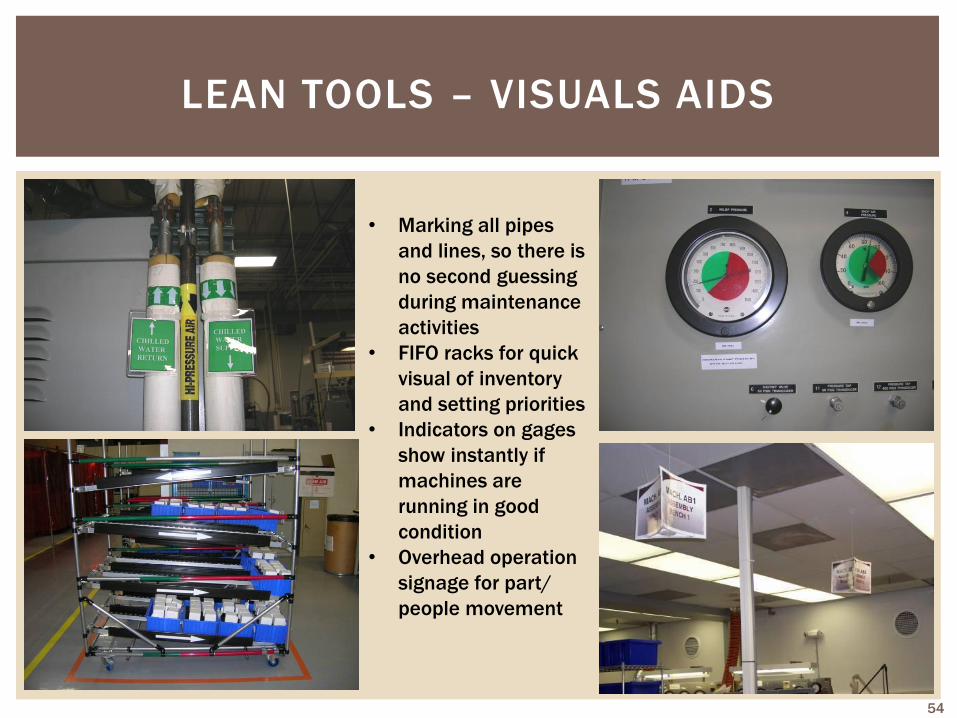
• Marking all pipes
and lines, so there is
no second guessing
during maintenance
activities
• FIFO racks for quick
visual of inventory
and setting priorities
• Indicators on gages
show instantly if
machines are
running in good
condition
• Overhead operation
signage for part/
people movement
LEAN TOOLS – VISUALS AIDS
55
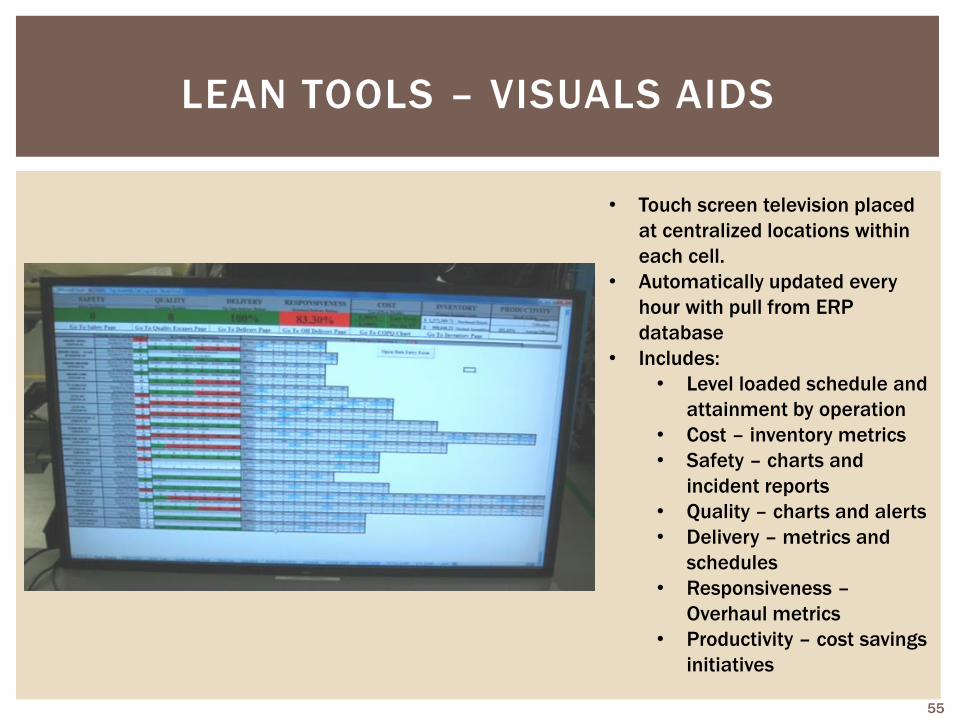
• Touch screen television placed
at centralized locations within
each cell.
• Automatically updated every
hour with pull from ERP
database
• Includes:
• Level loaded schedule and
attainment by operation
• Cost – inventory metrics
• Safety – charts and
incident reports
• Quality – charts and alerts
• Delivery – metrics and
schedules
• Responsiveness –
Overhaul metrics
• Productivity – cost savings
initiatives
LEAN TOOLS - PROJECT REPORT OUTS
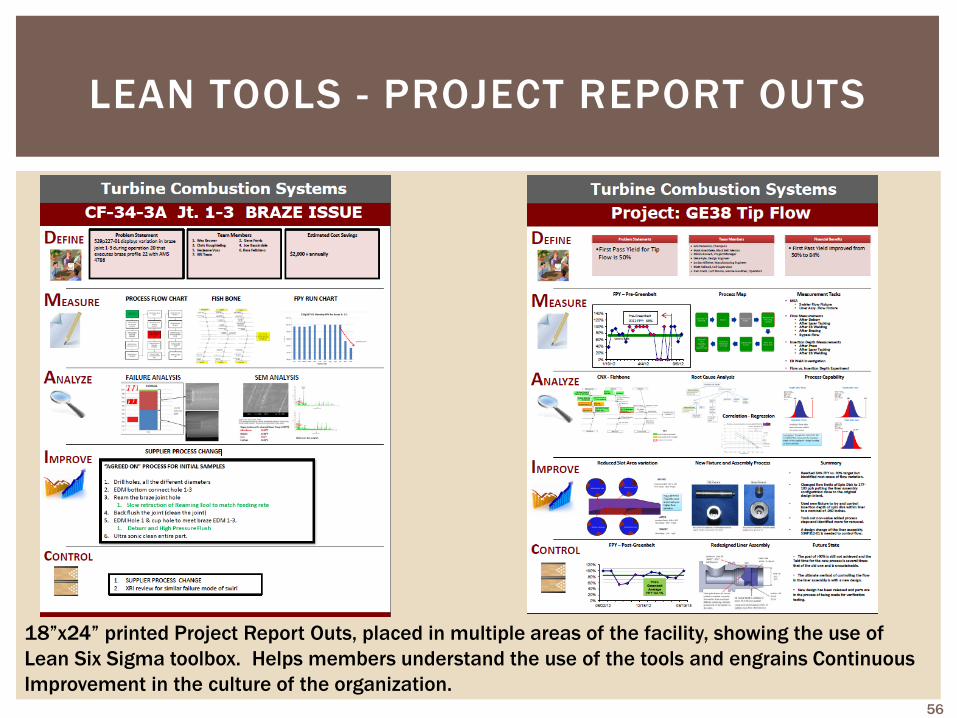
18”x24” printed Project Report Outs, placed in multiple areas of the facility, showing the use of
Lean Six Sigma toolbox. Helps members understand the use of the tools and engrains Continuous
Improvement in the culture of the organization. 56
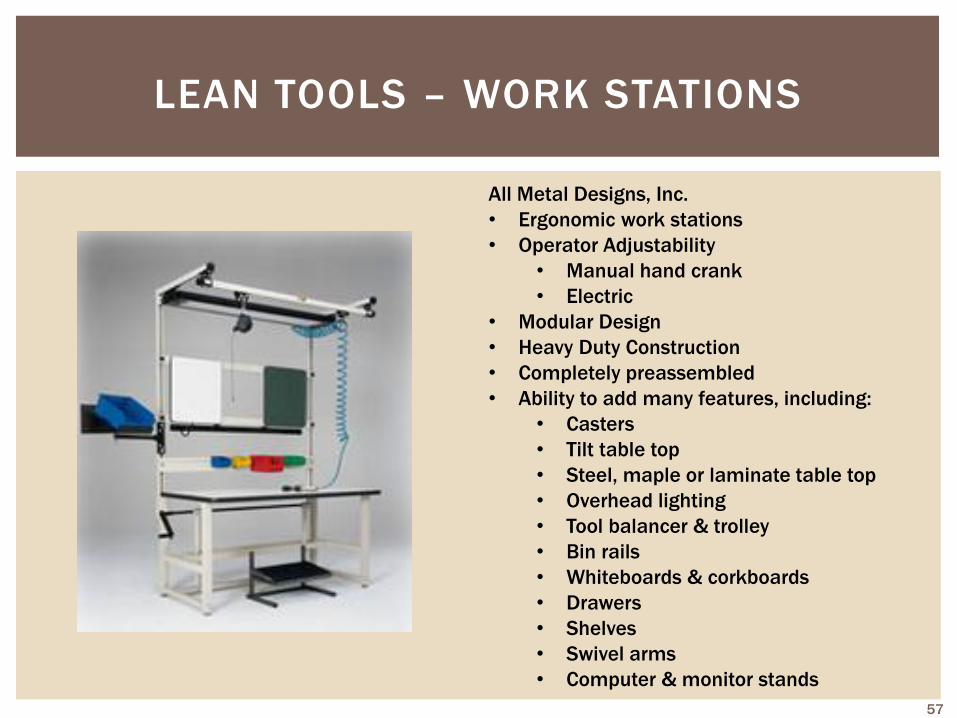
LEAN TOOLS – WORK STATIONS
All Metal Designs, Inc.
• Ergonomic work stations
• Operator Adjustability
• Manual hand crank
• Electric
• Modular Design
• Heavy Duty Construction
• Completely preassembled
• Ability to add many features, including:
• Casters
• Tilt table top
• Steel, maple or laminate table top
• Overhead lighting
• Tool balancer & trolley
• Bin rails
• Whiteboards & corkboards
• Drawers
• Shelves
• Swivel arms
• Computer & monitor stands
57
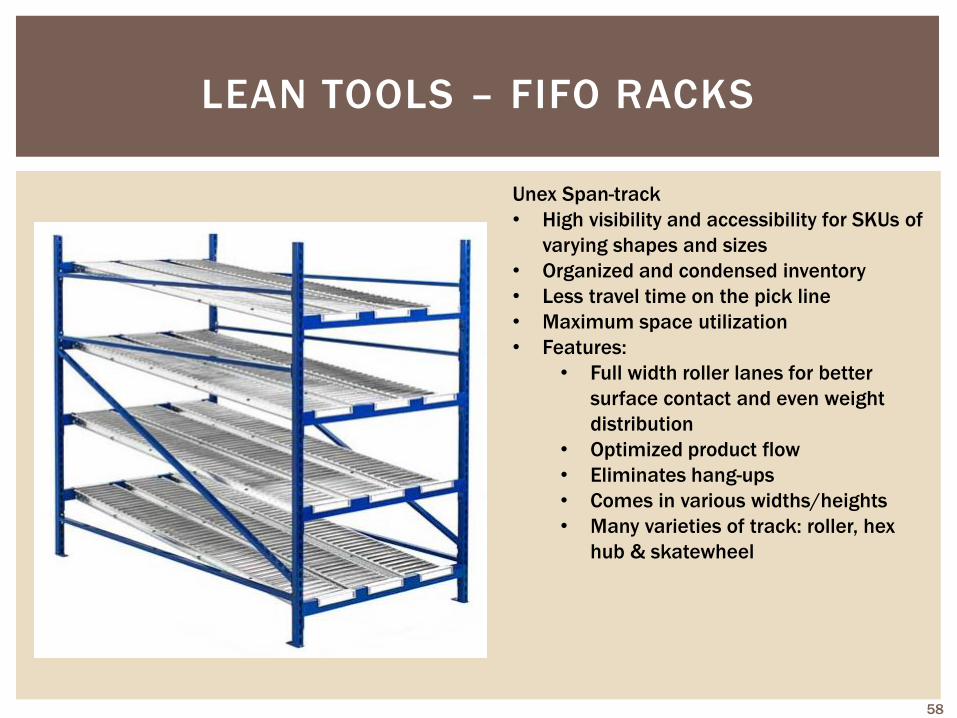
LEAN TOOLS – FIFO RACKS
Unex Span-track
• High visibility and accessibility for SKUs of
varying shapes and sizes
• Organized and condensed inventory
• Less travel time on the pick line
• Maximum space utilization
• Features:
• Full width roller lanes for better
surface contact and even weight
distribution
• Optimized product flow
• Eliminates hang-ups
• Comes in various widths/heights
• Many varieties of track: roller, hex
hub & skatewheel
58
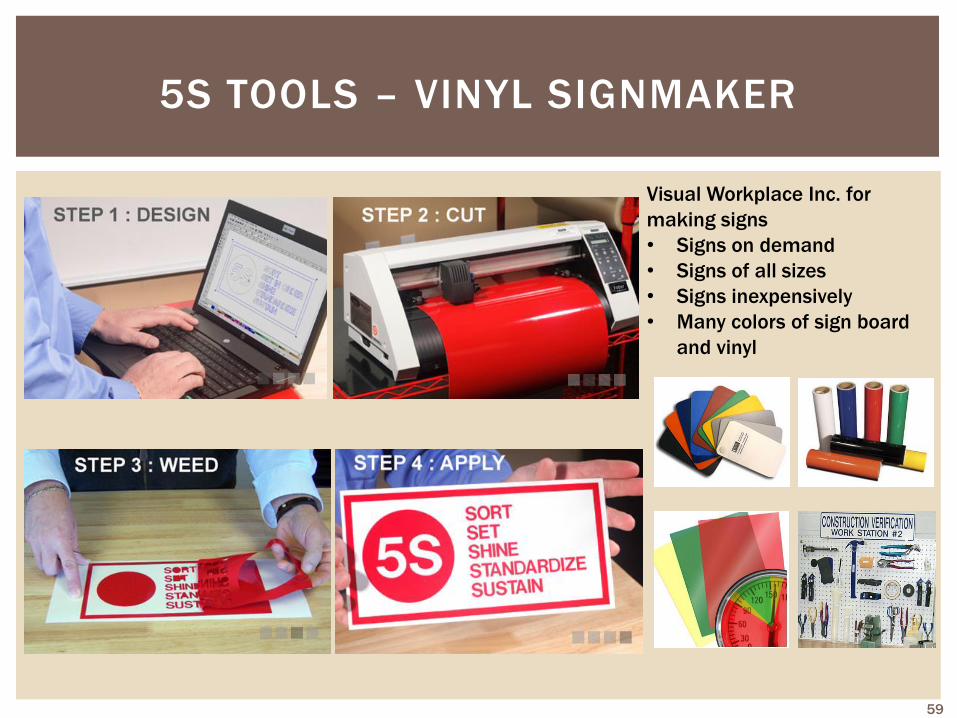
5S TOOLS – VINYL SIGNMAKER
Visual Workplace Inc. for
making signs
• Signs on demand
• Signs of all sizes
• Signs inexpensively
• Many colors of sign board
and vinyl
59
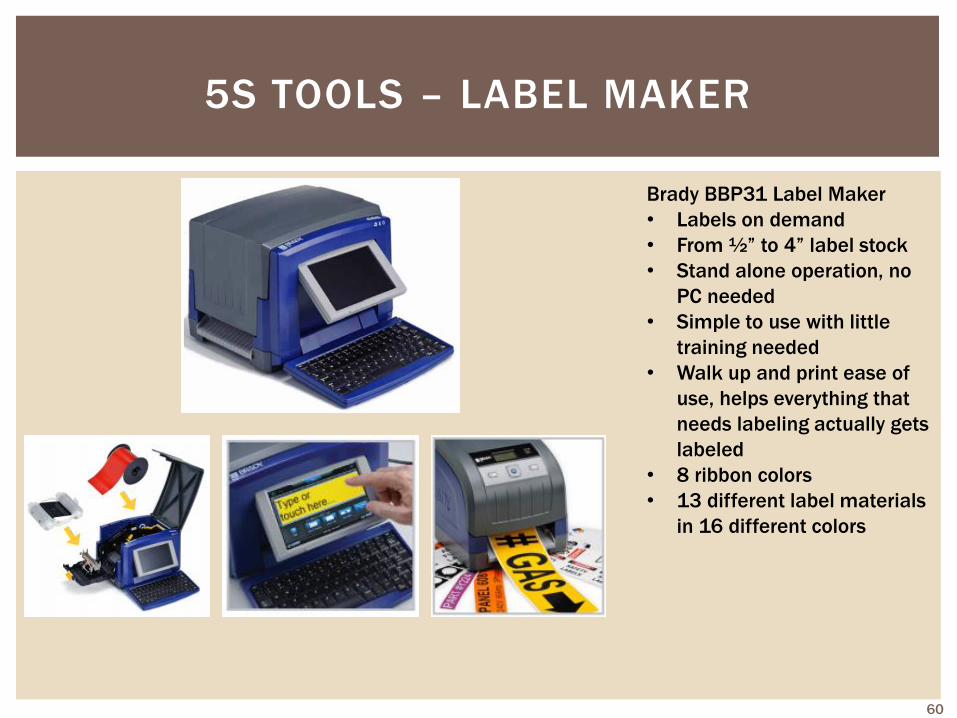
5S TOOLS – LABEL MAKER
Brady BBP31 Label Maker
• Labels on demand
• From ½” to 4” label stock
• Stand alone operation, no
PC needed
• Simple to use with little
training needed
• Walk up and print ease of
use, helps everything that
needs labeling actually gets
labeled
• 8 ribbon colors
• 13 different label materials
in 16 different colors
60
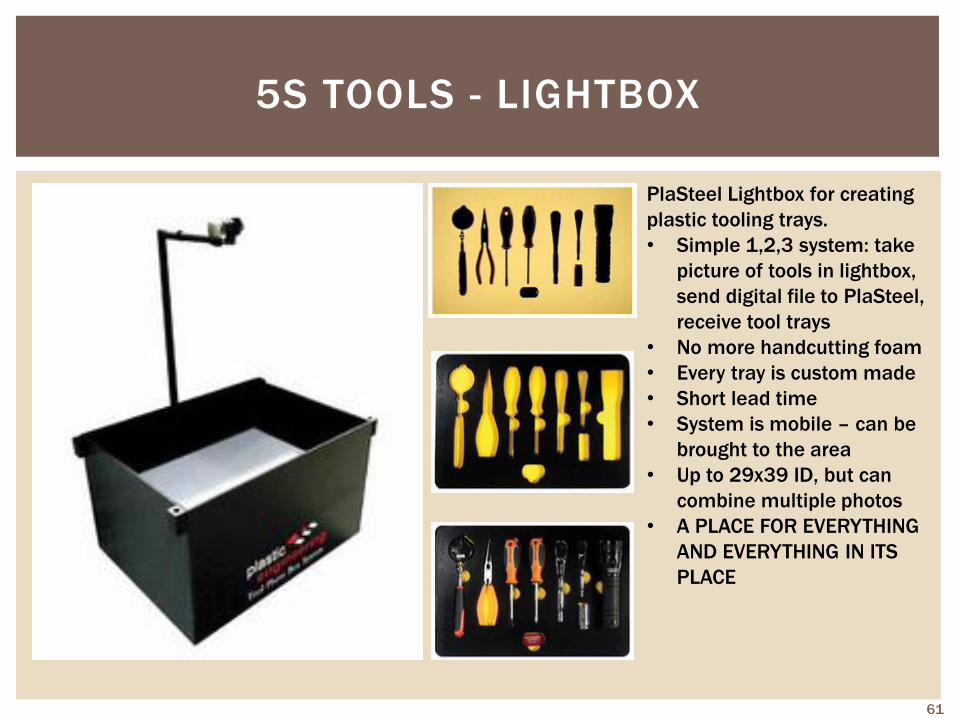
5S TOOLS - LIGHTBOX
PlaSteel Lightbox for creating
plastic tooling trays.
• Simple 1,2,3 system: take
picture of tools in lightbox,
send digital file to PlaSteel,
receive tool trays
• No more handcutting foam
• Every tray is custom made
• Short lead time
• System is mobile – can be
brought to the area
• Up to 29x39 ID, but can
combine multiple photos
• A PLACE FOR EVERYTHING
AND EVERYTHING IN ITS
PLACE
61


