Page 1
© Crown copyright 2006 Page 1
Matt Huddleston
With thanks to: Frederic Vitart (ECMWF), Ruth McDonald
& Met Office Seasonal forecasting team
14th March 2007
Dynamically-Based Seasonal forecasts of Atlantic Tropical-storm Activity
Page 2
© Crown copyright 2006 Page 2
Seasonal forecasts of tropical storms
Recent hurricane years in the Tropical Atlantic
Forecasting technology
Forecast skill
Future work
Page 3
© Crown copyright 2006 Page 3
Page 4
© Crown copyright 2006 Page 4
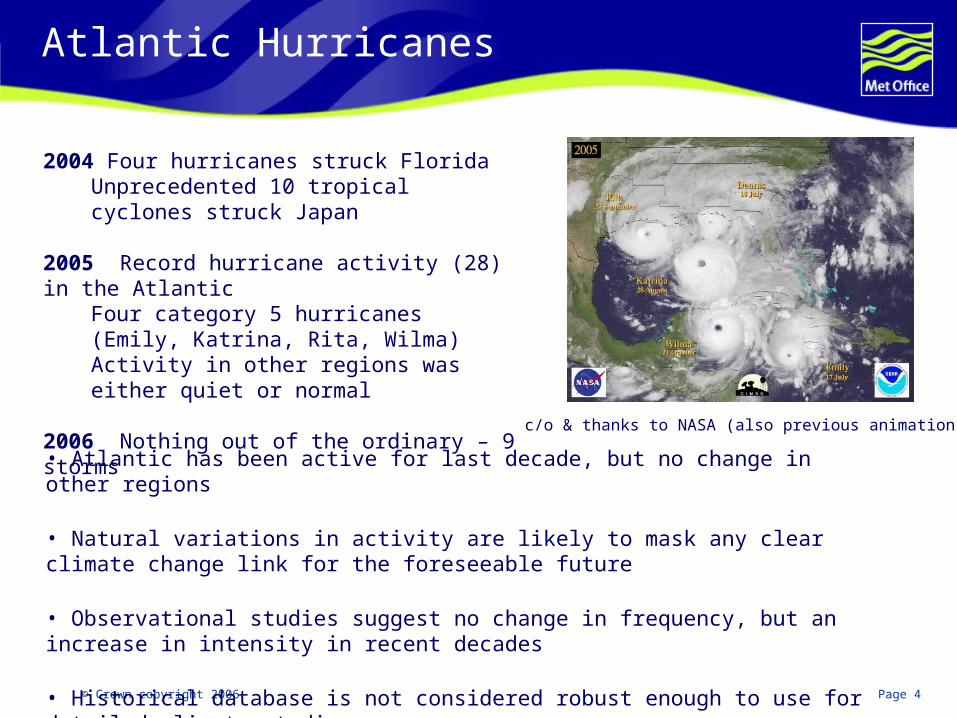
Atlantic Hurricanes
2004 Four hurricanes struck FloridaUnprecedented 10 tropical cyclones struck Japan
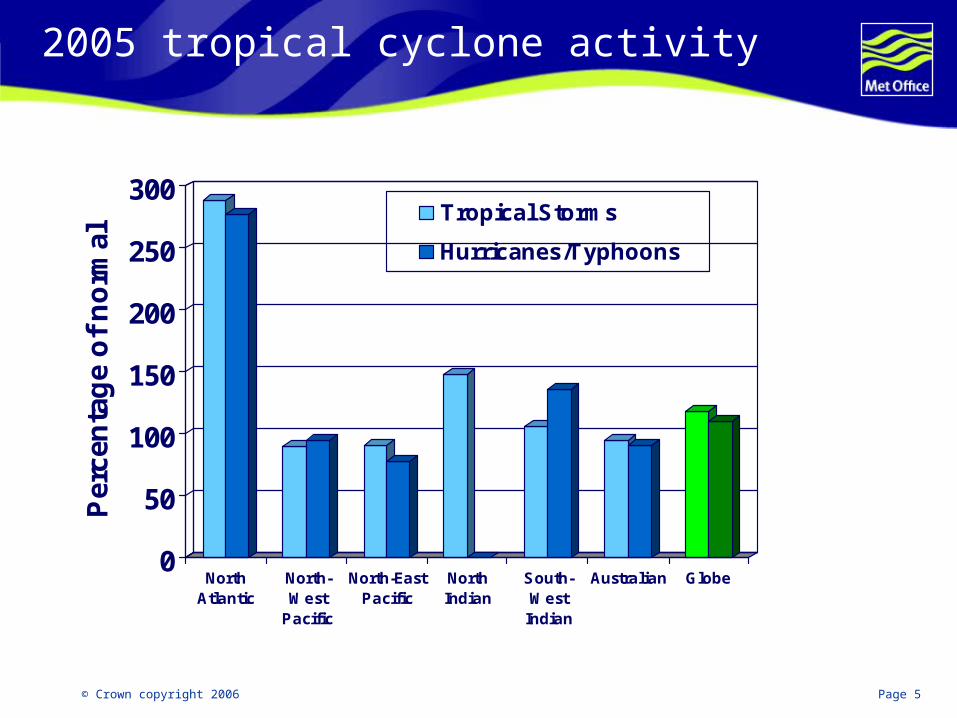
2005 Record hurricane activity (28) in the AtlanticFour category 5 hurricanes (Emily, Katrina, Rita, Wilma) Activity in other regions was either quiet or normal
2006 Nothing out of the ordinary – 9 storms
• Atlantic has been active for last decade, but no change in other regions
• Natural variations in activity are likely to mask any clear climate change link for the foreseeable future
• Observational studies suggest no change in frequency, but an increase in intensity in recent decades
• Historical database is not considered robust enough to use for detailed climate studies
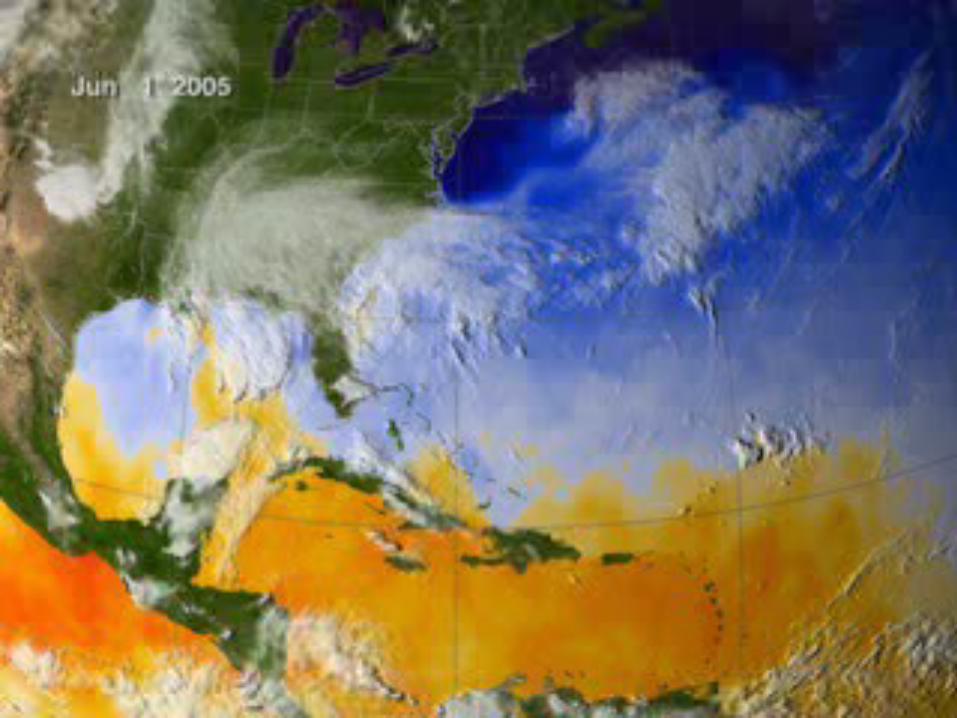
c/o & thanks to NASA (also previous animation)
Page 5
© Crown copyright 2006 Page 5
2005 tropical cyclone activity
0
50
100
150
200
250
300
Per
cen
tag
e o
f n
orm
al
NorthAtlantic
North-West
Pacific
North-EastPacific
NorthIndian
South-West
Indian
Australian Globe
Tropical Storms
Hurricanes/Typhoons
Page 6
© Crown copyright 2006 Page 6
Seasonal Forecasting technology
Page 7
© Crown copyright 2006 Page 7
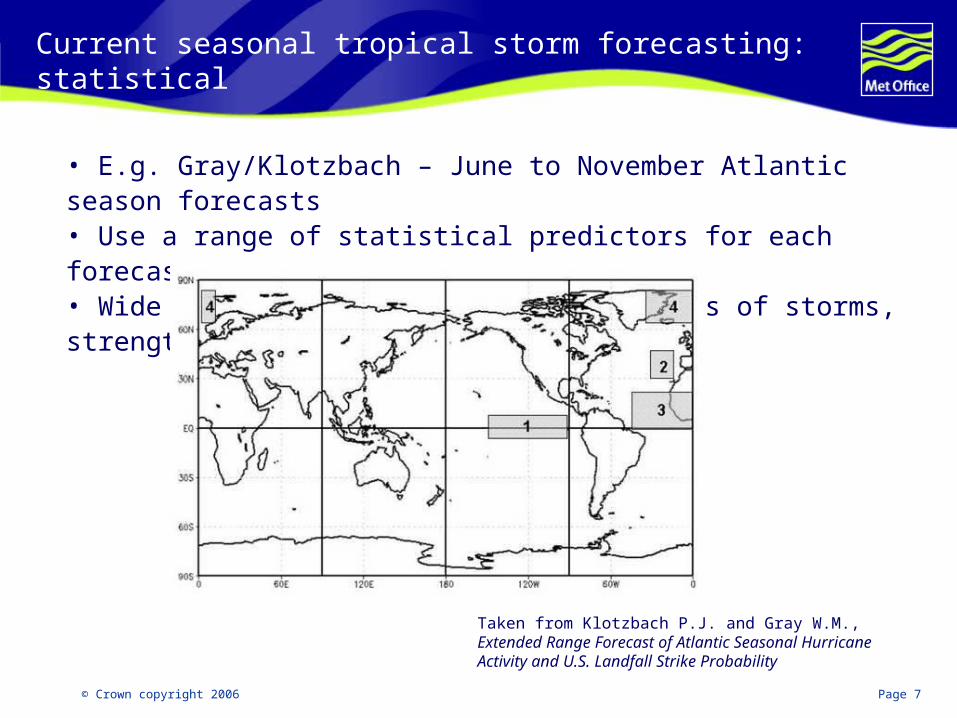
Current seasonal tropical storm forecasting: statistical
• E.g. Gray/Klotzbach – June to November Atlantic season forecasts• Use a range of statistical predictors for each forecast• Wide range of predictions made: numbers of storms, strength, landfall etc
Taken from Klotzbach P.J. and Gray W.M.,Extended Range Forecast of Atlantic Seasonal HurricaneActivity and U.S. Landfall Strike Probability
Page 8
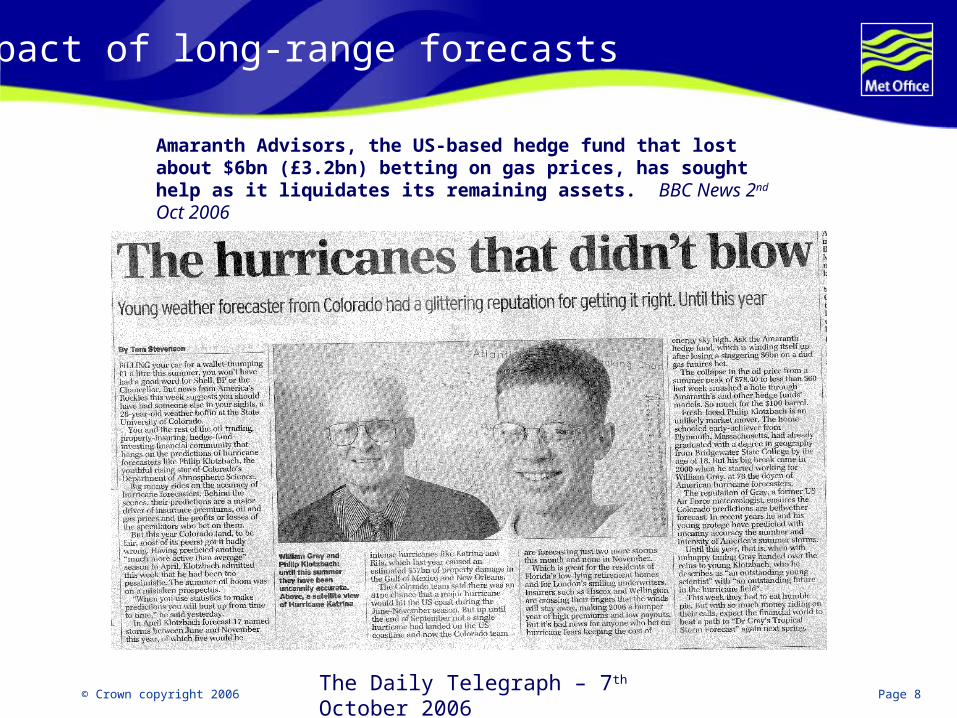
© Crown copyright 2006 Page 8The Daily Telegraph – 7th October 2006
Amaranth Advisors, the US-based hedge fund that lost about $6bn (£3.2bn) betting on gas prices, has sought help as it liquidates its remaining assets. BBC News 2nd Oct 2006
Impact of long-range forecasts
Page 9
© Crown copyright 2006 Page 9
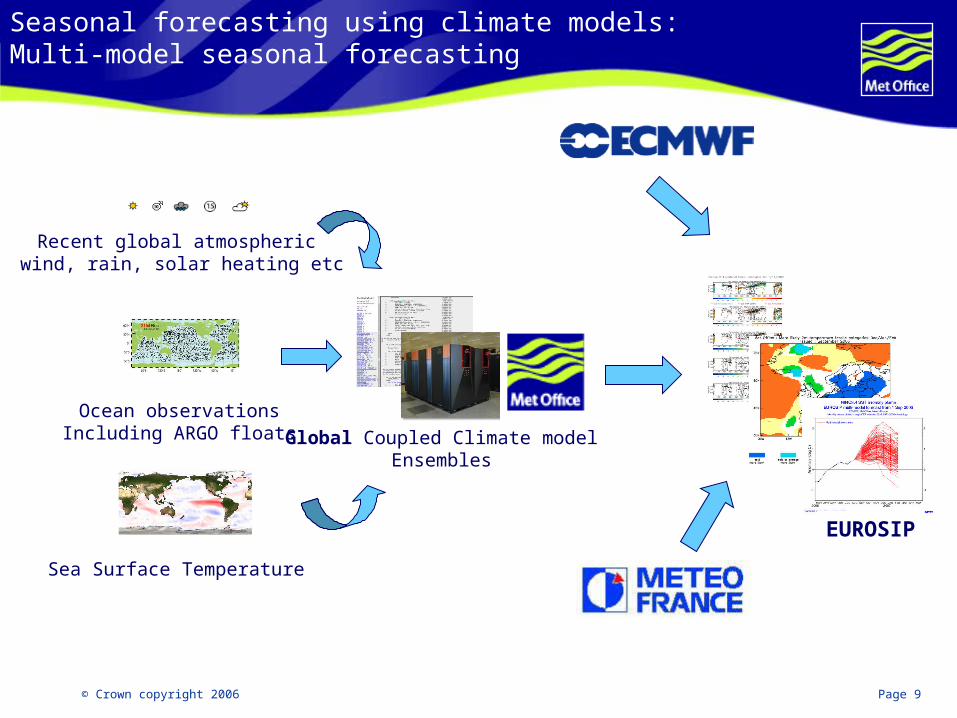
Seasonal forecasting using climate models:Multi-model seasonal forecasting
Sea Surface Temperature
Recent global atmospheric wind, rain, solar heating etc
Global Coupled Climate modelEnsembles
Ocean observationsIncluding ARGO floats
EUROSIP
Page 10
© Crown copyright 2006 Page 10
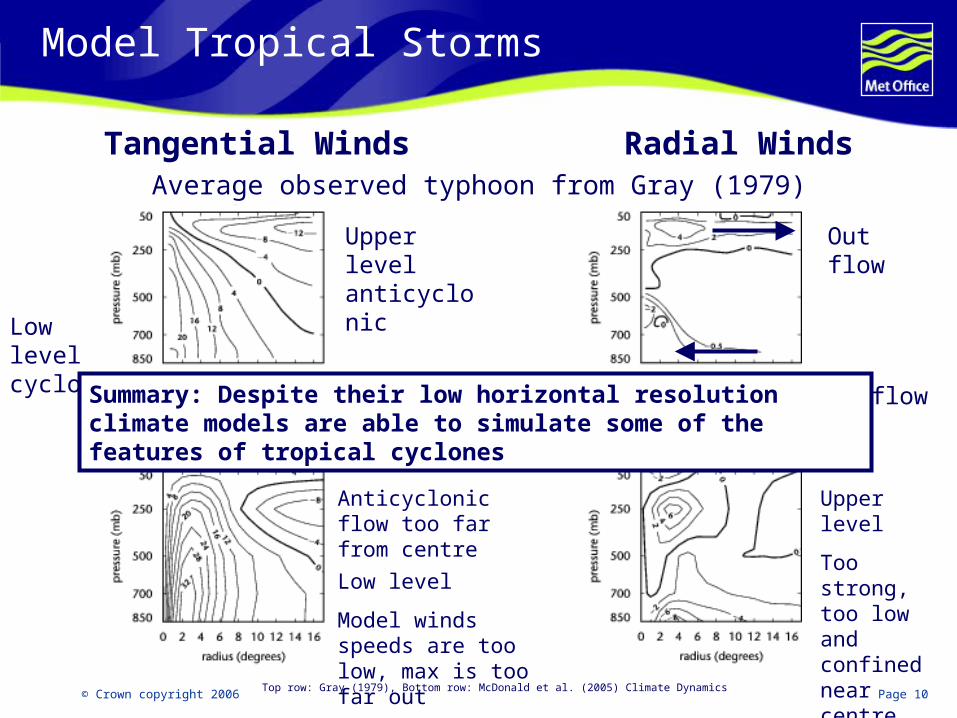
Model Tropical Storms
Out flow
In flow
Average observed typhoon from Gray (1979)
Low level cyclonic
Single tropical storm from HadAM3 N144 Model
Low level
Model winds speeds are too low, max is too far out
Top row: Gray (1979), Bottom row: McDonald et al. (2005) Climate Dynamics
Anticyclonic flow too far from centre
Upper level
Too strong, too low and confined near centre
Upper level anticyclonic
Tangential Winds Radial Winds
Summary: Despite their low horizontal resolution climate models are able to simulate some of the features of tropical cyclones
Page 11
© Crown copyright 2006 Page 11
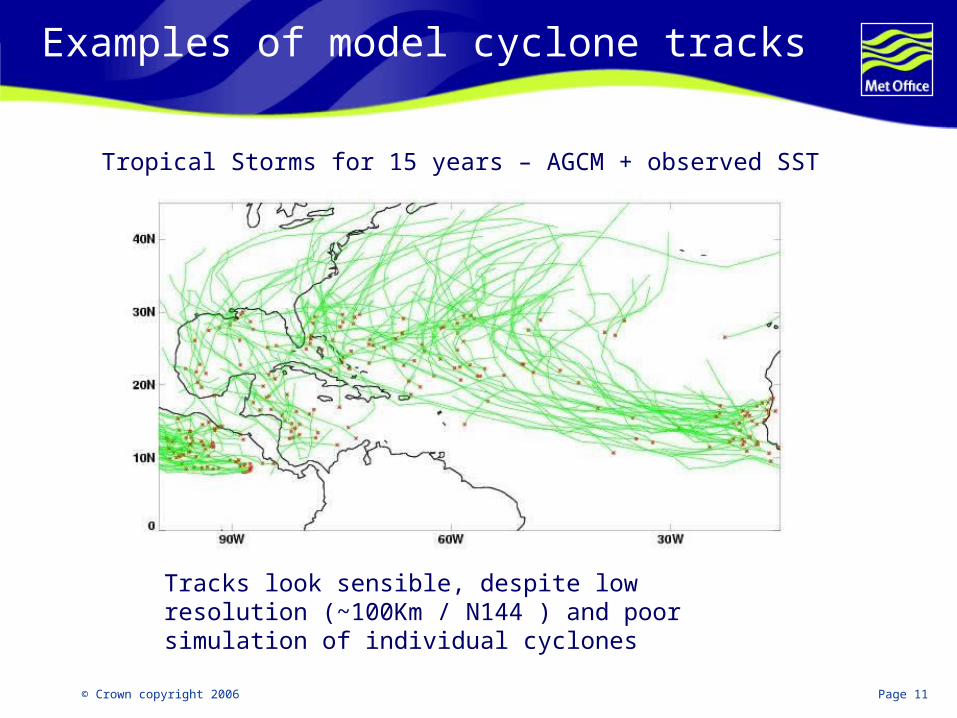
Examples of model cyclone tracks
Tropical Storms for 15 years – AGCM + observed SST
Tracks look sensible, despite low resolution (~100Km / N144 ) and poor simulation of individual cyclones
Page 12
© Crown copyright 2006 Page 12
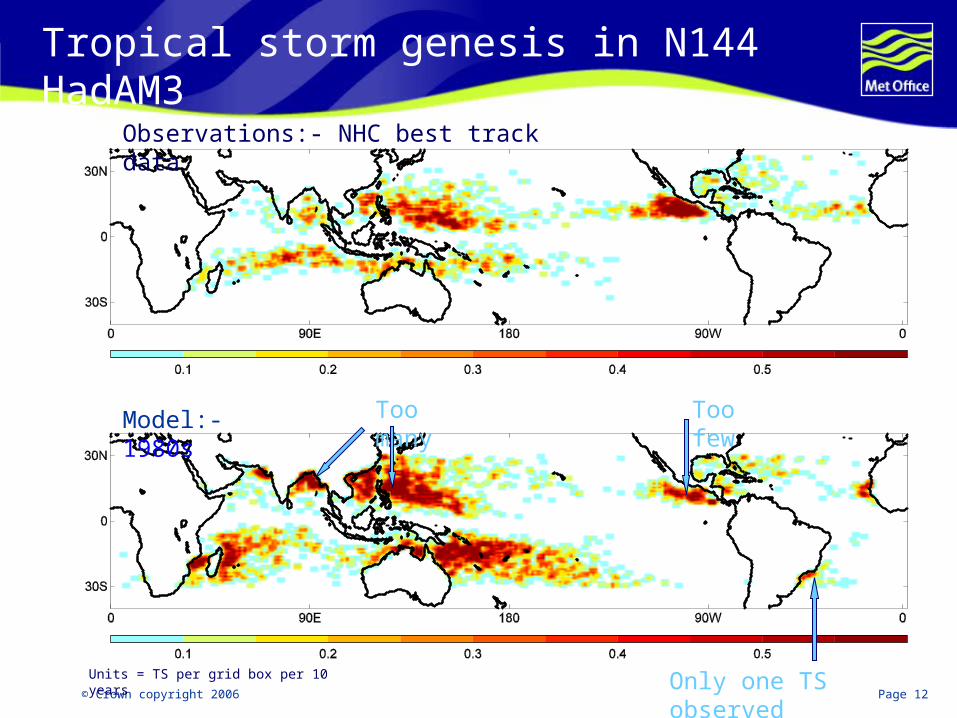
Tropical storm genesis in N144 HadAM3
Units = TS per grid box per 10 years
Observations:- NHC best track data
Model:- 1980s
Only one TS observed
Too many Too few
Page 13
© Crown copyright 2006 Page 13
Forecast skill
Page 14
© Crown copyright 2006 Page 14
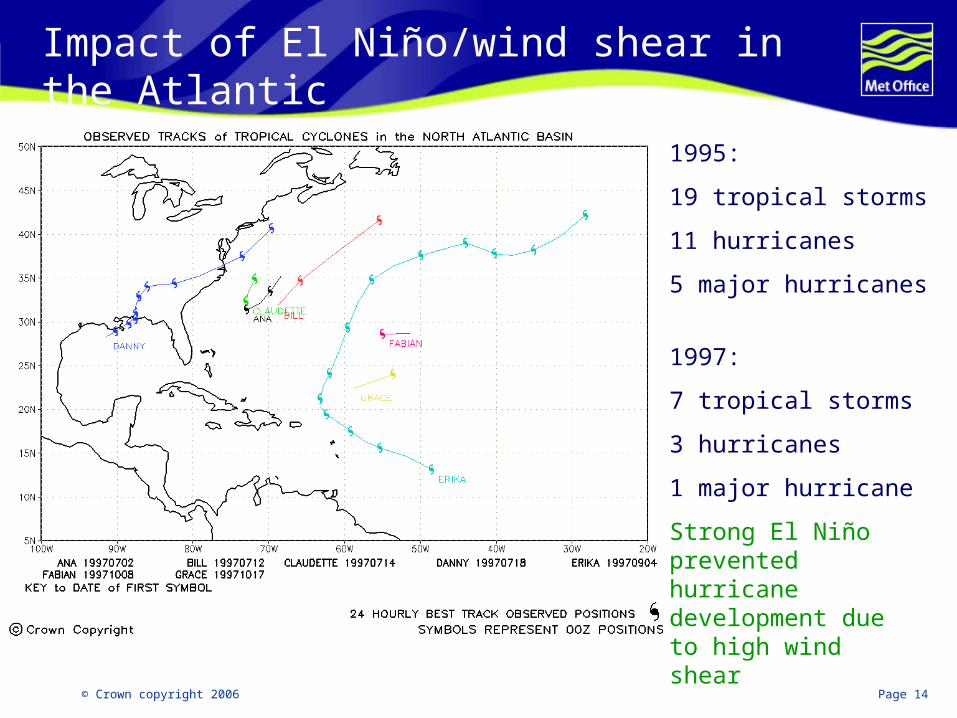
Impact of El Niño/wind shear in the Atlantic
1997:
7 tropical storms
3 hurricanes
1 major hurricane
Strong El Niño prevented hurricane development due to high wind shear
1995:
19 tropical storms
11 hurricanes
5 major hurricanes
Page 15
© Crown copyright 2006 Page 15
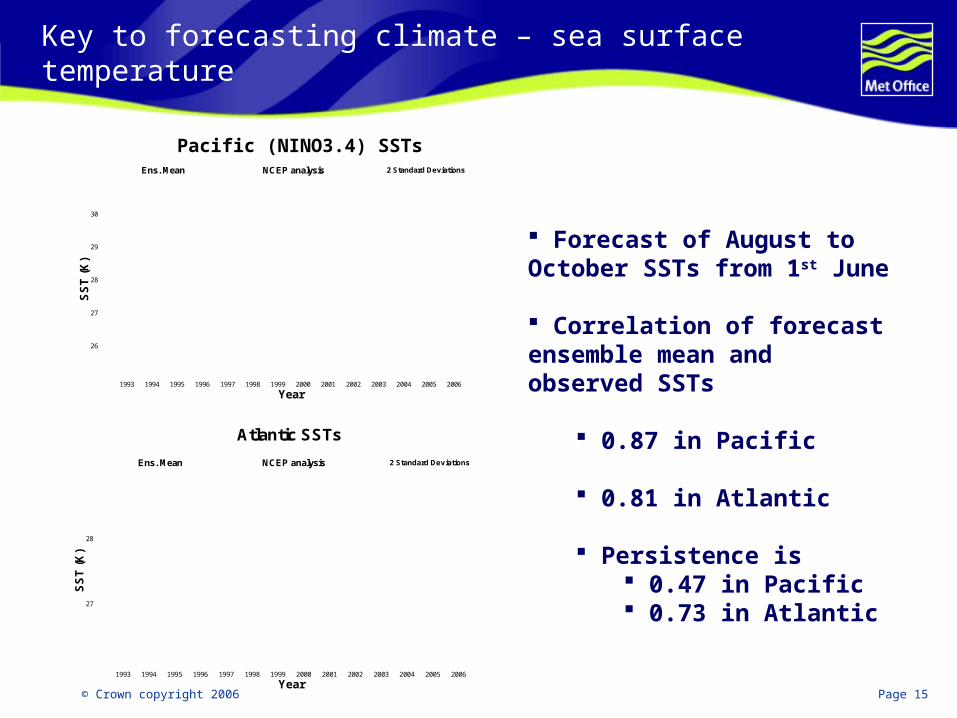
Key to forecasting climate – sea surface temperature
NINO 3.4 SSTs
Atlantic SSTs
1993 1994 1995 1996 1997 1998 1999 2000 2001 2002 2003 2004 2005 2006
Year
26
27
28
29
30
SS
T(K
)
Ens. Mean NCEP analysis 2 Standard Deviations
1993 1994 1995 1996 1997 1998 1999 2000 2001 2002 2003 2004 2005 2006
Year
27
28
SS
T(K
)
Ens. Mean NCEP analysis 2 Standard Deviations
Pacific (NINO3.4) SSTs
Forecast of August to October SSTs from 1st June Correlation of forecast ensemble mean and observed SSTs
0.87 in Pacific
0.81 in Atlantic
Persistence is 0.47 in Pacific 0.73 in Atlantic
Page 16
© Crown copyright 2006 Page 16
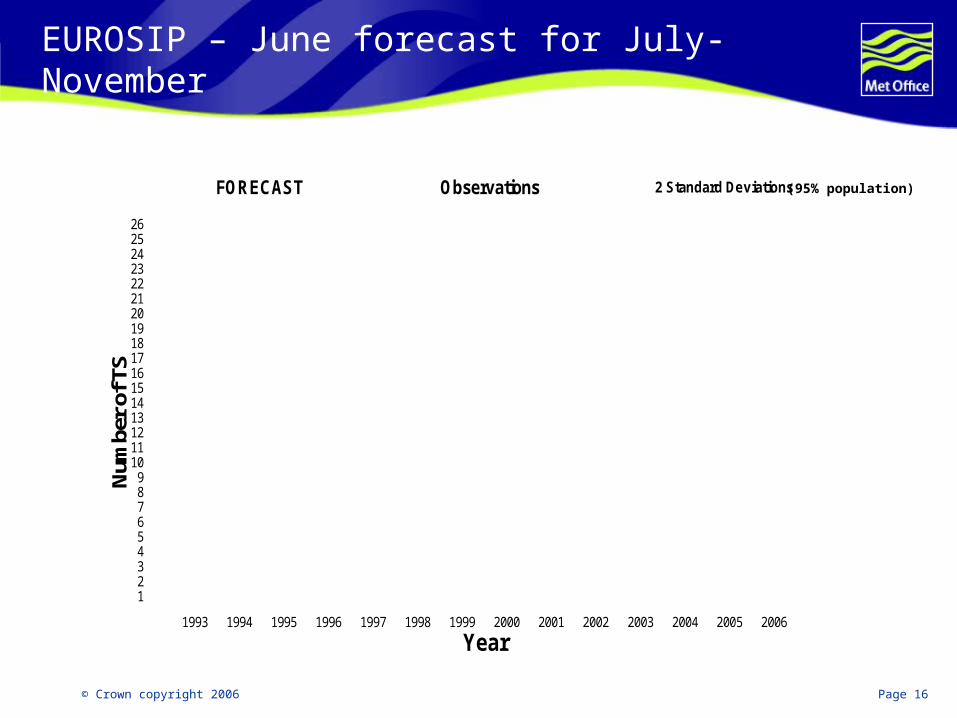
EUROSIP – June forecast for July-November
1993 1994 1995 1996 1997 1998 1999 2000 2001 2002 2003 2004 2005 2006
Year
123456789
1011121314151617181920212223242526
Num
ber
of T
SRMS Error= 3.07( 4.56)Correlation=0.78( 1.00)
FORECAST Observations 2 Standard Deviations (95% population)
Page 17
© Crown copyright 2006 Page 17
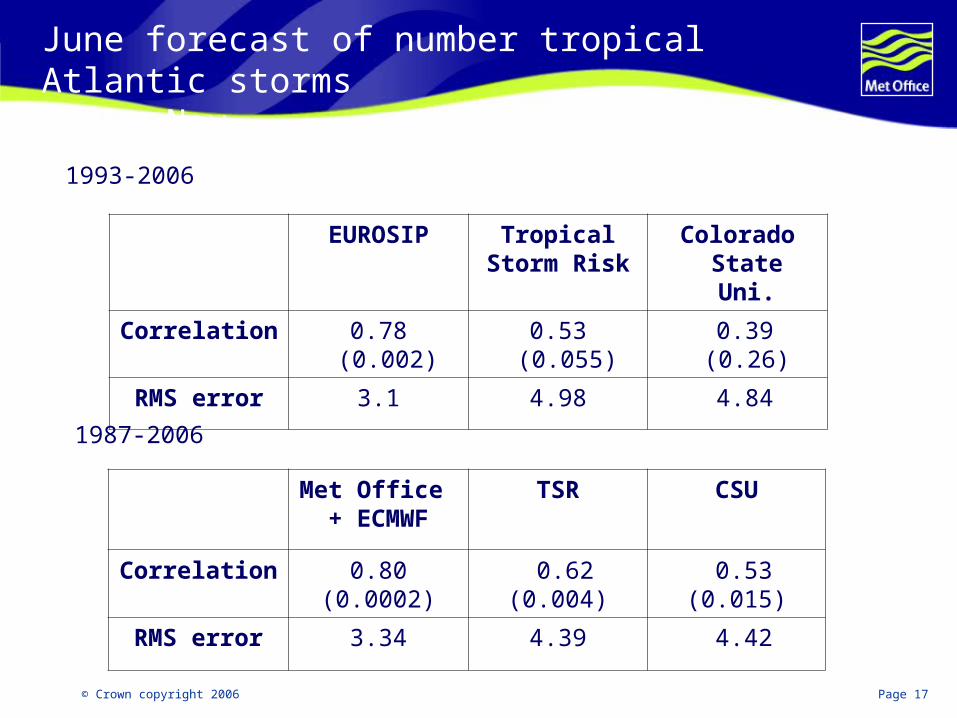
June forecast of number tropical Atlantic storms Jun-Nov
EUROSIP TropicalStorm Risk
Colorado State Uni.
Correlation 0.78 (0.002) 0.53 (0.055) 0.39 (0.26)
RMS error 3.1 4.98 4.84
Met Office + ECMWF
TSR CSU
Correlation 0.80 (0.0002) 0.62 (0.004) 0.53 (0.015)
RMS error 3.34 4.39 4.42
1993-2006
1987-2006
Page 18
© Crown copyright 2006 Page 18
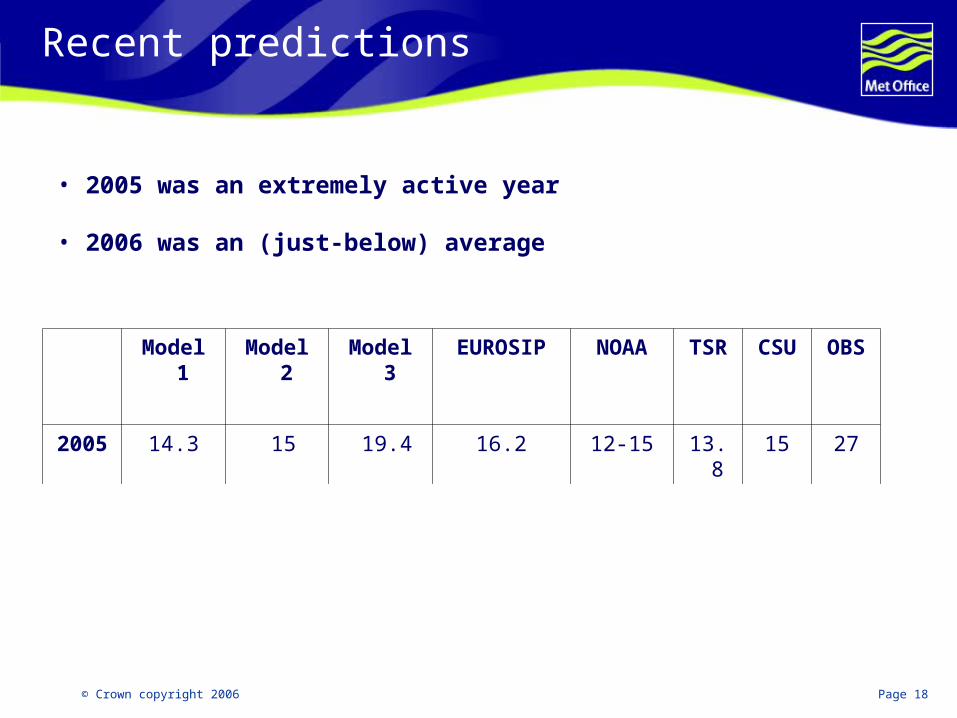
Recent predictions
Model 1 Model 2 Model 3 EUROSIP NOAA TSR CSU OBS
2005 14.3 15 19.4 16.2 12-15 13.8 15 27
2006 10.5 10.7 15.3 12.1 13-16 15.9 17 9
• 2005 was an extremely active year
• 2006 was an (just-below) average
Page 19
© Crown copyright 2006 Page 19
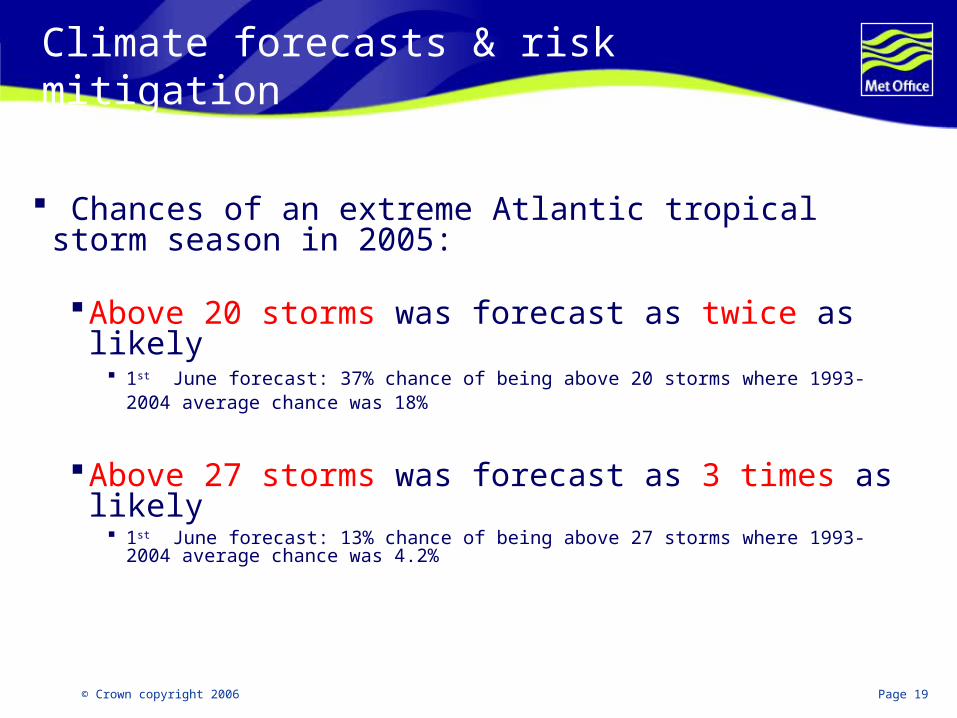
Climate forecasts & risk mitigation
Chances of an extreme Atlantic tropical storm season in 2005:
Above 20 storms was forecast as twice as likely 1st June forecast: 37% chance of being above 20 storms where 1993-2004 average chance
was 18%
Above 27 storms was forecast as 3 times as likely 1st June forecast: 13% chance of being above 27 storms where 1993-2004 average chance
was 4.2%
Page 20
© Crown copyright 2006 Page 20
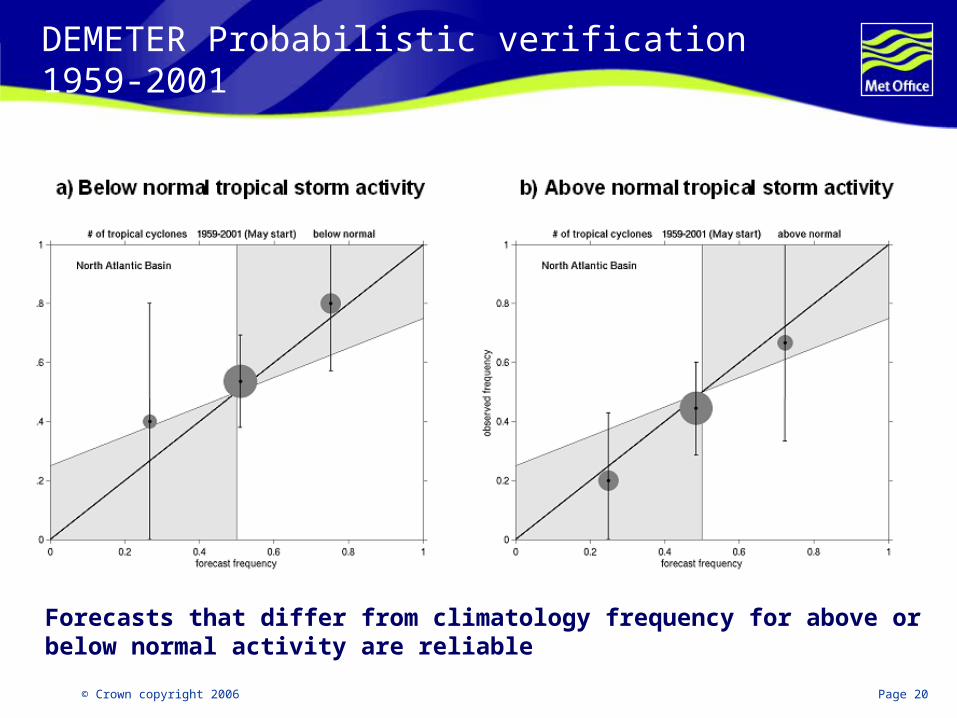
DEMETER Probabilistic verification 1959-2001
Forecasts that differ from climatology frequency for above or below normal activity are reliable
Page 21
© Crown copyright 2006 Page 21
Future potential
Increasing model resolution
Land fall predictions Better representation of hurricane intensity
Statistical techniques could be used now:
Calibrate inter-annual variability of ensemble Calibrate land-falling hurricanes
Assessment in more locations and lead times