Page 1
http://go.warwick.ac.uk/lib-publications
Original citation: Mbogoro, Michael M., Snowden, Michael E., Edwards, Martin A., Peruffo, Massimo and Unwin, Patrick R.. (2011) Intrinsic kinetics of gypsum and calcium sulfate anhydrite dissolution : surface selective studies under hydrodynamic control and the effect of additives. The Journal of Physical Chemistry Part C: Nanomaterials, Interfaces and Hard Matter, Vol.115 (No.20). pp. 10147-10154. ISSN 1932-7447 Permanent WRAP url:
http://wrap.warwick.ac.uk/41546/ Copyright and reuse: The Warwick Research Archive Portal (WRAP) makes the work of researchers of the University of Warwick available open access under the following conditions. Copyright © and all moral rights to the version of the paper presented here belong to the individual author(s) and/or other copyright owners. To the extent reasonable and practicable the material made available in WRAP has been checked for eligibility before being made available. Copies of full items can be used for personal research or study, educational, or not-for-profit purposes without prior permission or charge. Provided that the authors, title and full bibliographic details are credited, a hyperlink and/or URL is given for the original metadata page and the content is not changed in any way. Publisher’s statement: This document is the unedited Author’s version of a Submitted Work that was subsequently accepted for publication in The Journal of Physical Chemistry Part C: Nanomaterials, Interfaces and Hard Matter, © American Chemical Society after peer review. To access the final edited and published work see http://dx.doi.org/10.1021/jp201718b A note on versions: The version presented here may differ from the published version or, version of record, if you wish to cite this item you are advised to consult the publisher’s version. Please see the ‘permanent WRAP url’ above for details on accessing the published version and note that access may require a subscription. For more information, please contact the WRAP Team at: [email protected]
Page 2
1
Intrinsic kinetics of gypsum and calcium sulfate anhydrite dissolution: surface
selective studies under hydrodynamic control and the effect of additives
Michael M. Mbogoro, Michael E. Snowden, Martin A. Edwards, Massimo Peruffo and
Patrick R. Unwin*
Department of Chemistry, University of Warwick, Coventry, CV4 7AL, U.K.
*corresponding author e-mail: [email protected]
Page 3
2
Abstract
The intrinsic dissolution activity of the basal (010) and edge (001) surfaces of gypsum; and
polycrystalline calcium sulfate anhydrite crystals has been investigated, under far from
equilibrium conditions, via the channel flow cell (CFC) method with off-line inductively
coupled plasma-mass spectrometry (ICP-MS) for the measurement of dissolved Ca2+
from the
crystal surface. This approach allows measurements to be made over a wide range of flow
rates, so that the importance of mass transport versus surface kinetics can be elucidated.
Complementary quantitative modeling of the dissolution process was carried out by
formulating convective-diffusive equations which describe mass transport in the CFC, coupled
to a boundary condition for dissolution of the crystal surface. We found that a linear rate law
applied and intrinsic dissolution fluxes were deduced. The following dissolution fluxes, Jo =
kdiss × ceq were measured, where kdiss is the dissolution rate constant and ceq the calcium sulfate
concentration in saturated solution: 5.7 (±1.4) × 10-9
mol cm-2
s-1
for basal plane gypsum and
4.1 (±0.7) × 10-9
mol cm-2
s-1
for calcium sulfate anhydrite. Edge plane gypsum, under the
experimental conditions applied, was found to dissolve at a mass transport-controlled rate. The
effects of l-tartaric acid, d-tartaric acid and sodium trimetaphosphate (STMP) as important
potential additives of the dissolution process of basal plane gypsum were investigated. It was
found that the tartaric acids had little effect but that STMP significantly retarded gypsum
dissolution with Jo = 1.6 (±0.6) × 10-9
mol cm-2
s-1
(5 mM STMP solution). The mode of action
of STMP was further elucidated via etch pit morphology studies.
Page 4
3
1 Introduction
Among the rock forming minerals, gypsum (CaSO4.2H2O) and related calcium sulfate
materials such as the hemi-hydrate (CaSO4.0.5H2O) and anhydrite (CaSO4), are abundant in
nature, with extensive deposits underlying an estimated 25% of the global surface. 1
CaSO4
minerals play an important role in the evolution of karst systems, 2
and in numerous
geochemical phenomena;3, 4
they are also utilized extensively in metallurgical processes, 5
and
in construction and manufacturing. 6, 7
Furthermore, the formation of these minerals causes
significant scaling problems, particularly in petroleum technology. 8, 9
Studies of
dissolution/growth kinetics and mechanisms are pertinent to all these areas in order to develop
knowledge and understanding of natural systems, and to optimize the use of CaSO4 minerals in
technological applications. 10, 11
The dissolution of gypsum has been studied by many techniques, ranging from
macroscopic kinetic measurements on particulate systems, 12
to high resolution microscopic
studies using atomic force microscopy (AFM). 13
A recent review by Colombani
14 sought to
correlate various macroscopic kinetic measurements of gypsum dissolution in order to extract a
unified surface dissolution rate, by estimating the likely mass transport rates associated with
different techniques. An intrinsic surface dissolution rate constant into free solution (maximum
undersaturation at the crystal/solution interface) was deduced to be Jo = 5±2 × 10⁻⁹
mol cm-2
s-1
,
as the intercept of a reciprocal rate – reciprocal mass transport plot. Some confidence in this
assignment comes from the fact that the techniques surveyed included the rotating disc (RD)
method which delivers well-defined mass transport. However, in many cases, the techniques
used previously have been characterized by poorly defined and/or low mass transport
conditions making it difficult to assign surface kinetics from individual studies. Furthermore,
many previous investigations have employed polycrystalline material, so that different crystal
Page 5
4
faces, edges and corners are exposed to solution, which are likely to have different dissolution
characteristics. To further improve our understanding of dissolution kinetics, surface-selective
studies under well-defined mass transport conditions are imperative. Such studies are the focus
of this paper.
Calcium sulfate anhydrite dissolution has also been investigated, but not as extensively as
gypsum. Because the solubility of gypsum is less than that of anhydrite,15
reliable anhydrite
dissolution data may only be obtained under far from equilibrium conditions where the
concentration of dissolved products near the crystal surface, is below the saturation level with
respect to gypsum. 16
Higher surface concentration may lead to precipitation of gypsum on the
surface of the dissolving anhydrite crystal, thereby forming a protective layer which inhibits
further dissolution.2,16
An early rotating disk (RD) study on polycrystalline anhydrite found a
rather high intrinsic dissolution flux of Jo = 2 ±1 ×10⁻⁸
mol cm-2
s-1
.11b
However, subsequent
free drift batch investigations on particulates16
deduced much lower rates, Jo = 5 ±1 ×10⁻⁹
mol
cm-2
s-1
which have been corroborated by other studies.1
A further important aspect of crystal dissolution is the role of additives. This is of
particular relevance for CaSO4 minerals (notably gypsum) used in construction, where
additives are used to passivate dissolution, so as to retard physico-chemical deterioration by
processes such as humid creep, caused by environmental factors such as rain water and
atmospheric pollutants.17
However, in contrast to calcium carbonate minerals, for example,
where the role of additives has been explored extensively,18,19
relatively few gypsum
dissolution studies have considered the influence of additives. Such studies would be valuable
to elucidate the effect of additives on the durability and versatility of CaSO4-based materials, 20,
21 and so a further aspect of this paper is to examine the mode of action of key additives on
gypsum dissolution.
Page 6
5
As highlighted herein, to understand mineral/liquid reaction kinetics, experimental
techniques need to be able to quantitatively separate mass transport and surface kinetic
effects22,23
and ideally allow the study of well-defined surfaces. To this end, the channel flow
cell (CFC) method has proven particularly powerful for studying dissolution processes. 24, 25
This technique typically involves locating the crystal substrate of interest flush in the base wall
of a rectangular duct through which solution flows under laminar conditions. Well-defined flow
allows accurate modeling of mass transport within the flow cell chamber. Furthermore, because
mass transport rates are controllable over a wide range, their influence on dissolution rates can
be elucidated quantitatively.24-26
The CFC method permits rate laws governing a dissolution
reaction to be proposed and tested by comparing experimental data to the predictions from
mass transport-chemical reactivity models.24,25
Hitherto, dissolution in the CFC method has
typically been monitored by the use of local electrochemical measurements24-27
to provide in-
situ detection of the dissolution process. However, some types of electrodes, e.g. Ca2+
ion
selective electrodes, are rather fragile and difficult to deploy in such cells.28
We address this
issue herein using a different approach for Ca2+
analysis.
Most CFC designs comprise of two-part or three-part assemblies typically held together
with nuts and bolts, to produce channels, typically 40 mm in length, 6-10 mm across and 0.2-1
mm high.27
Such cells place some restrictions on sample size and the way in which crystal
materials are presented for study. We have recently introduced a new CFC design and
fabrication procedure using micro-stereo lithography (MSL) to produce radically miniaturized
one-part CFC units. 29
CFC units fashioned in this way eliminate awkward assembly (nuts, bolts
or adhesive sealants) and greatly reduce the cell volume, without compromising mass transport.
Indeed, a much wider range of mass transport rates can be implemented. The MSL-CFC is
assembled by simply placing a CFC unit on the substrate of interest and securing with light
pressure or even a thread!
Page 7
6
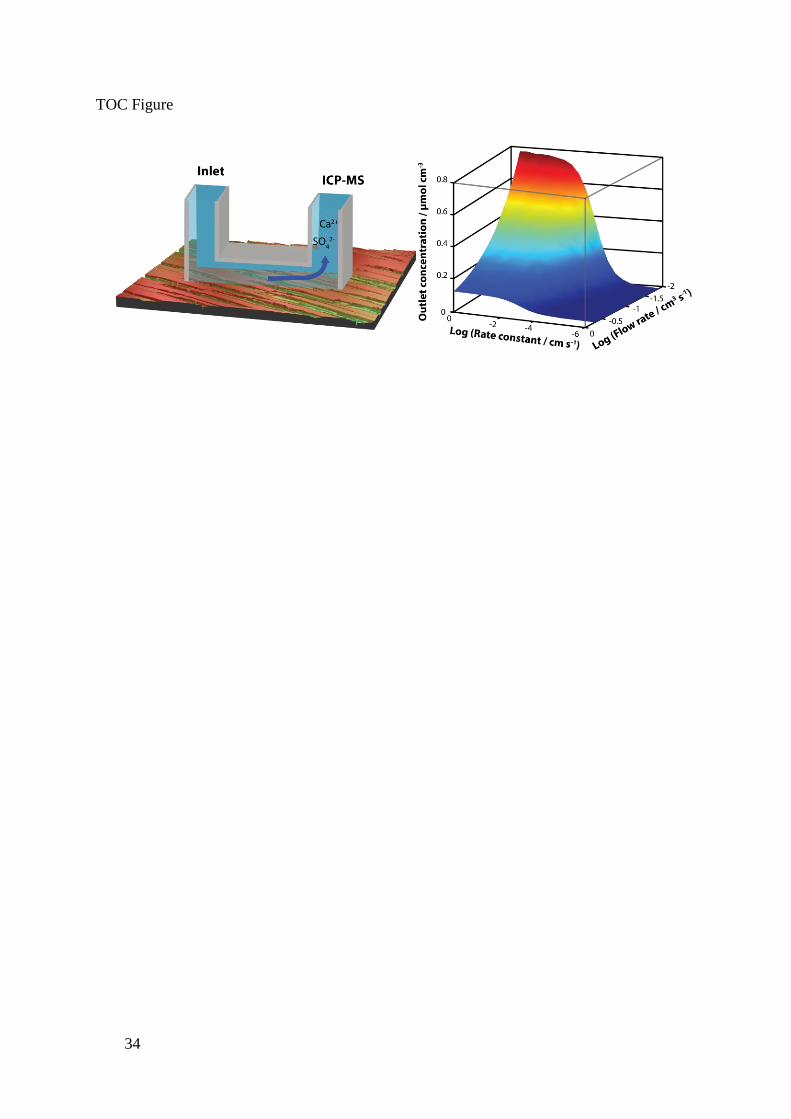
Herein, we couple the CFC technique with off-line inductively coupled-mass spectrometry
(ICP-MS) for the measurement of dissolved Ca2+
from the crystal surface, collected from the
CFC effluent, over a wide range of flow rates. This is effective because of the miniaturized
flow cell unit and short wash-out time of the cell (vide infra). For the purposes of quantitative
modeling, we formulate convective-diffusive equations for mass transport in the CFC, coupled
to a boundary condition for the crystal surface, which describes the dissolution process. In this
way, we are able to predict the outlet Ca2+
concentration for analysis of experimental data.
Using this approach we provide intrinsic rates for the dissolution of the basal cleavage (010)
and edge (001) plane surfaces of gypsum, in order to elucidate any differences in magnitude for
the first time. Furthermore, we elucidate the effect of key additives on dissolution from basal
plane gypsum, in order to identify any kinetic influences and morphological effects. Finally, we
investigate the dissolution of polycrystalline anhydrite, to resolve the discrepancy in kinetics
highlighted above, and to further demonstrate the capability of the methodology.
2 Experimental
2.1 Samples
Natural gypsum single crystal samples (St Gobain Gyproc) were prepared by breaking
large selenite crystals into manageable pieces (~ 5 cm2) and cleaving along the (010) plane with
a sharp razor blade. Careful cleavage on this plane produced clean, fresh surfaces largely
devoid of macro steps. Polycrystalline anhydrite (UKGE Limited) and (001) edge plane
gypsum samples (exposed surface ~ 8 cm2) were embedded in epoxy resin moulds (Delta
Resins Ltd). These samples (anhydrite and edge plane gypsum) were first polished with silicon
carbide 4000 grit paper (Buehler) and further on a pad with 6 µm diamond spray (Kemet Int
Ltd) followed by thorough rinsing in ultrapure H2O. For each experiment, a fresh surface was
Page 8
7
fashioned by polishing the surface of the embedded crystal. Surfaces were etched before studies
(vide infra) to endure a contaminant-free surface.
2.2 Solutions
All solutions were prepared using ultrapure water (Milli-Q Reagent, Millipore) with a
typical resistivity of 18.2 MΩ cm at 25°C. Most experiments were run in ultrapure water, but
some measurements were made in 5 mM solutions of the additives of interest (Figure 1); these
were sodium tri-metaphosphate (STMP), d-tartaric acid and l-tartaric acid (all from Sigma). In
addition, a solution of 0.03 M KNO3 (Sigma) was used as an ionic strength match in some
experiments for comparison to the 5mM STMP solution. Ionic strength and chemical speciation
were calculated using the numerical code MINEQL+ (Environmental Research Software
Version 4.5).30
Table 1 summarizes all additive solutions used, with the input concentrations,
and resulting pH and ionic strength values. The Davies equation was used to calculate the
activity coefficients for each solution.31
The solubility products (Ksp) of gypsum and anhydrite
were 3.14 × 10⁻⁵
and 4.93 × 10⁻⁵
, respectively.15
2.3 Sample preparation and surface roughness determination
An important consideration in dissolution studies is the initial surface morphology or
roughness and how this changes during the course of the reaction. Several studies have
attempted to establish a consensus on an appropriate way to normalize dissolution rates for
studies where the surface area changes. 32
We addressed this issue by initially etching samples
with the expectation (validated, vide infra) that they would maintain a constant specific surface
area during the course of dissolution. Thus, prior to CFC experiments, each sample was etched
in a large volume (> 500 cm3) of ultrapure H2O at 22 ±1 °C in a beaker stirred with a magnetic
flea. After ~30 min, the sample was withdrawn and immediately dried with a strong burst of N2
gas (BOC). By etching the surface before CFC studies, we produced surfaces with a roughness
Page 9
8
factor, λ (specific surface area/geometric area) mostly close to unity, but occasionally several
times larger, depending on the sample (vide infra). An early study by Bruckenstein33
found that
mass transport to a rotating disk electrode (RDE) for a large dynamic range of rotation speeds
was unaffected by values up to 7.5. Since the RDE and the CFC have similar mass transport
rates,26,34
it was reasonable to assume that the sample preparation procedure used would not
significantly perturb mass transport in the CFC. To determine λ for the different etched
substrates, surface area measurements were made using white light interferometry (WLI),
(WYKO NT-2000 Surface Profiler, WYKO Systems) and analyzed via the scanning probe
image processor (SPIPTM
Image Metrology, version 5.1.0).
2.4 Dissolution Procedure
The basic CFC design and fabrication procedure was similar to that described previously,29
but the CFC unit incorporated a mixer section in the outlet to ensure a well-mixed solution for
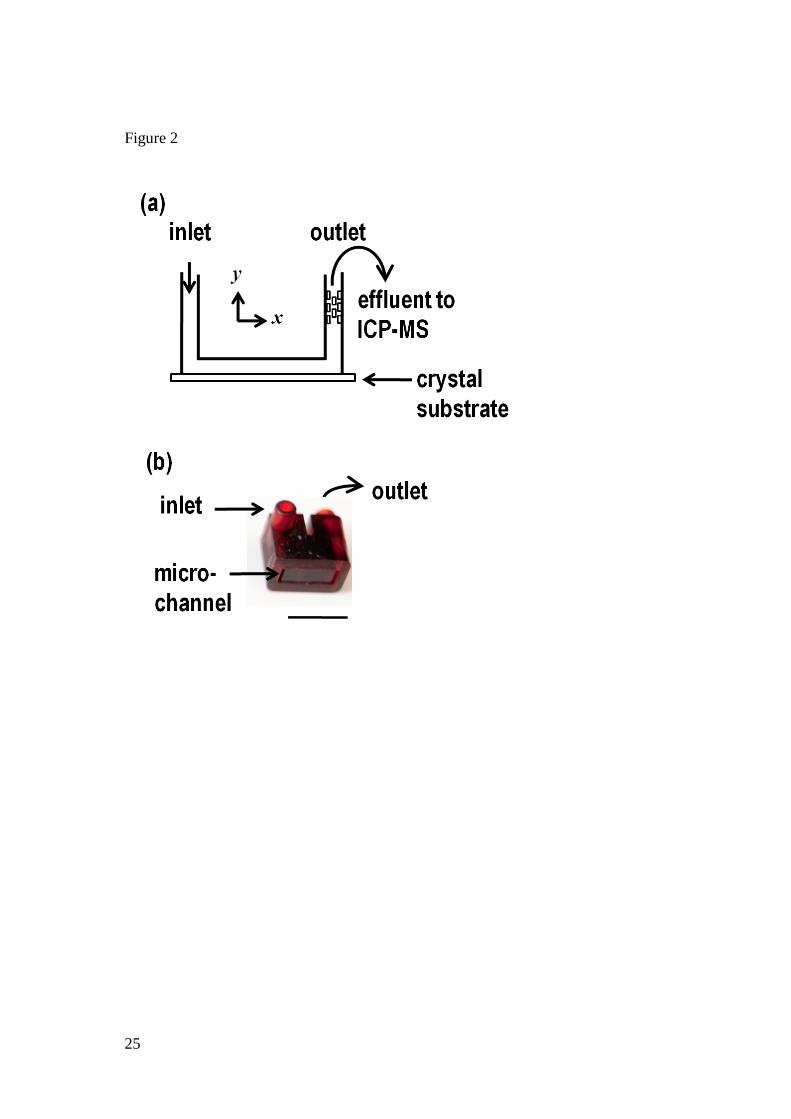
analysis. Figure 2 shows: (a) the CFC unit schematically in cross-section with the mixer in the
outlet; and (b) a photograph of a finished channel unit. The geometric area of the crystal
exposed to solution was determined by the internal channel dimensions: the width, w, was 4
mm and length, l, was 10 mm. The channel height (2h) was determined via WLI to be 210 ±10
µm. The channel was assembled by simply applying light pressure on the channel unit, placed
on the crystal substrate of interest. Inlet and outlet pipes (PVC, 0.318 cm inner diameter and
0.635 cm outer diameter, St Gobain Plastics) were connected directly to the cell by push-fitting
to a syringe pump using Omni-fit adapters (Bio-Chem Fluidics). The syringe pump was from
KD Scientific and was equipped with a 50 ml syringe (BD Plastipak, luer-Lok) with a 22 mm
inner diameter. This was used to drive solution into the assembled cell. Dissolution
experiments took place at flow rates (Vf) in the range 0.008 – 0.167 cm3 s
-1. This corresponds to
a maximum contact time of ~1 s for solution within the part of the channel above the crystal at
Page 10
9
the lowest flow rate. Thus, it was possible to change flow rate and make measurements very
easily over a wide range. All CFC measurements were made at 22 ±1 °C.
Aliquots (5 cm3) of the effluent were collected at intervals for the range of flow rates used.
Trace element analysis of dissolved Ca2+
was carried out on the aliquots via ICP-MS (7500
Agilent), in order to determine the flow-rate dependent outlet concentrations. A Ca standard
(1g/dm3 Fluka, analytical grade) was used to prepare solutions for the calibration curves needed
for the quantification of Ca2+
in each aliquot.
3 Mass Transport and Kinetic Modeling
Numerical simulations were performed on a Dell Intel core™ 2 Quad 2.49 GHz computer
equipped with 8GB of RAM and running Windows XP Professional X64 bit 2003 edition.
Modeling was performed using the commercial finite element modeling package Comsol
Multiphysics 3.5a (Comsol AB, Sweden), using the Matlab interface (Release 2009b)
(MathWorks Inc., Cambridge, UK). Simulations were carried out with >51,000 triangular mesh
elements. Mesh resolution was defined to be finest around the bottom plane of the channel, i.e.
in the vicinity of the surface of the crystal substrate where the concentration gradient was
steepest. Simulations with finer meshes were carried out (not reported) to confirm the mesh
was sufficiently fine to ensure the predicted solutions were accurate (better than 0.01%
variance).
3.1 Theory
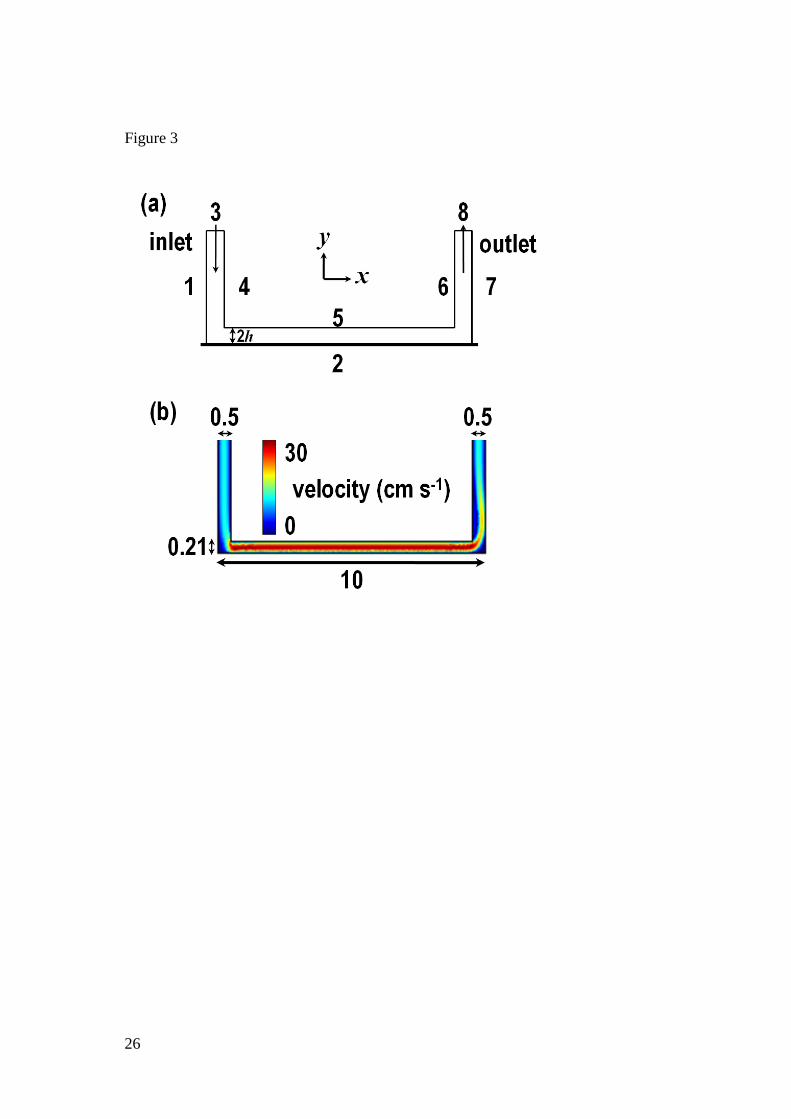
The channel was simulated as a 2D cross-section along the channel length (l) as illustrated
in Figure 3(a). Because w » h, edge effects in the w direction were neglected, to render a 3D
model unnecessary.
Page 11
10
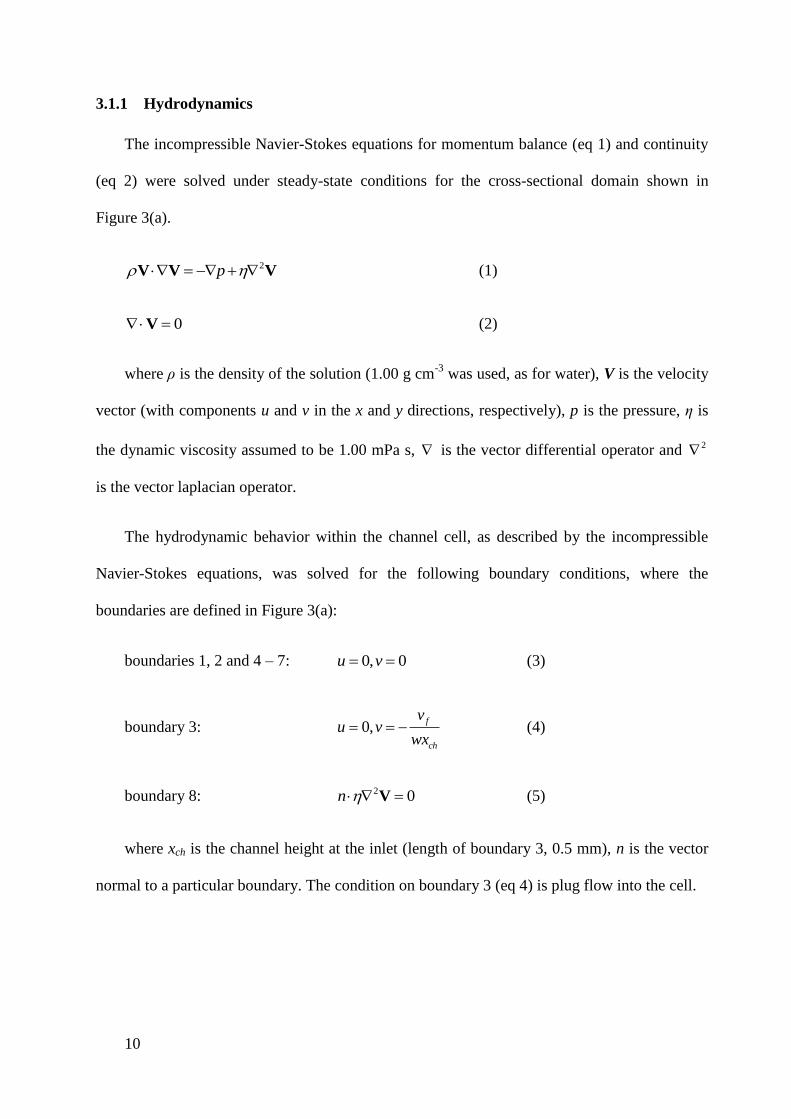
3.1.1 Hydrodynamics
The incompressible Navier-Stokes equations for momentum balance (eq 1) and continuity
(eq 2) were solved under steady-state conditions for the cross-sectional domain shown in
Figure 3(a).
2p V V V (1)
0 V (2)
where ρ is the density of the solution (1.00 g cm-3
was used, as for water), V is the velocity
vector (with components u and v in the x and y directions, respectively), p is the pressure, η is
the dynamic viscosity assumed to be 1.00 mPa s, is the vector differential operator and 2
is the vector laplacian operator.
The hydrodynamic behavior within the channel cell, as described by the incompressible
Navier-Stokes equations, was solved for the following boundary conditions, where the
boundaries are defined in Figure 3(a):
boundaries 1, 2 and 4 – 7: 0, 0u v (3)
boundary 3: 0,f
ch
vu v
wx (4)
boundary 8: 2 0n V (5)
where xch is the channel height at the inlet (length of boundary 3, 0.5 mm), n is the vector
normal to a particular boundary. The condition on boundary 3 (eq 4) is plug flow into the cell.
Page 12
11
3.1.2 Convective-Diffusive Mass Transport
Once the velocity components u and v within the CFC had been determined, the local
velocity vectors were used in the solution of the convective-diffusion equations, to predict the
concentration distribution in the cell, and especially in the region of the outlet. The convective-
diffusion equation was solved under steady-state conditions:
2 0i i iD c c V (6)
where Di is the diffusion coefficient of the species of interest, i, and ci is the concentration
of species i. Since the two dissolving species have similar diffusion coefficients (0.792 × 10⁻⁵
cm2
s-1
and 1.065 × 10⁻⁵
cm2
s-1
for Ca2+
and SO4
2-, respectively, at infinite dilution), the mean
diffusion coefficient was used for the purposes of simulations, thereby facilitating the solution
for one species only. This is appropriate given that the studies were for stoichiometric
dissolution into a medium comprising little or no additional electrolyte. The following
boundary conditions applied to the flow cell:
boundaries 1, 4 – 7: 0 n N (7)
boundary 2: ( )diss eq ik c c n N (8)
boundary 3: 0ic (9)
boundary 8: ( ) 0i iD c n (10)
where n is the vector normal to a particular boundary, N is the outward vector flux of
species, kdiss is a heterogeneous rate constant and ceq is the equilibrium concentration for the
solid/saturated solution, when bulk ionic strength effects due to any added dissolved salts are
taken into account. Herein, we used ceq = 11 mM (gypsum) and 16 mM (calcium sulphate
anhydrite) as calculated by MINEQL+; the gypsum value is close to that deduced from
Page 13
12
experiments.15
For gypsum experiments with 0.03 M added electrolyte ceq = 14 mM was used.
Mass transport across boundary 8 is due to convection only. Because the dissolution fluxes for
most of the systems of interest were relatively low, we did not model any spatial variations in
ionic strength as these effects would be relatively minor. For simplicity, we chose a first order
rate law (eq 8): this has been used previously for gypsum and related materials 12a, 18c, 35
and,
further, was reasonable because the reaction was generally very far from equilibrium under the
conditions of the experiments.
4 Results and Discussion
4.1 Insights from simulations
The finite element simulations provide information on the processes occurring in the cell.
In particular, the approach described yields: (i) the hydrodynamic behavior within the CFC
chamber, from which velocity profiles, in regions of interest, can be extracted; (ii)
concentration profiles of dissolved species within the cell which informs on the kinetic/mass
transport regime; and (iii) the flow rate-dependent outlet concentration which is the variable
used to analyze experimental data. We use the simulations to highlight briefly some of the main
features of the techniques for the case of gypsum (ceq = 11 mM). Figure 3(b) shows a typical
example of the velocity profile of solution in the flow cell (2h = 0.21 mm) at Vf = 0.1649 cm3 s
-
1. A steady laminar Poiseulle profile is established and maintained along the channel length,
after a short lead-in length.
Figure 4 shows: (a) a typical concentration profile in the CFC for Vf = 0.0083 cm3 s
-1 and
kdiss = 1 × 10⁻³
cm s-1
and (b) plots of the concentration of the dissolved species at the
crystal/solution interface along the length of the channel for Vf = 0.0083 cm3 s
-1 and 0.1649 cm
3
s-1
, which correspond to the lower and higher Vf limits of those used herein. The kdiss value is
typical of that found in the experimental studies (vide infra). A consequence of the high mass
Page 14
13
transport rates that can be generated in the channel is that the concentration boundary layer
above the dissolving substrate is relatively thin, allowing fast surface kinetics to be
investigated. This is evident from Figure 4(b) which shows that the interfacial concentration is
considerably lower than the equilibrium value at the extreme limits of typical flow rates,
indicating substantial surface kinetic control of the reaction for these parameters. The non-
uniform concentration profiles along the channel length are a consequence of the non-uniform
accessibility of the channel system 36
between 0.5 and 9.5 mm, coupled with stagnation zones
which develop at the chamber edges. This leads to higher interfacial concentration values
between 0 – 0.5 mm (upstream portion of the crystal) and 9.5 – 10 mm (downstream portion).
However, these stagnation zones make a very minor contribution to the total surface flux from
the entire exposed crystal.
Figure 5 shows 3D plots of the outlet concentration (a) and average surface flux (b) as a
function of the kinetic constant, kdiss, and flow rate, Vf. For any particular flow rate, an increase
in kdiss results in an increase in the surface flux and outlet concentration, as a consequence of
increasing generation of dissolution products from the crystal surface up to a maximum (kdiss-
independent value) where the reaction becomes transport-controlled. In addition, it can be seen
that for any rate constant, the highest outlet concentration is predicted at low flow rates,
essentially because the duration of interaction between the crystal surface and solution in the
cell is then longer, thereby allowing dissolution products to accumulate more readily in the
solution. In the regime kdiss > 0.1 cm s-1
, for the range of Vf shown, the reaction becomes
transport-limited. Below this value, surface kinetic determination is possible.
Page 15
14
4.2 Dissolution kinetics
4.2.1 Surface analysis
WLI measurements were made to determine the surface topography of the crystal surfaces
before and after CFC studies, with the aim of determining the specific surface area of the
crystal surface exposed to the solution. This was primarily to confirm that the surface area was
constant over the duration of a CFC experiment and to determine the roughness factor (λ) with
which flux values predicted by simulations could be normalized to allow comparison between
different materials and to obtain intrinsic dissolution rates.
Figure 6 depicts typical differential interference contrast (DIC) micrograph of the basal
plane gypsum surface after etching in ultrapure H20, for: (a) 90 s, (b) 10 min, (c) 30 min; and
(d) a WLI micrograph after a 30 min etch. The micrographs clearly show an alteration in
surface topography, from early times in the dissolution process (Figure 6(a)), where small etch
features are isolated on the (010) cleavage surface. With time, these features grow and achieve
complete coalescence by ~ 30 min (Figure 6(c)) and the surface topology and roughness (λ)
essentially remains similar for times thereafter. λ was found to be in the range of 1.1-1.2, 1.9-
3.3 and 1.6-4.4 for (010) gypsum, edge plane gypsum and anhydrite, respectively. The highest
λ value (roughest sample used for experiments) yielded an rms roughness value of 4.5 µm
constituting 2.3 % of the channel height (2h) which was considered unlikely to disrupt the
cell hydrodynamics described above, as evidenced by the fact that electrodes deployed in
channel cells are only slightly smoother than this and conform well to predictions for a smooth
surface. 24-26, 29
In addition, λ values for each sample were within ±10% when examined before
and after CFC studies.
Page 16
15
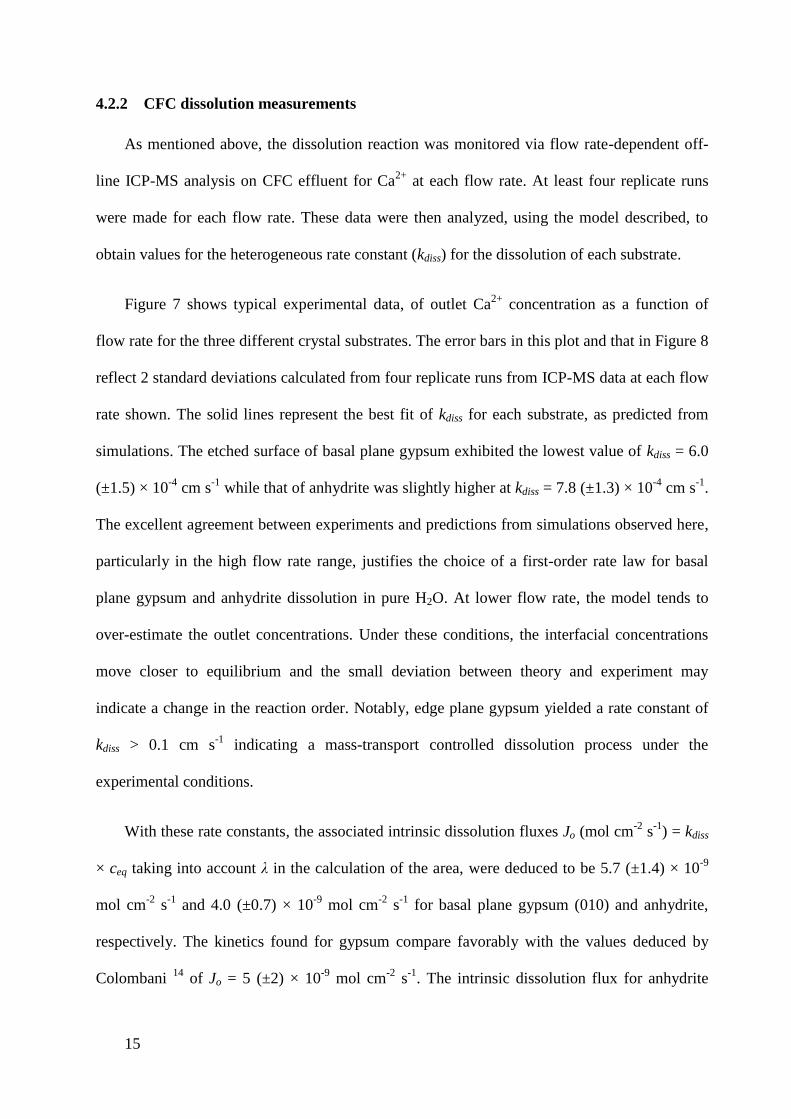
4.2.2 CFC dissolution measurements
As mentioned above, the dissolution reaction was monitored via flow rate-dependent off-
line ICP-MS analysis on CFC effluent for Ca2+
at each flow rate. At least four replicate runs
were made for each flow rate. These data were then analyzed, using the model described, to
obtain values for the heterogeneous rate constant (kdiss) for the dissolution of each substrate.
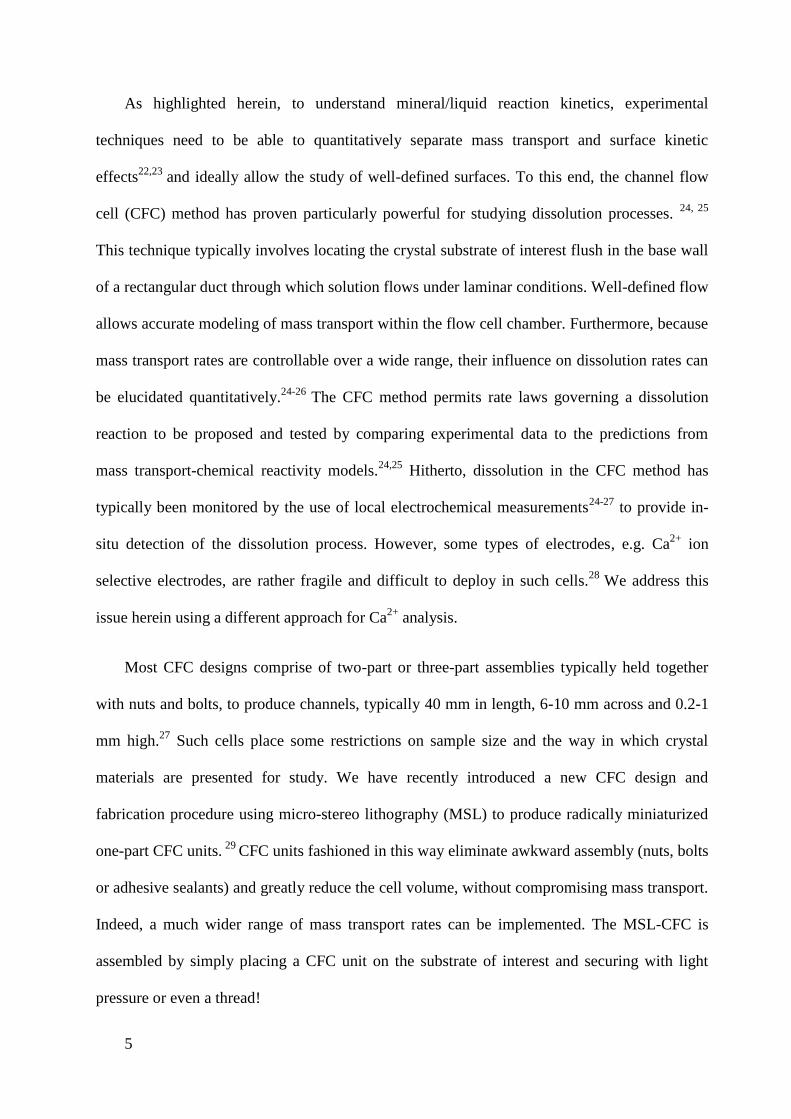
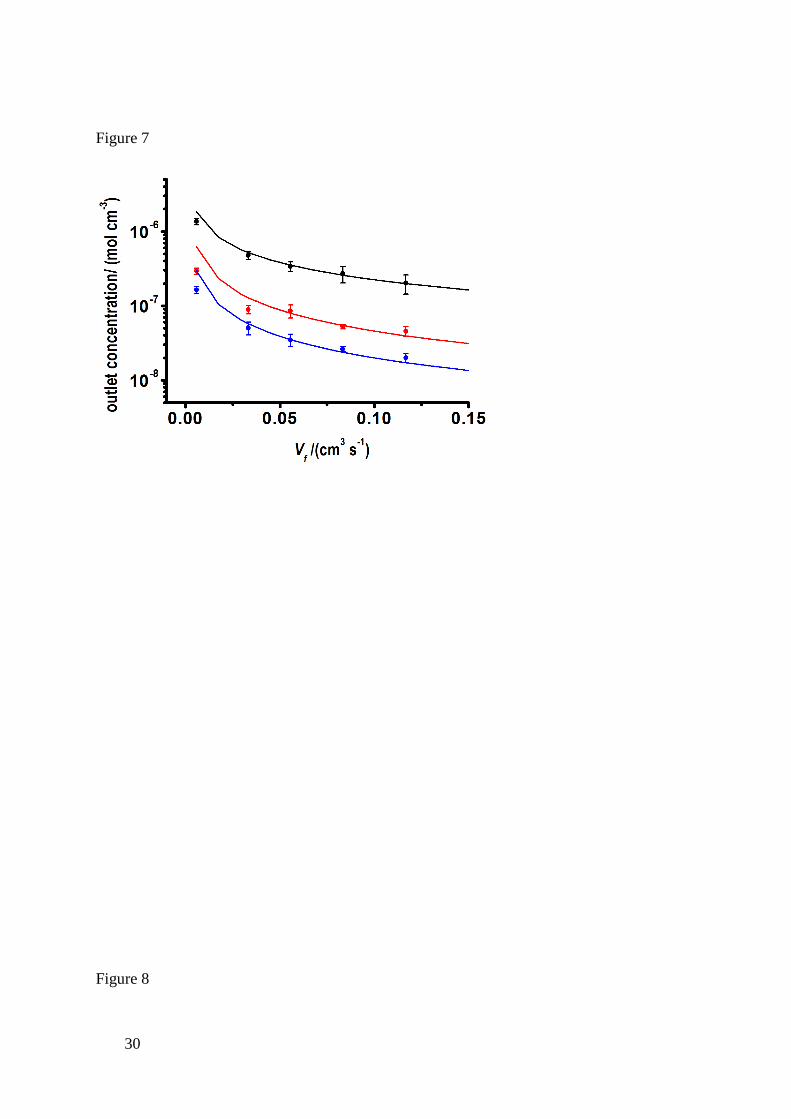
Figure 7 shows typical experimental data, of outlet Ca2+
concentration as a function of
flow rate for the three different crystal substrates. The error bars in this plot and that in Figure 8
reflect 2 standard deviations calculated from four replicate runs from ICP-MS data at each flow
rate shown. The solid lines represent the best fit of kdiss for each substrate, as predicted from
simulations. The etched surface of basal plane gypsum exhibited the lowest value of kdiss = 6.0
(±1.5) × 10-4
cm s-1
while that of anhydrite was slightly higher at kdiss = 7.8 (±1.3) × 10-4
cm s-1
.
The excellent agreement between experiments and predictions from simulations observed here,
particularly in the high flow rate range, justifies the choice of a first-order rate law for basal
plane gypsum and anhydrite dissolution in pure H2O. At lower flow rate, the model tends to
over-estimate the outlet concentrations. Under these conditions, the interfacial concentrations
move closer to equilibrium and the small deviation between theory and experiment may
indicate a change in the reaction order. Notably, edge plane gypsum yielded a rate constant of
kdiss > 0.1 cm s-1
indicating a mass-transport controlled dissolution process under the
experimental conditions.
With these rate constants, the associated intrinsic dissolution fluxes Jo (mol cm-2
s-1
) = kdiss
× ceq taking into account λ in the calculation of the area, were deduced to be 5.7 (±1.4) × 10-9
mol cm-2
s-1
and 4.0 (±0.7) × 10-9
mol cm-2
s-1
for basal plane gypsum (010) and anhydrite,
respectively. The kinetics found for gypsum compare favorably with the values deduced by
Colombani 14
of Jo = 5 (±2) × 10-9
mol cm-2
s-1
. The intrinsic dissolution flux for anhydrite
Page 17
16
crystal compares well with recent values from Jeschke and Dreybrodt who obtained Jo = 5 (±1)
× 10-9
mol cm-2
s-1
. 16
However, these values are much smaller than the value of Jo = 2 ±1 ×10⁻⁸
mol cm-2
s-1
deduced from anhydrite polycrystalline pellets.12b
It is important to point out that
we have analyzed natural polycrystalline anhydrite samples which have been deposited over
geological time scales such that the crystalline deposits are compacted to an extent that porosity
is negligible. In contrast, anhydrite pellets such as those used in some previous studies12b
are
typically formed by dehydrating gypsum pellets, a process which exposes the sample to thermal
shock, possibly further weakening sample structure. This typically results in samples with high
specific surface areas which would naturally produce higher dissolution fluxes defined in terms
of the geometric area of the sample.
It is further important to note that, with the CFC method, we eliminate the possibility of
surface concentrations (from generation of dissolution products) approaching the gypsum
saturation point, by probing anhydrite dissolution under far from equilibrium conditions via the
high rates of mass transport that can be generated.
4.2.3 Effect of additives
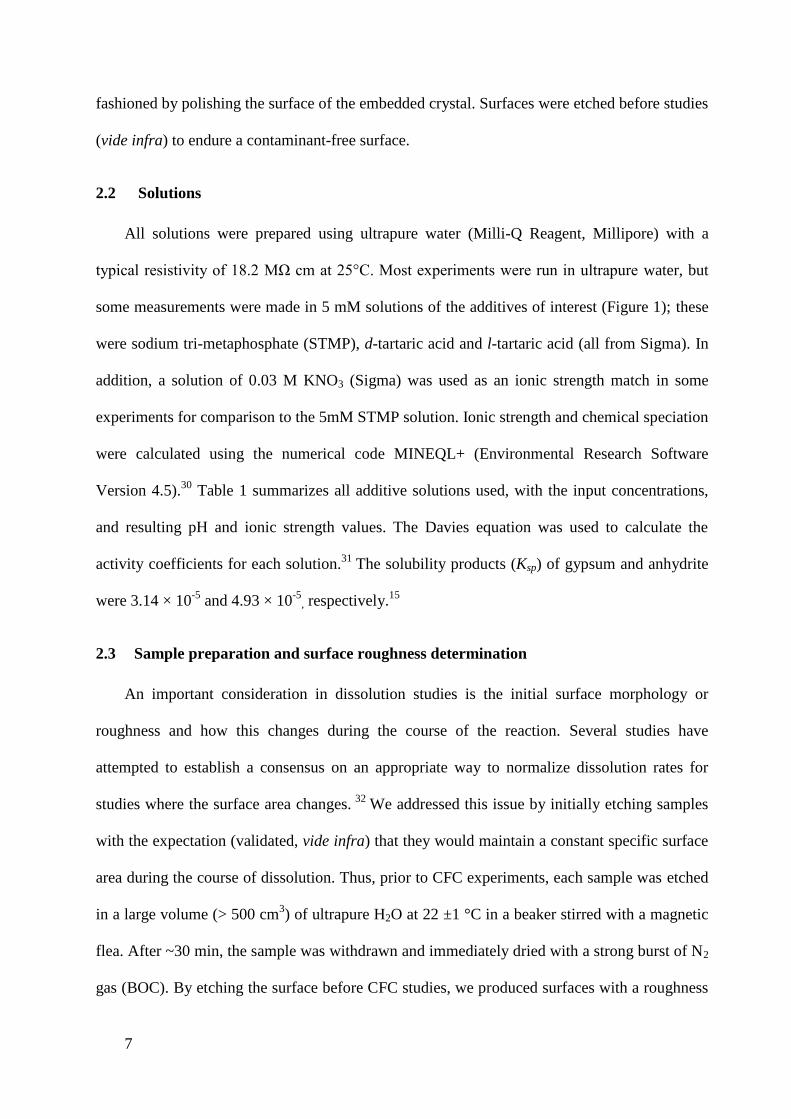
We next consider the influence of key additives on gypsum dissolution. Figure 8 shows
plots of outlet concentration as a function of flow rate for etched basal plane gypsum in the
presence of STMP, l-tartaric acid and d-tartaric acid, with H2O also shown. These additives
were chosen because of their extensive use as inhibitors of humid creep, in the production of
CaSO4 based materials.20,21
In each case, there is good agreement between the experimental
data and the first-order model proposed (which takes into account the ionic strengths of the
different solutions in calculating ceq, Table 1). Rate constants for dissolution in the presence of
d-tartaric and l-tartaric acids were found to be similar (within experimental error) and close to
that for pure H2O, with kdiss = 7.3 (±2.0) × 10-4
cm s-1
, which shows that d- and l-tartaric acid
Page 18
17
have relatively little effect on gypsum dissolution under the experimental conditions. However,
in the presence of STMP, the rate constant was much lower, kdiss = 1.3 (±0.5) × 10-4
cm s-1
,
indicating a significant retardation of the dissolution process.
To elucidate and explain the mode of action of STMP on the process of gypsum
dissolution, we carried out etch pits studies for dissolution in quiescent solution for a period of
20 min. By careful cleaving along the (010) gypsum plane, mirror surfaces were produced. One
half, was etched in STMP while the other was etched in ultrapure H2O. There is almost
complete dissociation of STMP, yielding a solution ionic strength ca. 0.03 M. In order to
investigate ionic strength effects, etching was also carried out in 0.03 M KNO3.
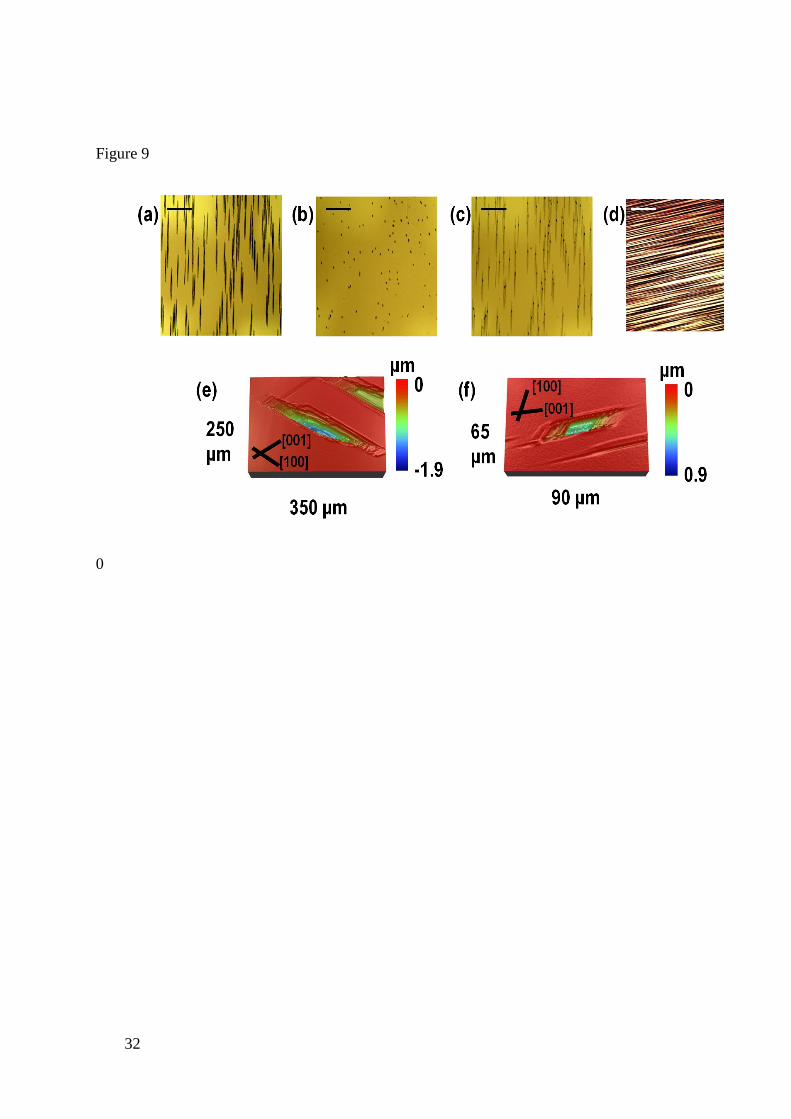
Figure 9 shows DIC micrographs of the resulting etch pits, where (a) is the surface after etching
in H2O, (b) the mirror surface when etched in STMP, (c) superimposition of (a) and (b), and (d)
a gypsum surface after etching in KNO3. When the two microstructures in (a) and (b) are
superimposed (c), it is clear that there is exact correspondence between the positions of etch
pits, and therefore, both pit types emerge from the same defect sites which presumably run
through the crystal. Notably, however, there is a drastic difference in the pit sizes, with STMP
retarding dissolution compared to water. This effect is even more striking when one considers
that the higher ionic strength of the STMP solution would be expected to promote dissolution if
it simple acted as an inert salt, as evidenced by the KNO3 data [Figure 9(d)].
Figure 9 also shows isolated pits that result from etching in water (e) and STMP (f). In the
case of H2O, the pits are irregular hexagons with two parallel edges aligned along the [001] and
[100] directions and one poorly defined edge (Figure 9(e)); see Figure 10 for the gypsum unit
cell. The pits were found to exhibit typical dimensions of 350 ±30 µm, 62 ±14 µm and 1.9 ±0.5
µm in [001], [100] and [010] directions, respectively, after etching for 20 min. In contrast,
etching in the presence of STMP produced pits with the shape of a parallelogram, laterally
Page 19
18
embracing the [001] and [100] directions only (Figure 9(f)). The etch pits were also relatively
small compared to those produced when etching in pure water, with typical dimensions of 90
±10 µm, 36 ±6 µm and 1.4 ±0.5 µm in [001], [100] and [010] directions, respectively. The
elongated etch pit morphologies indicate preferential dissolution in the [001] direction relative
to the [100] etching in pure H2O. Indeed much faster dissolution along the [001] direction
relative to the [100] direction may be responsible for the development of the irregular pit edge
(Figure 9(e)). In the presence of STMP, dissolution in [001] and [100] directions were retarded
to different extents so that the rates became closer in magnitude resulting in the parallelogram
pit shape observed. Since STMP dissociates to P3O93-
, 37
under the experimental conditions, it is
likely that STMP will have a binding affinity with surface calcium ion sites, inhibiting
dissolution. The anion has a chair configuration with the phosphate groups facing outwards
from the ring (Figure 1), giving it the capacity to adsorb onto several positively charged sites
on the crystal surface and form surface complexes.38,39
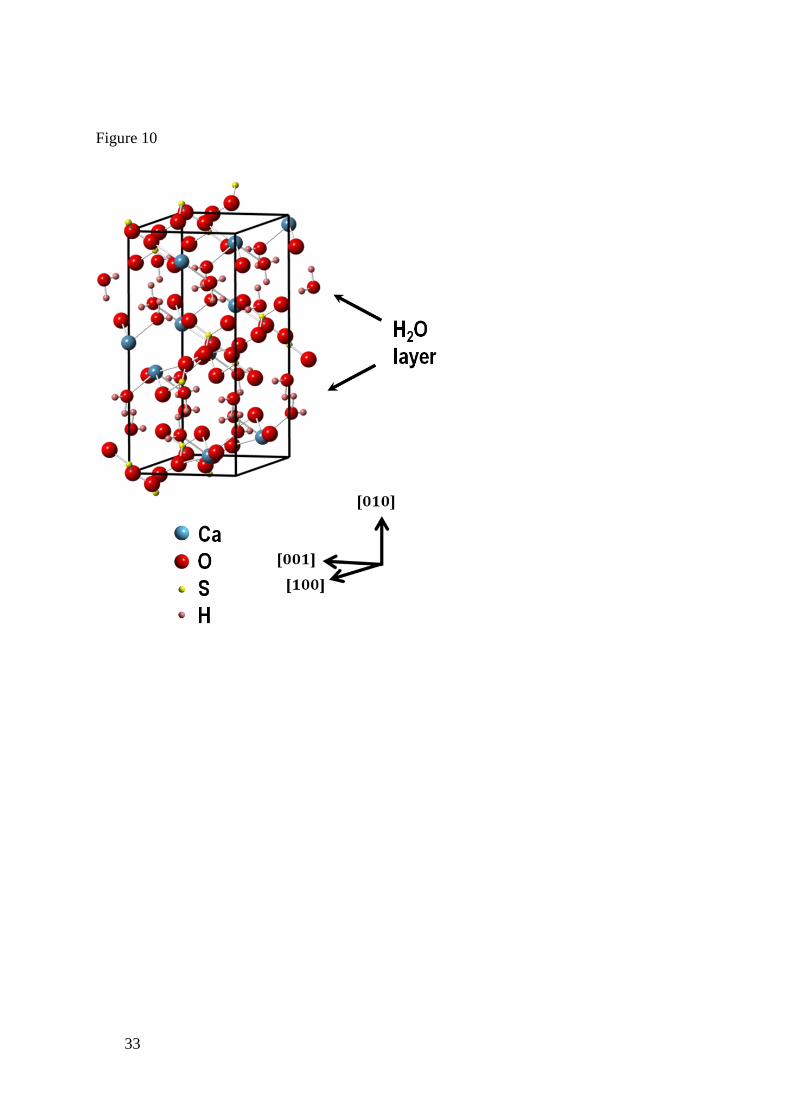
For both etchants (H2O and STMP), dissolution in the [010] direction (etch pit depth) was
much slower than in the other directions analyzed. However, the values obtained with and
without STMP were similar, indicating little effect of STMP on dissolution in this direction.
Dissolution in the [010] direction involves periodic removal of the water layer interspaced
between CaSO4 bilayers in the gypsum crystal. The fact that STMP has little influence suggests
that detachment of the water layer may be rate-limiting in this direction.
5 Conclusions
The dissolution kinetics of gypsum and anhydrite have been obtained and analyzed via the
CFC method, coupled with off-line ICP-MS for the measurement of dissolved Ca2+
from the
crystal surface. For the first time, it has been possible to distinguish between the dissolution
Page 20
19
kinetics for the basal (010) and edge plane (001) surfaces of gypsum: radically different
dissolution characteristics have been observed. The basal surface exhibited an intrinsic flux, Jo
= 5.7 (±1.4) × 10-9
mol cm-2
s-1
into pure water (kdiss = 6.0 (±1.5) × 10-4
cm s-1
), whereas the
edge plane exhibited high rate constant values, kdiss > 0.1 cm s-1
indicating a transport-controlled
process under the experimental conditions applied. Anhydrite crystals, exhibited fluxes of Jo =
4.0 (±0.7) × 10-9
mol cm-2
s-1
into pure water (kdiss = 7.8 (±1.3) × 10-4
cm s-1
).
The effect of additives on dissolution of the basal gypsum surface considered molecules
which have been used industrially as inhibitors of humid creep in CaSO4-based building
materials. It was observed that tartaric acid (d- and l-) had little influence on dissolution
kinetics with rates similar to those observed when dissolution was carried out in pure water. In
the presence of STMP, dissolution rates were much lower, Jo = 1.6 (±0.6) × 10-9
mol cm-2
s-1
(kdiss = 1.3 (±0.5) × 10-4
cm s-1
), despite the high ionic strength associated with the additive
which would be expected to promote dissolution (salting-in). Etching studies revealed that
STMP significantly inhibits gypsum dissolution across the basal surface, but has a lower
inhibitory effect in the [010] direction (normal to the basal surface). The mode of action is
likely to involve surface complexation of SMTP anions on the crystal surface. The lack of any
significant effect in the [010] tentatively suggests that the loss of the water layer may be the
rate limiting process in this direction for which STMP would have little influence.
The studies herein illustrate how the CFC method is particularly powerful in elucidating
surface kinetics and the role of mass transport in the interfacial processes. The methodology is
flexible and allows the study of particular crystal faces and the introduction of inhibitors. When
coupled with simple etching methods, one can obtain a good level of information on kinetics,
mechanisms and the mode of action of inhibitors on dissolution.
Page 21
20
Acknowledgements
This work was supported by St Gobain Gyproc (funding for M. M. M.) and the European
Research Council (funding for P.R.U. M.P. and M.E.S.) to whom we are grateful. We thank
Maxim Joseph for assistance with micro-stereo lithography of the flow cells, and P. Aston and
Dr L. Jong for assistance with ICP-MS. We also thank I. Wilkes and H. Jaffel at St Gobain
Gyproc for helpful discussions. The light microscopy and ICP-MS equipment used in this
research was obtained through Birmingham Science City with support from Advantage West
Midlands and the European Regional Development Fund.
Page 22
21
Tables
Table 1. Additives used for CFC dissolution studies on basal plane gypsum crystal
Page 23
22
Figure captions
Figure 1. Molecular structures of the additives used for some of the dissolution studies.
Figure 2. Illustration of (a) the two dimensional cross-section of the flow cell (not to scale),
highlighting the crystal substrate which forms the base of the channel and the mixer in the
outlet, and (b) a photograph of a finished CFC unit where the scale bar is 10 mm.
Figure 3. 2D representation of (a) the channel geometry used for finite element modeling
simulations where the numbers represent the boundaries (edges) used in simulations (not to
scale) and (b) the velocity profile of solution within the flow cell for the case of Vf = 0.1649
cm3 s
-1. The cell dimensions in (b) are in mm and were used throughout.
Figure 4. Illustration of (a) the CFC cross-section depicting the concentration for Vf = 0.0083
cm3 s
-1 and kdiss= 1 × 10
-3 cm s
-1 where dimensions are in mm, and (b) the corresponding
interfacial concentration along the length of the channel for Vf = 0.0083 cm3 s
-1 (black) and Vf =
0.1649 cm3 s
-1 (red), with an applied rate constant kdiss= 1 × 10
-3 cm s
-1 in each case. For
comparison, the saturated solution concentration is shown (blue).
Figure 5. (a) Simulated outlet concentrations and (b) mean surface flux, Js, as a function of kdiss
and Vf. The channel cell was characterized by the parameters shown in Figure 3(b).
Figure 6. Typical DIC micrographs (scale bars 100 µm) of the (010) cleaved gypsum surface
after etching in pure H2O for (a) 90 s, (b) 10 min, (c) 30 min, and (d) the corresponding WLI
micrograph after a 30 min etch, where the scale bar is 30 µm.
Figure 7. Cell outlet concentration as a function of flow rate for the dissolution of etched basal
plane gypsum (red), edge plane gypsum (black) and anhydrite (blue) The solid line correspond
to the best fits to the model with rate constant, kdiss (cm s-1
) of 6.0 (±1.5) × 10-4
cm s-1
, > 0.1 cm
Page 24
23
s-1
and 7.8 (±1.3) × 10-4
cm s-1
, for basal plane gypsum, edge plane gypsum (ceq = 11 mM for
gypsum) and anhydrite (ceq = 16 mM) respectively. The simulation used other parameters
stated in the text.
Figure 8. Outlet concentration as a function of flow rate for dissolution of the etched basal
plane of gypsum in 5 mM solutions of l-tartaric acid (blue points), d-tartaric acid (green
points), and STMP (black) and in pure H2O (red). The solid lines correspond to the best fit rate
constant, kdiss (cm s-1
) predicted by simulations with values of 6.0 (±1.5) × 10-4
cm s-1
and 1.3
(±0.5) × 10-4
cm s-1
for pure H2O and STMP, respectively, while l-tartaric and d-tartaric acids
exhibit a similar rate constant of 7.3(±2.0) × 10-4
cm s-1
(blue solid line).
Figure 9. DIC micrographs of the (010) surface of gypsum (matched halves) after a 20 min etch
in (a) H2O and (b) 5 mM STMP. The two surfaces (a and b) are superimposed in (c) to show
correspondence of etch pits on the surfaces. A cleaved gypsum surface etched for 20 min in
0.03 M KNO3 is shown in (d) for comparison. The scale bars are 300 μm. WLI micrographs of
pit morphology after etching for 20 min in (e) H2O and (f) 5 mM STMP are also shown. The
main crystallographic directions with respect to the etch pits formed on the (010) surface are
indicated and the [010] direction normal to the surface.
Figure 10. Gypsum unit cell with the main crystallographic directions indicated. Note the H2O
layer interspaced between CaSO4 bilayers.
Page 31
30
Figure 7
Figure 8
Page 36
35
References
1 Ford, D. C; William, P. W. Karst Geomorphology and Hydrology; West Sussex: John Wiley
& Sons, 2007.
2 Klimchouk, A.; Lowe, D.; Cooper, A.; Sauro, U. (Eds.) 1996. Int. J. Speleol. 25.
3 Bosbach, D.; Junta-Rosso J. L.; Becker, U.; Hochella Jr, M. F. Geochim. Cosmochim. Acta
1996, 60, 3295.
4 James, A.N. Soluble Materials in Civil Engineering; Chichester: Ellis Horwood, 1992.
5 Van Rosmalen, G. M.; Daudey, P. J.; Marchee, G. J. J. Crystal. Growth 1981, 52, 801.
6 Livingston, R.; Wolde-Tinsae, A.; Chaturbahai, A. Comput. Mech. Publ. 1991, 1, 157.
7 Charola, A. E.; Puhringer, J.; Steiger, M. Environ. Geol. 2007, 52, 339.
8 Cowan, J. C.; Weintritt, D. J. Water-formed scale deposits; Houston Texas: Gulf publishing
Company, 1976.
9 Vetter, O. J. G.; Philips, R. C. J. Petro. Technol. 1970, 22, 1299.
10 See for example: (a) Lasaga, A. C.; Blum. A. E. Geochim. Cosmochim. Acta 1986, 50, 2363
(b) Schott, J.; Pokrovsky, O. S.; Oelkers, E.H. Rev. Min. Geochem. 2009, 70, 207.
11 See for example: (a) Lasaga, A. C.; Lüttge, A. Science 2001, 291, 2400 (b) Lasaga, A. C.;
Lüttge, A. Eur. J. Min. 2003, 15, 603 (c) Lüttge, A. J. Elec. Spect. 2006, 150, 248.
12See for example: (a) Liu, S.-T.; Nancollas, G. H. J. Inorg. Nucl. Chem. 1971, 33, 2311, (b)
Barton, A. F. M.; Wilde, N. M. Trans.Faraday. Soc. 1971, 67, 3590, (c) Singh, H.; Bajwa, M.
Page 37
36
S. Aust. J. Soil. Res. 1990, 28, 947, (d) Svensson, U.; Dreybrodt, W. Chem. Geol. 1992, 100,
129.
13 See for example: (a) Bosbach, D.; Rammensee, W. Geochim. Cosmochim. Acta 1994, 58,
843, (b) Bosbach, D.; Jordan, G.; Rammensee, W. Eur. J. Mineral. 1995, 7, 267, (c) Teng, T.
H.; Fan, C. Chem. Geol. 2007, 245, 242.
14 Colombani, J. Geochim. Cosmochim. Acta 2008, 72, 5634, and references therein.
15 CRC, Handbook of Chemistry and Physics, 89
th Ed, 2008-2009.
16 Jeschke A.A.; Dreybrodt, W. Chem Geol. 2002, 192, 183.
17 See for example: (a) Coquard, P.; Boistelle, R. Int. J. Rock Mech. Min. 1994, 31 (5), 517, (b)
Gartner, E. M. Cement Concrete Res. 2009, 39, 289.
18 See for example: (a) Orme, C.A.; Noy, A.; Wierzbicki, A.; McBride, M. T.; Grantham, M.;
Teng, H.H.; Dove, P.M.; DeYoreo, J.J, Nature 2001, 411, 775. (b) Morse, J. W.; Arvidson, R.
S. Earth-Sci. Rev. 2002. 58, 51, (c) Arvidson, R.S.; Collier, M.; Davis, K.J.; Vinson, M.D.;
Amonette, J.E.; Lüttge. A. Geochim. Cosmochim. Acta 2006, 70, 583, (d) Vavouraki, A. I.;
Putnis, C. V.; Putnis, A.; Koutsoukos, P. G, Chem. Geol. 2008, 253, 243, (e) Agudo, E. R.;
Kowacs, M.; Putnis, C. V.; Putnis, A. Geochim. Cosmochim. Acta 2010, 74, 1258.
19 (a) Freij, S.J.; Godelitsas, A.; Putnis, A. J. Crystal Growth 2005, 273, 535, (b) Gledhill,
D.K.; Morse, J.W. Geochim. Cosmochim. Acta 2006, 70, 5802, (c) Harstad, A.O.; Stipp,
S.L.S. Geochim. Cosmochim. Acta 2007, 71, 56, (d) Xu, M.; Higgins, S. R. Geochim.
Cosmochim. Acta 2011, 75, 719.
20 Arese, R.; Martin, D.; Rigaudon, M. U.S. Patent 20060048680, March 09, 2006.
Page 38
37
21 Yu, Q.; Sucech, S.; Groza, B.; Mlinac, R.; Jones, F.; Boehnert, F. U.S. Patent 6632550,
October 14, 2003.
22 Macpherson, J. V.; Unwin, P. R. Chem. Soc. Rev. 1995, 24, 109.
23 Unwin, P. R.; Macpherson, J. V. J. Chem. Soc. Faraday Trans. 1993, 89, 1883.
24 See for example: (a) Compton, R. G.; Pritchard, K. L.; Unwin, P. R.; Grigg, G.; Silvester, P.;
Lees, M.; House, W. A. J. Chem. Soc., Faraday Trans. 1, 1989, 85, 4335, (b) Compton, R. G.;
Pritchard, K. L.; Unwin, P. R. J. Chem. Soc., Chem. Commun. 1989, 249, (c) Compton, R. G.;
Unwin, P. R., Phil. Trans. R. Soc. Lond. 1990, A330, 1, (d) Compton, R. G.; Walker, C. T.;
Unwin, P. R.; House, W. A. J. Chem. Soc., Faraday Trans. 1990, 86, 849, (e) Unwin, P. R.;
Compton, R. G. J. Chem. Soc., Faraday Trans. 1990, 86, 151, (f) Barwise, A.J.; Compton,
R.G.; Unwin, P.R. J. Chem. Soc., Faraday Trans. 1990, 86, 137, (g) Wilkins, S. J.; Compton,
R. G.; Taylor, M. A.; Viles, H. A. J. Colloid Interface Sci. 2001, 236, 354, (h) Thompson, M.;
Wilkins, S. J.; Compton, R. G.; Viles, H. A. J. Colloid Interface Sci. 2003, 259, 338.
25 See for example: (a) Orton, R.; Unwin. P. R. J. Chem. Soc., Faraday Trans. 1993, 89, 3947,
(b) Brown, C.A.; Compton, R.G.; Narramore, C.A. J. Colloid Interf. Sci. 1993, 160, 372, (c)
Hong, Q.; Suarez, M. S.; Coles, B. A.; Compton, R. G. J. Phys. Chem. B 1997, 101, 5557, (d)
Booth, J.; Sanders, G. H. W. ; Compton, R. G.; Atherton, J. H.; Brennan. C. M. J. Electroanal.
Chem. 1997, 440, 83 (e) Peltonen, L.; Liljeroth, P.; Heikkila, T.; Kontturi, K.; Hirvonen, J. Eur.
J. Pharm. Sci. 2003, 19, 395.
26 Unwin, P. R.; Compton, R. G. Comprehensive Chemical Kinetics; Elsevier, New York, USA
1989, Vol 29 Ch 6 p. 173.
27 Cooper, J. A.; Compton, R. G. Electroanalysis 1997, 10, 141.
Page 39
38
28 Compton, R. G.; Pritchard, K. L., Phil. Trans. R. Soc. Lond. 1990, A330, 47.
29 Snowden, M. E.; King, P. H.; Covington, J. A.; Macpherson, J. V.; Unwin, P. R. Anal.
Chem. 2010, 82, 3124.
30 Schecher, W.D; McAvoy, D. C, MINEQL+, A chemical Equilibrium Modelling System,
Environmental Research software; Hallowell, Maine, USA 2003.
31 Davies, C. W. Ion Association; Butterworths, London, 1962.
32 See for example: (a) White, A. F.; Brantley, S. L. Rev. Mineral. Geochem. 1995, 31, 1, (b)
Brantley, S. L.; Mellot, N. R. Am. Mineral. 2000, 85, 1767, (c) Luttge, A. Am. Mineral. 2005,
90, 1776.
33 Bruckenstein, S. Anal. Chem. 1985, 57, 371.
34 Unwin, P.R.; Compton, R. G. J. Electroanal. Chem., Interfac. Electrochem. 1988, 245, 287.
35 Colombani, J.; Bert, J. Geochim. Cosmochim. Acta 2007, 71, 1913.
36 See for example: (a) Compton, R.G.; Unwin, P. R. J. Electroanal. Chem., Interfac.
Electrochem. 1986, 205, 1, (b) Compton, R.G.; Pilkington, M. B. G.; Stearn, G. M.; Unwin, P.
R. J. Electroanal. Chem., Interfac. Electrochem. 1987, 238, 43.
37 See for example: (a) Jones, H.W.; Monk, C. B.; Davies, C. W., J. Chem. Soc. 1949, 2693 (b)
Jones, H. W.; Monk, C. B., J. Chem. Soc. 1950, 3475.
38 Liu, S. T.; Nanchollas, G.H., J.Colloid. Interf. Sci. 1975, 52, 582.
39 Rashichi, F.; Finch, J. A., Miner Eng. 2000, 13, 1019.