Matthews Asia Funds | Annual Report December 31, 2009 | matthewsasia.com ASIA GROWTH AND INCOME STRATEGIES Matthews Asian Growth and Income Fund Matthews Asia Dividend Fund Matthews China Dividend Fund ASIA GROWTH STRATEGIES Matthews Asia Pacific Fund Matthews Pacific Tiger Fund Matthews China Fund Matthews India Fund Matthews Japan Fund Matthews Korea Fund ASIA SMALL COMPANY STRATEGY Matthews Asia Small Companies Fund ASIA SPECIALTY STRATEGY Matthews Asian Technology Fund '09
Transcript
Matthews Asia Funds | Annual Report December 31, 2009 | matthewsasia.com
ASIA GROWTH AND INCOME STRATEGIES
Matthews Asian Growth and Income Fund
Matthews Asia Dividend Fund
Matthews China Dividend Fund
ASIA GROWTH STRATEGIES
Matthews Asia Pacific Fund
Matthews Pacific Tiger Fund
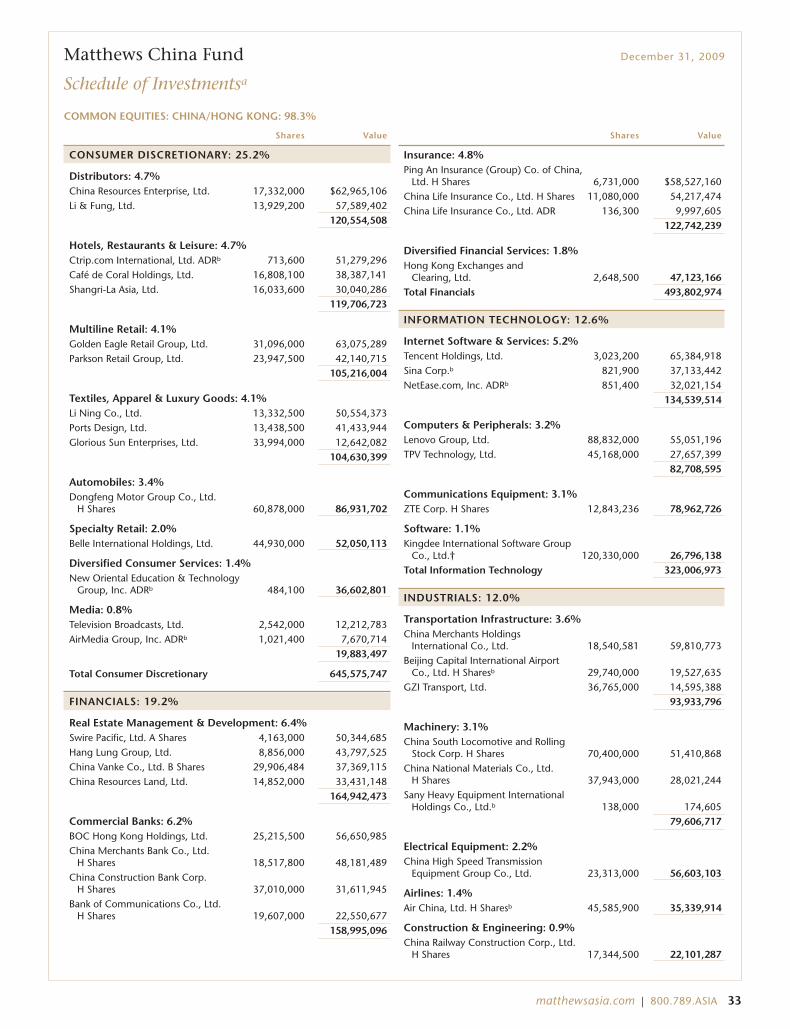
Matthews China Fund
Matthews India Fund
Matthews Japan Fund
Matthews Korea Fund
ASIA SMALL COMPANY STRATEGY
Matthews Asia Small Companies Fund
ASIA SPECIALTY STRATEGY
Matthews Asian Technology Fund '09
Performance and ExpensesThrough December 31, 2009
2009 Gross 2008 GrossAverage Annual Total Return Annual Annual
Since Inception Operating Operating1 year 5 years 10 years Inception Date Expenses Expenses
ASIA GROWTH AND INCOME STRATEGIES
Matthews Asian Growth and Income Fund 41.44% 10.77% 13.76% 11.18% 9/12/94 1.18% 1.16%
Matthews Asia Dividend Fund 47.59% n.a. n.a. 11.00% 10/31/06 1.28% 1.35%
After Fee Waiver, Reimbursement and Recoupment 1.30%1 1.32%1
Matthews China Dividend Fund n.a. n.a. n.a. 1.80%2 11/30/09 10.05% n.a.
After Fee Waiver, Reimbursement and Recoupment 1.50%3 n.a.
ASIA GROWTH STRATEGIES
Matthews Asia Pacific Fund 44.82% 7.18% n.a. 9.86% 10/31/03 1.28% 1.23%
Matthews China Fund 78.30% 22.23% 17.18% 13.53% 2/19/98 1.21% 1.23%
Matthews India Fund 97.25% n.a. n.a. 16.43% 10/31/05 1.27% 1.29%
Matthews Japan Fund 10.06% -5.49% -3.85% 3.11% 12/31/98 1.31% 1.23%
Matthews Korea Fund 62.92% 10.47% 8.98% 4.81% 1/3/95 1.30% 1.27%
ASIA SMALL COMPANY STRATEGY
Matthews Asia Small Companies Fund 103.00% n.a. n.a. 44.05% 9/15/08 2.09% 14.31%
After Fee Waiver, Reimbursement and Recoupment 2.00%4 2.00%4
ASIA SPECIALTY STRATEGIES
Matthews Asian Technology Fund 70.28% 8.03% n.a. -1.64% 12/27/99 1.40% 1.33%
1 The Advisor has contractually agreed to waive Matthews Asia Dividend Fund’s fees and reimburse expenses until at least August 31, 2010 to the extent needed to limit total annualoperating expenses to 1.50%.
2 Actual Return for fiscal period beginning 11/30/09 through 12/31/09, not annualized.
3 The Advisor has contractually agreed to waive Matthews China Dividend Fund’s fees and reimburse expenses until at least November 30, 2012 to the extent needed to limit totalannual operating expenses to 1.50%.
4 The Advisor has contractually agreed to waive Matthews Asia Small Companies Fund’s fees and reimburse expenses until at least April 30, 2012 to the extent needed to limit totalannual operating expenses to 2.00%.
Investor Disclosure
Past Performance: All performance quoted in this report is past performance and is no guarantee of future results.Investment return and principal value will fluctuate with changing market conditions so that when redeemed, sharesmay be worth more or less than their original cost. Current performance may be lower or higher than the returnsquoted. If certain of the Funds’ fees and expenses had not been waived, returns would have been lower. For the Funds’most recent month-end performance, please call 800.789.ASIA (2742) or visit matthewsasia.com.
Investment Risk: Mutual fund shares are not deposits or obligations of, or guaranteed by, any depositary institution. Sharesare not insured by the FDIC, Federal Reserve Board or any government agency and are subject to investment risks, includingpossible loss of principal amount invested. Investing in international markets may involve additional risks, such as social andpolitical instability, market illiquidity, exchange-rate fluctuations, a high level of volatility and limited regulation. Inaddition, single-country and sector funds may be subject to a higher degree of market risk than diversified funds because ofconcentration in a specific industry, sector or geographic location. Investing in small and mid-size companies is more riskythan investing in large companies as they may be more volatile and less liquid than larger companies. Please see the Funds’prospectus and Statement of Additional Information for more risk disclosure.
Redemption Fee Policy
The Funds assess a redemption fee of 2.00% on the total redemption proceeds on most sales or exchanges of shares that takeplace within 90 calendar days after their purchase as part of the Funds’ efforts to discourage market timing activity. This fee ispayable directly to the Funds. For purposes of determining whether the redemption fee applies, the shares that have beenheld longest will be redeemed first. The Funds may grant exemptions from the redemption fee in certain circumstances. Formore information on this policy, please see the Funds’ prospectus.
Manager Commentaries, Fund Characteristics and Schedules of Investments:
ASIA GROWTH AND INCOME STRATEGIESMatthews Asian Growth and Income Fund 5Matthews Asia Dividend Fund 10Matthews China Dividend Fund 15
ASIA GROWTH STRATEGIESMatthews Asia Pacific Fund 20Matthews Pacific Tiger Fund 25Matthews China Fund 30Matthews India Fund 35Matthews Japan Fund 40Matthews Korea Fund 45
ASIA SMALL COMPANY STRATEGYMatthews Asia Small Companies Fund 50
ASIA SPECIALTY STRATEGYMatthews Asian Technology Fund 55
Disclosures and Index Definitions 59
Disclosure of Fund Expenses 60
Statements of Assets and Liabilities 62
Statements of Operations 64
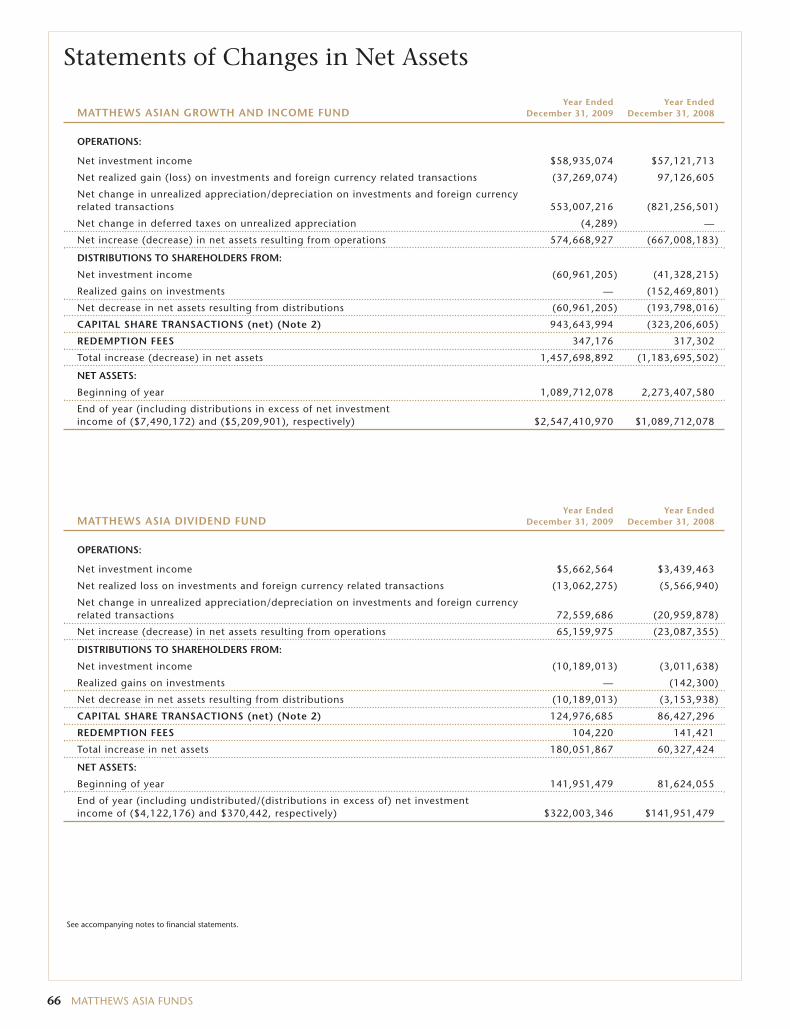
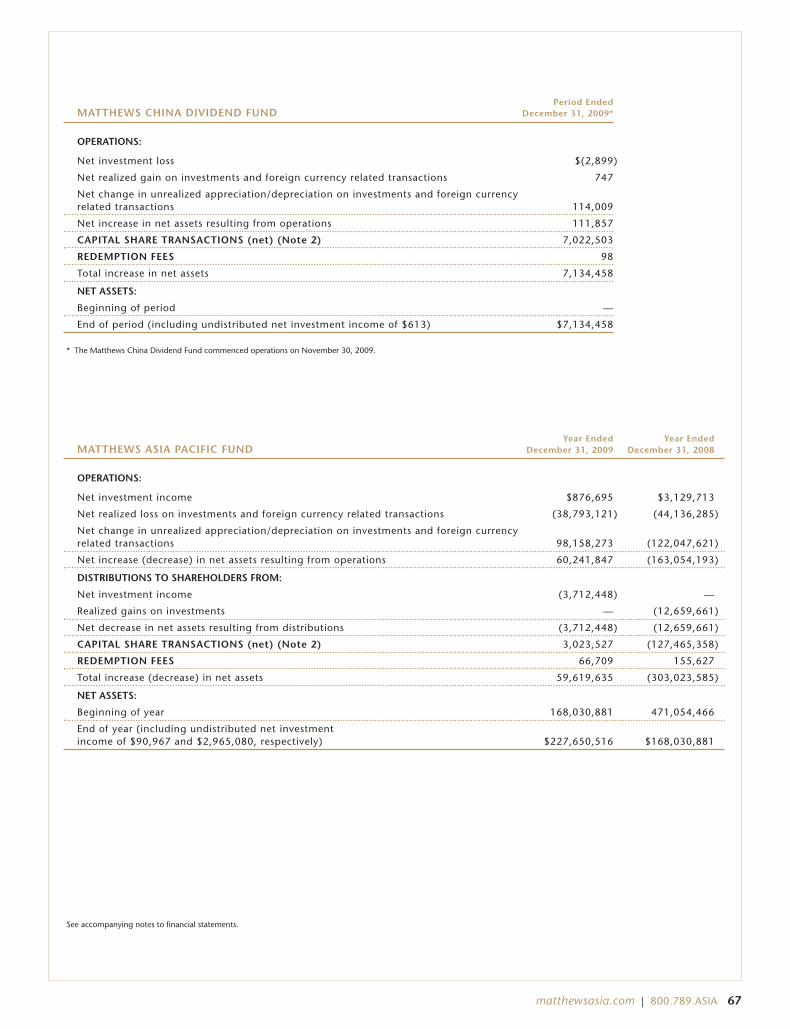
Statements of Changes in Net Assets 66
Financial Highlights 72
Notes to Financial Statements 83
Report of Independent Registered Public Accounting Firm 94
Tax Information 95
Approval of Investment Advisory Agreement 96
Trustees and Officers of the Funds 100
This report has been prepared for Matthews Asia Funds shareholders. It is not authorized for distribution to prospective investors unlessaccompanied or preceded by a current Matthews Asia Funds prospectus, which contains more complete information about the Funds’investment objectives, risks and expenses. Additional copies of the prospectus may be obtained at matthewsasia.com. Please read theprospectus carefully before you invest or send money.
The views and opinions in this report were current as of December 31, 2009. They are not guarantees of performance or investment resultsand should not be taken as investment advice. Investment decisions reflect a variety of factors, and the managers reserve the right tochange their views about individual stocks, sectors and the markets at any time. As a result, the views expressed should not be relied uponas a forecast of a Fund’s future investment intent.
Statements of fact are from sources considered reliable, but neither the Funds nor the Investment Advisor makes any representation orguarantee as to their completeness or accuracy.
Matthews Asia Funds are distributed by:PFPC Distributors, Inc. | 760 Moore Road | King of Prussia, PA 19406
Message to Shareholders from the Investment Advisor
Dear Fellow Shareholders,
Many commentators are describing 2009 as a watershed year—one in whichglobal economic leadership shifted decisively from the West to the East. Indeed,the U.S. and European economies appeared to bottom out in the middle of2009 when GDP fell 3.8% and 5.0% year-on-year, respectively. Meanwhile, Asiarecovered sooner than the West, and China and India grew throughout the cri-sis with year-on-year growth rates falling to approximately 6% in bothcountries. In political circles, the Group of 20 (G–20) usurped the position ofthe Group of 8 (G–8) as the prime decision-making body while the world’sfinance ministers struggled to coordinate global stimulus. Japan had been Asia’ssole representative in the G–8, but this change brought China, India, SouthKorea, Indonesia and Australia into the main forum for global economic policy-making. Some of the commentary has been hyperbole, with editorial writers,book authors and even some foreign leaders announcing the “end of theAmerican Empire.” Even now, however, the conventional wisdom is that theU.S. faces many years of slow growth because of its debt-laden consumers,while Asian consumers are just starting to open their wallets.
You could say that markets mirrored the trends in underlying fundamentals—the S&P 500 Index bottomed out in early March 2009, but the MSCI AllCountry Asia ex Japan Index had already seen its lowest point in late Novemberof the previous year. Asia is now valued at 10% to 15% higher than the U.S. onpopular metrics. This can only be justified by higher growth expectations.Equities have rebounded very strongly—more rapidly than many people,myself included, would have imagined. It is hard to see how any part of theworld—however “decoupled” some may argue—can truly prosper if NorthAmerica and Europe (more than half the global economy) are each sufferingunemployment rates of about 10%. We may have started 2009 more isolated inour optimism about the strength of Asia’s corporate fundamentals and itseconomies; now there are many more people who agree with our belief andperhaps express it too incautiously. That sort of company is a little disconcerting.
West Coast Offense
I believe that a certain amount of isolation and distance is a good thing forinvestors. Sitting in San Francisco might have made us appear far removed fromthe maelstrom in Asia’s markets, but it gave us perspective. Local fund man-agers tend to get caught up in the gossip and rumor that surround their ownmarkets. They seem constantly tempted to trade on sentiment and momentum.At Matthews, we are able—perhaps forced—to take a measured view. We try toresist the temptation of making the “big play” or to wager everything on onebig call. During the depths of the recent economic crisis, our analysts and port-folio managers continued their regular research trips to Asia to meet withbusiness leaders, and to form independent views of how events were unfolding.Even as the container ships passed in and out of San Francisco Bay—empty andhigh in the water—and even as trade was collapsing, the message from busi-nesses in Asia was that their domestic sales were still growing. I know from myown contacts in Hong Kong that more than a few local fund managers wereraising cash to try to prosper from the poor sentiment and avoid market falls.Our approach at Matthews has been to remain fully invested, and wheneverpossible, to take incremental opportunities to build positions in specific stocksat depressed prices.
This approach was not without controversy. 2009 was a year when marketsseemed to diverge widely from fundamentals, as witnessed by large swings invaluations. These divergences gave rise to the criticism that, surely, we are ableto see these great dislocations before they happen. Along with the panic inglobal equity markets, some investors also lost confidence (or perhaps patience)
2 MATTHEWS ASIA FUNDS
“Sitting in San Franciscomight have made us appearfar removed from themaelstrom in Asia’s markets,but it gave us perspective.”
with the strategy of being fully invested—to “buy and hold.” Some will no doubt argue that Asia’s markets are still 25%below their highs of October 2007. Point taken. However, in my mind, “buy and hold” still has at least one thing goingfor it—we only have to focus on the stock decision and get that one decision right. Trading requires you to get multipledecisions right: when to buy the market, when to sell and then when to buy again. Trading also puts a premium on theliquidity of a company’s equity and raises it to a level of importance equal to, if not greater than, the underlying sound-ness of the company itself. During the past two years or so, the market certainly offered up big opportunities fortrading. But as I have noted, the market also whipsawed investors’ emotions, and caused them to question their basicassumptions about the future. Once people have their confidence in a market so shaken as to cause them to abandon it,how many are then able to quickly reinvest when the fear of loss is greatest? How many people invested on the basisthat they held a “liquid” asset only to see that liquidity dry up when its financial soundness was called into question?According to some research, many funds that took a more active trading stance were indeed caught with high cash lev-els or “liquidity” when the markets bounced back. It seems to me almost by definition that many traders must becaught out of the market this way, and miss the recovery.
Markets and Fundamentals—Diverging Again?
As we enter 2010, it is of some concern to me that interest rates remain exceptionally low in the developed world, and thatAsia’s recovery is underway and indeed interest rates have started to rise. It has occurred three times in Australia and once inChina. Sell-side analysts are talking breathlessly of a U.S. dollar-fed “carry trade,” a strategy of selling a currency with a rela-tively low interest rate in order to purchase a different currency yielding a higher interest rate. Analysts also talk of thepotential for an emerging market bubble, as if the prime objective of investment is to read policymakers’ minds and to tryto jump the gun on their decisions. There are fundamental reasons to expect Asia to perform well as its households growwealthier; we mostly agree with that assessment. Nevertheless, the structural reforms required of Asian economies will taketime and some government commitment. Markets are increasingly willing to discount a smooth transition to the “neweconomic order.” Are markets starting to diverge from fundamentals again? If so, what should be done with investments?
Valuations are a source of concern, and they enter into our investment process in one of two ways. For some funds, ameasure of valuation—more specifically dividend yield—is a crucial first step in the idea generation process. For otherfunds, the focus on valuation may be relaxed when warranted by the quality of a company’s business model andmanagement. But in neither case is valuation a primary reason to sell out of a position completely if we believe in thelong-term future of the company. High valuations are, however, reason enough to proceed into the new year withcaution. This caution is already starting to influence the stock decisions we are making in the Funds and I hope that ittempers the ardor of those making some of the wilder predictions for markets this year. Nevertheless, we maintain ourcommitment to being fully invested because, despite our concerns, we have no particular insight as to where themarkets may be trading a year from now.
We also remain committed to the belief that Asia will enjoy many years of good growth and that the new decade will seea further reshaping of the region’s economies. We believe that it should also offer new opportunities to invest in growingcompanies in both established and emerging industries—Asia’s economic landscape will surely look very different10 years from now. Our old image of Asia—centered on infrastructure, export manufacturing and heavy industry—isgradually being replaced by one in which service industries, including finance, health care, retail and leisure play a biggerrole in the economy. Finding and researching those potential opportunities remains the focus of Matthews’ investmentteam. We seek to identify and hold companies that make it through each cycle stronger than they were before, ratherthan to invest in stocks primarily on the basis of their liquidity and to try to trade in and out of each cycle.
During the past year, we celebrated the 15-year anniversary of our flagship funds, the Pacific Tiger Fund and the AsianGrowth and Income Fund and the 10-year anniversary of the Asian Technology Fund. Along with our China, Japanand Korea Funds, these portfolios have track records in excess of 10 years.
We also celebrated the one-year anniversary of the Asia Small Companies Fund and launched the China DividendFund. This new Fund enables us to execute our dividend-focused strategy in a single-country portfolio for the firsttime. Few people question the importance of using different strategies when investing in the U.S. market—we thinkthis same approach should be applied in Asia.
We thank you for your continued and continuous support during this past year, particularly as it has been an unusu-ally volatile and challenging one. It is more than usually true to say that it is a privilege and an honor to serve as yourinvestment advisor.
Robert J. Horrocks, PhDChief Investment OfficerMatthews International Capital Management, LLC
Message to Shareholders from the Board of Trustees
Dear Shareholders,
I am pleased to inform you that Dean Richard Lyons will be rejoining theMatthews Asia Funds Board of Trustees. Dean Lyons served as a Trustee of theMatthews Asia Funds from the inception of the Fund family in 1994 until 2006,and served as the Funds’ independent Chairman for eight of those years. He iscurrently the Dean of the Haas School of Business at the University ofCalifornia at Berkeley. Prior to becoming Dean in July 2008, he served as theChief Learning Officer at Goldman Sachs. Dean Lyons made significant contri-butions to the Fund family and its development during his previous tenure asTrustee, and I believe the Funds’ shareholders will benefit greatly from hisreturn to the Board.
The Board of Trustees appreciates your investment in the Funds and looks for-ward to its continued work on behalf of the shareholders.
Sincerely,
Geoffrey H. BobroffChairman of the Board of TrusteesMatthews Asia Funds
Portfolio Manager CommentaryFor the year ending December 31, 2009, the Matthews Asian Growth and IncomeFund generated a return of 41.44%, while its benchmark, the MSCI All CountryAsia ex Japan Index, rose 72.53%. During the fourth quarter, the Fund gained4.24%, versus a 6.59% increase in the benchmark. Over the course of the year,each share of the Fund paid approximately 44 cents, or about 3.8% of the Fund’sinitial share price, in income via semi-annual dividends.
Just as 2008 was a year in which financial markets defied nearly every expecta-tion, so was 2009. The breathless pace at which stocks and other financial assetsregained a portion of their nominal value was remarkable. Also remarkable washow quickly economic activity in Asia—particularly in China—resumed anexpansionary path.
For some market observers, the surprise of the year was that the Chinese econ-omy did not collapse amid a Western recession. Earnings growth seems to againbe underway in Asia. However, while fundamental conditions have improved,they have been eclipsed by a sharp increase in stock prices. Yields on Asian fixed-income markets are near historic lows, and equity prices are not far from recordhighs, leaving a reduced margin for error. Looking forward, relatively high valua-tions may pose a challenge to the continued outperformance of Asian equitymarkets.
The Fund’s strategy has been sorely tested over the past two years. Historically,the Fund has made use of U.S. dollar-denominated convertible bonds to achieve adegree of capital protection when conditions were adverse for equities. However,dollar credit markets were at the epicenter of the financial collapse in late 2008;consequently dollar-denominated convertibles in Asia offered no safe haven. Asmarkets rallied violently in the first half of 2009, the Fund’s risk-averse strategymeant that the stocks it favored—those of established, mature companies capableof sustained dividend payments—were not central beneficiaries of the market’srecovery. Instead, premiums were assigned to the stocks of riskier businesses,small companies and deeply cyclical industries. Amid such conditions, the Fund’srecent performance was largely in line with our expectations, with some notabledisappointments in Japan.
Some of the Fund’s largest gains in 2009 resulted from portfolio shifts undertakenat the outset of the year. One critical decision was to place greater weight on thetechnology sector, especially on companies in the computer and semiconductorindustries. A year ago, such companies suffered from severely depressed valua-tions despite stable financial positions and relatively attractive growth prospects.Ironically, while the market perceived many of these companies to be financiallyweak, few had much debt. With strong balance sheets and reasonably stable cashflows, some semiconductor and computer-related firms have become substantialpayers of dividends. Ultimately, two such companies made the largest contribu-tion to the Fund’s performance: ASM Pacific Technology, one of the world’slargest manufacturers of assembly and packaging equipment for semiconductors,and VTech Holdings, a leading maker of cordless phones, as well as educationalelectronics and video games.
The Fund also benefited from a shift toward industrial conglomerates, particularlythose with underlying exposure to energy and agricultural products. Historically,the Fund has eschewed direct investment in such businesses as their sharp cycli-cality makes it difficult to value or to assess the quality of their management.However, at the beginning of 2009, we recognized a number of industrials thathad seen precipitous declines in their share prices. Their common denominatorwas indirect or diversified exposure to energy and commodities. This was attrac-tive, as the diversified nature of these companies could yield consistency in cashflow, thereby shielding the portfolio from the worst aspects of the commodity
matthewsasia.com | 800.789.ASIA 5
PORTFOLIO MANAGERS
Andrew FosterLead Manager
Robert J. Horrocks, PhDCo-Manager
FUND FACTS
Ticker MACSXInception Date 9/12/94Assets $2.5 billionNAV $15.77Total # of Positions 83
Fiscal Year 2009 RatiosPortfolio Turnover 17.51%1
Gross Expense Ratio 1.18%2
BenchmarksMSCI AC Asia ex Japan IndexMSCI AC Far East ex Japan Index
Redemption Fee2% within first 90 calendar daysof purchase
OBJECTIVE
Long-term capital appreciation.The Fund also seeks to provide somecurrent income.
STRATEGY
Under normal market conditions, theFund seeks to achieve its investmentobjective by investing at least 80% ofits total net assets, which includeborrowings for investment purposes,in dividend-paying equity securitiesand the convertible securities, of anyduration or quality, of companieslocated in Asia.
ASIA GROWTH ANDINCOME STRATEGIES
(continued)
1 The lesser of fiscal year 2009 long-term purchasecosts or sales proceeds divided by the averagemonthly market value of long-term securities.
PERFORMANCE AS OF DECEMBER 31, 2009Average Annual Total Returns
Inception 3 Months 1 Year 3 Years 5 Years 10 Years 9/12/94
Matthews Asian Growth and Income Fund 4.24% 41.44% 5.31% 10.77% 13.76% 11.18%
MSCI AC Asia ex Japan Index3 6.59% 72.53% 5.02% 13.79% 6.55% 3.62%4
MSCI AC Far East ex Japan3 6.46% 69.39% 4.79% 13.13% 5.92% 3.25%4
Lipper Pacific ex Japan Funds Category Average5 6.49% 71.34% 4.72% 13.05% 7.53% 5.22%4
Performance assumes reinvestment of all dividends and/or distributions before taxes. All performance quoted represents past performanceand is no guarantee of future results. Investment return and principal value will fluctuate with market conditions so that when redeemed,shares may be worth more or less than their original cost. Current performance may be lower or higher than the return figures quoted. Returnswould have been lower if certain of the Fund’s fees and expenses had not been waived. For the Fund’s most recent month-end performance visitmatthewsasia.com.
INCOME DISTRIBUTION HISTORYJune December Total
2009 $0.22 $0.22 $0.44
2008 $0.25 $0.17 $0.42
2007 $0.22 $0.69 $0.90
1994–2006 $2.10 $2.47 $4.57
Note: This table does not include capital gains distributions.
GROWTH OF A $10,000 INVESTMENT SINCE INCEPTION
Plotted monthly. The performance data and graph do not reflect the deduction of taxes that a shareholder would pay on dividends, capital gain distributions or redemption of Fundshares. Values are in US$.3 It is not possible to invest directly in an index. Source: Index data from Morgan Stanley Capital Management; total return calculations performed by PNC Global Investment
Servicing (U.S.) Inc. Please see page 59 for index definitions.4 Calculated from 8/31/94.5 The Lipper Category Average does not reflect sales charges and is based on total return, including reinvestment of dividends and capital gains for the stated periods.
TOP TEN HOLDINGS6
Security Type Country % of Net Assets
Hongkong Land CB 2005, Ltd., Cnv., 2.750%, 12/21/12 Convertible Bond China/Hong Kong 2.7%
DIVIDEND YIELD: 3.63%The dividend yield (trailing) for the portfolio is the weighted average sum of thedividend paid per share during the last 12 months divided by the current price.The annualized dividend yield for the Fund is for the equity-only portion of theportfolio. Please note that this is based on gross portfolio holdings and does notreflect the actual yield an investor in the Fund would receive. Past yields are noguarantee of future yields.
Source: FactSet Research Systems
30-DAY YIELD: 1.61%The 30-Day Yield represents net investment income earned by the Fund over the30-day period ended 12/31/09, expressed as an annual percentage rate based onthe Fund’s share price at the end of the 30-day period. The 30-Day Yield should beregarded as an estimate of the Fund’s rate of investment income, and it may notequal the Fund’s actual income distribution rate.
Source: PNC Global Investment Servicing (U.S.) Inc.
7 Australia, United Kingdom and Japan are notincluded in the MSCI All Country Asia ex JapanIndex.
8 Source: FactSet Research Systems. Percentagevalues in data are rounded to the nearest tenth ofone percent; the values may not sum to 100% dueto rounding.
9 Convertible bonds are not included in the MSCIAll Country Asia ex Japan Index.
cycle. We added a few such positions, notably Singapore’s Keppel Corporation,one of the largest offshore oil rig builders in the world. We were attracted to Kep-pel for its secure balance sheet, with cash reserves and a manageable level of debt;and for its diversified operating structure that offered exposure to property andinfrastructure projects alongside the oil industry. Keppel is also one of the largestdividend-paying companies in Singapore, paying out approximately US$385 mil-lion in dividends during 2008 (the firm has not yet declared final dividends forthe 2009 financial period).
Other positions, such as convertible bonds, contributed mixed results to Fundperformance. Some of the Fund’s positions performed in line with our expecta-tions, gaining as credit markets stabilized and as their underlying conversionvalues rose. However, some of the convertibles issued by small and mid-sizecompanies were hampered by continued distress in credit markets. Capital mar-kets were not disposed toward issuance in the first half of the year; and thus,smaller companies faced some challenges when attempting to refinance theirbalance sheets. However, issuance has recently resumed in earnest and willhopefully lead to healthier future supply and valuations in convertibles.
The greatest detractor to performance arose from the Fund’s exposure to theJapanese market. At the beginning of the year, the Fund held two positions inlarge-capitalization Japanese real estate investment trusts (J-REITs)—Japan’slarge-cap REITS underperformed small-cap REITS in 2009. It also held a positionin one of Asia’s largest software companies by market capitalization, TrendMicro. Over the course of the year, the Fund added three other positions in sec-tors spanning pharmaceuticals, technology and industrial equipment.Collectively, these investments have done little to promote the Fund’s perform-ance and have cost us the opportunity to invest elsewhere in Asia.
The Fund’s roughly 10% weighting to Japan is at a historic high. We stronglybelieve that value in select Japanese companies—especially mid-size industrialsand technology companies—is compelling. Admittedly, Japan may lack an obvi-ous catalyst to spur broad-based market performance. Nevertheless, as thecountry’s stock market has stagnated over the past two decades, investors haveoverlooked a number of companies. Most of these firms are global leaders in agiven technology or marketplace, and most also enjoy substantial operating lever-age should an economic recovery ensue. A few have taken to paying dividends,with some growth visible over time. Though such companies are worthy ofstrong consideration, we, nevertheless, do not intend to actively increase theFund’s weighting in Japan as we believe this to already be a substantial allocation.
As we look forward, a number of risks present themselves for the year ahead. Asmentioned previously, relatively rich valuations may prove an impediment tocontinued gains. If inflation in the region does resurface, we believe that it willhave a pronounced effect on staples, food and subsidized forms of energy. TheFund has sought some exposure to this possibility via its positions in agricul-tural and soft-commodity companies. A third risk may arise from the increasedpropensity for trade tensions, which may likely be directed toward China andits currency policies. If tensions escalate, stock markets may be shaken.
However, ahead of all these risks is the Fund’s greatest challenge: to continue torefashion and adapt its strategy in light of the region’s ever-evolving markets.Despite its caution, the Fund has always pursued growth; and indeed, there arenew growth industries emerging in Asia, especially in health sciences, softwareand financial services. Thus, the Fund’s mission for the next decade is the sameas the last: to retain its conservative philosophy and approach, yet probeemerging pockets of growth, investing in areas not well represented in bench-mark indices or widely present in investors’ portfolios.
Matthews Asian Growth and Income Fund December 31, 2009
Schedule of Investmentsa
CHINA/HONG KONG: 22.0%CLP Holdings, Ltd. 9,410,200 $63,684,163Hang Seng Bank, Ltd. 3,490,100 51,346,297Hang Lung Properties, Ltd. 12,688,920 49,745,023Shandong Weigao Group Medical
H Sharesb 4,926,600 19,634,217Hong Kong & China Gas Co., Ltd. 7,721,490 19,366,666I-CABLE Communications, Ltd.b† 128,079,000 18,768,537Bank of Communications Co., Ltd.
H Shares 14,192,000 16,322,702Café de Coral Holdings, Ltd. 7,137,100 16,300,050China Green Holdings, Ltd. 8,877,000 8,406,370Total China/Hong Kong 560,097,104
SOUTH KOREA: 5.2%S1 Corp. 817,555 $33,986,571GS Home Shopping, Inc.† 388,299 28,572,175SK Telecom Co., Ltd. ADR 1,522,933 24,762,891Hana Financial Group, Inc. 720,489 20,364,124SK Telecom Co., Ltd. 123,215 17,985,344Daehan City Gas Co., Ltd. 325,300 7,805,468Total South Korea 133,476,573
THAILAND: 2.6%Advanced Info Service Public Co., Ltd. 13,488,300 34,995,434BEC World Public Co., Ltd. 37,652,500 27,811,407Thai Reinsurance Public Co., Ltd. NVDR 25,672,800 3,925,919Total Thailand 66,732,760
UNITED KINGDOM: 2.3%HSBC Holdings PLC ADR 1,046,733 59,757,987Total United Kingdom 59,757,987
AUSTRALIA: 1.8%AXA Asia Pacific Holdings, Ltd. 7,821,742 45,733,160Total Australia 45,733,160
INDONESIA: 1.6%PT Telekomunikasi Indonesia ADR 1,003,200 40,077,840Total Indonesia 40,077,840
PHILIPPINES: 1.3%Globe Telecom, Inc. 1,631,960 32,094,600Total Philippines 32,094,600
TOTAL COMMON EQUITIES 1,646,915,439(Cost $1,381,470,159)
PREFERRED EQUITIES: 3.1%
SOUTH KOREA: 3.1%Samsung Fire & Marine Insurance Co.,
Ltd., Pfd. 405,331 31,840,260Hyundai Motor Co., Ltd., Pfd. 566,280 20,336,174LG Household & Health Care, Ltd., Pfd. 210,290 14,732,989Hyundai Motor Co., Ltd., 2nd Pfd. 305,760 11,226,322Total South Korea 78,135,745
TOTAL PREFERRED EQUITIES 78,135,745(Cost $41,572,790)
† Affiliated Issuer, as defined under the Investment Company Act of 1940 (ownershipof 5% or more of the outstanding voting securities of this issuer). (Note 4)
Portfolio Manager CommentaryFor the year ending December 31, 2009, the Matthews Asia Dividend Fundgained 47.59%, outperforming its benchmark, the MSCI All Country (AC) AsiaPacific Index, which rose 37.86%. For the fourth quarter, the Fund rose 7.53%,while the benchmark gained 2.31%. The Fund began 2009 with a share price of$8.61, and shareholders who were invested throughout the year would havereceived income distributions totaling approximately 55 cents, or 6.3%, of theinitial share price. To better reflect our investment strategy, the Fund’s namewas changed from Matthews Asia Pacific Equity Income Fund to Matthews AsiaDividend Fund on November 30, 2009.
The outperformance of the Matthews Asia Dividend Fund relative to its bench-mark during 2009 was a testament to the importance of staying flexible in theexecution of an investment strategy. The Fund employs a stock selection processthat seeks to identify and invest in companies that offer a combination of attrac-tive dividend yields and the potential for dividend growth. While this investmentphilosophy remains unchanged, its implementation in the portfolio will adapt tothe opportunities present in the equity markets.
The Fund’s positive performance in 2009 was, in large part, derived from its hold-ings in China and Hong Kong, and its significant allocation to small andmid-capitalization companies. At the end of the first quarter, 63% of the portfoliowas invested in companies with a market capitalization of less than US$5 billion,while the Fund’s weighting in China increased from 1.1% in June of 2008 to9.0%. As share prices were sharply lower in China in the fourth quarter of 2008and the first quarter of 2009, investors were presented with attractive dividendyields on shares of companies that offered both the potential for long-term earn-ings growth and the relative safety of healthy balance sheets. The Fund’sincreased allocation to faster-growing Chinese stocks and smaller companies wasan effort to upgrade its dividend growth profile at attractive valuations. Thesecompanies had previously traded at lofty valuations that did not match the yieldcriteria of the Fund’s investment strategy. However, in evaluating investments,the Fund weighs current yield against the potential growth in dividends. Whilecurrent yield is an important component of total return, it is the growth in divi-dends that, over time, will tend to underpin capital appreciation.
The Fund’s main contributor to performance for 2009 was Minth Group, asmaller-capitalization Chinese company. The company manufactures and sup-plies trims and decorative auto parts to the Chinese subsidiaries of internationalautomobile manufacturers from the U.S., Japan and Europe. Large customers,such as major auto makers tend to demand lower prices, often resulting in lowermargins for suppliers such as Minth. However, Minth’s products make up only asmall part of the total manufacturing cost of a car, and the company has facedfewer pricing pressures, enabling it to enjoy net profit margins in excess of 20%.The Fund’s investment in Minth gave it exposure to the fast-growing Chinesepassenger car market—the largest in the world in 2009, with 10.3 million passen-ger cars sold. Since Minth supplies to several car manufacturers it is less reliant ona single product, thereby lowering the product risk and increasing the predictabil-ity of cash flows. The company has more cash than debt on the balance sheet,giving it flexibility to weather short-term headwinds, and allowing for the contin-uation of dividend payments and capital investments for future growth. Ouron-site meetings with management near Shanghai, and our research into thefirm’s historical financial data, convinced us that the company had the capacity
10 MATTHEWS ASIA FUNDS
PORTFOLIO MANAGERS
Jesper O. Madsen, CFALead Manager
Andrew FosterCo-Manager
FUND FACTS
Ticker MAPIXInception Date 10/31/06Assets $322.0 millionNAV $12.06Total # of Positions 63
Fiscal Year 2009 RatiosPortfolio Turnover 32.41%1
Gross Expense Ratio 1.28%After Fee Waiver, Reimbursement and Recoupment 1.30%2
BenchmarkMSCI AC Asia Pacific Index
Redemption Fee2% within first 90 calendar daysof purchase
OBJECTIVE
Total return with an emphasis onproviding current income.
STRATEGY
Under normal market conditions, theFund seeks to achieve its investmentobjective by investing at least 80% ofits total net assets, which includeborrowings for investment purposes,in income-paying equity securities ofcompanies located in the Asia Pacificregion.
ASIA GROWTH ANDINCOME STRATEGIES
(continued)
1 The lesser of fiscal year 2009 long-term purchasecosts or sales proceeds divided by the averagemonthly market value of long-term securities.
2 The Advisor has contractually agreed to waive certainfees and reimburse certain expenses for MatthewsAsia Dividend Fund. Please see page 89 for additionalinformation. Matthews Asia Funds does not charge12b-1 fees.
PERFORMANCE AS OF DECEMBER 31, 2009Average Annual Total Returns
Inception 3 Months 1 Year 3 Year 10/31/06
Matthews Asia Dividend Fund 7.53% 47.59% 8.86% 11.00%
MSCI AC Asia Pacific Index3 2.31% 37.86% -2.65% -0.56%
Lipper Pacific Region Funds Category Average4 3.84% 38.40% -3.49% -0.97%
Performance assumes reinvestment of all dividends and/or distributions before taxes. All performance quoted represents past performance andis no guarantee of future results. Investment return and principal value will fluctuate with market conditions so that when redeemed, shares may beworth more or less than their original cost. Current performance may be lower or higher than the return figures quoted. Returns would have beenlower if certain of the Fund’s fees and expenses had not been waived. For the Fund’s most recent month-end performance visit matthewsasia.com.
INCOME DISTRIBUTION HISTORYQ1 Q2 Q3 Q4 Total
2009 $0.10 $0.14 $0.13 $0.18 $0.55
2008 $0.06 $0.08 $0.11 $0.06 $0.30
2007 — $0.10 — $0.17 $0.27
2006 (Fund inception: 10/31/06) — — — $0.02 $0.02
Note: This table does not include capital gains distributions. In March 2008, the Fund began to distribute investment income dividends on a quarterly rather than semi-annual basis. Foradditional details regarding Fund distributions, visit matthewsasia.com.
GROWTH OF A $10,000 INVESTMENT SINCE INCEPTION
Plotted monthly. The performance data and graph do not reflect the deduction of taxes that a shareholder would pay on dividends, capital gain distributions or redemption of Fundshares. Values are in US$.3 It is not possible to invest directly in an index. Source: Index data from Morgan Stanley Capital Management; total return calculations performed by PNC Global Investment
Servicing (U.S.) Inc. Please see page 59 for index definition.4 The Lipper Category Average does not reflect sales charges and is based on total return, including reinvestment of dividends and capital gains for the stated periods.
TOP TEN HOLDINGS5
Country % of Net Assets
SK Telecom Co., Ltd. South Korea 3.1%
China Mobile, Ltd. China/Hong Kong 3.1%
Chunghwa Telecom Co., Ltd. Taiwan 3.0%
Globe Telecom, Inc. Philippines 2.9%
PT Telekomunikasi Indonesia Indonesia 2.7%
Cheung Kong Infrastructure Holdings, Ltd. China/Hong Kong 2.5%
HSBC Holdings PLC United Kingdom 2.4%
Monex Group, Inc. Japan 2.3%
Esprit Holdings, Ltd. China/Hong Kong 2.3%
Minth Group, Ltd. China/Hong Kong 2.2%
% OF ASSETS IN TOP TEN 26.5%5 Holdings may combine more than one security from same issuer and related depositary receipts.
$13,918 Matthews Asia Dividend Fund
$9,824 MSCI AC Asia Pacific Index3
$9,736 Lipper Pacific Regions Funds Category Average4
10/06 12/08 12/0912/07
$5,000
$10,000
$15,000
DIVIDEND YIELD: 3.78%The dividend yield (trailing) for the portfolio is the weighted average sum of thedividend paid per share during the last 12 months divided by the current price.The annualized dividend yield for the Fund is for the equity-only portion of theportfolio. Please note that this is based on gross portfolio holdings and does notreflect the actual yield an investor in the Fund would receive. Past yields are noguarantee of future yields.
Source: FactSet Research Systems.
30-DAY YIELD: 1.95%The 30-Day Yield represents net investment income earned by the Fund over the30-day period ended 12/31/09, expressed as an annual percentage rate based onthe Fund’s share price at the end of the 30-day period. The 30-Day Yield should beregarded as an estimate of the Fund’s rate of investment income, and it may notequal the Fund’s actual income distribution rate.
Source: PNC Global Investment Servicing (U.S.) Inc.
JOB: 10-1483-4 CYCLE#;BL#: 2; 0 TRIM: 8.25" x 10.75" COMPOSITECOLORS: Black, PANTONE 875 U, ~HTML color, ~HTML color 2, ~note-color 2, ~note-color 3 GRAPHICS: none V1.5
12 MATTHEWS ASIA FUNDS
COUNTRY ALLOCATION (%)6
China/Hong Kong 25.2
Japan 20.4
Taiwan 10.4
South Korea 8.5
Thailand 7.6
Singapore 6.2
Indonesia 4.7
Malaysia 4.5
Australia 3.3
Philippines 2.9
United Kingdom 2.4
Cash and Other Assets, Less Liabilities 3.9
SECTOR ALLOCATION (%)
Consumer Discretionary 19.8
Financials 14.9
Telecommunication Services 14.8
Information Technology 13.1
Consumer Staples 12.0
Health Care 7.7
Utilities 7.1
Industrials 5.0
Energy 1.7
Cash and Other Assets, Less Liabilities 3.9
MARKET CAP EXPOSURE (%)7
Large Cap (Over $5B) 37.8
Mid Cap ($1B-$5B) 34.3
Small Cap (Under $1B) 24.0
Cash and Other Assets, Less Liabilities 3.9
6 The United Kingdom is not included in the MSCIAll Country Asia Pacific Index.
7 Source: FactSet Research Systems. Percentagevalues in data are rounded to the nearest tenth ofone percent; the values may not sum to 100% dueto rounding.
to deliver growing earnings and dividends. The company raised its dividend by25% in 2009.
Dividend payments in Asia Pacific continued to exhibit significantly less volatil-ity than earnings, indicating that companies in the region are committed topaying dividends. While earnings for the constituents of the MSCI AC AsiaPacific Index more than halved, dividends fell by about 14%. In comparison,dividend payments for the S&P 500 Index are estimated to have fallen by 21%in 2009. Not surprisingly, dividend cuts in Asia Pacific mainly occurred amongcompanies in cyclical industries, such as materials, industrials and informationtechnology—many of which reside in Korea and Taiwan. The Fund tends tominimize exposure to cyclical companies because of this inherent volatility individend payments.
Dividend yields in the region compressed as markets rallied in response to theslowing pace of deteriorating economic data and fiscal stimulus packages com-bined with expansive monetary policies. With dividend yields falling to“pre-Lehman” levels, the price of dividend growth rose and, as a result, theFund increasingly allocated to companies that had lagged the general reboundin markets. This resulted in net additions, particularly in Japan and Korea, asthe year progressed, and to higher yielding large-cap companies such as ChinaMobile. The Fund will continue its focus on companies that offer attractive div-idend yields in relation to their potential for dividend growth.
Asia continues to offer attractive opportunities to dividend-focused investors,when compared to fixed-income yields or other regional equity markets glob-ally. Based on consensus estimates, the projected dividend yield for 2010 for theMSCI AC Asia Pacific Index of 2.5% exceeds the 2.0% expected of the MSCIU.S. Index. The relative stability of dividend payments in Asia Pacific in 2009and the region’s higher historical rate of dividend growth raises the question:Why should Asia Pacific dividends continue to trade at a discount to those ofthe U.S.? For long-term investors, we believe that companies in Asia Pacific con-tinue to offer an attractive combination of current yield, dividend growth anddiversification opportunities.
We are pleased to announce that in October, the Fund marked its third year ofoperation. We reached this milestone as a result of the long-term commitmentof our shareholders through some volatile market cycles. We thank you for yourongoing support and will continue to work hard on your behalf.
SOUTH KOREA: 8.5%KT&G Corp. 126,500 6,990,010SK Telecom Co., Ltd. ADR 346,300 5,630,838S1 Corp. 134,880 5,607,095Cheil Worldwide, Inc. 17,658 4,782,090SK Telecom Co., Ltd. 29,816 4,352,157Total South Korea 27,362,190
COMMON EQUITIES: 93.5%
Shares Value
THAILAND: 7.6%Thai Beverage Public Co., Ltd. 36,413,000 $6,349,939Siam Makro Public Co., Ltd. 1,830,000 4,797,215Major Cineplex Group Public Co., Ltd. 18,600,900 4,756,277Land & Houses Public Co., Ltd. NVDR 23,358,200 4,397,885Thai Tap Water Supply Public Co., Ltd. 31,646,200 4,241,530Total Thailand 24,542,846
SINGAPORE: 4.7%Venture Corp., Ltd. 767,000 4,811,615CapitaRetail China Trust, REIT 5,229,000 4,731,477Parkway Life REIT 4,695,868 4,059,137CapitaLand, Ltd. 555,000 1,646,442Total Singapore 15,248,671
INDONESIA: 4.7%PT Ramayana Lestari Sentosa 102,013,000 6,617,919PT Telekomunikasi Indonesia 4,466,000 4,445,573PT Telekomunikasi Indonesia ADR 102,900 4,110,855Total Indonesia 15,174,347
MALAYSIA: 4.5%Top Glove Corp. BHD 2,445,700 7,179,510Astro All Asia Networks PLC 5,570,000 4,863,061Media Prima BHD 4,931,200 2,398,642Total Malaysia 14,441,213
Portfolio Manager CommentaryThe Matthews China Dividend Fund was launched on November 30, 2009. Forthe month ending December 31, 2009, the Fund gained 1.80%, while its bench-mark, the MSCI China Index, rose 0.46%.
The deepening of the Chinese equity market, and the expanding universe ofthe country’s dividend-paying companies, made it possible for Matthews topursue a scalable dividend investing strategy in China across a variety of indus-tries. The Matthews China Dividend Fund seeks to generate total return with anemphasis on providing current income by focusing on the significant and fast-growing number of dividend-paying companies in China. It leverages both ourexperience of investing in Chinese companies gained through our long trackrecord in China as well as the dividend-focused stock selection process of theMatthews Asia Dividend Fund.
While often overlooked, dividends are an essential component of total share-holder return for long-term investors in China. Since the inception of theMSCI China Index in December 1998, approximately 38% of its total return hasbeen derived from reinvested dividends. Even though the universe of dividendpaying companies in Asia Pacific, in general, has expanded significantly over thepast decade, the growth in Chinese dividend payments stands out. Aggregate div-idend payments grew from close to US$8 billion in 1998 to US$73 billion by2008. Importantly, US$57 billion of the total dividend payment in 2008 wasaccounted for by companies that had their initial public offering (IPO) after 1998.These IPOs were often by large-capitalization, state-owned enterprises (SOEs).While these companies still exhibit earnings growth, they are “mature” in thesense they have the business scale and financial strength to provide for dividendpayment right out of the gate. This is unlike IPOs in the U.S., which in generalare of smaller companies in need of capital for business expansion, and for whichdividends are but a distant goal.
The investment universe of dividend payers has also deepened with the overallgrowth of Chinese dividend payments, allowing dividend-focused investorsgreater diversification potential. The financial services sector (banks, insuranceand real estate) paid the most in absolute terms—approximately US$33 billion(or 45% of total payouts). Energy stocks paid out a combined total of US$14 billion(about 19% of payouts) and telecommunication services paid approximatelyUS$9 billion (12% of payouts). It is important to note that all sectors excepthealth care now offer sizeable dividend payments. By market capitalization, as ofAugust 2009, the majority, or 84%, of dividend payments in China were by large-cap companies. An estimated 12% came from mid-cap companies and 4% fromsmall-cap firms.
Similar to our Matthews Asia Dividend Fund, the Matthews China DividendFund seeks to invest in companies that we believe offer an attractive combina-tion of current dividend yield and growth in dividends. Our process begins byscreening companies for their ability to pay dividends, and researching theircompetitive advantages to assess the sustainability of cash flows, profit marginsand long-term dividend payments. Company visits and meetings with manage-ment are essential to our process. These meetings give us better insight into acompany’s business model as well as management’s thoughts about capitalallocation—particularly as they pertain to dividends. In constructing our port-folio, we consider valuation and diversification. We assess whether a company’scurrent price is attractive given both the current as well as the future yieldbased on our projections regarding dividend growth. We also consider whether
matthewsasia.com | 800.789.ASIA 15
PORTFOLIO MANAGERS
Jesper O. MadsenLead Manager
Richard GaoCo-Manager
FUND FACTS
Ticker MCDFXInception Date 11/30/09Assets $7.1 millionNAV $10.18Total # of Positions 34
Fiscal Year 2009 RatiosPortfolio Turnover 0.00%1
Gross Expense Ratio 10.05%After Fee Waiver, Reimbursement and Recoupment 1.50%2
BenchmarksMSCI China Index
Redemption Fee2% within first 90 calendar days ofpurchase
OBJECTIVE
Total return with an emphasis onproviding current income.
STRATEGY
Under normal market conditions, theFund seeks to achieve its investmentobjective by investing at least 80% ofits total net assets, which includeborrowings for investment purposes,in income-paying equity securities ofcompanies located in China andTaiwan. China Includes its administra-tive and other districts, such asHong Kong.
ASIA GROWTH AND INCOME STRATEGIES
(continued)
1 The lesser of fiscal year 2009 long-term purchasecosts or sales proceeds divided by the averagemonthly market value of long-term securities.
2 The Advisor has contractually agreed to waive certainfees and reimburse certain expenses for MatthewsChina Dividend Fund. Please see page 89 foradditional information. Matthews Asia Funds does notcharge 12b-1 fees.
PERFORMANCE AS OF DECEMBER 31, 2009Actual Return, Not Annualized
Inception11/30/09
Matthews China Dividend Fund 1.80%
MSCI China Index3 0.46%
Lipper China Funds Category Average4 2.16%
Performance assumes reinvestment of all dividends and/or distributions before taxes. All performance quoted represents past performanceand is no guarantee of future results. Investment return and principal value will fluctuate with market conditions so that when redeemed, sharesmay be worth more or less than their original cost. Current performance may be lower or higher than the return figures quoted. Returns wouldhave been lower if certain of the Fund’s fees and expenses had not been waived. For the Fund’s most recent month-end performance visitmatthewsasia.com.
The performance data does not reflect the deduction of taxes that a shareholder would pay on dividends, capital gain distributions or redemption of Fund shares. Values are in US$.
3 It is not possible to invest directly in an index. Source: Index data from Morgan Stanley Capital Management; total return calculations performed by PNC Global InvestmentServicing (U.S.) Inc. Please see page 59 for index definition.
4 The Lipper Category Average does not reflect sales charges and is based on total return, including reinvestment of dividends and capital gains for the stated periods.
TOP TEN HOLDINGS5
Sector % of Net Assets
China Mobile, Ltd. Telecommunication Services 5.2%
Cheung Kong Infrastructure Holdings, Ltd. Utilities 4.7%
6 Source: FactSet Research Systems. Percentagevalues in data are rounded to the nearest tenth ofone percent; the values may not sum to 100% dueto rounding.
the company is a better holding compared to current portfolio holdings orwhether it will improve the portfolio’s overall diversification.
The rationale for launching an additional China-focused fund was based on thepremise that when investing in China, strategy matters depending on theinvestor’s risk/return profile. Furthermore, China’s equity markets now allowinvestors to pursue various strategies within the same geographic region, just asthey would in the U.S. The Fund’s distinct focus on yield and dividend growthis likely to result in a relatively high allocation to conservative business models,such as the utilities and telecommunication sectors, which exhibit strong bal-ance sheets and stable cash flows. That said, as the Fund seeks dividend growth,its allocation to smaller-cap companies will likely be higher relative to thebenchmark, as well as higher than that of our growth-oriented Matthews ChinaFund. These companies, while often exhibiting strong growth potential, alsocome with greater share price volatility. Investors should expect the Fund tohave the higher volatility associated with a single-country or small companyfund.
Dividend yields in China and Hong Kong have compressed throughout 2009 asa result of positive stock market gains. However, Chinese equities continue tooffer attractive opportunities to dividend-focused investors given their yieldand dividend growth potential. We believe that companies in China offer anattractive combination of current yield, dividend growth and diversification forlong-term investors.
Portfolio Manager CommentaryFor the year ending December 31, 2009, the Matthews Asia Pacific Fund gained44.82%, while its benchmark, the MSCI All Country Asia Pacific Index rose37.86%. For the fourth quarter, the Fund returned 5.87%, compared to a 2.31%rise for the benchmark.
Consumer discretionary stocks were the main drivers of performance, specificallyauto-related companies. Our decision early in the year to increase holdings incyclical sectors, such as autos and real estate, served the Fund well. In addition,our increased exposure to China, Korea and Taiwan also benefited the Fundthroughout the year. As we have previously reported, we repositioned the portfo-lio at the end of 2008 to be concentrated in fewer holdings. This shift contributedto Fund performance in 2009.
2009 was a good year to be invested in China despite concerns about the paceof the country’s GDP growth. In addition, India’s market received a boost fromthe landslide victory of the Indian National Congress in its general elections.Asian markets were buoyed by these two economies, indicating the intercon-nectedness of countries in the region. Exchange rates played a significant rolein market movements this year: the Korean won remained weak from the endof 2008 through the first half of 2009, relative to both the U.S. dollar and theyen, providing Korean manufacturers a competitive advantage against theirJapanese peers. Chinese manufacturers were able to maintain cost advantages asChina’s yuan remained unchanged against the falling U.S. dollar.
Though we generally minimize exposure to cyclical sectors, the portfolio soughtto capture some of the secular growth taking place in markets like China, Indiaand Indonesia, particularly via increasing auto sales. We seek to identify compa-nies that will provide the best exposure to Asia’s growing auto industry. Oneholding is Hyundai Motor, a Korean manufacturer with significant sales in Chinaand India. Another is China’s Dongfeng Motor Group. The company is the mainjoint venture partner with Japan’s Nissan Motor and Honda Motor, and manufac-tures Japanese cars and trucks for the Chinese market. The Fund also holds AstraInternational, an Indonesian conglomerate with an automotive arm. The firmhas a dominant market share in the domestic sale of Japanese cars and trucks inIndonesia.
Among the Fund’s worst performers during the year were Japanese financialstocks, though the portfolio minimized exposure to the sector in Japan. Specifi-cally, the investment bank GCA Savvian Group and financial services groupORIX were down for the year due to the global credit crunch that persistedthroughout the year and the ongoing weakness of Japan’s economy. Holdingsin the consumer staples sector also detracted from Fund performance, partlydue to their defensive nature and partly because of their outperformance in2008. Japan’s Unicharm Petcare was one such company that did not perform aswell in 2009 as it had in previous years. However, it remains a Fund holding asthe company still boasts high margins and very strong returns on investment.
Despite the fact that Japan’s economy remains weak, we believe Japanese stocksare still undervalued and we continue to find compelling investment opportu-nities on a company-by-company basis, especially Japanese companies that arecapitalizing on growth within Asia.
We continue to seek investment opportunities that are poised to benefit fromthe region’s continuing integration. A core holding of the Fund, Tingyi Holding,is quickly becoming one of the better-known Chinese food and beveragecompanies in the region. The firm is worth highlighting as it is not only a solid
20 MATTHEWS ASIA FUNDS
PORTFOLIO MANAGERS
Taizo IshidaLead Manager
Sharat Shroff, CFACo-Manager
FUND FACTS
Ticker MPACXInception Date 10/31/03Assets $227.7 millionNAV $14.29Total # of Positions 60
Fiscal Year 2009 RatiosPortfolio Turnover 58.10%1
Gross Expense Ratio 1.28%2
BenchmarkMSCI AC Asia Pacific Index
Redemption Fee2% within first 90 calendar days ofpurchase
OBJECTIVE
Long-term capital appreciation.
STRATEGY
Under normal market conditions, theFund seeks to achieve its investmentobjective by investing at least 80% ofits total net assets, which includeborrowings for investment purposes,in the common and preferred stocks ofcompanies located in the Asia Pacificregion. The Fund may also invest inthe convertible securities, of anyduration or quality, of Asia Pacificcompanies.
ASIA GROWTH STRATEGIES
(continued)
1 The lesser of fiscal year 2009 long-term purchasecosts or sales proceeds divided by the averagemonthly market value of long-term securities.
PERFORMANCE AS OF DECEMBER 31, 2009Average Annual Total Returns
Inception3 Month 1 Year 3 Year 5 Year 10/31/03
Matthews Asia Pacific Fund 5.87% 44.82% 0.46% 7.18% 9.86%
MSCI AC Asia Pacific Index3 2.31% 37.86% -2.65% 5.94% 8.51%
Lipper Pacific Regions Fund Category Average4 3.84% 38.40% -3.49% 6.23% 8.34%
Performance assumes reinvestment of all dividends and/or distributions before taxes. All performance quoted represents past performanceand is no guarantee of future results. Investment return and principal value will fluctuate with market conditions so that when redeemed, sharesmay be worth more or less than their original cost. Current performance may be lower or higher than the return figures quoted. Returns wouldhave been lower if certain of the Fund’s fees and expenses had not been waived. For the Fund’s most recent month-end performance visitmatthewsasia.com.
GROWTH OF A $10,000 INVESTMENT SINCE INCEPTION
Plotted monthly. The performance data and graph do not reflect the deduction of taxes that a shareholder would pay on dividends, capital gain distributions or redemption of Fundshares. Values are in US$.
3 It is not possible to invest directly in an index. Source: Index data from Morgan Stanley Capital Management; total return calculations performed by PNC Global InvestmentServicing (U.S.) Inc. Please see page 59 for index definition.
4 The Lipper Category Average does not reflect sales charges and is based on total return, including reinvestment of dividends and capital gains for the stated periods.
TOP TEN HOLDINGS5
Country % of Net Assets
Ctrip.com International, Ltd. China/Hong Kong 3.8%
Sysmex Corp. Japan 3.1%
Softbank Corp. Japan 3.0%
The Japan Steel Works, Ltd. Japan 3.0%
CSL Australia, Ltd. Australia 3.0%
PT Astra International Indonesia 2.7%
Tingyi (Cayman Islands) Holding Corp. China/Hong Kong 2.6%
HDFC Bank, Ltd. India 2.5%
PT Bank Rakyat Indonesia Indonesia 2.3%
China Life Insurance Co., Ltd. China/Hong Kong 2.3%
% OF ASSETS IN TOP TEN 28.3%
5 Holdings may combine more than one security from same issuer and related depositary receipts.
6 Source: FactSet Research Systems. Percentagevalues in data are rounded to the nearest tenth ofone percent; the values may not sum to 100% dueto rounding.
company, but also exemplifies the type of business we seek. Though Tingyi isclassified as a Chinese company, listed in Hong Kong, and serves the Chinesemarket, it is quintessentially Asian from our perspective. Built around a superbmanagement team of both Taiwanese and Japanese executives, the companyutilizes the most advanced technology and know-how from all over the worldfor its two main businesses—instant noodles and packaged beverages. Bothbusinesses are partnered with Japanese firms—privately held Sanyo Foods for itsnoodle products and Asahi Breweries for Tingyi’s beverage arm. This seems tobe a mutually beneficial strategy for all companies involved. Notably, Tingyi’smarket capitalization has grown from US$5.5 billion at the beginning of 2007to US$13 billion at the end of 2009. In addition, it is one of the few consumerstaples companies to do well last year in what was a poorly performing sector.
Though we remain strongly convinced of Asia’s long-term growth prospects,the market may pay more attention to changes in the cost of capital in 2010 aswe expect these costs to increase over the medium term. We will closely moni-tor the basic policy rates of each central bank in the region. Both fixed costs,such as labor, and the variable cost of materials may also rise due to potentialinflationary pressures. We expect there to be an increased focus on earningsannouncements as earnings growth is likely to be the ultimate test for some ofstocks that have seen valuations soar in 2009.
JAPAN: 31.5%Sysmex Corp. 134,700 $7,043,061Softbank Corp. 296,100 6,941,393The Japan Steel Works, Ltd. 537,000 6,847,326Pigeon Corp. 121,500 4,757,598ORIX Corp. 67,690 4,608,624Nintendo Co., Ltd. 19,100 4,561,787Benesse Holding, Inc. 100,900 4,218,729Komatsu, Ltd. 188,900 3,954,465Asahi Breweries, Ltd. 213,100 3,924,734Fanuc, Ltd. 41,900 3,905,164MID REIT, Inc. 1,832 3,878,477Monex Group, Inc. 9,218 3,156,628Keyence Corp. 14,930 3,098,626Unicharm Petcare Corp. 100,400 3,066,690Mori Trust Sogo REIT, Inc. 364 2,930,733FamilyMart Co., Ltd. 88,100 2,600,852Mitsubishi UFJ Financial Group, Inc. ADR 216,100 1,063,212GCA Savvian Group Corp. 991 1,053,133Total Japan 71,611,232
CHINA/HONG KONG: 27.5%Ctrip.com International, Ltd. ADRb 119,200 8,565,712Tingyi (Cayman Islands) Holding Corp. 2,370,000 5,864,562China Life Insurance Co., Ltd. H Shares 1,049,000 5,133,044China Merchants Bank Co., Ltd. H Shares 1,594,450 4,148,602China Vanke Co., Ltd. B Shares 3,319,787 4,148,181Hong Kong Exchanges and Clearing, Ltd. 228,900 4,072,680Shangri-La Asia, Ltd. 2,096,000 3,927,031Hang Lung Group, Ltd. 782,000 3,867,397Dongfeng Motor Group Co., Ltd. H Shares 2,460,000 3,512,796China Mobile, Ltd. 375,000 3,489,191Kingdee International Software Group
Co., Ltd. 14,118,000 3,143,920Shanda Games, Ltd. ADRb 282,800 2,881,732Dairy Farm International Holdings, Ltd. 477,354 2,850,997China South Locomotive and Rolling Stock
Corp. H Shares 3,334,900 2,435,371Sany Heavy Equipment International
Holdings Co., Ltd.b 1,456,000 1,842,206Shandong Weigao Group Medical Polymer
Co., Ltd. H Shares 504,000 1,679,691New Oriental Education & Technology
Group, Inc. ADRb 14,100 1,066,101Total China/Hong Kong 62,629,214
INDIA: 7.1%HDFC Bank, Ltd. 126,958 4,626,023Jain Irrigation Systems, Ltd. 231,623 4,322,487Bharti Airtel, Ltd. 479,493 3,387,986Sun Pharmaceutical Industries, Ltd. 83,845 2,710,402HDFC Bank, Ltd. ADR 9,000 1,170,720Total India 16,217,618
COMMON EQUITIES: 97.6%
Shares Value
INDONESIA: 6.7%PT Astra International 1,667,500 $6,130,388PT Bank Rakyat Indonesia 6,401,500 5,145,099PT Telekomunikasi Indonesia 4,104,500 4,085,727Total Indonesia 15,361,214
SOUTH KOREA: 3.9%Kiwoom Securities Co., Ltd. 89,246 3,210,473NHN Corp.b 18,752 3,099,292LG Electronics, Inc. 23,758 2,476,729Total South Korea 8,786,494
THAILAND: 3.4%Major Cineplex Group Public Co., Ltd. 17,056,000 4,361,244Siam Commercial Bank Public Co., Ltd. 1,264,400 3,290,355Total Thailand 7,651,599
Portfolio Manager CommentaryFor the year ending December 31, 2009, the Matthews Pacific Tiger Fund gained75.37%, while its benchmark, the MSCI All Country Asia ex Japan Index,increased by 72.53%. More than half of these gains were recorded in the secondquarter underscoring the virtues of staying fully invested through some of theworst periods in the history of Asia ex-Japan’s equity market. The outperfor-mance relative to the benchmark was driven by consumer stocks in China andIndonesia, while the portfolio’s underweight in energy and materials stockshurt relative performance.
The consumer in Asia, particularly in China, continues to be a driver of theregion’s growth. The Fund’s primary emphasis is on investing in companies thatbenefit from spending related to the consumption of staples such as food itemsand personal care—areas we added to in 2009. We remain convinced of the secu-lar growth that is underpinned by a rise in household income and believe it willcontinue for several years. If anything, the recent crisis has highlighted thebreadth and depth of the Chinese economy: even as some of China’s coastal andsouthern cities were experiencing slow to negative growth, western areas of thecountry and its other smaller cities registered sustained momentum helped bygovernment programs. These cities saw a rise in prices of food commodities overthe last few years and better availability of credit. As we enter 2010, we remainfocused on leveraging opportunities arising from the advancement of social infra-structure programs needed to spur domestic consumption across the region, mostnotably in China.
In the face of one of the worst crises to hit the global economy, Asian consumers,particularly in China, India and Indonesia, demonstrated their strength andresilience. The portfolio’s automotive holdings in China and Indonesia were upsignificantly as the year progressed, benefiting from government subsidy pro-grams, growing consumer income and a low interest rate environment. Duringthe year, China eclipsed the U.S. as the world’s largest market for auto sales—thisnews sparked a sharp recovery in Dongfeng Motor Group. This outcome is instark contrast to the severe decline the stock suffered in 2008 when it was beingpriced for value destruction. After Dongfeng’s outperformance last year, valua-tions are pricing in some fairly high growth expectations for the company. Whilewe believe Dongfeng’s business model and management team are key drivers ofshareholder value creation, we do not intend to overpay for the company’s earn-ings or production capacity.
The Fund’s financial holdings were positive contributors for the year, due pri-marily to a sharp recovery in real estate stocks. Beyond the ongoing demand forresidential housing in economies such as China and India, some importantstructural reforms took place that may benefit commercial property owners. InOctober, China amended legislation to allow insurance companies to invest agreater percentage of their assets in properties. Across the region, the risks asso-ciated with real estate stocks stem from monetary policies being pursuedoutside Asia. In particular, if the U.S. Federal Reserve persists with a loose mon-etary policy then the odds of an acceleration in overseas inflows to Asia’scapital markets increases. This could then lead to overvaluation and asset pricesthat deviate from fundamentals. There is already some evidence, albeit spotty,of lofty prices being paid for residential real estate in Hong Kong and in somecities in China. For the most part, prices across a broader segment of cities inChina and India are still rising in more controlled fashion. We remain alert tothe risks of a “melt up” and continue to monitor the quality of the underlyingassets within each of our investments.
matthewsasia.com | 800.789.ASIA 25
PORTFOLIO MANAGERS
Richard H. GaoLead Manager
Sharat Shroff, CFALead Manager
Mark W. HeadleyCo-Manager
FUND FACTS
Ticker MAPTXInception Date 9/12/94Assets $3.6 billionNAV $19.23Total # of Positions 76
Fiscal Year 2009 RatiosPortfolio Turnover 13.22%1
Gross Expense Ratio 1.13%2
BenchmarksMSCI AC Asia ex Japan IndexMSCI AC Far East ex Japan Index
Redemption Fee2% within first 90 calendar daysof purchase
OBJECTIVE
Long-term capital appreciation.
STRATEGY
Under normal market conditions, theFund seeks to achieve its investmentobjective by investing at least 80% ofits total net assets, which includeborrowings for investment purposes,in the common and preferred stocks ofcompanies located in Asia, excludingJapan.
ASIA GROWTH STRATEGIES
(continued)
1 The lesser of fiscal year 2009 long-term purchasecosts or sales proceeds divided by the averagemonthly market value of long-term securities.
PERFORMANCE AS OF DECEMBER 31, 2009Average Annual Total Returns
Inception3 Months 1 Year 3 Years 5 Years 10 Years 9/12/94
Matthews Pacific Tiger Fund 7.60% 75.37% 8.10% 14.50% 11.55% 9.13%
MSCI AC Asia ex Japan Index3 6.59% 72.53% 5.02% 13.79% 6.55% 3.62%4
MSCI AC Far East ex Japan Index3 6.46% 69.39% 4.79% 13.13% 5.92% 3.25%4
Lipper Pacific ex Japan Fund Category Average5 6.49% 71.34% 4.72% 13.05% 7.53% 5.22%4
Performance assumes reinvestment of all dividends and/or distributions before taxes. All performance quoted represents past performanceand is no guarantee of future results. Investment return and principal value will fluctuate with market conditions so that when redeemed, sharesmay be worth more or less than their original cost. Current performance may be lower or higher than the return figures quoted. Returns wouldhave been lower if certain of the Fund’s fees and expenses had not been waived. For the Fund’s most recent month-end performance visitmatthewsasia.com.
GROWTH OF A $10,000 INVESTMENT SINCE INCEPTION
Plotted monthly. The performance data and graph do not reflect the deduction of taxes that a shareholder would pay on dividends, capital gain distributions or redemption of Fundshares. Values are in US$.
3 It is not possible to invest directly in an index. Source: Index data from Morgan Stanley Capital Management; total return calculations performed by PNC Global InvestmentServicing (U.S.) Inc. Please see page 59 for index definitions.
4 Calculated from 8/31/94.
5 The Lipper Category Average does not reflect sales charges and is based on total return, including reinvestment of dividends and capital gains for the stated periods.
TOP TEN HOLDINGS6
Country % of Net Assets
LS Corp. South Korea 2.6%
Hang Lung Group, Ltd. China/Hong Kong 2.5%
Tencent Holdings, Ltd. China/Hong Kong 2.4%
PT Bank Central Asia Indonesia 2.4%
HDFC Bank, Ltd. India 2.3%
Hon Hai Precision Industry Co., Ltd. Taiwan 2.2%
PT Telekomunikasi Indonesia Indonesia 2.2%
Swire Pacific, Ltd. A Shares China/Hong Kong 2.2%
Ctrip.com International, Ltd. China/Hong Kong 2.1%
Tingyi (Cayman Islands) Holding Corp. China/Hong Kong 2.0%
% OF ASSETS IN TOP TEN 22.9%
6 Holdings may combine more than one security from same issuer and related depositary receipts.
$38,073 Matthews Pacific Tiger Fund
$17,261 MSCI AC Asia ex Japan Index3,4
$16,327 MSCI AC Far East ex Japan Index3,4
$22,372 Lipper Pacific ex Japan Funds Category Average4,5
7 Source: FactSet Research Systems. Percentagevalues in data are rounded to the nearest tenth ofone percent; the values may not sum to 100% dueto rounding.
While we do not select stocks based on political outcomes, there were impor-tant political transitions in 2009, and a number of events that impacted stockperformance in the region. Taiwan’s relations with China are improving andthere were some tangible developments in normalizing cross-strait trade andeconomic integration, including the first instance of a Chinese telecom com-pany investing directly in Taiwan. Stronger capital links between the twoeconomies should benefit both countries, including Taiwan’s Yuanta FinancialHoldings, a new Fund holding. Yuanta is also one of Taiwan’s largest brokeragefirms with a market share of around 12%—nearly double that of the second-largest player. The firm is trying to position itself to benefit from the opening offinancial markets in China following progress on an Economic Cooperationand Framework Agreement between China and Taiwan in 2009. There may besetbacks and delays in cooperation between the two sides, but we take comfortin Yuanta’s dominance in its home market.
Elsewhere, results from general elections in India and Indonesia in 2009 pro-vided a boost to the equity markets in those countries, and may set the stage fora longer-term pick up in investment spending. Coupled with the domesticallydriven nature of both these economies, the election results sparked a sharp rallythat lifted several different asset classes, local currencies being one of them.Indonesia’s rupiah was one of the best-performing currencies in 2009, and bondyields there have also tightened sharply. Despite reasons to be optimistic aboutIndonesia, inflation remains among the risks, and it was not so long ago—theend of 2008—that the rupiah depreciated by almost 35% in a single month.Our holdings in Indonesia are, therefore, more defensively oriented.
At the start of the year, we argued that “sudden withdrawal of foreign investorscan often lead to a dislocation between fundamentals and stock prices,” and itseems that we have come full circle. In today’s environment, the risk stemsfrom investors rushing into Asia, attracted by enticing headlines and past per-formance. It is important to note that valuation levels are at or above historicalaverages. We remain committed to a discipline that searches for long-termgrowth but strives to avoid overvalued assets. This can be challenging wheninvestors fixate on a particular country or sector over a short-term horizon. Aswe look ahead to the next decade, it seems clear that Asia is entering a period ofsomewhat more mature growth relative to its own history, but one that couldbe more profitable. In building the portfolio for the next decade, we believethat the best ideas may emanate from areas that are not obvious at present. Wewill continue to canvas all of Asia ex-Japan, including some of the region’ssmaller markets, for compelling long-term investment opportunities.
B Shares 11,949,117 19,863,645Baidu, Inc. ADRb 42,000 17,271,660Sinopharm Group Co., Ltd. H Sharesb 1,256,400 4,420,622Total China/Hong Kong 1,284,846,219
INDIA: 18.1%HDFC Bank, Ltd. 1,997,184 72,772,246Housing Development Finance Corp. 1,087,137 62,200,585Tata Power Co., Ltd. 1,935,014 56,940,000Sun Pharmaceutical Industries, Ltd. 1,665,363 53,835,094Infosys Technologies, Ltd. 948,401 52,783,363Unitech, Ltd. 27,649,406 48,621,587Kotak Mahindra Bank, Ltd. 2,787,941 48,032,819Bharti Airtel, Ltd. 5,563,480 39,310,253Larsen & Toubro, Ltd. 1,069,599 38,509,989Dabur India, Ltd. 10,030,888 34,049,028Titan Industries, Ltd. 989,621 30,124,603Glenmark Pharmaceuticals, Ltd. 4,529,022 26,756,814Sintex Industries, Ltd. 4,505,656 26,467,976Sun TV Network, Ltd. 3,402,590 24,920,788Infosys Technologies, Ltd. ADR 219,611 12,137,900ICICI Bank, Ltd. ADR 226,800 8,552,628HDFC Bank, Ltd. ADR 63,900 8,312,112Total India 644,327,785
COMMON EQUITIES: 98.3%
Shares Value
SOUTH KOREA: 16.1%LS Corp. 943,281 $93,830,152Hyundai Mobis 485,000 71,071,508POSCO 123,000 64,866,694NHN Corp.b 379,802 62,772,892Amorepacific Corp. 65,152 52,257,005Cheil Worldwide, Inc. 177,154 47,976,350Yuhan Corp. 289,321 44,225,229MegaStudy Co., Ltd. 193,231 39,721,848Hana Financial Group 1,057,923 29,901,462Hyundai Development Co. 776,952 25,158,015Samsung Securities Co., Ltd. 426,989 23,115,823S1 Corp. 427,918 17,788,975Total South Korea 572,685,953
TAIWAN: 8.1%Hon Hai Precision Industry Co., Ltd. 17,104,492 79,991,826Taiwan Semiconductor Manufacturing
INDONESIA: 6.1%PT Bank Central Asia 166,625,000 85,289,819PT Telekomunikasi Indonesia 67,960,500 67,649,661PT Astra International 14,665,230 53,915,173PT Telekomunikasi Indonesia ADR 275,700 11,014,215Total Indonesia 217,868,868
MALAYSIA: 4.6%Genting BHD 24,807,700 52,877,192KNM Group BHD 172,000,000 38,320,435Top Glove Corp. BHD 12,587,980 36,952,828Public Bank BHD 10,679,337 35,213,623Total Malaysia 163,364,078
THAILAND: 4.2%Bank of Ayudhya Public Co.,
Ltd. NVDR 83,968,600 56,757,590Land & Houses Public Co., Ltd. 224,719,500 44,811,948Central Pattana Public Co., Ltd. 43,346,100 26,395,259Land & Houses Public Co., Ltd. NVDR 122,450,000 23,054,902Total Thailand 151,019,699
Portfolio Manager CommentaryFor the year ending December 31, 2009, the Matthews China Fund gained78.30%, outperforming its benchmark, the MSCI China Index, which rose62.63%. Strong momentum for Chinese equities continued in the fourth quar-ter, with the Fund advancing 11.89%, versus the benchmark gain of 9.56%.
After performing poorly in 2008 amid the widespread global financial crisis, Chi-nese stocks staged a robust comeback in 2009, and China demonstrated that itseconomy can be driven by internal growth, rather than relying on exports.Although official numbers have yet to be released, China should be able toachieve its goal of maintaining GDP growth of 8% for the year. Fixed-assetinvestments and consumption were key drivers of China’s growth; however, thetraditionally important export sector became a drag on growth. China’s US$590billion stimulus program played a key role in boosting the economy throughvarious areas of infrastructure, and the purchasing power of Chinese consumersthat was triggered by the program was quite impressive. Domestic demand inareas ranging from automotives to luxury goods, electronic appliances and realestate recovered rapidly during the year.
China’s increasing internal growth bodes well for the Fund, which has longheld overweight positions in the country’s consumer-related sectors in anticipa-tion of growing domestic consumption. This year, the strategy was particularlyrewarding. The Fund’s holdings in the consumer discretionary, consumer sta-ples, information technology and financials sectors contributed the majority ofthe portfolio’s gains.
One investment criteria for the Fund’s domestic-oriented holdings is that they areeither a leader in their industry or have the potential to be a leader with impres-sive brand recognition. Although the Chinese consumer sector offers stronggrowth potential, it is also very competitive and, in many cases, fragmented.Only industry leaders with strong branding are most likely to survive. One of theFund’s holdings, Ports Design, has become one of China’s most recognized high-end fashion brands. Originally a lesser-known Canadian manufacturer ofwomen’s and men’s clothing and accessories, Ports Design entered the Chinesemarket in the early 1990s. The company hired top international designers—basedoverseas—imported all its raw materials from Europe and positioned itself as aluxury brand. The company manufactures all its products in China with a highlevel of quality control. As an early entrant to the country, the firm graduallybuilt up its brand name through advertising placements, sponsorships and storeopenings in prime locations in major Chinese cities. Today, Ports Design enjoys ahigh profit margin and exemplifies the rewards to shareholders of successfulbrand building.
In the financial sector, China took some noteworthy steps during the year tofurther open its capital markets to both domestic and foreign investors. ANASDAQ-style exchange for start-ups was launched in Shenzhen, opening upa new source of funding for entrepreneurs. China is also actively preparing tocreate an international exchange that would enable foreign companies to belisted domestically in the country. Meanwhile, China continues to be one ofthe most active places for initial public offerings (IPOs), providing investorsmore opportunities with its expanding stock market universe. A total ofUS$55 billion was raised through Chinese IPOs on both domestic and over-seas markets during the year and the Fund participated in several of them.
An IPO we invested in was Sinopharm Group. For years, the Fund has soughtinvestments in China’s growing health care industry—a sector in which it can
30 MATTHEWS ASIA FUNDS
PORTFOLIO MANAGERS
Richard H. GaoLead Manager
Andrew FosterCo-Manager
FUND FACTS
Ticker MCHFXInception Date 2/19/98Assets $2.6 billionNAV $25.50Total # of Positions 65
Fiscal Year 2009 RatiosPortfolio Turnover 5.28%1
Gross Expense Ratio 1.21%2
BenchmarkMSCI China Index
Redemption Fee2% within first 90 calendar days ofpurchase
OBJECTIVE
Long-term capital appreciation.
STRATEGY
Under normal market conditions, theFund seeks to achieve its investmentobjective by investing at least 80% ofits total net assets, which includeborrowings for investment purposes,in the common and preferred stocks ofcompanies located in China andTaiwan. China includes itsadministrative and other districts, suchas Hong Kong.
ASIA GROWTH STRATEGIES
(continued)
1 The lesser of fiscal year 2009 long-term purchasecosts or sales proceeds divided by the averagemonthly market value of long-term securities.
Performance assumes reinvestment of all dividends and/or distributions before taxes. All performance quoted represents past performanceand is no guarantee of future results. Investment return and principal value will fluctuate with market conditions so that when redeemed, sharesmay be worth more or less than their original cost. Current performance may be lower or higher than the return figures quoted. Returns wouldhave been lower if certain of the Fund’s fees and expenses had not been waived. For the Fund’s most recent month-end performance visitmatthewsasia.com.
GROWTH OF A $10,000 INVESTMENT SINCE INCEPTION
Plotted monthly. The performance data and graph do not reflect the deduction of taxes that a shareholder would pay on dividends, capital gain distributions or redemption of Fundshares. Values are in US$.
3 It is not possible to invest directly in an index. Source: Index data from Morgan Stanley Capital Management; total return calculations performed by PNC Global InvestmentServicing (U.S.) Inc. Please see page 59 for index definition.
4 Calculated from 2/28/98.
5 The Lipper Category Average does not reflect sales charges and is based on total return, including reinvestment of dividends and capital gains for the stated periods.
6 Holdings may combine more than one security from same issuer and related depositary receipts.
7 SAR (Hong Kong) companies are companies that conduct business in Hong Kong and/or mainland China. H Shares are mainland China companies listed on the Hong Kongexchange but incorporated in mainland China. China-affiliated corporations (CAC), also known as “Red Chips,” are mainland China companies with partial state ownership listedin Hong Kong, and incorporated in Hong Kong. Overseas Listed (OL) companies are companies that conduct business in mainland China but listed in overseas markets such asJapan, Singapore, Taiwan and the United States. B Shares are mainland Chinese companies listed on the Shanghai and Shenzhen stock exchanges, available to both Chinese andnon-Chinese investors.
CHINA EXPOSURE7
SAR (Hong Kong) 40.1%
H Share 33.8%
China-affiliated Corporations 15.4%
Overseas Listed 7.5%
B Share 1.5%
Cash and Other Assets, Less Liabilities 1.7%
TOP TEN HOLDINGS6
% of NetSector Assets
Dongfeng Motor Group Co., Ltd. Consumer Discretionary 3.4%
8 Source: FactSet Research Systems. Percentagevalues in data are rounded to the nearest tenth ofone percent; the values may not sum to 100% dueto rounding.
be difficult to find solid companies. The public offering this year ofSinopharm Group—China’s largest pharmaceutical distributor with a totalmarket share of about 11%—caught our attention. We were impressed by thecompany’s strong domestic distribution networks and successful track recordof acquisitions. We continue to look for other leaders in the health careindustry to add to the portfolio.
While the Fund’s main focus is growth, we are also cautious about valuationsand strive to ensure that we are not overpaying for this growth. The Fundbecame more aggressive in building its consumer and financial holdings; in par-ticular, we took advantage of a sell-off in the stock market in late 2008 andearly 2009 to add to property-related companies. Toward the end of 2009, afterour consumer holdings posted strong gains, we started to trim some of thesepositions and switched our focus to companies in industries such as telecom-munications and infrastructure. Valuations in these lagging industries arerelatively cheap while growth prospects remain intact. We also started to buildpositions in companies that we believe should benefit from the global eco-nomic recovery, including Li & Fung, a global apparel supply chain manager,and China Merchants Holdings International, a conglomerate that operatescontainer and cargo terminals, port transportation and container manufacturing.
As we enter 2010, the Chinese central bank raised its reserve ratio by 50 basispoints (0.50%) for the first time since June 2008, sending a clear signal aboutgovernment concerns over inflation and an overheating economy. China’seconomy expanded 8.9% in the third quarter of 2009, even as the bank lendingthat drove its recovery slowed. While economic growth continues to accelerate,China seems to be keenly aware of the negative side effects of excessive finan-cial liquidity that has mostly resulted from its earlier stimulus program. Webelieve that the central bank will continue to fine tune its expansionary policyand seek moderate loan growth while managing inflation. Drastic tighteningmeasures are not expected to occur in the near term as policymakers have reaf-firmed a moderately loose monetary policy.
† Affiliated Issuer, as defined under the Investment Company Act of 1940 (ownershipof 5% or more of the outstanding voting securities of this issuer). (Note 4)
Portfolio Manager CommentaryFor the year ending December 31, 2009, the Matthews India Fund gained 97.25%,while its benchmark, the Bombay Stock Exchange (BSE) 100 Index rose 95.83%,with most gains recorded in the first half of the year. In fact, the BSE 100 Indexsurged nearly 20% in a single day in May, reflecting investor excitement over theresults of India’s general elections. The Fund participated in the sharp single-daymove in Indian markets as we maintain a philosophy of being fully invested at alltimes.
During the fourth quarter, the Fund returned 10.95%, while its benchmarkincreased by 7.05%. The relative outperformance stemmed from some of theportfolio’s smaller and mid-size companies that benefited from better-than-expected earnings performance in the third quarter. Operating performance forthese companies, in sectors such as consumer staples and industrials, is particu-larly noteworthy as it provides a favorable contrast to the mixed performanceof their larger peers.
While 2008 was the worst year in the history of India’s equity market, 2009proved to be the second-best year of annual returns per the BSE 100 Index (only2003 posted better returns). The volatility in U.S. dollar-denominated returnswas especially exaggerated due to the fluctuation of the Indian rupee on theback of uneven foreign capital flows. We believe the past two years have shownit is difficult to predict the short-term course of the markets, and may be a fruit-less exercise to attempt. In periods of such turbulence, we have maintained ourdiscipline of investing in companies and businesses for the long term.
The volatility of capital and foreign exchange markets lies in stark contrast tothe relative stability of the Indian economy, which has grown at a mid-singledigit rate through the worst periods of the financial crisis and is recoveringfaster than many other world economies. The depth in the Indian economy hasbeen particularly visible in the past two years with the increasing importance ofrural spending as a component of the country’s overall personal consumption.The Fund strives to identify such emerging opportunities, and maintains astrategy of focusing on smaller and mid-size companies that are nimble enoughto benefit from such bottom-up growth.
This strategy was tested during the start of the year. In the aftermath of one ofthe worst corporate governance scandals to hit India, small and mid-size com-panies suffered a disproportionate decline in market capitalizations comparedto their larger peers. The decline was fairly broad-based with little differentia-tion between companies. In this environment, we stayed consistent with ourbelief of building portfolios anchored in the analysis of individual companies.It was our conviction in the sustainability of these businesses that enabled us tostay invested, and to participate in the rather steep recovery that followedthrough the rest of the year.
The Fund’s investment in Crompton Greaves, a manufacturer of power trans-mission and distribution equipment, demonstrates our approach of scoutingfor companies that may not be index heavyweights. Crompton Greaves hasbeen competing with more established multinational companies in India forthe last several decades. In recent years, the company has abandoned the “cost-plus” business model to focus on becoming technologically competitive withits multinational peers. In a sign of a calculated expansion strategy, the man-agement team has deployed its cash flows from existing businesses, and madeforeign acquisitions intended to enhance its technological expertise and keeppace with competitors. In spite of these promising acquisitions, and better
matthewsasia.com | 800.789.ASIA 35
PORTFOLIO MANAGERS
Sharat Shroff, CFALead Manager
Andrew FosterCo-Manager
FUND FACTS
Ticker MINDXInception Date 10/31/05Assets $720.9 millionNAV $16.29Total # of Positions 56
Fiscal Year 2009 RatiosPortfolio Turnover 18.09%1
Gross Expense Ratio 1.27%2
BenchmarkBombay Stock Exchange 100 Index
Redemption Fee2% within first 90 calendar days ofpurchase
OBJECTIVE
Long-term capital appreciation.
STRATEGY
Under normal market conditions, theFund seeks to achieve its investmentobjective by investing at least 80% ofits total net assets, which includeborrowings for investment purposes,in publicly traded common stocks,preferred stocks and convertiblesecurities of companies located inIndia.
ASIA GROWTH STRATEGIES
(continued)
1 The lesser of fiscal year 2009 long-term purchasecosts or sales proceeds divided by the averagemonthly market value of long-term securities.
Performance assumes reinvestment of all dividends and/or distributions before taxes. All performance quoted represents past performanceand is no guarantee of future results. Investment return and principal value will fluctuate with market conditions so that when redeemed, sharesmay be worth more or less than their original cost. Current performance may be lower or higher than the return figures quoted. Returns wouldhave been lower if certain of the Fund’s fees and expenses had not been waived. For the Fund’s most recent month-end performance visitmatthewsasia.com.
GROWTH OF A $10,000 INVESTMENT SINCE INCEPTION
Plotted monthly. The performance data and graph do not reflect the deduction of taxes that a shareholder would pay on dividends, capital gain distributions or redemption of Fundshares. Values are in US$.
3 It is not possible to invest directly in an index. Source: Index data from Morgan Stanley Capital Management; total return calculations performed by PNC Global InvestmentServicing (U.S.) Inc. Please see page 59 for index definition.
4 The Lipper Category Average does not reflect sales charges and is based on total return, including reinvestment of dividends and capital gains for the stated periods.
TOP TEN HOLDINGS5
Sector % of Net Assets
HDFC Bank, Ltd. Financials 4.5%
Infosys Technologies, Ltd. Information Technology 3.7%
Crompton Greaves, Ltd. Industrials 3.5%
Dabur India, Ltd. Consumer Staples 3.3%
Sun Pharmaceutical Industries, Ltd. Health Care 3.2%
Jain Irrigation Systems, Ltd. Industrials 3.0%
Reliance Industries, Ltd. Energy 2.9%
Container Corp. of India, Ltd. Industrials 2.9%
Gail India, Ltd. Utilities 2.8%
Asian Paints, Ltd. Materials 2.7%
% OF ASSETS IN TOP TEN 32.5%
5 Holdings may combine more than one security from same issuer and related depositary receipts.
6 Source: FactSet Research Systems. Percentagevalues in data are rounded to the nearest tenth ofone percent; the values may not sum to 100% dueto rounding.
operating performance, buyers of Crompton Greaves equities enjoy a valuationdiscount compared to its larger peers. With India’s peak power deficit rising to14% in recent years, there will likely be opportunities for Crompton Greaves tobenefit from rising investments in the power sector. At the same time, webelieve the real challenge for the management team is to continue to deploy itscash flow in accretive projects to sustain long-term returns for shareholders.
On a sector basis, the portfolio continues to maintain an overweight in indus-trials and a significant allocation to financials, which includes banks, insurancecompanies and real estate firms. As Indian banks posted stable results over sev-eral consecutive quarters, the perception of risk associated with global financialssubsided, and stocks in the sector recovered strongly. By contrast, the recoveryin the real estate sector seems more tenuous, and challenges stemming from alack of transparency remain a hurdle for investors. However, both residentialand commercial properties in the real estate sector are likely to grow at least inline with, if not faster than, the rest of the economy. One of the real estateholdings in the portfolio is Ascendas India Trust (AIT), a Singapore-listed firmwith commercial real estate holdings in southern India. We were attracted tothe stock’s yield of close to 10% last year as well as the company’s more robustaccounting and governing principles, relative to those typically found in India’sreal estate sector. One risk we will monitor is the limitations of AIT’sgeographical concentration.
Given the recent appreciation in India’s broader indices, valuations are at orslightly above historical averages. The volatility in the capital and foreignexchange markets underscores the importance of a longer investment horizonwhen investing in India. From that perspective, India offers much to be excitedabout. Compared with other emerging markets, India has a greater depth andbreadth in the quality of its companies, and entrepreneurs who are mindful ofreturns on equity. In addition, the country’s capital market infrastructure helpsfacilitate investment in these companies; firms which are driven mainly bydomestic demand.
Several challenges remain for the Indian economy, including the structuralchallenge of attracting more stable, long-term foreign capital, particularly as theeconomy embarks on a much-needed investment cycle. It is encouraging thatin the past two years, foreign direct investments (FDI) have accelerated sharplyto a rate of almost 2% of GDP, up from less than 1% at the start of the century.To put this in perspective, the Chinese economy was attracting FDI at a rate of4% to 6% of GDP during the investment-led growth of the 1990s. Beyond thechanges in global risk appetite, the gradual removal of regulatory hurdles hasbeen the biggest driver of this jump in FDI. India’s political transition earlierthis year set the stage for a continuation of these reforms, but history hasshown that progress can come haltingly and require close monitoring.
India’s more pressing and immediate risk stems from the prospect of a sharprise in inflationary expectations driven by a combination of structural andcyclical factors like the recent rise in food prices. The central bank has alreadystarted to withdraw from the loose monetary policies enacted in the past twoyears. The risk is that the tightening process can lead to a disorderly rise ininterest rates. Furthermore, India’s equity market is likely to remain exposed tochanges in global risk assessment. Pullbacks driven by these shorter-term factorsare often investment opportunities as we continue to look for companies thatare providing solutions to some of India’s structural challenges.
Commercial Banks: 13.3%HDFC Bank, Ltd. ADR 135,727 $17,655,368Oriental Bank of Commerce 2,946,834 15,748,962Corporation Bank 1,719,331 15,446,605HDFC Bank, Ltd. 408,033 14,867,673Allahabad Bank 4,550,000 12,202,815Axis Bank, Ltd. 575,032 12,143,271ICICI Bank, Ltd. ADR 178,283 6,723,052ICICI Bank, Ltd. 50,000 936,989
95,724,735
Diversified Financial Services: 4.3%Kotak Mahindra Bank, Ltd. 1,075,000 18,520,937Infrastructure Development Finance
Portfolio Manager CommentaryFor the year ending December 31, 2009, the Matthews Japan Fund gained 10.06%,outperforming its benchmark, the MSCI Japan Index, which returned 6.39%.Considering the year was one of the worst for Japanese equities in terms of rela-tive global performance, the Fund performed well, helped by fourth quartergains. For the last quarter of 2009, the Fund returned 2.15% while the bench-mark declined –2.76%.
While Japan’s stock market avoided a third consecutive year of decline, the yearwas still a difficult one for Japanese equity investors; returns were modest atbest compared with other major world markets. Japan’s stock market began thefirst half of the year in line with U.S. and European markets. However, as othermajor markets rose in the second half of the year, Japan’s market sagged. Japan-ese stocks suffered, in part, from concerns over record-breaking capital raisingvia share offerings by companies, mainly banks, that reached approximatelyUS$55 billion. Interest by foreign investors in Japan’s markets also seemed to belacking due to more attractive opportunities elsewhere in the region.
During the year, our stock selection in the auto industry benefited the Fund, withholdings such as Nissan Motor and Fuji Heavy Industries. The Fund’s overweightin the industrials sector also paid off. Specifically, two global machinery firms,Komatsu and Fanuc, benefited from increased demand from emerging markets.In particular, increased infrastructure spending in China has generated substan-tial demand for their machinery products. Information technology firm Toshiba,the portfolio’s fourth largest holding, performed well on the back of improvedpricing in the flash memory market and growing demand for smart phones,which, in turn, is boosting demand for flash memory. In addition, our continuedavoidance of stocks in the low-growth utilities sector helped the portfolio.
In the health care sector, the Fund did well to avoid large pharmaceutical hold-ings, and focused instead on medical equipment makers and suppliers. Onesignificant contributor to Fund performance was Sysmex, which saw its over-seas business, particularly in China, increase.
Our long-term holdings in the Japanese Real Estate Investment Trust (J-REITs)sector performed well in the second half of the year following a consolidationin the industry, which we have been anticipating for some time. This was par-ticularly rewarding for the Fund as its small-capitalization holdings in J-REITsperformed far better than the large-cap J-REIT Index.
The Fund’s largest holdings—The Japan Steel Works, Nidec and Softbank—allpositively contributed to performance during the year. The biggest contributorto Fund performance during the year was Nidec, a leading global manufacturerof small motors used for consumer electronic products, household appliancesand vehicles. Although the firm was founded in 1973, it is among a growingbreed of companies in Japan that focuses on energy savings. The firm’s fortunesare not tightly tied to Japan’s macroeconomic environment as its business ismostly linked to the global trend of energy efficiency. As motors represent morethan 50% of total electricity consumption worldwide and up to nearly 70% infactories, power reduction in motors is key to energy savings. Nidec’s main prod-uct, a brushless motor used primarily in hard disc drives, is said to be three timesmore energy efficient than conventional motors, and seems to be well-suited for amore energy-conscious era. Not only is Nidec globally competitive, it also boastsshareholder-friendly management led by its founder, Shigenobu Nagamori. Withmore than 30 acquisitions, both foreign and domestic, over the past 30 years,Nidec has gained a reputation as an industry consolidator. Its recent acquisitions
40 MATTHEWS ASIA FUNDS
PORTFOLIO MANAGER
Taizo IshidaLead Manager
FUND FACTS
Ticker MJFOXInception Date 12/31/98Assets $88.3 millionNAV $10.91Total # of Positions 51
Fiscal Year 2009 RatiosPortfolio Turnover 126.75%1
Gross Expense Ratio 1.31%2
BenchmarksMSCI Japan IndexTokyo Stock Price Index (TOPIX)
Redemption Fee2% within first 90 calendar days ofpurchase
OBJECTIVE
Long-term capital appreciation.
STRATEGY
Under normal market conditions, theFund seeks to achieve its investmentobjective by investing at least 80% ofits total net assets, which includeborrowings for investment purposes,in the common and preferred stocks ofcompanies located in Japan.
ASIA GROWTH STRATEGIES
(continued)
1 The lesser of fiscal year 2009 long-term purchasecosts or sales proceeds divided by the averagemonthly market value of long-term securities.
Performance assumes reinvestment of all dividends and/or distributions before taxes. All performance quoted represents past performanceand is no guarantee of future results. Investment return and principal value will fluctuate with market conditions so that when redeemed, sharesmay be worth more or less than their original cost. Current performance may be lower or higher than the return figures quoted. Returns wouldhave been lower if certain of the Fund’s fees and expenses had not been waived. For the Fund’s most recent month-end performance visitmatthewsasia.com.
GROWTH OF A $10,000 INVESTMENT SINCE INCEPTION
Plotted montly. The performance data and graph do not reflect the deduction of taxes that a shareholder would pay on dividends, capital gain distributions or redemption of Fundshares. Values are in US$.
3 It is not possible to invest directly in an index. Source: Index data from Morgan Stanley Capital Management; total return calculations performed by PNC Global InvestmentServicing (U.S.) Inc. Please see page 59 for index definitions.
4 The Lipper Category Average does not reflect sales charges and is based on total return, including reinvestment of dividends and capital gains for the stated periods.
TOP TEN HOLDINGS5
Sector % of Net Assets
The Japan Steel Works, Ltd. Industrials 5.3%
Nidec Corp. Information Technology 5.0%
Softbank Corp. Telecommunication Services 5.0%
Toshiba Corp. Information Technology 4.3%
Sysmex Corp. Health Care 3.4%
Nissan Motor Co., Ltd. Consumer Discretionary 3.4%
Fuji Heavy Industries, Ltd. Consumer Discretionary 3.4%
Pigeon Corp. Consumer Staples 2.9%
Nomura Holdings, Inc. Financials 2.9%
So-net Entertainment Corp. Information Technology 2.9%
% OF ASSETS IN TOP TEN 38.5%
5 Holdings may combine more than one security from same issuer and related depositary receipts.
6 Source: FactSet Research Systems. Percentagevalues in data are rounded to the nearest tenth ofone percent; the values may not sum to 100% dueto rounding.
have been in Europe, and are aimed at the growing need for energy efficientmotors for home appliances and cars sold in Europe and worldwide. The firm isaligned with one of the Fund’s key investment themes, clean and green energy,and exemplifies the type of company we will continue to seek out.
The largest detractor to Fund performance was Doutour Nichires Holdings, adomestic restaurant group operator, which underperformed after posting posi-tive returns in 2008. Although Doutour Nichires had been one of the mostprofitable operators in the industry, it still was not immune to the contractionin consumer spending. Although the Fund exited the position during the firsthalf of the year, we continue to monitor its long-term potential as Japan’s eco-nomic condition improves.
We hold an optimistic outlook for Japan’s equity market in 2010 due primarilyto a shift in investors’ perception of Japanese companies. We expect that overthe next decade, more opportunities for Japanese companies will arise than inthe previous 10 years due to the emergence of new markets. Historically, theU.S. has been the primary export market for Japanese companies, with Europeas their second-largest market. However, the emergence of Asia’s growing con-sumer class is changing this. China is not only a growing market for Japaneseproducts, it also appears to be a very profitable one. Furthermore, the caché ofthe “Made in Japan” label carries weight with many middle class Asian con-sumers who desire quality and safety in their purchases. One notable datapoint: Japan’s export revenues from Asia exceeded those from the U.S. in thefirst half of 2009, suggesting an emerging shift from West to East.
In addition, we believe that demand for Japan’s energy efficient products—andnuclear power plants—will increase. Even in the Middle East, more energy-efficient mining equipment may be sought to replace old gas-guzzling heavyequipment. Energy efficiency is also a concern as Chinese factories make theshift from manual labor to automation. Simply put, we believe more customerswill desire Japanese products over the next 10 years. Of course, the potentialbenefit will not be equally distributed to every company in Japan. Stock selec-tion will be important as we believe only select Japanese companies will adaptto the new world order and flourish as a result.
Looking ahead, valuations in the current market have become more compellingfor several reasons. Free cash flow yield for Japanese firms, a valuation metricreflecting a company’s ability to generate cash, was high at more than 10% inthe third quarter of 2009—a rate not seen even at the bottom of the stock mar-ket during Japan’s financial crisis of 2003. Even compared with more widelyquoted metrics, such as low price-to-book ratios or high dividend yields,increased free cash flow yields may present stronger evidence that Japanesecompanies are meaner, leaner and ready to invest in themselves again. We areencouraged by what we see for Japan in 2010.
Portfolio Manager CommentaryFor the year ending December 31, 2009, the Matthews Korea Fund returned 62.92%while its benchmark, the Korea Composite Stock Price Index (KOSPI), gained66.56%. 2009 was a very challenging year for the Korean equity market as wellas for Korea’s currency, the won. Although the market was weak at the start ofthe fourth quarter, it managed to rebound to finish the year with strong gains.The Fund returned 3.95% in the last quarter, while its benchmark rose 1.56%.
The beginning of the year was marked by volatility; the KOSPI lost approxi-mately 25% through early March, before beginning a strong rally. The won hitbottom during the first quarter—falling to its lowest level against the U.S. dollarin 10 years—before strengthening to post a gain for the year. The Korean mar-ket continued to strengthen in the second half of the year, with the KOSPIclimbing about 30% over that period.
The Fund underperformed the benchmark primarily due to its exposure toholdings in the consumer staples, telecommunication services and pharmaceu-tical sectors. These stocks had outperformed in 2008, and some investors tookgains as the market rebounded. Despite their underperformance, we main-tained our positions in these sectors because their fundamentals remain solid.Korean telecommunication services firms continue to be some of the mostattractive relative to their peers in the region in terms of valuation. Addition-ally, the pharmaceutical industry is one of the few in Korea expected to postdouble-digit growth. The consumer staples companies in the portfolio have sta-ble earnings profiles, and tend to perform well during downturns.
While the past year and a half was arguably one of the most challenging businessenvironments in some time, large Korean companies performed considerably wellin the global market, particularly in automotive- and technology-related areas. Tosome extent, Korea’s weak currency aided performance, but more importantly,the relatively sound balance sheets of Korean firms enabled them to engage inaggressive marketing activities including the introduction of new products. Gov-ernment subsidies around the world benefited Korean businesses. For example,the Chinese government subsidized consumer purchases of various appliances,including TVs and computers, and the Korean government offered tax breaks onauto purchases.
Samsung Electronics, Korea’s largest exporter by dollar value, was the biggestcontributor to Fund performance during the year. Samsung, the portfolio’slargest holding, best exemplifies a Korean company that has established itselfglobally. The company has become a global leader in LED TVs and is also nowthe second-largest mobile phone manufacturer in the world. During the year,the company increased its research and development spending, invested in newproducts and conducted aggressive marketing while its competitors largelyremained in a defensive mode. Samsung’s brand image continued to improve in2009, which helped it gain market share in various product areas. We remainpositive on the company’s future prospects.
One of the Fund’s key strategies is to find dominant companies that can lever-age their experience and financial strength in the domestic Korean market topenetrate markets overseas. Korea is home to some of the largest global compa-nies in the information technology and automotive industries, and we believethat businesses in other sectors can follow suit. Cheil Worldwide, an affiliate ofSamsung, is one such company that has emerged on the international stage. Aleader in Korean advertising for many years, Cheil entered the overseas marketa few years ago and recently acquired a U.S. advertising agency, thereby
matthewsasia.com | 800.789.ASIA 45
PORTFOLIO MANAGERS
J. Michael OhLead Manager
Michael B. Han, CFACo-Manager
Mark W. HeadleyCo-Manager
FUND FACTS
Ticker MAKOXInception Date 1/3/95Assets $138.4 millionNAV $4.31Total # of Positions 58
Redemption Fee2% within first 90 calendar days ofpurchase
OBJECTIVE
Long-term capital appreciation.
STRATEGY
Under normal market conditions, theFund seeks to achieve its investmentobjective by investing at least 80% ofits total net assets, which includeborrowings for investment purposes,in the common and preferred stocks ofcompanies located in South Korea.
ASIA GROWTH STRATEGIES
(continued)
1 The lesser of fiscal year 2009 long-term purchasecosts or sales proceeds divided by the averagemonthly market value of long-term securities.
Lipper Pacific ex Japan Funds Category Average4 6.49% 71.34% 4.72% 13.05% 7.53% 6.99%5
Performance assumes reinvestment of all dividends and/or distributions before taxes. All performance quoted represents past performanceand is no guarantee of future results. Investment return and principal value will fluctuate with market conditions so that when redeemed, sharesmay be worth more or less than their original cost. Current performance may be lower or higher than the return figures quoted. Returns wouldhave been lower if certain of the Fund’s fees and expenses had not been waived. For the Fund’s most recent month-end performance visitmatthewsasia.com.
GROWTH OF A $10,000 INVESTMENT SINCE INCEPTION
Plotted monthly. The performance data and graph do not reflect the deduction of taxes that a shareholder would pay on dividends, capital gain distributions or redemption of Fundshares. Values are in US$.
3 It is not possible to invest directly in an index. Source: Index data from Morgan Stanley Capital Management; total return calculations performed by PNC Global InvestmentServicing (U.S.) Inc. Please see page 59 for index definition.
4 The Lipper Category Average does not reflect sales charges and is based on total return, including reinvestment of dividends and capital gains for the stated periods.
5 Calculated from 12/31/94.
TOP TEN HOLDINGS6
Sector % of Net Assets
Samsung Electronics Co., Ltd. Information Technology 10.8%
POSCO Materials 5.3%
Hyundai Motor Co. Consumer Discretionary 3.8%
KB Financial Group, Inc. Financials 3.7%
Shinhan Financial Group Co., Ltd. Financials 3.1%
SK Telecom Co., Ltd. Telecommunication Services 2.7%
NHN Corp. Information Technology 2.7%
LG Electronics, Inc. Consumer Discretionary 2.5%
Kiwoom Securities Co., Ltd. Financials 2.5%
Modetour Network, Inc. Consumer Discretionary 2.5%
% OF ASSETS IN TOP TEN 39.6%
6 Holdings may combine more than one security from same issuer and related depositary receipts.
7 Source: FactSet Research Systems. Percentagevalues in data are rounded to the nearest tenth ofone percent; the values may not sum to 100% dueto rounding.
expanding its pool of clients and talent. Another holding that demonstrates ourstrategy is Amorepacific, Korea’s largest cosmetics company. Amorepacific beganselling its products in China eight years ago following extensive research intothe market. More recently, its effort has begun bearing fruit, with AmorePa-cific’s China sales recording impressive growth in 2009.
Looking forward, we believe Korea is well-positioned to benefit from a globalrecovery as its businesses have a solid market presence in both developed andemerging markets. However, its currency fluctuations remain a risk for the yearahead. If the won strengthens too fast, Korean exporters may come under pres-sure. We believe that the fundamentals of Korean companies have improvedcompared with those of their global competitors, and that they can compete onquality, despite some currency appreciation. Though market sentiment in Koreais improving, overall consumption remains weak. Relatively slow incomegrowth poses another potential risk to domestic companies. Foreign currencyreserves grew to near record levels during the year, which may serve as a buffershould the global economy worsen again. However, Korea’s export industryremains a sizable segment of its economy, and further deterioration globallycould adversely impact it. North Korea remains a potential threat to South Koreaand its nuclear weapons testing continues to be an international concern;although actual military action between North and South Korea appears to bequite low, unpredictable moves by North Korea could cause market jitters.
Korea’s overall valuation remains attractive, and we will continue to seekgrowth companies with the potential to do well both in Korea as well as inoverseas markets.
Portfolio Manager CommentaryFor the year ending December 31, 2009, the Matthews Asia Small CompaniesFund gained 103.00%, while its benchmark, the MSCI All Country (AC) Asiaex Japan Small Cap Index, rose 113.48%. For the fourth quarter, the Fundgained 14.67%, while its benchmark rose 12.10%.
Asian markets got off to a rocky start in 2009 amid the global financial crisis,but eventually stabilized. Small-cap companies recovered faster and reboundedfurther than their large-capitalization counterparts; in fact, the MSCI AC Asiaex Japan Small Cap Index outperformed the MSCI AC Asia ex Japan Large CapIndex by 44.76% in 2009. During the first half of 2009, the market transitionedfrom a “panic mode” back to a more rational state. Asia’s economies demon-strated their strength and resilience, relative to those in other regions of theworld. The return of a more stabilized credit market enabled small- to mid-sizecompanies better access to financing. A reversal of investors’ risk appetite alongwith improved liquidity led to a sharp market rally. In general, cyclical indus-tries such as energy, commodities and real estate along with lower quality,highly leveraged companies performed very strongly. Because the Fund mini-mizes exposure to cyclical stocks, it underperformed its benchmark for the firsthalf of the year. The Fund’s relative performance improved in the second half of2009 as investors returned to focusing on company fundamentals and growthprospects.
On a country basis, China, India and Taiwan were the Fund’s top weightingsthroughout the year, and also accounted for the lion’s share of its performance.China and India were among the few countries that still registered positiveGDP growth in 2009, while Taiwan’s closer economic ties with China reignitedinterest in its growth prospects. On a sector basis, top contributors to Fund per-formance came from holdings in the industrials, information technology andconsumer discretionary sectors as they benefited most from the pickup in busi-ness activities and consumer spending.
During the year, we positioned the Fund to focus on companies that derive growthfrom Asia’s domestic markets. We sought businesses with sustainable revenuestreams, high returns on investments and conservative capital structures thatcould weather the crisis in the short term, and emerge as industry leaders in thelong run. Some of the Fund’s main contributors to performance were Chinesestocks that we consider “blue-chip companies in the making.” Such notable hold-ings included Zhuzhou CSR Times Electric, a provider of railway electrical systems;Minth Group, a leading manufacturer of exterior auto-parts; and Golden EagleRetail Group, a popular department store operator. While the financial crisis andcontraction in demand had threatened the survival of some small companies,these firms still managed to reinvest in and expand their businesses as well as gainnew customers.
The portfolio’s fourth-largest holding, Singapore Airport Terminal Services(SATS), the main provider of ground handling and in-flight catering services inSingapore, grew more dominant, gaining market share and increasing itseconomies of scale in the process. During the downturn, another airport serv-ices operator shut its Singapore operations, leaving SATS with only one othercompetitor. Separately, SATS acquired an integrated food company in early2009, aiming to expand it catering business beyond the aviation sector. Look-ing ahead, the acquisition should benefit SATS by diversifying its customer baseand industry exposure. We feel that the firm is well-positioned as tourism andbusiness activities improve in the region.
50 MATTHEWS ASIA FUNDS
PORTFOLIO MANAGER
Lydia SoLead Manager
FUND FACTS
Ticker MSMLXInception Date 9/15/08Assets $109.7 millionNAV $15.79Total # of Positions 72
Fiscal Year 2009 RatiosPortfolio Turnover 21.39%1
Gross Expense Ratio 2.09%2
After ContractualFee Waiver 2.00%2
BenchmarkMSCI AC Asia ex Japan Small Cap Index
Redemption Fee2% within first 90 calendar days ofpurchase
OBJECTIVE
Long-term capital appreciation.
STRATEGY
Under normal market conditions, theFund seeks to achieve its investmentobjective by investing at least 80% ofits total net assets, which includeborrowings for investment purposes,in the common and preferred stocks ofsmall companies located in Asia,excluding Japan.
ASIA SMALL COMPANYSTRATEGY
(continued)
1 The lesser of fiscal year 2009 long-term purchasecosts or sales proceeds divided by the averagemonthly market value of long-term securities.
2 The Advisor has contractually agreed to waive certainfees and reimburse certain expenses for MatthewsAsia Small Companies Fund. Please see page 89 foradditional information. Matthews Asia Funds does notcharge 12b-1 fees.
PERFORMANCE AS OF DECEMBER 31, 2009Average Annual Total Return
Inception3 Months 1 Year 9/15/08
Matthews Asia Small Companies Fund 14.67% 103.00% 44.05%
MSCI All Country Asia ex Japan Small Cap Index3 12.10% 113.48% 34.33%
Lipper Pacific ex Japan Funds Category Average4 6.49% 71.34% 27.86%5
Performance assumes reinvestment of all dividends and/or distributions before taxes. All performance quoted represents past performanceand is no guarantee of future results. Investment return and principal value will fluctuate with market conditions so that when redeemed, sharesmay be worth more or less than their original cost. Current performance may be lower or higher than the return figures quoted. Returns wouldhave been lower if certain of the Fund’s fees and expenses had not been waived. For the Fund’s most recent month-end performance visitmatthewsasia.com.
GROWTH OF A $10,000 INVESTMENT SINCE INCEPTION
The performance data does not reflect the deduction of taxes that a shareholder would pay on dividends, capital gain distributions or redemption of Fund shares. Values are in US$.
3 It is not possible to invest directly in an index. Source: Index data from Morgan Stanley Capital Management; total return calculations performed by PNC Global InvestmentServicing (U.S.) Inc. Please see page 59 for index definition.
4 The Lipper Category Average does not reflect sales charges and is based on total return, including reinvestment of dividends and capital gains for the stated periods.
5 Calculated from 9/30/08.
TOP TEN HOLDINGS6
Country % of Net Assets
St. Shine Optical Co., Ltd. Taiwan 2.8%
Synnex Technology International Corp. Taiwan 2.5%
Uni-President China Holdings, Ltd. China/Hong Kong 2.5%
7 Source: FactSet Research Systems. Percentagevalues in data are rounded to the nearest tenth ofone percent; the values may not sum to 100% dueto rounding.
8 The Fund defines Small Companies as companieswith market capitalization generally between $100million and $3 billion.
India’s Exide Industries, a leading manufacturer of batteries for automobiles andindustrial usage, also performed well. With over 70% market share in thebranded battery market and an extensive sales network, Exide continued togrow over the year. It benefits from an increasing demand for new automobilesand battery replacements in India, one of the world’s largest auto markets. Thecompany is able to control costs through in-house recycling of key raw materi-als, such as lead, thereby reducing the need to import lead from overseas.
However, not all of the Fund’s holdings performed as well as we had hoped,and we sold several names that fell short of our expectations. Taiwan’s largestonline job search operator, 104 Corp., is one such firm. It failed to adapt to thepricing needs of employers during a difficult year, and its China expansionplans have yielded few results after years of investment.
During the economic downturn, many of Asia’s small companies controlledcosts by downsizing and streamlining staffing and operations. Many also tookadvantage of lower prices for raw materials to protect profit margins. The weakU.S. dollar, combined with improving consumer demand toward the end of2009, boosted energy and metal prices to record high levels. As a result, weexpect pressure on profit margins may manifest in the short to medium term.Another area of concern is that small companies may experience renewed chal-lenges in gaining access to funding. Thus far, central banks in Asia have beensupportive of a loose monetary policy; however, banks may reverse this accom-modative stance amid looming concerns over excess liquidity and inflation. Wewill continue to closely monitor the potential for these external factors to nega-tively impact companies and market sentiment in the small-cap universe.
Looking ahead, we will continue to seek companies with strong fundamentals,particularly those likely to endure through strong franchises, growing brandvalue and pricing power. Our focus remains on investing in good businessesthat can survive investments cycles, and going forward, we expect our invest-ment universe to continue to expand. The resumption of the region’s initialpublic offerings in June, as market conditions began stabilizing, indicated to usthat entrepreneurial activities were healthy and that capital markets were alsocontinuing to deepen—both important factors to increasing the breadth anddepth of the small-cap universe.
Matthews Asia Small Companies Fund December 31, 2009
Schedule of Investmentsa
CHINA/HONG KONG: 30.6%Uni-President China Holdings, Ltd. 3,675,000 $2,694,325Vinda International Holdings, Ltd. 3,353,000 2,373,272Xinyi Glass Holdings Co., Ltd. 2,468,000 2,224,295KWG Property Holding, Ltd. 2,787,500 2,126,622Yip’s Chemical Holdings, Ltd. 2,514,000 2,048,543Zhuzhou CSR Times Electric Co., Ltd.
H Shares 976,000 1,991,637Hengdeli Holdings, Ltd. 5,236,000 1,977,057Minth Group, Ltd. 1,272,000 1,867,268Kingdee International Software
Group Co., Ltd. 7,638,000 1,700,897AAC Acoustic Technologies Holdings, Inc. 1,006,000 1,651,740Xingda International Holdings, Ltd. 3,459,000 1,610,373Golden Eagle Retail Group, Ltd. 774,000 1,569,986Wasion Group Holdings, Ltd. 1,472,000 1,529,985PCD Stores, Ltd.b 3,654,900 1,418,894Dalian Port PDA Co., Ltd. H Shares 3,612,000 1,388,795China Green Holdings, Ltd. 1,248,000 1,181,835Towngas China Co., Ltd. 2,448,000 982,273Mindray Medical International, Ltd. ADR 26,800 909,056Shandong Weigao Group Medical
Polymer Co., Ltd. H Shares 260,000 866,507Times, Ltd. 1,001,000 716,207Sino-Ocean Land Holdings, Ltd. 748,500 687,259Sany Heavy Equipment International
Holdings Co., Ltd.b 33,000 41,753Total China/Hong Kong 33,558,579
MALAYSIA: 3.2%Dialog Group BHD 4,008,742 1,535,118KNM Group BHD 6,115,500 1,362,492CB Industrial Product Holding BHD 778,400 662,097Total Malaysia 3,559,707
Portfolio Manager CommentaryFor the year ending December 31, 2009, the Matthews Asian Technology Fundreturned 70.28% while its benchmark, the MSCI/Matthews Asian TechnologyIndex, gained 40.59%. For the fourth quarter, the Fund rose 7.08%, comparedto a 2.70% increase for the benchmark. Overall, the year saw a recovery inAsia’s technology sector after it fell to its lowest level in more than five yearsduring the first quarter of 2009.
Asian technology stocks quickly rebounded on the back of government stimu-lus programs from around the world and easing concerns over the globalfinancial crisis. China’s demand for IT products, as well as the government’ssubsidies on technology purchases, such as computers and televisions, helpedsentiment and led the sector’s recovery.
The Fund has historically sought to invest in companies poised to benefit fromgrowth in Asia’s domestic consumption; this strategy paid off during 2009. TheFund’s outperformance relative to the benchmark was due primarily to its over-weight in China, and particularly in domestically oriented firms, such asInternet and software companies. The portfolio’s holdings in the hardware sec-tor also performed well as the demand outlook for technology productsimproved and inventory levels of various technology firms remained healthy.Our increased exposure to Taiwanese technology firms—a shift we made in thefirst quarter when valuations became more compelling—also benefited Fundperformance in 2009.
Telecommunication services and Japanese consumer electronics were two areasthat underperformed during the year. The telecommunication services sector gen-erally outperformed in 2008, but underperformed in 2009 as investors’ riskappetite grew. Japanese consumer electronics companies were negatively impactedby a strong yen as exports constitute a large part of their sales. However, we main-tain a positive outlook for the global competitiveness of Japanese consumerelectronics companies, especially in developed markets, and increased our hold-ings in these stocks during the last quarter of the year as valuations becameattractive.
In 2009, we also added to our positions in technology-related health care com-panies. Asia is already the world’s largest health care market in terms of numberof patients, and we see great potential for the sector’s long-term growth as perpatient spending in Asia is still among the lowest globally. In 2008, U.S. healthcare spending per capita was approximately US$7,000. By comparison, percapita spending in Asia ex-Japan was only US$600.The Fund specifically seeksto focus on medical device makers as we believe these firms are well-poised tobenefit from the industry’s overall growth. That said, we expect to increase ourexposure to the health care sector gradually as valuations in these industriesremain high.
During the year, the biggest contributor to Fund performance was Baidu,China’s leading online search service provider. We believe that Baidu hasdemonstrated a better understanding of both the Chinese consumer and localregulations than its competitors. While China has surpassed the U.S. in termsof its number of Internet users, with more than 300 million users, the penetra-tion is only at approximately 22% of the total population in China, accordingto the World Bank. As China’s Internet penetration rate rises, we expect Baiduto maintain its leadership position in the market. However, the relationshipbetween the Chinese government and Internet firms, such as Google, raisesquestions about regulatory risk related to China’s Internet industry. Another
matthewsasia.com | 800.789.ASIA 55
PORTFOLIO MANAGERS
J. Michael OhLead Manager
Lydia SoCo-Manager
FUND FACTS
Ticker MATFXInception Date 12/27/99Assets $130.4 millionNAV $8.02Total # of Positions 59
Fiscal Year 2009 RatiosPortfolio Turnover 83.27%1
Gross Expense Ratio 1.40%2
BenchmarkMSCI/Matthews Asian Technology Index
Redemption Fee2% within first 90 calendar days ofpurchase
OBJECTIVE
Long-term capital appreciation.
STRATEGY
Under normal market conditions, theFund seeks to achieve its investmentobjective by investing at least 80% ofits total net assets, which includeborrowings for investment purposes,in the common and preferred stocks ofcompanies located in Asia that derivemore than 50% of their revenues fromthe sale of products or services intechnology-related industries andservices.
ASIA SPECIALTY STRATEGY
(continued)
1 The lesser of fiscal year 2009 long-term purchasecosts or sales proceeds divided by the averagemonthly market value of long-term securities.
PERFORMANCE AS OF DECEMBER 31, 2009Average Annual Total Return
Inception3 Months 1 Year 3 Years 5 Years 10 Years 12/27/99
Matthews Asian Technology Fund 7.08% 70.28% 0.42% 8.03% -1.78% -1.64%
MSCI/Matthews Asian Technology Index3 2.70% 40.59% -2.08% 4.69% -6.32% -6.31%4
Lipper Global Sciences and Technology Funds Category Average5 7.89% 68.51% 0.75% 3.42% -4.90% -4.90%4
Performance assumes reinvestment of all dividends and/or distributions before taxes. All performance quoted represents past performanceand is no guarantee of future results. Investment return and principal value will fluctuate with market conditions so that when redeemed, sharesmay be worth more or less than their original cost. Current performance may be lower or higher than the return figures quoted. Returns wouldhave been lower if certain of the Fund’s fees and expenses had not been waived. For the Fund’s most recent month-end performance visitmatthewsasia.com.
GROWTH OF A $10,000 INVESTMENT SINCE INCEPTION
Plotted monthly. The performance data and graph do not reflect the deduction of taxes that a shareholder would pay on dividends, capital gain distributions or redemption of Fundshares. Values are in US$.
3 It is not possible to invest directly in an index. Source: Index data from Morgan Stanley Capital Management; total return calculations performed by PNC Global InvestmentServicing (U.S.) Inc. Please see page 59 for index definition.
4 Calculated from 12/31/99.
5 The Lipper Category Average does not reflect sales charges and is based on total return, including reinvestment of dividends and capital gains for the stated periods.
7 Source: FactSet Research Systems. Percentagevalues in data are rounded to the nearest tenth ofone percent; the values may not sum to 100% dueto rounding.
large contributor to Fund performance was Hon Hai Precision Industry, an elec-tronics manufacturing services firm headquartered in Taiwan. Hon Hai providesmanufacturing services to almost all major technology companies, includingApple and Sony. The firm manufactures a very broad set of products, rangingfrom mobile phones to gaming consoles, and the company is well-positioned tobenefit from the technology sector’s ongoing recovery.
Over the past few years, we have seen more innovation taking place in Asia andcompanies in the region are now market leaders in many emerging technolo-gies. For example, Asian companies now manufacture more than 80% of theworld’s rechargeable lithium-ion batteries, and own the majority of relatedpatents. Asian companies also lead the market for electronic display technologyand are developing the next generation of displays. In addition, a Taiwanesecompany owns the main technology that is used in more than 90% of all elec-tronic reading devices, or “e-readers,” sold worldwide. The Fund has invested inthese and other emerging technologies, and believes the growth prospects forAsian technology remain bright.
Asia is now the largest market for many of its own consumer technology prod-ucts. Not only has the region become the biggest market for Internet services, itis also the largest market for mobile handsets and wireless telecommunicationservices. Furthermore, Asia is also expected to become the largest market forpersonal computers and LCD televisions. What is even more exciting about thistrend is that the region’s consumers are favoring Asian brands over competitorsfrom the West.
It is important to note that some long-term risks remain. In addition to issuesrelating to China’s control over Internet firms, there is also the risk of weakintellectual property (IP) protection, especially in the region’s emerging coun-tries, which can deter innovation. Another risk is that Asia’s technology sectortends to trade on short-term investor sentiment and that can sometimes exag-gerate stock movements and cause volatility. We believe that investing in thesector for the long term, can minimize some of these risks.
Looking ahead, we expect the global demand for technology products and serv-ices to steadily improve as the global economy continues to recover. The overalldemand for technology products remains healthy in many emerging countries;however, in most developed countries the demand remains weak. Additionally,as government stimulus programs wane, there may be some risk that the globaldemand for technology products and services falls again. We remain focused onfinding firms that can benefit from the region’s long-term growth prospects andspecifically, in two long-term trends: increasing Asian consumption and corpo-rate IT spending. While we expect the sector to remain volatile over theshort-term, we are optimistic about its long-term prospects.
We are pleased to announce that in December, the Fund marked its 10th year ofoperation. We reached this milestone as a result of the long-term commitmentof our shareholders through some volatile market cycles. We thank you for yourongoing support and will continue to work hard on your behalf.
Fund Holdings: The Fund holdings shown in this reportare as of December 31, 2009. Holdings are subject tochange at any time, so holdings shown in this reportmay not reflect current Fund holdings. The Funds filecomplete schedules of portfolio holdings with the Secu-rities and Exchange Commission (the “SEC”) for the firstand third quarters of each fiscal year on Form N-Q. TheFunds’ Form N-Q is filed with the SEC within 60 days ofthe end of the quarter to which it relates, and is avail-able on the SEC’s website at www.sec.gov. It may also bereviewed and copied at the Commission’s Public Refer-ence Room in Washington, D.C. Information on the op-eration of the Public Reference Room may be obtainedby calling 800-SEC-0330. Complete schedules of invest-ment are also available without charge, upon request,from the Funds by calling us at 800.789.ASIA (2472).
Proxy Voting Record: The Funds’ Statement ofAdditional Information containing a description of thepolicies and procedures that the Funds have used to voteproxies relating to portfolio securities, along with eachFund’s proxy voting record relating to portfoliosecurities held during the 12-month period endedJune 30, 2009, is available upon request, at no charge, atthe Funds’ website at matthewsasia.com or by calling1.800.789.ASIA (2742), or on the SEC’s website atwww.sec.gov.
Shareholder Reports and Prospectuses: To reduce theFunds’ expenses, we try to identify related shareholdersin a household and send only one copy of the Funds’prospectus and financial reports to that address. Thisprocess, called “householding,” will continue indefinitelyunless you instruct us otherwise. At any time you mayview the Funds’ current prospectus and financial reportson our website. If you prefer to receive individual copiesof the Funds’ prospectus or financial reports, please callus at 1.800.789.ASIA (2742).
Index Definitions
The MSCI All Country Asia ex Japan Index is a freefloat–adjusted market capitalization–weighted index ofthe stock of markets of China, Hong Kong, India,Indonesia, Malaysia, Philippines, Singapore, SouthKorea, Taiwan and Thailand.
The MSCI All Country Far East ex Japan Index is a freefloat–adjusted market capitalization–weighted index ofthe stock markets of China, Hong Kong, Indonesia,Malaysia, Philippines, Singapore, South Korea, Taiwanand Thailand.
The MSCI All Country Asia Pacific Index is a free float–adjusted market capitalization–weighted index of thestock markets of Australia, China, Hong Kong, India,Indonesia, Japan, Malaysia, New Zealand, Philippines,Singapore, South Korea, Taiwan and Thailand.
The MSCI China Index is a free float–adjusted marketcapitalization–weighted index of Chinese equities thatincludes China-affiliated corporations and H shareslisted on the Hong Kong Exchange, and B shares listedon the Shanghai and Shenzhen exchanges.
The Bombay Stock Exchange (BSE) 100 Index is a freefloat–adjusted market capitalization–weighted index ofthe 100 stocks listed on the Bombay Stock Exchange.
The MSCI Japan Index is a free float–adjusted marketcapitalization–weighted index of Japanese equities listedin Japan.
The Tokyo Stock Price Index (TOPIX) is a marketcapitalization–weighted index of all companies listed onthe First Section of the Tokyo Stock Exchange.
The Korea Composite Stock Price Index (KOSPI) is amarket capitalization–weighted index of all commonstocks listed on the Korea Stock Exchange.
The MSCI All Country Asia ex Japan Small Cap Indexis a free float–adjusted market capitalization–weightedsmall cap index of the stock markets of China, HongKong, India, Indonesia, Malaysia, Philippines, Singapore,South Korea, Taiwan and Thailand.
The MSCI/Matthews Asian Technology Index is a freefloat–adjusted market capitalization–weighted index ofAsian equities tracking a broad range of technologystocks including semiconductor equipment andproducts, communications equipment, computers andperipherals, electronic equipment and instruments,office electronics, software, IT consulting and services,Internet software and services, diversified telecommunica-tions services, and wireless telecommunications services.
We believe it is important for you to understand theimpact of fees regarding your investment. All mutualfunds have operating expenses. As a shareholder of amutual fund, you incur ongoing costs, which includecosts for portfolio management, administrative services,and shareholder reports (like this one), among others.Operating expenses, which are deducted from a fund’sgross income, directly reduce the investment return ofthe fund. A fund’s operating expenses are expressed as apercentage of its average net assets. This figure is knownas the expense ratio. The following examples areintended to help you understand the ongoing fees (indollars) of investing in your fund and to compare thesecosts with those of other mutual funds. The examplesare based on an investment of $1,000 made at thebeginning of the period shown and held for the entireperiod.
This table illustrates your fund’s costs in two ways:
Actual Fund Return: This section helps you to estimatethe actual operating expenses, after any applicable feewaivers, that you paid over the period. The “EndingAccount Value” shown is derived from the fund’s actualreturn for the past six month period, the “Expense Ratio”column shows the period’s annualized expense ratio,and the “Operating Expenses Paid During Period” columnshows the dollar amount that would have been paid byan investor who started with $1,000 in the fund at thebeginning of the period. You may use the informationhere, together with your account value, to estimate theexpenses that you paid over the period. To do so, simplydivide your account value by $1,000 (for example, an$8,600 account value divided by $1,000 = 8.6), thenmultiply the result by the number given for your fund inthe first line under the heading entitled “OperatingExpenses Paid During Period.”
Hypothetical 5% Return: This section is intended tohelp you compare your fund’s costs with those of othermutual funds. It assumes that the fund had an annual
return of 5% before operating expenses, but that theexpense ratio is unchanged. In this case, because thereturn used is not the fund’s actual return, the results donot apply to your investment. This example is useful inmaking comparisons to other mutual funds because theSecurities and Exchange Commission requires all mutualfunds to calculate expenses based on an assumed 5%annual return. You can assess your fund’s costs bycomparing this hypothetical example with thehypothetical examples that appear in shareholderreports of other funds.
Please note that the operating expenses shown in thetable are meant to highlight and help you compare yourongoing costs only and do not reflect any transactionalcosts such as sales charges (loads), redemption fees, orexchange fees. The Funds generally assess a redemptionfee of 2.00% of the total redemption proceeds if you sellor exchange your shares within 90 calendar days afterpurchasing them. The redemption fee is paid directly tothe Funds and is designed to discourage frequent short-term trading and to offset transaction costs associatedwith such trading of Fund shares. For purposes ofdetemining whether the redemption fee applies, theshares that have been held the longest will be redeemedfirst. The Funds may grant exemption from theredemption fee when the Funds have previously receivedassurances that transactions do not involve markettiming activity. The Funds may also waive theimposition of redemption fees in certain circumstances.
For more information on this policy, please see theFunds’ prospectus.
The Matthews Asia Funds do not charge any sales loads,exchange fees, or 12b-1 fees, but these may be present inother funds to which you compare this data. Therefore,the hypothetical portions of the table are useful incomparing ongoing costs only, and will not help youdetermine the relative total costs of owning differentfunds.
Matthews China FundActual Fund Return $1,000.00 $1,282.20 1.20% $6.90Hypothetical 5% Return $1,000.00 $1,019.16 1.20% $6.11
Matthews India FundActual Fund Return $1,000.00 $1,340.10 1.21% $7.14Hypothetical 5% Return $1,000.00 $1,019.11 1.21% $6.16
Matthews Japan FundActual Fund Return $1,000.00 $1,086.80 1.30% $6.84Hypothetical 5% Return $1,000.00 $1,018.65 1.30% $6.61
Matthews Korea FundActual Fund Return $1,000.00 $1,374.30 1.25% $7.48Hypothetical 5% Return $1,000.00 $1,018.90 1.25% $6.36
ASIA SMALL COMPANY STRATEGY
Matthews Asia Small Companies FundActual Fund Return $1,000.00 $1,379.00 2.00% $11.99Hypothetical 5% Return $1,000.00 $1,015.12 2.00% $10.16
ASIA SPECIALTY STRATEGY
Matthews Asian Technology FundActual Fund Return $1,000.00 $1,336.70 1.31% $7.72Hypothetical 5% Return $1,000.00 $1,018.60 1.31% $6.67
1 Annualized, based on the Fund’s most recent fiscal half-year expenses.
2 Operating expenses are equal to the Fund’s annualized expense ratio multiplied by the average account value over the period, multiplied by the number of days in the most recentfiscal half-year, then divided by 365.
3 The Matthews China Dividend Fund commenced operations on November 30, 2009.
TOTAL LIABILITIES 30,432,058 4,949,160 645,023 2,310,042
NET ASSETS $2,547,410,970 $322,003,346 $7,134,458 $227,650,516
SHARES OUTSTANDING:(shares of beneficial interest issued and outstanding, respectively, unlimited number of shares authorized with a $0.001 par value) 161,537,334 26,691,787 701,006 15,932,579
Net asset value, offering price and redemption price $15.77 $12.06 $10.18 $14.29
NET ASSETS CONSIST OF:
Capital paid-in $2,278,402,200 $288,172,452 $7,019,836 $250,612,864
Undistributed (distributions in excess of) net investment income (loss) (7,490,172) (4,122,176) 613 90,967
Undistributed/(accumulated) net realized gain (loss) on investments, and foreign currency related transactions (68,528,874) (18,779,341) — (82,830,487)
Net unrealized appreciation on investments, foreign currency transactions and deferred taxes 345,027,816 56,732,411 114,009 59,777,172
NET ASSETS $2,547,410,970 $322,003,346 $7,134,458 $227,650,516
Year Ended Year Ended MATTHEWS ASIAN GROWTH AND INCOME FUND December 31, 2009 December 31, 2008
OPERATIONS:
Net investment income $58,935,074 $57,121,713
Net realized gain (loss) on investments and foreign currency related transactions (37,269,074) 97,126,605
Net change in unrealized appreciation/depreciation on investments and foreign currency related transactions 553,007,216 (821,256,501)
Net change in deferred taxes on unrealized appreciation (4,289) —
Net increase (decrease) in net assets resulting from operations 574,668,927 (667,008,183)
DISTRIBUTIONS TO SHAREHOLDERS FROM:
Net investment income (60,961,205) (41,328,215)
Realized gains on investments — (152,469,801)
Net decrease in net assets resulting from distributions (60,961,205) (193,798,016)
CAPITAL SHARE TRANSACTIONS (net) (Note 2) 943,643,994 (323,206,605)
REDEMPTION FEES 347,176 317,302
Total increase (decrease) in net assets 1,457,698,892 (1,183,695,502)
NET ASSETS:
Beginning of year 1,089,712,078 2,273,407,580
End of year (including distributions in excess of net investment income of ($7,490,172) and ($5,209,901), respectively) $2,547,410,970 $1,089,712,078
Year Ended Year Ended MATTHEWS ASIA DIVIDEND FUND December 31, 2009 December 31, 2008
OPERATIONS:
Net investment income $5,662,564 $3,439,463
Net realized loss on investments and foreign currency related transactions (13,062,275) (5,566,940)
Net change in unrealized appreciation/depreciation on investments and foreign currency related transactions 72,559,686 (20,959,878)
Net increase (decrease) in net assets resulting from operations 65,159,975 (23,087,355)
DISTRIBUTIONS TO SHAREHOLDERS FROM:
Net investment income (10,189,013) (3,011,638)
Realized gains on investments — (142,300)
Net decrease in net assets resulting from distributions (10,189,013) (3,153,938)
CAPITAL SHARE TRANSACTIONS (net) (Note 2) 124,976,685 86,427,296
REDEMPTION FEES 104,220 141,421
Total increase in net assets 180,051,867 60,327,424
NET ASSETS:
Beginning of year 141,951,479 81,624,055
End of year (including undistributed/(distributions in excess of) net investment income of ($4,122,176) and $370,442, respectively) $322,003,346 $141,951,479
Year Ended Year Ended MATTHEWS KOREA FUND December 31, 2009 December 31, 2008
OPERATIONS:
Net investment loss $(383,266) $(524,760)
Net realized gain on investments and foreign currency related transactions 1,204,933 8,040,061
Net change in unrealized appreciation/depreciation on investments and foreign currency related transactions 51,583,156 (122,326,673)
Net increase (decrease) in net assets resulting from operations 52,404,823 (114,811,372)
DISTRIBUTIONS TO SHAREHOLDERS FROM:
Net investment income — (1,673,455)
Realized gains on investments (5,234,879) (7,207,688)
Net decrease in net assets resulting from distributions (5,234,879) (8,881,143)
CAPITAL SHARE TRANSACTIONS (net) (Note 2) 3,895,556 (39,546,578)
REDEMPTION FEES 51,933 70,799
Total increase (decrease) in net assets 51,117,433 (163,168,294)
NET ASSETS:
Beginning of year 87,253,135 250,421,429
End of year (including distributions in excess of net investment income of ($6,223) and $0, respectively) $138,370,568 $87,253,135
Year Ended Year Ended MATTHEWS ASIA SMALL COMPANIES FUND December 31, 2009 December 31, 20081
OPERATIONS:
Net investment income $46,377 $2,686
Net realized gain (loss) on investments and foreign currency related transactions 1,067,704 (56,968)
Net change in unrealized appreciation/depreciation on investments and foreign currency related transactions 21,072,949 (165,216)
Net change in deferred taxes on unrealized appreciation (635,975) (3,814)
Net increase (decrease) in net assets resulting from operations 21,551,055 (223,312)
DISTRIBUTIONS TO SHAREHOLDERS FROM:
Net investment income (303,466) (5,234)
Realized gains on investments (947,544) —
Net decrease in net assets resulting from distributions (1,251,010) (5,234)
CAPITAL SHARE TRANSACTIONS (net) (Note 2) 86,137,752 3,388,549
REDEMPTION FEES 114,406 13,355
Total increase in net assets 106,552,203 3,173,358
NET ASSETS:
Beginning of year 3,173,358 —
End of year (including undistributed/(distributions in excess of) net investment income of ($365,943) and $6,470, respectively) $109,725,561 $3,173,358
1 The Matthews Asia Small Companies Fund commenced operations on September 15, 2008.
The table below sets forth financial data for a share of beneficial interest outstanding throughout each period presented.
Year Ended December 31,
2009 2008 2007 2006 2005
Net Asset Value, beginning of year $11.50 $19.78 $18.68 $17.14 $15.82
INCOME (LOSS) FROM INVESTMENT OPERATIONS:
Net investment income 0.481 0.541 1.07 0.46 0.45
Net realized gain (loss) and unrealized appreciation/depreciation on investments and foreign currency 4.23 (6.73) 2.93 3.47 2.02
Total from investment operations 4.71 (6.19) 4.00 3.93 2.47
LESS DISTRIBUTIONS FROM:
Net investment income (0.44) (0.42) (0.90) (0.62) (0.43)
Net realized gains on investments — (1.67) (2.00) (1.77) (0.72)
Total distributions (0.44) (2.09) (2.90) (2.39) (1.15)
Paid-in capital from redemption fees (Note 2) —2 —2 —2 —2 —2
Net Asset Value, end of year $15.77 $11.50 $19.78 $18.68 $17.14
TOTAL RETURN 41.44% (32.07%) 21.54% 23.38% 15.76%
RATIOS/SUPPLEMENTAL DATA
Net assets, end of year (in 000’s) $2,547,411 $1,089,712 $2,273,408 $2,021,363 $1,676,559
Ratio of expenses to average net assets before reimbursement, waiver or recapture of expenses by Advisor and Administrator (Note 3) 1.18% 1.16% 1.16% 1.20% 1.28%
Ratio of expenses to average net assets after reimbursement, waiver or recapture of expenses by Advisor and Administrator 1.18% 1.16% 1.15% 1.19% 1.27%
Ratio of net investment income to average net assets 3.47% 3.19% 2.59% 2.27% 2.60%
The table below sets forth financial data for a share of beneficial interest outstanding throughout each period presented.
Year Ended December 31,Period Ended
2009 2008 2007 Dec. 31, 20061
Net Asset Value, beginning of period $8.61 $12.00 $10.77 $10.00
INCOME (LOSS) FROM INVESTMENT OPERATIONS:
Net investment income 0.322 0.382 0.27 0.02
Net realized gain (loss) and unrealized appreciation/depreciation on investments and foreign currency 3.67 (3.47) 1.67 0.77
Total from investment operations 3.99 (3.09) 1.94 0.79
LESS DISTRIBUTIONS FROM:
Net investment income (0.55) (0.30) (0.27) (0.02)
Net realized gains on investments — (0.02) (0.45) —
Total distributions (0.55) (0.32) (0.72) (0.02)
Paid-in capital from redemption fees (Note 2) 0.01 0.02 0.01 —3
Net Asset Value, end of period $12.06 $8.61 $12.00 $10.77
TOTAL RETURN 47.59% (25.97%) 18.05% 7.90%4
RATIOS/SUPPLEMENTAL DATA
Net assets, end of period (in 000’s) $322,003 $141,951 $81,624 $25,740
Ratio of expenses to average net assets before reimbursement, waiver or recapture of expenses by Advisor and Administrator (Note 3) 1.28% 1.35% 1.42% 2.93%5
Ratio of expenses to average net assets after reimbursement, waiver or recapture of expenses by Advisor and Administrator 1.30% 1.32% 1.39% 1.50%5
Ratio of net investment income to average net assets 3.16% 3.74% 2.66% 1.34%5
Portfolio turnover 32.41% 25.07% 26.95% 0.00%4
* The Fund’s name changed from Matthews Asia Pacific Equity Income Fund to Matthews Asia Dividend Fund on November 30, 2009.1 The Matthews Asia Dividend Fund commenced operations on October 31, 2006.2 Calculated using the average daily shares method.3 Less than $0.01 per share.4 Not annualized.5 Annualized.
The table below sets forth financial data for a share of beneficial interest outstanding throughout the period presented.
Period EndedDec. 31, 20091
Net Asset Value, beginning of period $10.00
INCOME (LOSS) FROM INVESTMENT OPERATIONS:
Net investment loss2 (0.01)
Net realized gain and unrealized appreciation/depreciation on investments and foreign currency 0.19
Total from investment operations 0.18
Paid-in capital from redemption fees (Note 2) —3
Net Asset Value, end of period $10.18
TOTAL RETURN 1.80%4
RATIOS/SUPPLEMENTAL DATA
Net assets, end of period (in 000’s) $7,134
Ratio of expenses to average net assets before reimbursement, or waiver of expenses by Advisor (Note 3) 10.05%5
Ratio of expenses to average net assets after reimbursement, or waiver of expenses by Advisor 1.50%5
Ratio of net investment loss to average net assets (0.81%)5
Portfolio turnover 0%4
1 The Matthews China Dividend Fund commenced operations on November 30, 2009.2 Calculated using the average daily shares method.3 Less than $0.01 per share.4 Not annualized.5 Annualized.
The table below sets forth financial data for a share of beneficial interest outstanding throughout each period presented.
Year Ended December 31,
2009 2008 2007 2006 2005
Net Asset Value, beginning of year $10.03 $17.29 $16.92 $14.89 $12.58
INCOME (LOSS) FROM INVESTMENT OPERATIONS:
Net investment income 0.061 0.131 0.09 0.07 0.07
Net realized gain (loss) and unrealized appreciation/depreciation on investments and foreign currency 4.44 (6.64) 2.02 2.50 2.30
Total from investment operations 4.50 (6.51) 2.11 2.57 2.37
LESS DISTRIBUTIONS FROM:
Net investment income (0.24) — (0.09) (0.07) (0.06)
Net realized gains on investments — (0.76) (1.66) (0.48) —
Total distributions (0.24) (0.76) (1.75) (0.55) (0.06)
Paid-in capital from redemption fees (Note 2) —2 0.01 0.01 0.01 —2
Net Asset Value, end of year $14.29 $10.03 $17.29 $16.92 $14.89
TOTAL RETURN 44.82% (37.44%) 11.92% 17.39% 18.84%
RATIOS/SUPPLEMENTAL DATA
Net assets, end of year (in 000’s) $227,651 $168,031 $471,054 $449,699 $285,169
Ratio of expenses to average net assets before reimbursement, waiver or recapture of expenses by Advisor and Administrator (Note 3) 1.28% 1.23% 1.20% 1.26% 1.35%
Ratio of expenses to average net assets after reimbursement, waiver or recapture of expenses by Advisor and Administrator 1.28% 1.23% 1.20% 1.24% 1.34%
Ratio of net investment income to average net assets 0.50% 0.93% 0.60% 0.47% 0.67%
The table below sets forth financial data for a share of beneficial interest outstanding throughout each period presented.
Year Ended December 31,
2009 2008 2007 2006 2005
Net Asset Value, beginning of year $11.05 $27.86 $23.71 $19.27 $15.90
INCOME (LOSS) FROM INVESTMENT OPERATIONS:
Net investment income 0.061 0.241 0.30 0.22 0.14
Net realized gain (loss) and unrealized appreciation/depreciation on investments and foreign currency 8.27 (13.31) 7.78 5.01 3.43
Total from investment operations 8.33 (13.07) 8.08 5.23 3.57
LESS DISTRIBUTIONS FROM:
Net investment income (0.15) (0.30) (0.31) (0.21) (0.12)
Net realized gains on investments — (3.44) (3.62) (0.58) (0.09)
Total distributions (0.15) (3.74) (3.93) (0.79) (0.21)
Paid-in capital from redemption fees (Note 2) — —2 —2 —2 0.01
Net Asset Value, end of year $19.23 $11.05 $27.86 $23.71 $19.27
TOTAL RETURN 75.37% (46.12%) 33.66% 27.22% 22.51%
RATIOS/SUPPLEMENTAL DATA
Net assets, end of year (in 000’s) $3,565,745 $1,202,441 $3,806,714 $3,303,717 $2,031,995
Ratio of expenses to average net assets before reimbursement, waiver or recapture of expenses by Advisor and Administrator (Note 3) 1.13% 1.12% 1.11% 1.18% 1.31%
Ratio of expenses to average net assets after reimbursement, waiver or recapture of expenses by Advisor and Administrator 1.13% 1.12% 1.10% 1.16% 1.31%
Ratio of net investment income to average net assets 0.41% 1.10% 1.12% 1.12% 1.10%
The table below sets forth financial data for a share of beneficial interest outstanding throughout each period presented.
Year Ended December 31,
2009 2008 2007 2006 2005
Net Asset Value, beginning of year $14.34 $39.73 $24.16 $14.76 $14.01
INCOME (LOSS) FROM INVESTMENT OPERATIONS:
Net investment income 0.091 0.301 0.12 0.15 0.22
Net realized gain (loss) and unrealized appreciation/depreciation on investments and foreign currency 11.12 (19.78) 16.85 9.39 0.74
Total from investment operations 11.21 (19.48) 16.97 9.54 0.96
LESS DISTRIBUTIONS FROM:
Net investment income (0.07) (0.33) (0.11) (0.15) (0.22)
Net realized gains on investments — (5.62) (1.37) — —
Return of capital — — — —2 —
Total distributions (0.07) (5.95) (1.48) (0.15) (0.22)
Paid-in capital from redemption fees (Note 2) 0.02 0.04 0.08 0.01 0.01
Net Asset Value, end of year $25.50 $14.34 $39.73 $24.16 $14.76
TOTAL RETURN 78.30% (48.95%) 70.14% 64.81% 6.91%
RATIOS/SUPPLEMENTAL DATA
Net assets, end of year (in 000’s) $2,566,005 $781,104 $2,335,402 $966,528 $388,950
Ratio of expenses to average net assets before reimbursement, waiver or recapture of expenses by Advisor and Administrator (Note 3) 1.21% 1.23% 1.18% 1.27% 1.31%
Ratio of expenses to average net assets after reimbursement, waiver or recapture of expenses by Advisor and Administrator 1.21% 1.23% 1.17% 1.26% 1.30%
Ratio of net investment income to average net assets 0.46% 1.03% 0.49% 0.96% 1.46%
The table below sets forth financial data for a share of beneficial interest outstanding throughout each period presented.
Year Ended December 31,Period Ended
2009 2008 2007 2006 Dec. 31 20051
Net Asset Value, beginning of period $8.37 $24.44 $15.45 $11.32 $10.00
INCOME (LOSS) FROM INVESTMENT OPERATIONS:
Net investment income (loss) 0.072 0.032 (0.01) (0.01) (0.01)
Net realized gain (loss) and unrealized appreciation/depreciation on investments and foreign currency 8.06 (15.33) 9.87 4.11 1.33
Total from investment operations 8.13 (15.30) 9.86 4.10 1.32
LESS DISTRIBUTIONS FROM:
Net investment income (0.10) (0.11) (0.21) — —
Net realized gains on investments (0.12) (0.69) (0.68) — —
Total distributions (0.22) (0.80) (0.89) — —
Paid-in capital from redemption fees (Note 2) 0.01 0.03 0.02 0.03 —3
Net Asset Value, end of period $16.29 $8.37 $24.44 $15.45 $11.32
TOTAL RETURN 97.25% (62.32%) 64.13% 36.48% 13.20%4
RATIOS/SUPPLEMENTAL DATA
Net assets, end of period (in 000’s) $720,925 $317,516 $1,311,072 $669,643 $80,897
Ratio of expenses to average net assets before reimbursement, waiver or recapture of expenses by Advisor and Administrator (Note 3) 1.27% 1.29% 1.29% 1.41% 2.75%5
Ratio of expenses to average net assets after reimbursement, waiver or recapture of expenses by Advisor and Administrator 1.27% 1.29% 1.28% 1.41% 2.00%5
Ratio of net investment income (loss) to average net assets 0.59% 0.16% (0.04%) (0.08%) (1.17%)5
1 The Matthews India Fund commenced operations on October 31, 2005.2 Calculated using the average daily shares method.3 Less than $0.01 per share.4 Not annualized.5 Annualized.
The table below sets forth financial data for a share of beneficial interest outstanding throughout each period presented.
Year Ended December 31,
2009 2008 2007 2006 2005
Net Asset Value, beginning of year $10.19 $14.55 $17.29 $18.48 $16.12
INCOME (LOSS) FROM INVESTMENT OPERATIONS:
Net investment income (loss) 0.101 0.111 0.03 (0.08) 0.02
Net realized gain (loss) and unrealized appreciation/depreciation on investments and foreign currency 0.92 (4.26) (1.86) (1.12) 2.36
Total from investment operations 1.02 (4.15) (1.83) (1.20) 2.38
LESS DISTRIBUTIONS FROM:
Net investment income (0.31) — (0.01) — (0.03)
Net realized gains on investments — (0.22) (0.91) — —
Total distributions (0.31) (0.22) (0.92) — (0.03)
Paid-in capital from redemption fees (Note 2) 0.01 0.01 0.01 0.01 0.01
Net Asset Value, end of year $10.91 $10.19 $14.55 $17.29 $18.48
TOTAL RETURN 10.06% (28.38%) (10.96%) (6.44%) 14.83%
RATIOS/SUPPLEMENTAL DATA
Net assets, end of year (in 000’s) $88,334 $123,674 $166,860 $276,656 $367,618
Ratio of expenses to average net assets before reimbursement, waiver or recapture of expenses by Advisor and Administrator (Note 3) 1.31% 1.23% 1.24% 1.25% 1.29%
Ratio of expenses to average net assets after reimbursement, waiver or recapture of expenses by Advisor and Administrator 1.31% 1.23% 1.23% 1.24% 1.28%
Ratio of net investment income (loss) to average net assets 0.97% 0.84% (0.01%) (0.29%) (0.10%)
The table below sets forth financial data for a share of beneficial interest outstanding throughout each period presented.
Year Ended December 31,
2009 2008 2007 2006 2005
Net Asset Value, beginning of year $2.75 $6.56 $6.23 $6.37 $4.08
INCOME (LOSS) FROM INVESTMENT OPERATIONS:
Net investment income (loss) (0.01)1 (0.02)1 0.07 0.01 0.01
Net realized gain (loss) and unrealized appreciation/depreciation on investments and foreign currency 1.74 (3.48) 1.15 0.80 2.39
Total from investment operations 1.73 (3.50) 1.22 0.81 2.40
LESS DISTRIBUTIONS FROM:
Net investment income — (0.06) (0.02) (0.01) —
Net realized gains on investments (0.17) (0.25) (0.87) (0.95) (0.11)
Total distributions (0.17) (0.31) (0.89) (0.96) (0.11)
Paid-in capital from redemption fees (Note 2) —2 —2 —2 0.01 —2
Net Asset Value, end of year $4.31 $2.75 $6.56 $6.23 $6.37
TOTAL RETURN 62.92% (52.66%) 18.90% 12.99% 58.76%
RATIOS/SUPPLEMENTAL DATA
Net assets, end of year (in 000’s) $138,371 $87,253 $250,421 $241,003 $269,925
Ratio of expenses to average net assets before reimbursement, waiver or recapture of expenses by Advisor and Administrator (Note 3) 1.30% 1.27% 1.21% 1.30% 1.35%
Ratio of expenses to average net assets after reimbursement, waiver or recapture of expenses by Advisor and Administrator 1.30% 1.27% 1.21% 1.28% 1.35%
Ratio of net investment income (loss) to average net assets (0.36%) (0.34%) 1.17% (0.09%) 0.27%
The table below sets forth financial data for a share of beneficial interest outstanding throughout each period presented.
Year Ended Period EndedDec. 31, 2009 Dec. 31, 20081
Net Asset Value, beginning of period $7.89 $10.00
INCOME (LOSS) FROM INVESTMENT OPERATIONS:
Net investment income 0.022 0.012
Net realized gain (loss) and unrealized appreciation/depreciation on investmentsand foreign currency 8.04 (2.16)
Total from investment operations 8.06 (2.15)
LESS DISTRIBUTIONS FROM:
Net investment income (0.05) (0.02)
Net realized gains on investments (0.15) —
Total distributions (0.20) (0.02)
Paid-in capital from redemption fees (Note 2) 0.04 0.06
Net Asset Value, end of period $15.79 $7.89
TOTAL RETURN 103.00% (21.03%)3
RATIOS/SUPPLEMENTAL DATA
Net assets, end of period (in 000’s) $109,726 $3,173
Ratio of expenses to average net assets before reimbursement, or waiver of expenses by Advisor (Note 3) 2.09% 14.31%4
Ratio of expenses to average net assets after reimbursement, or waiver of expenses by Advisor 2.00% 2.00%4
Ratio of net investment income to average net assets 0.13% 0.15%4
Portfolio turnover 21.39% 3.10%3
1 The Matthews Asia Small Companies Fund commenced operations on September 15, 2008.2 Calculated using the average daily shares method.3 Not annualized.4 Annualized.
The table below sets forth financial data for a share of beneficial interest outstanding throughout each period presented.
Year Ended December 31,
2009 2008 2007 2006 2005
Net Asset Value, beginning of year $4.71 $9.80 $7.92 $6.53 $5.45
INCOME (LOSS) FROM INVESTMENT OPERATIONS:
Net investment income (loss) —1,2 0.011 —2 (0.02) —2
Net realized gain (loss) and unrealized appreciation/depreciation on investments and foreign currency 3.31 (5.11) 1.87 1.40 1.08
Total from investment operations 3.31 (5.10) 1.87 1.38 1.08
Paid-in capital from redemption fees (Note 2) —2 0.01 0.01 0.01 —2
Net Asset Value, end of year $8.02 $4.71 $9.80 $7.92 $6.53
TOTAL RETURN 70.28% (51.94%) 23.74% 21.29% 19.82%
RATIOS/SUPPLEMENTAL DATA
Net assets, end of year (in 000’s) $130,367 $74,476 $252,304 $129,819 $50,426
Ratio of expenses to average net assets before reimbursement, waiver or recapture of expenses by Advisor and Administrator (Note 3) 1.40% 1.33% 1.26% 1.41% 1.49%
Ratio of expenses to average net assets after reimbursement, waiver or recapture of expenses by Advisor and Administrator 1.40% 1.33% 1.25% 1.39% 1.48%
Ratio of net investment income (loss) to average net assets 0.30% 0.08% (0.30%) (0.29%) 0.08%
1. SIGNIFICANT ACCOUNTING POLICIESMatthews Asia Funds, formerly known as Matthews Asian Funds (the “Trust”), is an open-end management investment company registeredunder the Investment Company Act of 1940, as amended (the “Act”). The Trust currently issues eleven separate series of shares (each a“Fund” and collectively, the “Funds”): Matthews Asian Growth and Income Fund, Matthews Asia Dividend Fund (formerly known asMatthews Asia Pacific Equity Income Fund), Matthews China Dividend Fund, Matthews Asia Pacific Fund, Matthews Pacific Tiger Fund,Matthews China Fund, Matthews India Fund, Matthews Japan Fund, Matthews Korea Fund, Matthews Asia Small Companies Fund andMatthews Asian Technology Fund. Matthews Pacific Tiger Fund, Matthews China Fund and Matthews Korea Fund are authorized to offertwo classes of shares: Class I shares and Class A shares. Currently, only Class I shares are offered. The following is a summary of significantaccounting policies consistently followed by the Funds in preparation of their financial statements.
A. SECURITY VALUATION: The Funds’ equity securities are valued based on market quotations, or at fair value as determined in good faithby or under the direction of the Board of Trustees (the “Board”) when no market quotations are available or when market quotations havebecome unreliable. Securities that trade in over-the-counter markets, including most debt securities (bonds), may be valued using indicativebid and ask quotations from bond dealers or market makers, or other available market information, or on their fair value as determined byor under the direction of the Board. The Board has delegated the responsibility of making fair value determinations to the Funds’ ValuationCommittee (the “Valuation Committee”) subject to the Funds’ Pricing Policies. When fair value pricing is employed, the prices of securitiesused by a Fund to calculate its NAV differ from any quoted or published prices for the same securities for that day. All fair valuedeterminations are made subject to the Board’s oversight.
The books and records of the Funds are maintained in U.S. dollars. Transactions, portfolio securities, and assets and liabilities denominatedin a foreign currency are translated and recorded in U.S. dollars at the prevailing exchange rate as of the close of trading on the New YorkStock Exchange (“NYSE”). Translation gains or losses resulting from changes in the exchange rate during the reporting period and realizedgains and losses on the settlement of foreign currency transactions are reported in the results of operations for the current period. TheFunds do not isolate that portion of gains and losses on investments in equity securities that is due to changes in foreign exchange ratefrom that which is due to changes in market prices of equity securities.
Market values for equity securities are determined based on quotations from the principal (or most advantageous) market on which thesecurity is traded. Market quotations used by the Funds include last reported sale prices, or, if such prices are not reported or available, bidand asked prices. Securities are valued through valuations obtained from a commercial pricing service or by securities dealers in accordancewith procedures established by the Board.
Events affecting the value of foreign investments occur between the time at which they are determined and the close of trading on theNYSE. If the Funds believe that such events render market quotations unreliable, and the impact of such events can be reasonablydetermined, the investments will be valued at their fair value. The fair value of a security held by the Funds may be determined using theservices of third-party pricing services retained by the Funds or by the Valuation Committee, in either case subject to the Board’s oversight.
Foreign securities held by the Funds may be traded on days and at times when the NYSE is closed. Accordingly, the NAV of the Funds maybe significantly affected on days when shareholders have no access to the Funds.
B. FAIR VALUE MEASUREMENTS: In accordance with the guidance on fair value measurements and disclosures under generally acceptedaccounting principles (“GAAP”), the Funds disclose the fair value of their investments in a hierarchy that prioritizes the inputs to valuationtechniques used to measure the fair value. The hierarchy gives the highest priority to valuations based upon unadjusted quoted prices inactive markets for identical assets or liabilities (level 1 measurement) and the lowest priority to valuations based upon unobservable inputsthat are significant to the valuation (level 3 measurements). Various inputs are used in determining the fair value of investments, which areas follows:
Level 1: Quoted prices in active markets for identical securities.
Level 2: Other significant observable inputs (including quoted prices for similar securities, interest rates, prepayment speeds, credit risk, etc.).
Level 3: Significant unobservable inputs (including the Fund’s own assumptions in determining the fair value of investments).
As of December 31, 2009, Level 3 Securities consist primarily of international bonds that trade in over-the-counter markets. As described inNote 1-A, these securities are valued using indicative bid and ask quotations from bond dealers and market makers, or on their fair value asdetermined under the direction of the Board. Indicative quotations and other information used by the Funds may not always be directlyobservable in the marketplace due to the nature of these markets and the manner of execution. These inputs, the methodology used forvaluing such securities, and the characterization of such securities as Level 3 Securities are not necessarily an indication of liquidity, or therisk associated with investing in these securities.
Change in unrealized appreciation/depreciation 117,993,915 845,286 3,368,410 66,793 9,478
Net purchases/(sales) 241,010,658 4,369,926 (2,479,100) 259,816 44,411
Transfers in and/or out of Level 3 — — — — —
Balance as of 12/31/09 (market value) $745,395,183 $8,325,971 $20,755,640 $326,609 $53,889
Net change in unrealized appreciation/depreciation on Level 3 investments held as of 12/31/09* $109,952,753 $845,285 $4,111,455 $66,793 $9,478
* Included in the related amounts on the Statements of Operations.
C. RISKS ASSOCIATED WITH NON-U.S. COMPANIES: Investments by the Funds in the securities of non-U.S. companies may involveinvestment risks not typically associated with investments in U.S. issuers. These risks include possible political, economical, social andreligious instability of the country of the issuer or other countries in the region, adverse diplomatic developments and the possibility ofdisruption to international trade patterns. Foreign investing may also include the risk of expropriation or confiscatory taxation, limitationon the removal or funds or other assets, currency crises and exchange controls, the imposition of foreign withholding tax on the interestincome payable on such instruments, the possible seizure or nationalization of foreign deposits or assets, or the adoption of other foreigngovernment restrictions that might adversely affect the foreign securities held by the Funds. Foreign securities may be subject to greaterfluctuations in price than securities of domestic corporations or the U.S. government. Securities of many foreign companies may be lessliquid and their prices more volatile. Foreign securities are generally denominated and pay distributions in foreign currencies, exposing theFunds to changes in foreign currency exchange rates. Individual foreign economies may differ from the economy of the United States inmany ways, including the growth of gross domestic products, rates of inflation, capital reinvestments, resource self-sufficiency, and balanceof payments positions. Some non-U.S. companies are subject to different accounting, auditing, and financial reporting standards, practices,and requirements than U.S. companies. There is generally less government regulation of stock exchanges, brokers, and listed companiesabroad than in the U.S., which may result in less transparency with respect to a company’s operations, and make obtaining informationabout them more difficult (or such information may be unavailable). Foreign stock markets may not be as developed or efficient as those inthe United States, and the absence of negotiated brokerage commissions in certain countries may result in higher brokerage fees. The timebetween the trade and settlement dates of securities transactions on foreign exchanges ranges from one day to four weeks or longer andmay result in higher custody charges.
D.FEDERAL INCOME TAXES: It is the policy of the Funds to comply with all requirements of the Internal Revenue Code of 1986, asamended (“the Code”), applicable to regulated investment companies and to distribute substantially all of their taxable income to theirshareholders. The Funds have met the requirements of the Code applicable to regulated investment companies for the year endedDecember 31, 2009. Therefore, no federal income tax provision is required. Income and capital gains of the Funds are determined inaccordance with both tax regulations and GAAP. Such treatment may result in temporary and permanent differences between tax basisearnings and earnings reported for financial statement purposes. These reclassifications, which have no impact on the net asset value of theFunds, are primarily attributable to certain differences in computation of distributable income and capital gains under federal tax rulesversus GAAP, and the use of the tax accounting practice known as equalization.
In addition to the requirements of the Code, the Funds may be subject to short-term capital gains tax in India on gains realized upondisposition of Indian securities held less than one year. The tax is computed on net realized gains; any realized losses in excess of gains maybe carried forward for a period of up to eight years to offset future gains. Any net taxes payable must be remitted to the Indian governmentprior to repatriation of sales proceeds. The Funds that invest in Indian securities accrue a deferred tax liability for net unrealized short-termgains in excess of available carryforwards on Indian securities. This accrual may reduce a Fund’s net asset value. As of December 31, 2009,the Matthews Asian Growth and Income Fund, Matthews Pacific Tiger Fund and Matthews Asia Small Companies Fund have recorded apayable of $4,289, $12,003,858 and $639,789, respectively, as an estimate for potential future India capital gains taxes.
China has recently adopted certain revisions to its tax laws and regulations that may result in holdings of the Funds in companiesheadquartered in China (whether A shares, B shares, H shares or shares traded in depositary receipt form) being subject to withholdingtaxes on dividends and other income. While the application of these changes to the Funds’ remains subject to clarification, to the extentthat such taxes are imposed on holdings of the Funds in companies headquartered in China, or withholding is imposed, the Funds’ returnswould be adversely impacted. The Funds consider the impact of a country’s tax laws and regulations, as well as withholding, whenconsidering investment decisions.
Management has analyzed the Funds tax positions taken on federal income tax returns for all open tax years (current and prior three taxyears), and has concluded that no provision for federal income tax is required in the Funds financial statements. The Funds federal and
state income and federal excise tax returns for tax years for which the applicable statutes of limitations have not expired are subject toexamination by the Internal Revenue Service and state departments of revenue.
E. OFFERING COSTS: Offering costs are amortized on a straight-line basis over one year from each Fund’s respective commencement ofoperations. In the event that any of the initial shares are redeemed during the period of amortization of the Fund’s offering costs, theredemption proceeds will be reduced by any such unamortized offering costs in the same proportion as the number of shares beingredeemed bears to the number of those shares outstanding at the time of redemption.
F. DISTRIBUTIONS TO SHAREHOLDERS: It is the policy of Matthews Asian Growth and Income Fund and Matthews China Dividend Fundto distribute net investment income on a semi-annual basis and capital gains, if any, annually. It is the policy of Matthews Asia DividendFund to distribute net investment income on a quarterly basis and capital gains, if any, annually. Matthews Asia Pacific Fund, MatthewsPacific Tiger Fund, Matthews China Fund, Matthews India Fund, Matthews Japan Fund, Matthews Korea Fund, Matthews Asia SmallCompanies Fund and Matthews Asian Technology Fund distribute net investment income and capital gains, if any, annually. Distributionsto shareholders are recorded on the ex-dividend date. Income and capital gain distributions are determined in accordance with income taxregulations which may differ from GAAP. Net investment losses may not be utilized to offset net investment income in future periods fortax purposes.
The tax character of distributions paid for the fiscal years ended December 31, 2009 and December 31, 2008 were as follows:
Net Long-Term Total TaxableYEAR ENDED DECEMBER 31, 2009 Ordinary Income Capital Gains Distributions
Matthews Asian Growth and Income Fund $60,961,205 $— $60,961,205
Matthews Asia Dividend Fund 10,189,013 — 10,189,013
Matthews Asia Pacific Fund 3,712,448 — 3,712,448
Matthews Pacific Tiger Fund 26,580,408 — 26,580,408
Matthews China Fund 6,595,986 — 6,595,986
Matthews India Fund 4,170,406 5,361,101 9,531,507
Matthews Japan Fund 2,466,218 — 2,466,218
Matthews Korea Fund — 5,234,879 5,234,879
Matthews Asia Small Companies Fund 1,251,010 — 1,251,010
Net Long-Term Total TaxableYEAR ENDED DECEMBER 31, 2008 Ordinary Income Capital Gains Distributions
Matthews Asian Growth and Income Fund $46,939,388 $146,858,628 $193,798,016
Matthews Asia Dividend Fund 3,061,632 92,307 3,153,939
Matthews Asia Pacific Fund 589,467 12,070,194 12,659,661
Matthews Pacific Tiger Fund 33,450,241 289,634,922 323,085,163
Matthews China Fund 13,004,926 222,048,330 235,053,256
Matthews India Fund 4,953,902 23,888,299 28,842,201
Matthews Japan Fund 29 2,681,646 2,681,675
Matthews Korea Fund 1,673,243 7,207,898 8,881,141
Matthews Asia Small Companies Fund 5,235 — 5,235
G.INVESTMENT TRANSACTIONS AND INCOME: Securities transactions are accounted for on the date the securities are purchased or sold.Gains or losses on the sale of securities are determined on the identified cost basis. Interest income is recorded on the accrual basis.Dividend income is recorded on the ex-dividend date.
H.FUND EXPENSE ALLOCATIONS: The Funds account separately for the assets, liabilities and operations of each Fund. Direct expenses ofeach Fund are charged to the Fund while Trust level expenses are allocated pro-rata among the Funds based on net assets or otherappropriate methods.
I. CASH OVERDRAFTS: When cash balances are overdrawn, a Fund is charged an overdraft fee by the custodian of 1.00% above the 30-dayLIBOR rate on outstanding balances. These amounts, if any, are included in Other expenses on the Statements of Operations.
J. USE OF ESTIMATES: The preparation of financial statements in conformity with GAAP requires management to make estimates andassumptions that affect the amounts reported in the financial statements and accompanying notes. Actual results may differ from thoseestimates.
2. CAPITAL SHARE TRANSACTIONSEach Fund is authorized to issue an unlimited number of shares of beneficial interest with a par value of $0.001 per share.
Year Ended December 31, 2009 Year Ended December 31, 2008
MATTHEWS ASIAN GROWTH AND INCOME FUND Shares Amount Shares Amount
Shares sold 90,611,648 $1,251,164,099 21,899,058 $328,702,177
Shares issued through reinvestment of distributions 3,866,007 56,619,667 14,082,294 183,071,148
Net increase (decrease) 454,942 $7,072,491 (9,944,340) ($63,347,458)
The Funds generally assess a redemption fee of 2.00% of the total redemption proceeds if shareholders sell or exchange their shares within90 calendar days after purchasing them. The redemption fee is paid directly to the Funds and is designed to offset transaction costsassociated with short-term trading of Fund shares. For purposes of determining whether the redemption fee applies, the shares that havebeen held the longest will be redeemed first. The Funds may grant exemption from the redemption fee when the Funds have previouslyreceived assurances that transactions do not involve market timing activity. The Funds may also waive the imposition of redemption feesin certain circumstances. For more information on this policy, please see the Funds’ prospectus. The redemption fees returned to the assetsof the Funds are stated in the Statements of Changes in Net Assets.
3. INVESTMENT ADVISORY FEES AND OTHER TRANSACTIONS WITH AFFILIATESMatthews International Capital Management, LLC (“Matthews”), a registered investment advisor under the Investment Advisers Act of1940, as amended, provides the Funds with investment management services. Pursuant to an investment Advisory Agreement datedAugust 13, 2004, as amended (the “Advisory Agreement”), the Funds, pay Matthews (i) for management and advisory services; and (ii) forcertain administrative services, an annual fee as a percentage of average daily net assets. Under the Advisory Agreement each of the Funds,other than the Matthews Asia Small Companies Fund, pays Matthews 0.75% of their aggregate annual average daily net assets from $0 to$2 billion, 0.6834% on their annual aggregate average daily net assets between $2 billion and $5 billion, and 0.65% on their annualaggregate average daily net assets over $5 billion. The Matthews Asia Small Companies Fund pay Matthews an annual fee of 1.00% of itsannual average daily net assets pursuant to the Advisory Agreement. Each Fund pays Matthews a monthly fee of one-twelth (1/12) of themanagement fee of the Fund’s average daily net asset value for each month in arrears.
Under a written agreement between the Funds and Matthews, Matthews agrees to reimburse money to a Fund if its expense ratio exceeds acertain percentage level. For Matthews China Fund, Matthews India Fund, Matthews Japan Fund, Matthews Korea Fund, Matthews Asia
Small Companies Fund and Matthews Asian Technology Fund, the level is 2.00%. For Matthews Asian Growth and Income Fund, MatthewsAsia Pacific Fund and Matthews Pacific Tiger Fund, the level is 1.90%. For Matthews Asia Dividend Fund and Matthews China DividendFund, the level is 1.50%. In turn, if a Fund’s expenses fall below the level noted within three years after Matthews has made such areimbursement, the Fund may reimburse Matthews up to an amount not to exceed its expense limitation. For each Fund, other than theMatthews Asia Small Companies Fund and Matthews China Dividend Fund, this agreement will continue through at least August 31, 2010.For the Matthews Asia Small Companies Fund and Matthews China Dividend Fund, this agreement will continue through at least April 30,2012 and November 30, 2012, respectively. These agreements may be extended for additional periods for each of the Funds. AtDecember 31, 2009, Matthews Asia Dividend Fund had $34,648 available for recoupment, of which $10,105 expires in 2010 and $24,543expires in 2011. At December 31, 2009, Matthews Asia Small Companies Fund had $94,607 available for recoupment, of which $64,333expires in 2011 and $30,274 expires in 2012. At December 31, 2009, Matthews China Dividend Fund had $30,662 available for recoupmentwhich expires in 2012.
Investment advisory fees charged and waived and fees recaptured for the year ended December 31, 2009, were as follows:
Advisory FeesWaived and
Reimbursed in Recapture ofExcess of the Previously
Gross Advisory Fees Expense Limitation Waived Fees Net Advisory Fee
Matthews Asian Growth and Income Fund $11,768,584 $— $— $11,768,584
Matthews Asia Dividend Fund 1,243,079 — 30,160 1,273,239
Matthews China Dividend Fund 2,392 (30,662) — (28,270)
Matthews Asia Pacific Fund 1,221,346 — — 1,221,346
Matthews Pacific Tiger Fund 15,346,132 — — 15,346,132
Matthews China Fund 10,678,650 — — 10,678,650
Matthews India Fund 3,305,116 — — 3,305,116
Matthews Japan Fund 752,042 — — 752,042
Matthews Korea Fund 733,098 — — 733,098
Matthews Asia Small Companies Fund 344,183 (30,274) — 313,909
Matthews Asian Technology Fund 644,901 — — 644,901
Certain officers and Trustees of the Funds are also officers and directors of the Advisor. All officers serve without compensation from theFunds. The Funds paid the Independent Trustees $298,450 in aggregate for regular compensation during the year ended December 31,2009; no special compensation was paid during this period.
The Funds have an administration and shareholder servicing agreement, pursuant to which, the Funds pay the Advisor for Administrationand shareholder servicing activities based on each Fund’s aggregate average daily net assets. The fee is charged at a rate of 0.25% of theaggregate average daily net assets in the Trust between $0 and $2 billion, 0.1834% of aggregate average daily net assets in the Trust between$2 billion and $5 billion, 0.15% of the aggregate average daily net assets in the Trust between $5 billion and $7.5 billion and 0.125% ofaggregate average daily net assets in the Trust over $7.5 billion.
Administration and shareholder servicing fees charged, for the year ended December 31, 2009, were as follows:
The Funds bear a portion of the fees paid to certain service providers (exclusive of the Funds’ Transfer Agent) which provide transfer agencyand shareholder servicing to certain shareholders. Additional information concerning these services and fees is contained in the Fund’sprospectus. Fees accrued to pay to such service providers for the year ended December 31, 2009 are a component of Transfer Agent fees andAdministration and Shareholder Servicing Fees in the Statements of Operations as follows:
Administration &Shareholder
Transfer Agent Fees Servicing Fees Total
Matthews Asian Growth and Income Fund $2,165,128 $1,066,407 $3,231,535
Matthews Asia Dividend Fund 217,750 107,250 325,000
Matthews China Dividend Fund 1,081 533 1,614
Matthews Asia Pacific Fund 221,911 109,299 331,210
Matthews Pacific Tiger Fund 1,899,487 935,568 2,835,055
Matthews China Fund 2,131,047 1,049,620 3,180,667
Matthews India Fund 586,746 288,994 875,740
Matthews Japan Fund 125,338 61,733 187,071
Matthews Korea Fund 119,477 58,847 178,324
Matthews Asia Small Companies Fund 38,225 18,827 57,052
Matthews Asian Technology Fund 125,509 61,818 187,327
PNC Global Investment Servicing (U.S.) Inc. (“PNCGIS”), an indirect wholly owned subsidiary of The PNC Financial Services Group, servesas the Trust’s administrator, and in that capacity, performs various administrative and accounting services for each Fund. PNCGIS alsoserves as the Trust’s transfer agent, dividend disbursing agent and registrar. An officer of PNCGIS serves as Assistant Treasurer to the Trust.Total fees accrued by the Funds for administration and accounting services for the year ended December 31, 2009 were as follows:
Administration andAccounting Fees
Matthews Asian Growth and Income Fund $308,692
Matthews Asia Dividend Fund 32,562
Matthews China Dividend Fund 62
Matthews Asia Pacific Fund 32,059
Matthews Pacific Tiger Fund 402,575
Matthews China Fund 280,167
Matthews India Fund 86,729
Matthews Japan Fund 19,794
Matthews Korea Fund 19,254
Matthews Asia Small Companies Fund 6,155
Matthews Asian Technology Fund 16,931
Brown Brothers Harriman & Co. serves as custodian to the Trust. PFPC Distributors, Inc., (the “Distributor”), an indirect wholly ownedsubsidiary of The PNC Financial Services Group, (the “Distributor”), serves as the Fund’s Distributor pursuant to an Underwriting Agreement.
4. INVESTMENT TRANSACTIONSThe value of investment transactions made for affiliated and unaffiliated holdings for the year ended December 31, 2009, excluding short-term investments, were as follows:
5. HOLDINGS OF 5% VOTING SHARES OF PORTFOLIO COMPANIESThe Act defines “affiliated companies” to include investments in portfolio companies in which a fund owns 5% or more of the outstandingvoting shares. During the year ended December 31, 2009, the Funds below held 5% or more of the outstanding voting shares of the notedportfolio companies. During this period, other Funds in the Trust may also have held voting shares of the issuers at levels below 5%.
Investments in affiliates:A summary of transactions in securities of issuers affiliated with a Fund for the year ended December 31, 2009 is set forth below:
DividendIncome
Shares Held at Shares Shares Shares Held at Value at Jan.1, 2009–Dec. 31, 2008 Purchased Sold Dec. 31, 2009 Dec. 31, 2009 Dec. 31, 2009
MATTHEWS ASIAN GROWTH AND INCOME FUND
Name of Issuer:
I-CABLE Communications, Ltd. 129,832,000 — 1,753,000 128,079,000 $18,768,537 $—GS Home Shopping, Inc. — 388,299 — 388,299 28,572,175 994,618Vitasoy International Holdings, Ltd. 41,197,000 10,100,000 — 51,297,000 35,815,626 1,411,622
Kingdee International Software Group Co., Ltd. 120,330,000 — — 120,330,000 $26,796,138 $341,580Lianhua Supermarket Holdings Co., Ltd. H Shares 12,995,000 4,155,000 — 17,150,000 51,603,893 513,503
Total Affiliates $78,400,031 $855,083
* Issuer was not an affiliated company as of December 31, 2009.
6. SHORT-TERM BORROWINGSThe Funds were a party to a $75,000,000 credit agreement with a group of lenders, which expired October 6, 2009. The Funds were able toborrow under the credit agreement, if necessary, to fund shareholder redemptions to allow the Funds to manage the sale of portfolioholdings at times that the Advisor believed such sales would had been unfavorable to shareholders. Each Fund was able to borrow up to themaximum amount allowable under the Funds current Prospectus and Statement of Additional Information. The Funds paid a commitmentfee of 0.12% per annum based on each Fund’s pro rata share of the unused portion of the credit agreement, which is included in Otherexpenses in the Statements of Operations as well as other certain related fees. Amounts borrowed under the credit agreement would bearan interest rate equal to the Federal Funds Rate plus 0.50%. The Funds did not borrow under the credit agreement during the year endedDecember 31, 2009. The credit agreement was not renewed.
7. FEDERAL INCOME TAX INFORMATIONAs of December 31, 2009, the components of accumulated earnings/(deficit) on tax basis were as follows:
UndistributedUndistributed Long-Term Capital Loss Post October
Ordinary Income Capital Gains Carryforwards Capital Losses**
Matthews Asian Growth and Income Fund $2,661,873 $— ($64,043,804) $—
Matthews Asia Dividend Fund 673,586 — (17,572,254) —
Matthews China Dividend Fund 3,691 — — —
Matthews Asia Pacific Fund 2,855,163 — (82,339,492) (251,590)
Matthews Pacific Tiger Fund 1,104,889 — (194,447,297) —
Matthews China Fund 319,409 — (44,320,615) —
Matthews India Fund 6,198,631 — (84,698,767) (549,463)
Matthews Japan Fund 2,536,490 — (80,527,804) —
Matthews Korea Fund — 867,841 — —
Matthews Asia Small Companies Fund 306,547 64,912 — —
Post October Other Temporary Unrealized Total AccumulatedCurrency Losses** Differences Appreciation*** Earnings/(Deficit)
Matthews Asian Growth and Income Fund ($150,834) $— $330,541,535 $269,008,770
Matthews Asia Dividend Fund (14,963) (54,728) 50,799,253 33,830,894
Matthews China Dividend Fund — — 110,931 114,622
Matthews Asia Pacific Fund (3,181) — 56,776,752 (22,962,348)
Matthews Pacific Tiger Fund (103,768) — 881,670,159 688,223,983
Matthews China Fund (416) — 614,696,784 570,695,162
Matthews India Fund (5,874) (27,205) 138,442,703 59,360,025
Matthews Japan Fund — — 9,666,065 (68,325,249)
Matthews Korea Fund (6,223) — 33,719,525 34,581,143
Matthews Asia Small Companies Fund (24,010) — 19,677,493 20,024,942
Matthews Asian Technology Fund (8,293) — 27,185,441 (8,834,525)
** Under current tax law capital and currency losses realized after October 31 and prior to the Funds’ fiscal year end may be deferred as occurring on the first day of the following fiscalyear.
***The differences between book-basis and tax-basis unrealized appreciation/(depreciation) is attributable primarily to the tax deferral of losses on wash sales and passive foreign invest-ment company (PFIC) mark to market adjustments.
For federal income tax purposes, the Funds indicated below have capital loss carryforwards, which expire in the year indicated, as ofDecember 31, 2009, which are available to offset future capital gains, if any:
LOSSES DEFERRED EXPIRING IN: 2010 2016 2017 Total
Matthews Asian Growth and Income Fund $— $— $64,043,804 $64,043,804
Matthews Asia Dividend Fund — 1,466,788 16,105,466 17,572,254
Matthews Asia Pacific Fund — 24,090,517 58,248,975 82,339,492
Matthews Pacific Tiger Fund — — 194,447,297 194,447,297
Matthews China Fund — — 44,320,615 44,320,615
Matthews India Fund — — 84,698,767 84,698,767
Matthews Japan Fund — 36,495,378 44,032,426 80,527,804
Matthews Asian Technology Fund 3,461,198 17,493,413 15,057,062 36,011,673
The Matthews Asia Small Companies Fund utilized $7,715 in capital loss carryforward. Matthews Asian Technology Fund had $5,967,059in capital loss carryforward that expired in the current year.Accounting principles generally accepted in the United States require that certain components of net assets be reclassified betweenfinancial and tax reporting. These reclassifications have no effect on net assets or net asset value per share. The permanent differences areprimarily attributable to net realized gains on PFICs, the utilization of accumulated earnings and profits distributed to shareholders onredemptions of shares as part of the dividends-paid deduction for income tax purposes, foreign currency gain reclassification, write-off ofnet operating losses, application of foreign tax credit to short-term gain and recharacterization of distributions. For the year endedDecember 31, 2009, permanent differences in book and tax accounting have been reclassified to paid-in capital, undistributed netinvestment income (loss) and accumulated realized gain (loss) as follows:
Increase/(Decrease) Increase/Increase/ Undistributed Net (Decrease)
Matthews Asian Growth and Income Fund $— ($254,140) $254,140
Matthews Asia Dividend Fund 78,366 33,831 (112,197)
Matthews China Dividend Fund (2,765) 3,512 (747)
Matthews Asia Pacific Fund — (38,360) 38,360
Matthews Pacific Tiger Fund — (1,635,756) 1,635,756
Matthews China Fund — (183,530) 183,530
Matthews India Fund — 284,741 (284,741)
Matthews Japan Fund — 1,387,091 (1,387,091)
Matthews Korea Fund (465,720) 377,043 88,677
Matthews Asia Small Companies Fund 56,850 (115,324) 58,474
Matthews Asian Technology Fund (6,019,519) (32,648) 6,052,167
8. SUBSEQUENT EVENTSOn February 2, 2010, The PNC Financial Services Group, Inc. (“PNC”) entered into a Stock Purchase Agreement (the “Stock PurchaseAgreement”) with The Bank of New York Mellon Corporation (“BNY Mellon”). Upon the terms and subject to the conditions set forth inthe Stock Purchase Agreement, which has been approved by the board of directors of each company, PNC will sell to BNY Mellon (the“Stock Sale”) 100% of the issued and outstanding shares of PNC Global Investment Servicing Inc., an indirect, wholly owned subsidiary ofPNC. The Stock Sale includes PNCGIS and PFPC Distributors, Inc. and is expected to close in the third quarter of 2010.
Management has evaluated the impact of all subsequent events on the Funds through February 23, 2010, the date the financial statements wereissued, and has determined that there were no additional subsequent events that require recognition or disclosure in the financial statements.Management is evaluating the impact of the Stock Sale and will monitor any impact on the Trust.
Report of Independent RegisteredPublic Accounting Firm
To the Board of Trustees and Shareholders ofMatthews Asia Funds:In our opinion, the accompanying statements of assets and liabilities, includingthe schedules of investments, and the related statements of operations and ofchanges in net assets and the financial highlights present fairly, in all materialrespects, the financial position of Matthews Asian Growth and Income Fund,Matthews Asia Dividend Fund, Matthews China Dividend Fund, Matthews AsiaPacific Fund, Matthews Pacific Tiger Fund, Matthews China Fund, MatthewsIndia Fund, Matthews Japan Fund, Matthews Korea Fund, Matthews Asia SmallCompanies Fund, and Matthews Asian Technology Fund (each a portfoliocomprising the Matthews Asia Funds, hereafter referred as the “Funds”) atDecember 31, 2009, and the results of each of their operations for the periodthen ended, the changes in net assets for the two years in the period thenended and the financial highlights for the three years in the period then endedfor Matthews Asian Growth and Income Fund, Matthews Asia Dividend Fund,Matthews Asia Pacific Fund, Matthews Pacific Tiger Fund, Matthews ChinaFund, Matthews India Fund, Matthews Japan Fund, Matthews Korea Fund, andMatthews Asian Technology Fund, the changes in net assets for the two years inthe period then ended and the financial highlights for the two years in theperiod then ended for Matthews Asia Small Companies Fund, and the changesin net assets and the financial highlights for the period then ended forMatthews China Dividend Fund, in conformity with accounting principlesgenerally accepted in the United States of America. These financial statementsand financial highlights (hereafter referred to as “financial statements”) are theresponsibility of the Funds’ management; our responsibility is to express anopinion on these financial statements based on our audits. We conducted ouraudits of these financial statements in accordance with the standards of thePublic Company Accounting Oversight Board (United States). Those standardsrequire that we plan and perform the audit to obtain reasonable assuranceabout whether the financial statements are free of material misstatement. Anaudit includes examining, on a test basis, evidence supporting the amounts anddisclosures in the financial statements, assessing the accounting principles usedand significant estimates made by management, and evaluating the overallfinancial statement presentation. We believe that our audits, which includedconfirmation of securities at December 31, 2009 by correspondence with thecustodian and brokers, provide a reasonable basis for our opinion.
Prior to January 1, 2007, the financial highlights for each of the periodspresented through December 31, 2006 were audited by another independentregistered public accounting firm whose report dated February 12, 2007expressed an unqualified opinion on those financial highlights.
PricewaterhouseCoopers LLP San Francisco, CA February 23, 2010
For shareholders who do not have a December 31, 2009 tax year-end, this notice is for informational purposes.
For the period January 1, 2009 to December 31, 2009, the Funds designate the following items with regard todistributions paid during the period. All designations are based on financial information available as of the date ofthis annual report and, accordingly, are subject to change. For each item, it is the intention of each Fund to designatethe maximum amount permitted under the Internal Revenue Code and the regulations thereunder.
1. Qualified Dividend Income
The Funds designate a portion of the ordinary income distributed during the year ended December 31, 2009 asQualified Dividend Income (“QDI”) as defined in the Internal Revenue code as follows:
QDI Portion
Matthews Asian Growth and Income Fund 28.84%
Matthews Asia Dividend Fund 44.50%
Matthews Asia Pacific Fund 97.71%
Matthews Pacific Tiger Fund 68.00%
Matthews China Fund 99.69%
Matthews India Fund 55.12%
Matthews Japan Fund 80.28%
Matthews Asia Small Companies Fund 12.12%
2. Long-Term Capital Gain Distributions
The Funds designate Long-Term Capital Gain distributions pursuant to Section 852(b)(3) of the Internal RevenueCode for the year ended December 31, 2009 as follows:
Long-Term Capital Gains
Matthews India Fund $5,361,101
Matthews Korea Fund 5,234,879
Matthews Asia Small Companies Fund 1,079
3. Foreign Taxes Paid
The Funds have elected to pass through to their shareholders the foreign taxes paid for year ended December 31, 2009as follows:
Foreign Source Income Foreign Taxes Paid
Matthews Asian Growth and Income Fund $82,970,816 $3,631,161
Matthews Asia Dividend Fund 8,756,493 791,817
Matthews Asia Pacific Fund 3,382,112 229,569
Matthews Pacific Tiger Fund 37,890,873 3,535,295
Matthews China Fund 26,372,417 58,644
Matthews India Fund 9,389,302 6,778
Matthews Japan Fund 2,630,128 184,161
Matthews Asia Small Companies Fund 800,819 122,074
The Funds, which are series of the Trust, have retainedMatthews International Capital Management, LLC (the“Advisor”) to manage their assets pursuant to the AdvisoryAgreement, which has been approved by the Board ofTrustees of the Funds, including the Independent Trustees.Following an initial term of two years, the Advisory Agree-ment continues in effect from year to year provided suchcontinuance is specifically approved at least annually bythe vote of the holders of at least a majority of the out-standing shares of the Funds, or by the Board of Trustees,and, in either event, by a majority of the IndependentTrustees of the Trust casting votes in person at a meetingcalled for such purpose.
At a meeting held on August 27, 2009, the Board, includ-ing the Independent Trustees of the Trust, approved thecontinuance of the Advisory Agreement, with respect toeach Fund, for an additional one-year period ending Au-gust 31, 2010. At a meeting held on November 20, 2009,the Board, including the Independent Trustees of theTrust, approved the Advisory Agreement with respect tothe China Dividend Fund, for an initial two-year periodfrom the commencement of that Fund’s operations.
Before those meetings, the Independent Trustees had re-quested detailed information from the Advisor about thematters to be considered. This information, together withthe information provided to the Independent Trusteesthroughout the course of year, formed the primary (butnot exclusive) basis for the Board’s determinations assummarized below. The Independent Trustees reviewedand discussed the extensive information provided by theAdvisor at separate executive sessions held on August 19and 27, 2009, and again on November 20, 2009 with re-spect to the new China Dividend Fund. The IndependentTrustees were assisted in their deliberations by their inde-pendent legal counsel. Below is a summary of the factorsconsidered by the Board in approving the AdvisoryAgreement with respect to each Fund.
The nature, extent and quality of the services pro-vided by the Advisor under the Advisory Agree-ment. The Trustees considered the experience andqualifications of the personnel at the Advisor who areresponsible for providing services to the Funds andwho are responsible for the daily management of theFunds’ investment objectives. They also reviewed sig-nificant recent changes to the Advisor’s portfolio man-agement personnel and their responsibilities, reflectinga long-term vision for the Advisor’s business and forthe Funds. In particular, the Trustees noted there wereno cuts to the portfolio management teams, and theaddition of a trading desk professional. The Trusteesviewed the Advisor as having been successful in con-tinuing to provide high-quality services to the Fundswhile weathering very challenging securities markets
as well as asset and revenue contractions. The Trusteesattributed much of that success to the Advisor’s em-phasis of preserving and enhancing portfolio manage-ment team resources, careful business planning andmanagement, as well as its solid financial conditionand strong cash reserves. As in past years, the Trusteesconsidered the Advisor’s succession planning to ad-dress situations where key personnel become unavail-able, and the design and implementation of theAdvisor’s disaster recovery and business continuityplan. The Trustees also considered the Chief Compli-ance Officer’s report regarding the compliance re-sources, initiatives, programs and structures of theAdvisor, including the compliance record of the Advi-sor and the Advisor’s supervision of the Funds’ serviceproviders. The Trustees concluded that the Advisor hashigh-quality compliance and a culture of compliance.The Trustees further noted in this regard that, despitethe Advisor’s decline in profitability, there had been nonoteworthy cuts to the compliance personnel or re-sources supporting the Funds, further evidencing theAdvisor’s commitment to compliance. The Trusteesrecognized the extent of the Advisor’s ongoing com-mitment to marketing and distribution, particularlynew branding and marketing initiatives, enhancementto client retention efforts, as well as resources devotedto investor education publications and website designand function. Other initiatives observed by theTrustees included significant efforts related to relation-ships with broker-dealers, independent advisors, andother financial institutions. The Trustees concludedthat the Advisor had the quality and depth of person-nel and investment methods essential to performingits duties under the Advisory Agreement, and that thenature, overall quality, cost and extent of such man-agement services are satisfactory and reliable.
The investment performance of the Advisor. TheTrustees reviewed the short-term and long-term per-formance of each Fund on both an absolute basis andin comparison to peer funds and benchmark indices.The Trustees emphasized longer-term performance,which they believe is more important to evaluate theAdvisor’s success in meeting shareholder objectivesthan short isolated periods. They also noted largely fa-vorable recent relative performance trends. To the ex-tent of any concerns about performance with respectto any particular period for a Fund, the Trustees notedthat the Advisor had articulated and taken credibleplans to address performance and explained its rea-sons for maintaining a consistent investment philoso-phy. The Trustees also reviewed both the Lipper peercomparison measures and Morningstar ratings foreach of the Funds for various periods ending June 30,2009. With respect to the China Dividend Fund, the
Approval of Investment Advisory Agreement (Unaudited)
Trustees considered the Advisor’s performance for theother Funds and in the dividend-and China-specificstrategies.
For Matthews Asian Growth and Income Fund, theTrustees noted that the Fund is the top-performingfund for the ten-year and since-inception periods inits Lipper peer group, but underperformed with re-spect to the three-year and five-year periods with aranking below the peer group average (while stillproducing positive performance). Relative perform-ance for the one-year period was above median.
For Matthews Asia Dividend Fund, the Trusteesnoted that the Fund had outperformed its peer groupduring the one-year and since inception periods,again ranking in the top quintile for those periods.
For Matthews Asia Pacific Fund, the Trustees notedthat the Fund’s performance compared more favor-ably against its peers for the one-year, three-year, five-year and since-inception periods than it had last year.The Fund ranked in the top quintile for those periodsin its Pacific region peer group.
For Matthews Pacific Tiger Fund, the Trustees notedthat the Fund’s performance was favorable in theone-year, three-year, five-year, ten-year and since-in-ception periods, ranking in the first or second quin-tiles for those periods against the Lipper peer group.
For Matthews China Fund, the Trustees noted thatthe Fund had outperformed the median of its peerfunds over the one-year, three-year, five-year, ten-year and since-inception periods, ranking in the topquintile for most of those periods. The Trustees alsonoted the Fund’s positive absolute performance overthose periods other than the most recent one-yearperiod.
For Matthews India Fund, the Trustees noted that theFund had outperformed its peer funds over the one-year, three-year and since inception periods, rankingin the first quintile. The Trustees also noted that mostof the Fund’s peers do not focus on India, but insteadinvest more generally across emerging markets.
For Matthews Japan Fund, the Trustees noted thatthe Fund’s performance was more favorable than themedian return of its peer funds over the one-year,three-year and since-inception periods, but had sub-stantially lagged its peer funds for the five-year andten-year periods. The Trustees noted that the under-performance concerns had been addressed to theTrustees’ satisfaction by the Advisor and the more-recent performance trends showed preliminary signsthat actions taken by the Advisor had the potentialto be effective.
For Matthews Korea Fund, the Trustees noted thatthe Fund had underperformed its peer group overthe one-year, three-year, five-year, ten-year and sinceinception periods, but that the Fund was the bestperforming fund in its broader peer group for theten-year period. The Trustees noted that the broaderLipper peer group consists of Pacific-oriented fundsexcluding Japan, which is too broad to be a usefulpeer group. A more limited peer group of funds with50% or more of their assets in Korea shows the Fundranked favorably above the average for those timeperiods.
For Matthews Asia Small Companies Fund, theTrustees noted that the Fund had exceeded the aver-age performance of its peer group for the very shortperiod since inception, which was not yet a full year.
For Matthews Asian Technology Fund, the Trusteesnoted that the Fund’s performance was much morefavorable than the median return of its peer fundsover the five-year and since-inception periods (rank-ing first), but less favorable than the average return ofits peer funds over the one-year and three-year peri-ods and that absolute performance was negative likeits peers. The Trustees also observed that the funds inthe peer group invested globally, rather than beinglimited to Asia as the Fund’s investment strategy is.
The Trustees noted of the difficulty of fairly bench-marking certain of the Funds in terms of performanceand noted that they were of the view that more weightshould be given to the Advisor’s analysis of relative per-formance and comparability of the peer groups than tostandard data provided by Lipper, Inc. and Morningstar,Inc. The Trustees also gave more weight to each Fund’slonger-term investment performance given the long-term investment philosophy of each Fund. On that ba-sis, the Trustees concluded that they were satisfied withthe Funds’ overall performance records. The Trusteesalso reviewed the Advisor’s trading policies and effortsto obtain best overall execution for the Funds in thevarious markets in which the Funds trade securities.The Trustees noted the relatively low turnover rates inthe various Funds and the Advisor’s consistent adher-ence to its long-standing investment approach, whichemphasizes fundamental bottom-up driven investmentselection.
The extent to which the Advisor realizes economiesof scale as the Funds grow larger and whether fee lev-els reflect these economies of scale for the benefit ofFund investors. The Trustees discussed the Advisor’s on-going investment in its business and personnel, which isan acceptable way of realizing economies of scale. TheTrustees considered the personnel, technology and otherinfrastructure investments by the Advisor that could be
Approval of Investment Advisory Agreement (Unaudited) (continued)
expected to benefit shareholders. The Trustees also rec-ognize that, earlier in the year, the Funds’ economiesof scale had diminished as total assets declined, butthat market conditions and asset growth improvedlater in the year, which was consistent with industry-wide trends. The Trustees concluded that the currentfee structure enhances the ability of the Funds andtheir shareholders to benefit from past and future po-tential economies of scale, and continues to be appro-priate given the size and objectives of the Funds. TheTrustees noted that the China Dividend Fund wouldbenefit from the scale of most of the other Funds be-cause of the combined advisory fee structure.
The costs of the services provided by the Advisorand others. The Trustees considered the advisory feesand total fees and expenses of each Fund in compari-son to the advisory fees and other fees and expenses ofother funds in each Fund’s relevant peer group. TheTrustees considered both the gross advisory fee ratescharged by the Advisor, as well as the effective advisoryfee rates after taking into consideration the expenselimitation arrangements and voluntary fee waivers.The Trustees found that the contractual advisory rates(excluding administrative services) for the Funds werevery competitive and generally lower than the relevantpeer group averages. Also, the total expense ratios paidby investors in the Funds, which are most representa-tive of an investor’s net experience, were also verycompetitive, with all but the newest (Small Compa-nies) Fund ranking below the peer group averages.The Trustees noted that the fees and expenses for theChina Dividend Fund were expected to be competitiveand reasonable although there were no sufficiently spe-cific fund peer groups to determine a more-preciseranking.
For each of Matthews Asia Dividend Fund,Matthews China Fund, Matthews Japan Fund,Matthews Korea Fund and Matthews Asian Tech-nology Fund, the Trustees noted that the gross advi-sory fee rates, the gross management fee (includingadministration) rates, the total expense ratio, theeffective advisory fee rates and the actual nonmanage-ment fee rates (which include transfer agent and cus-todian fees) are all lower than most of the funds ineach Fund’s peer group. In the case of the MatthewsAsian Technology Fund, the total expenses are slightlyhigher than the comparable fee ratios of median funds(excluding Rule 12b-1 fees and non-Rule 12b-1 servic-ing fees) in this peer group.
For Matthews Pacific Tiger Fund, the Trusteesnoted that the gross advisory fee rates, the total ex-pense ratio, the effective advisory fee rates and theactual nonmanagement expense rates (which in-clude transfer agent and custodian fees) are lower
than most of the funds in that Fund’s peer groupwhile the gross management fee (including adminis-tration) rates are slightly higher than the average ofthe Fund’s peer group.
For Matthews Asian Growth and Income Fund, theTrustees noted that the gross advisory fee rates, thetotal expense ratio and the effective advisory fee ratesare lower than most of the funds in that Fund’s peergroup while the gross management fee (including ad-ministration) rates and the actual nonmanagementfee rates (which include transfer agent and custodianfees) are very slightly higher than the median of theFund’s peer group.
For Matthews Asia Pacific Fund, the Trustees notedthat the gross advisory fee rates, the gross manage-ment fee (including administration) rates, the totalexpense ratio, the effective advisory fee rates andthe actual nonmanagement expense rates (which in-clude transfer agent and custodian fees) are all lowerthan most of the funds in that Fund’s peer group.
For Matthews India Fund, the Trustees noted that thegross advisory fee rates, the gross management fee (in-cluding administration) rates, the total expense ratioand the effective advisory fee rates are all lower thanmost of the funds in that Fund’s peer group while theactual nonmanagement fee rates (which include trans-fer agent and custodian fees) are slightly less than theaverage of the Fund’s peer group.
For Matthews Asian Small Companies Fund, theTrustees noted that the gross advisory fee rate is lowerthan the peer group funds, but that the Fund’s smallsize (in light of its relatively recent inception) has re-sulted in total expense ratio and actual nonmanage-ment fee rates (which include transfer agent andcustodian fees) well above the median of the Fund’speer group. The Trustees expect that the Fund’s com-parative position should improve as the Fund grows.
The Trustees also compared the Advisor’s advisory feeswith those of the Advisor’s separate accounts and otherinvestment products, noting that the Funds’ advisoryexpenses were not disadvantageous (being equal to theseparate accounts). Total expenses appeared to be ap-propriate in comparison and taking into account theservice differences between these products and theFunds, including the differences in the frequency of netasset value calculations. The Trustees considered variousspecific Fund expenses, including the custody fees andtransfer agent fees. The Trustees noted the Advisor’s ef-forts in early 2008 had resulted in, for each of theFunds, (a) reduced expenses under the administrationand shareholders services plan, (b) reduced custodianexpenses, and (c) reduced transfer agency fees. TheTrustees also observed the generally lower commission
Approval of Investment Advisory Agreement (Unaudited) (continued)
rates enjoyed by the Funds. The Trustees concludedthat the Advisor’s advisory fee ratio and the Funds’ ex-pense ratios are reasonable in light of comparative per-formance and expense and advisory fee information foreach of the Funds.
The profits to be realized by the Advisor and its affil-iates from the relationships with the Funds. TheTrustees reviewed the profitability of the Advisor onboth an absolute basis and in comparison to other in-vestment advisers. The Trustees noted that the Advisor’spretax profit margin appeared to be reasonable in rela-tion to other advisers. The Trustees also noted that theAdvisor appeared to be sufficiently profitable to operateas a viable investment management firm, able to honorits obligations as a sponsor of the Funds, including theFunds that did not generate a profit for the Advisor,without earning excessive profits from any particularFund or from the overall relationship with the Funds.The Trustees noted that, with more recent declines inasset levels, declines in profitability could be expected,but also noted the continued expenditures on informa-tion technology and personnel. The Trustees furthernoted that the Advisor’s continued upgrading of itstrading, research, compliance, disaster recovery andother technological systems should increase the Advi-sor’s capacity, speed and reliability in providing servicesto the Funds, which further support the long-term via-bility of the Funds and the Advisor. The Trustees alsoconsidered that the additional benefits derived by theAdvisor from its relationship with the Funds are limitedsolely to research and execution benefits received inexchange for “soft dollars.” After such review, theTrustees determined that the profitability rate to theAdvisor with respect to the Advisory Agreement is fairand reasonable in consideration of the services it pro-vides to the Funds.
No single factor was determinative of the Board’s deci-sion to approve the Advisory Agreement, but rather theTrustees based their determination on the total mix of in-formation available to them. After considering the factorsdescribed above, the Board concluded that the terms of theadvisory arrangements are fair and reasonable to eachFund in light of the services that the Advisor provides, itscosts and reasonably foreseeable Fund asset levels, and thateach Fund’s shareholders received and would receive rea-sonable value in return for the advisory fees paid. The
Board agreed that the continuance of the Advisory Agree-ment with respect to each Fund would be in the best inter-ests of the Funds and their shareholders. The IndependentTrustees concluded separately that continuance of the Ad-visory Agreement was supported by reasonable and impar-tial records and information, including the performance ofthe Funds in relation to their peer groups, the services pro-vided by the Advisor, and the competitive expense struc-ture, and that the continuance of the Advisory Agreementwith respect to each Fund would be in the best interests ofeach Fund and its shareholders.
The Advisory Agreement may be terminated by theTrustees on behalf of the Funds, or by the Advisor upon60 days’ prior written notice without penalty. The Advi-sory Agreement will also terminate automatically in theevent of its assignment, as defined in the 1940 Act.
Approval of Investment Advisory Agreement (Unaudited) (continued)
The operations of each Fund are under the direction of the Board of Trustees. The Board of Trustees establishes each Fund’spolicies and oversees and reviews the management of each Fund. The Board meets regularly to review the activities of theofficers, who are responsible for the day-to-day operations of the Funds. The Statement of Additional Information, whichincludes additional information about Fund Trustees, is available without charge by calling 800.789.2742 or by visiting theFunds’ website, matthewsasia.com. The Trustees and executive officers of the Funds, their year of birth, business addressand principal occupations during the past five years are set forth below:
Number ofTerm of Portfolios in
Name, Year of Birth, Office and Fund ComplexAddress and Position(s) Length of Principal Occupation(s) Overseen by Other Trusteeships/DirectorshipsHeld with Trust Time Served1 During Past 5 Years Trustee (number of portfolios) Held by Trustee
INDEPENDENT TRUSTEES
Director (2000–2006), iShares FundComplex, consisting of iShares, Inc.(24 Portfolios) and iShares Trust(over 70 Portfolios) managed byBarclays Global Investors; Trustee(2001–2006), Barclays GlobalInvestor Fund Complex, consistingof Barclays Global Investor Fundsand Barclays Master InvestmentPortfolios (15 Portfolios);Independent Trustee, MatthewsAsia Funds (1994–2006)(9 Portfolios).
11Dean (since 2008), Haas School ofBusiness, UC Berkeley; Chief LearningOfficer (2006–2008), Goldman Sachs;Executive Associate Dean (2005–2006),Acting Dean (2004–2005), Professor(2000–2004), Associate Professor(1996–2000), Assistant Professor(1993–1996), Haas School of Business,UC Berkeley.
Since2010
RICHARD K. LYONSBorn 1961 Four Embarcadero Center Suite 550 San Francisco, CA 94111 Trustee
Independent Chairman of the Boardof Trustees, DCA Total Return Fund(since 2005) (1 Portfolio) and DCWTotal Return Fund (since 2007)(1 Portfolio); Independent Trustee,ICON Funds (2002–2007)(17 Portfolios); Independent Director,Wasatch Funds (2002–2004)(10 Portfolios).
JOB: 10-1483-4 CYCLE#;BL#: 2; 0 TRIM: 8.25" x 10.75" COMPOSITECOLORS: Black, PANTONE 875 U, ~note-color 2 GRAPHICS: none V1.5
Number ofTerm of Portfolios in
Name, Year of Birth, Office and Fund ComplexAddress and Position(s) Length of Principal Occupation(s) Overseen by Other Trusteeships/DirectorshipsHeld with Trust Time Served1 During Past 5 Years Trustee (number of portfolios) Held by Trustee
INTERESTED TRUSTEES2
Other Trusteeships/Directorships
Name, Year of Birth, Term of Office (number ofAddress and Position(s) and Length of portfolios)Held with Trust Time Served1 Principal Occupation(s) During Past 5 Years Held by Officer
OFFICERS WHO ARE NOT TRUSTEES
1 Each trustee serves for an indefinite term, until retirement age or until his/her successor is elected. Officers serve at the pleasure of the Board of Trustees.
2 This trustee is considered an “interested person” of the Trust as defined under the 1940 Act because of an ownership interest in the Advisor and an office held with the Advisor.
NoneChief Compliance Officer, Matthews International CapitalManagement, LLC (since 2005); Senior Manager, Mutual FundCompliance/Manager Portfolio Compliance, Franklin TempletonInvestments (2001–2005).
Since 2005MANOJ K. POMBRABorn 1964Four Embarcadero CenterSuite 550San Francisco, CA 94111Chief Compliance Officer
General Counsel (since 2005), Matthews International CapitalManagement, LLC; Partner, Kirkpatrick & Lockhart NicholsonGraham LLP (2003–2005); Global Head of Compliance and RiskManagement, Allianz Dresdner Asset Management (2001–2003);Managing director, RCM Global Investors (1993–2001).
Since 2008TIMOTHY B. PARKERBorn 1958Four Embarcadero CenterSuite 550San Francisco, CA 94111Vice President
NoneVice President of Fund Accounting and Operations (since 2010),Senior Manager of Fund Accounting and Operations (2004–2009),Matthews International Capital Management, LLC.
Since 2005SHAI A. MALKABorn 1973Four Embarcadero CenterSuite 550San Francisco, CA 94111Treasurer
Senior Vice President of Business Administration (since 2009),Chief Administrative Officer (2007–2008), Chief Operating Officer(2004–2007), Matthews International Capital Management, LLC;Chief Operating Officer, Treasurer and Chief Compliance Officer,Forward Management LLC (1998–2004).
Since 2005JOHN P. McGOWANBorn 1964Four Embarcadero CenterSuite 550San Francisco, CA 94111Vice President andSecretary
NoneChief Investment Officer (Since 2009), Director of Research(2008–2009), Matthews Matthews International CapitalManagement, LLC; Head of Research, Mirae Asset Management(2006–2008); Chief Investment Officer, Everbright Pramerica(2003–2006).
Since 2009ROBERT J. HORROCKS, PHDBorn 1968Four Embarcadero CenterSuite 550San Francisco, CA 94111Vice President
Chief Executive Officer (since 2009), President and Secretary(since 2007), Matthews International Capital Management, LLC;Partner (2002–2007), Deloitte & Touche, LLP.
Since 2008WILLIAM J. HACKETTBorn 1967Four Embarcadero CenterSuite 550San Francisco, CA 94111President
Director, Matthews Asian SelectionsFunds Plc (1 Portfolio).
11Director and Portfolio Manager (Since2009), Chairman and PortfolioManager (1991–2009), ChiefInvestment Officer (1991–2007),Matthews International CapitalManagement, LLC; President of theFunds (1994–2007).
Since2007
G. PAUL MATTHEWSBorn 1956Four Embarcadero CenterSuite 550San Francisco, CA 94111Trustee
Matthews Asia FundsINVESTMENT ADVISORMatthews International Capital Management, LLCFour Embarcadero Center, Suite 550San Francisco, CA 94111800-789-ASIA
CUSTODIANBrown Brothers Harriman & Co.40 Water StreetBoston, MA 02109
ACCOUNT SERVICESPNC Global Investment Servicing (U.S.) Inc.P.O. Box 9791Providence, RI 02940800-789-ASIA
LEGAL COUNSELPaul, Hastings, Janofsky & Walker LLP55 Second Street, 24th FloorSan Francisco, CA 94105