ETSI White Paper No. 10 Maturity and field proven experience of millimetre wave transmission First edition – September 2015 ISBN No. 979-10-92620-07-8 Editor: Mikael Coldrey ETSI (European Telecommunications Standards Institute) 06921 Sophia Antipolis CEDEX, France Tel +33 4 92 94 42 00 [email protected]www.etsi.org
Transcript
ETSI White Paper No. 10
Maturity and field proven experience of millimetre wave transmission
First edition – September 2015
ISBN No. 979-10-92620-07-8
Editor:
Mikael Coldrey
ETSI (European Telecommunications Standards Institute) 06921 Sophia Antipolis CEDEX, France Tel +33 4 92 94 42 00 [email protected] www.etsi.org
Maturity and field proven experience of millimetre wave transmission 1
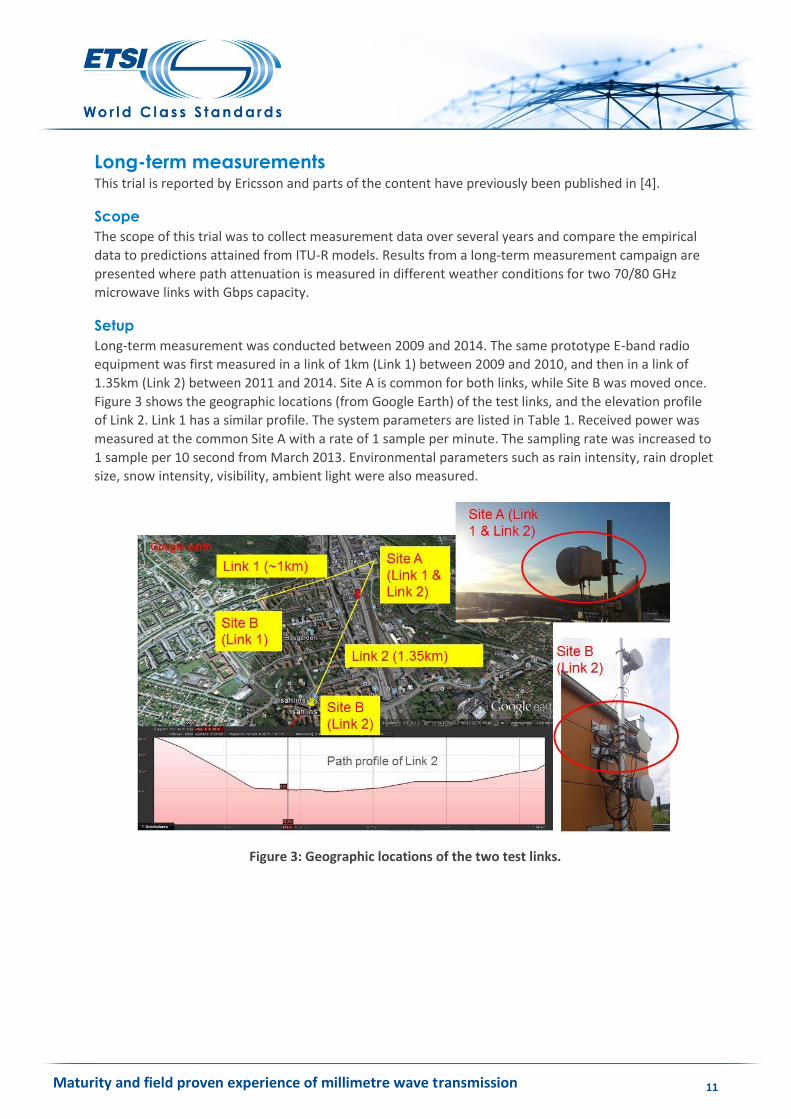
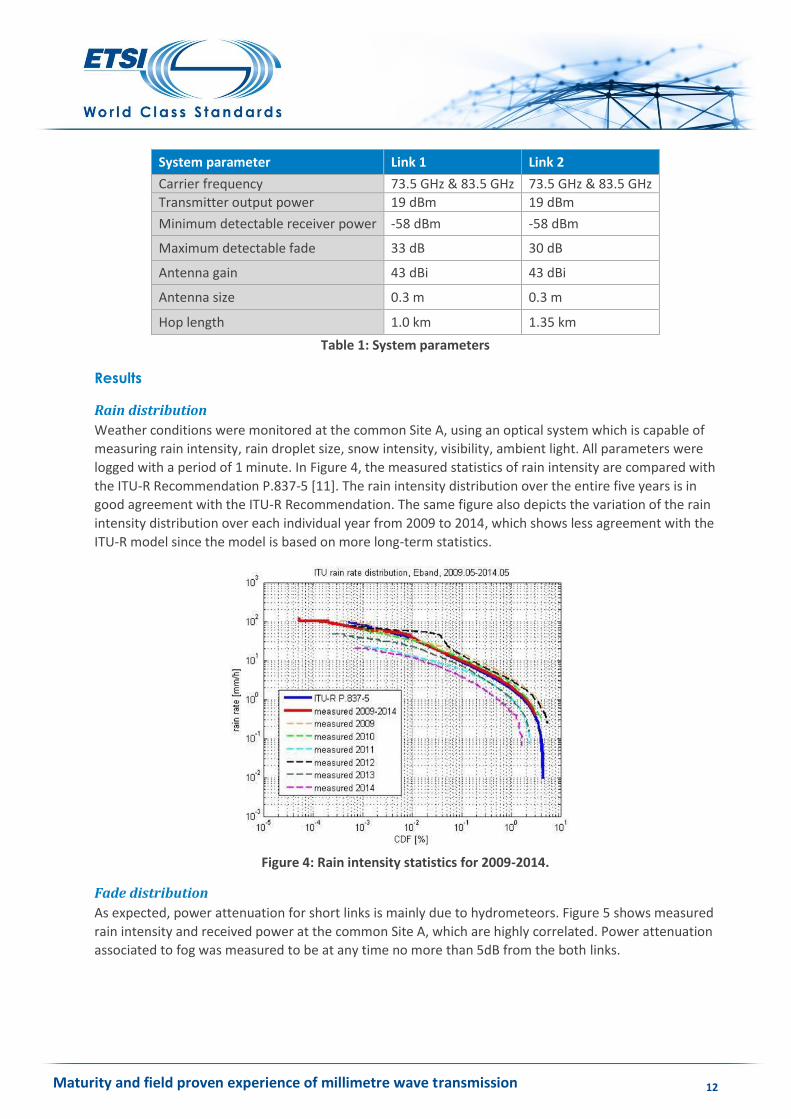
Weather conditions were monitored at the common Site A, using an optical system which is capable of
measuring rain intensity, rain droplet size, snow intensity, visibility, ambient light. All parameters were
logged with a period of 1 minute. In Figure 4, the measured statistics of rain intensity are compared with
the ITU-R Recommendation P.837-5 [11]. The rain intensity distribution over the entire five years is in
good agreement with the ITU-R Recommendation. The same figure also depicts the variation of the rain
intensity distribution over each individual year from 2009 to 2014, which shows less agreement with the
ITU-R model since the model is based on more long-term statistics.
Figure 4: Rain intensity statistics for 2009-2014.
Fade distribution
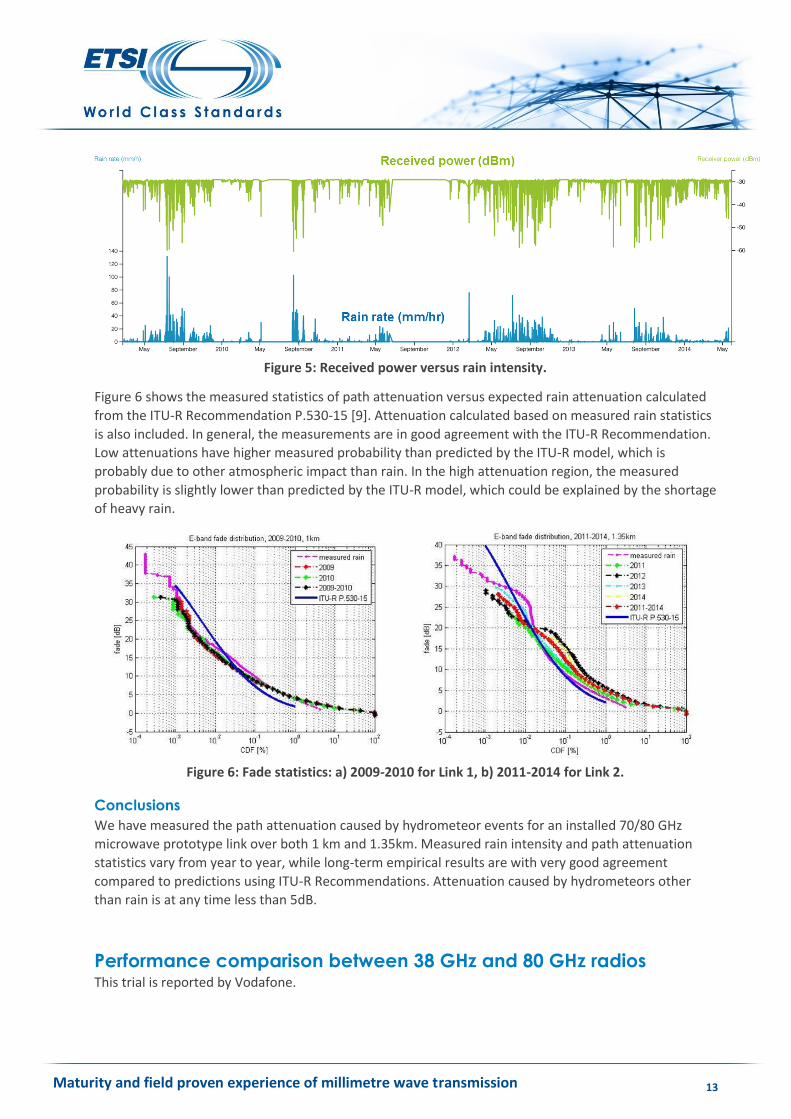
As expected, power attenuation for short links is mainly due to hydrometeors. Figure 5 shows measured
rain intensity and received power at the common Site A, which are highly correlated. Power attenuation
associated to fog was measured to be at any time no more than 5dB from the both links.
Maturity and field proven experience of millimetre wave transmission 13
Figure 5: Received power versus rain intensity.
Figure 6 shows the measured statistics of path attenuation versus expected rain attenuation calculated
from the ITU-R Recommendation P.530-15 [9]. Attenuation calculated based on measured rain statistics
is also included. In general, the measurements are in good agreement with the ITU-R Recommendation.
Low attenuations have higher measured probability than predicted by the ITU-R model, which is
probably due to other atmospheric impact than rain. In the high attenuation region, the measured
probability is slightly lower than predicted by the ITU-R model, which could be explained by the shortage
of heavy rain.
Figure 6: Fade statistics: a) 2009-2010 for Link 1, b) 2011-2014 for Link 2.
Conclusions
We have measured the path attenuation caused by hydrometeor events for an installed 70/80 GHz
microwave prototype link over both 1 km and 1.35km. Measured rain intensity and path attenuation
statistics vary from year to year, while long-term empirical results are with very good agreement
compared to predictions using ITU-R Recommendations. Attenuation caused by hydrometeors other
than rain is at any time less than 5dB.
Performance comparison between 38 GHz and 80 GHz radios This trial is reported by Vodafone.
Maturity and field proven experience of millimetre wave transmission 14
Scope
Trials were completed in Budapest in order to investigate the behaviour of E-band radio in rainy
weather conditions and to compare its performance to a 38 GHz radio.
Setup
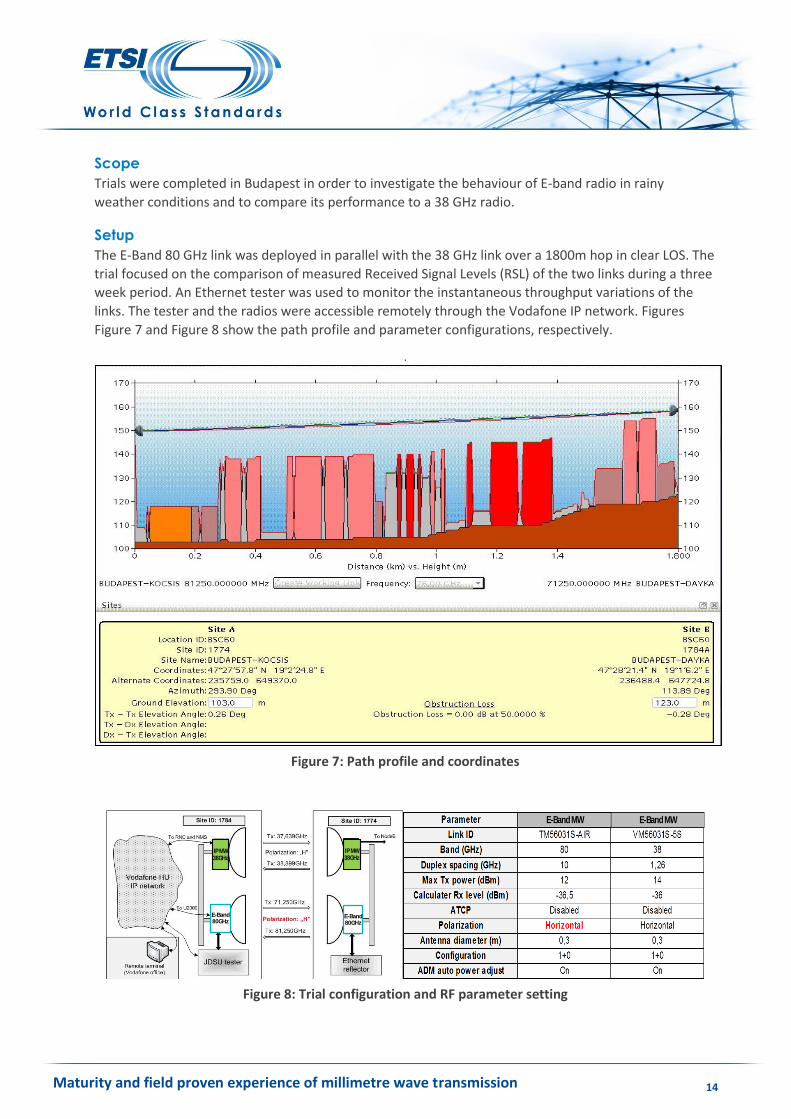
The E-Band 80 GHz link was deployed in parallel with the 38 GHz link over a 1800m hop in clear LOS. The
trial focused on the comparison of measured Received Signal Levels (RSL) of the two links during a three
week period. An Ethernet tester was used to monitor the instantaneous throughput variations of the
links. The tester and the radios were accessible remotely through the Vodafone IP network. Figures
Figure 7 and Figure 8 show the path profile and parameter configurations, respectively.
.
Figure 7: Path profile and coordinates
Figure 8: Trial configuration and RF parameter setting
IP MW 38GHz
IP MW 38GHz
E-Band 80GHz
E-Band 80GHz
E-Band MW E-Band MW
Maturity and field proven experience of millimetre wave transmission 15
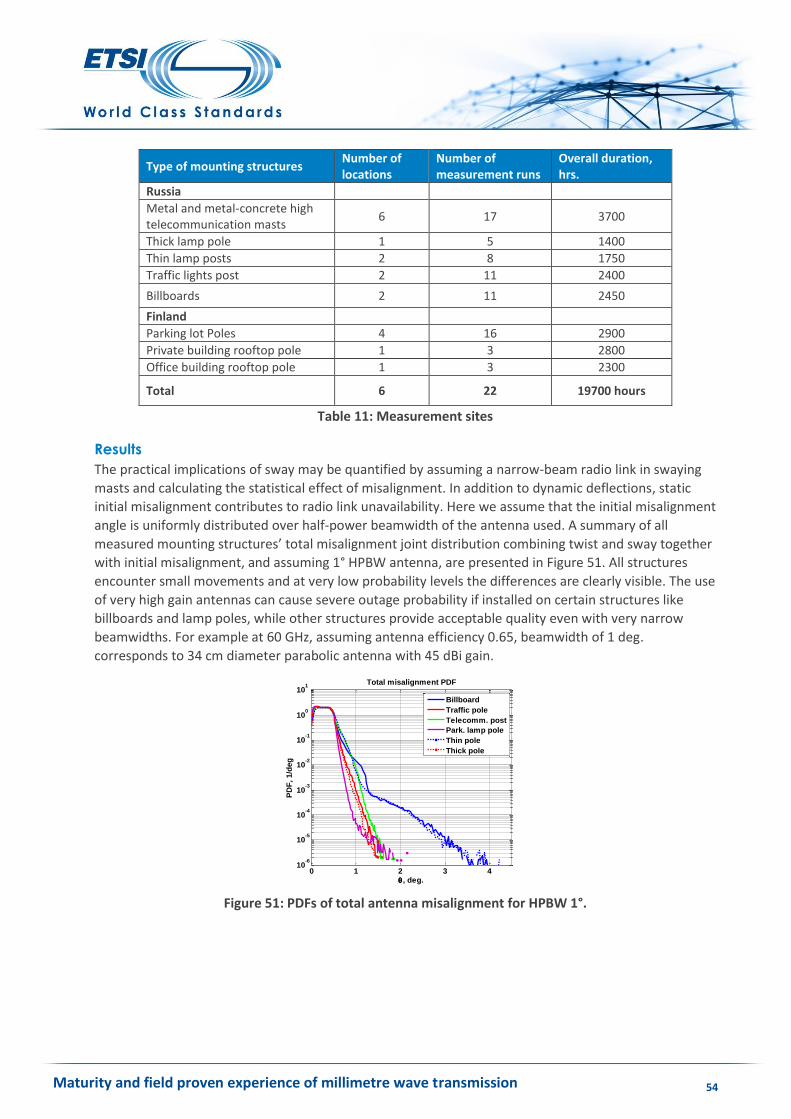
Results
The measured RSL values were collected from the Network Management Systems (NMS) of the radios.
Both NMS tools provide Min- Max- and Average RSL values measured in every consecutive 15 minute
period. It is presumable that the measurement inaccuracy of the two NMS systems is not higher than ±1
dB.
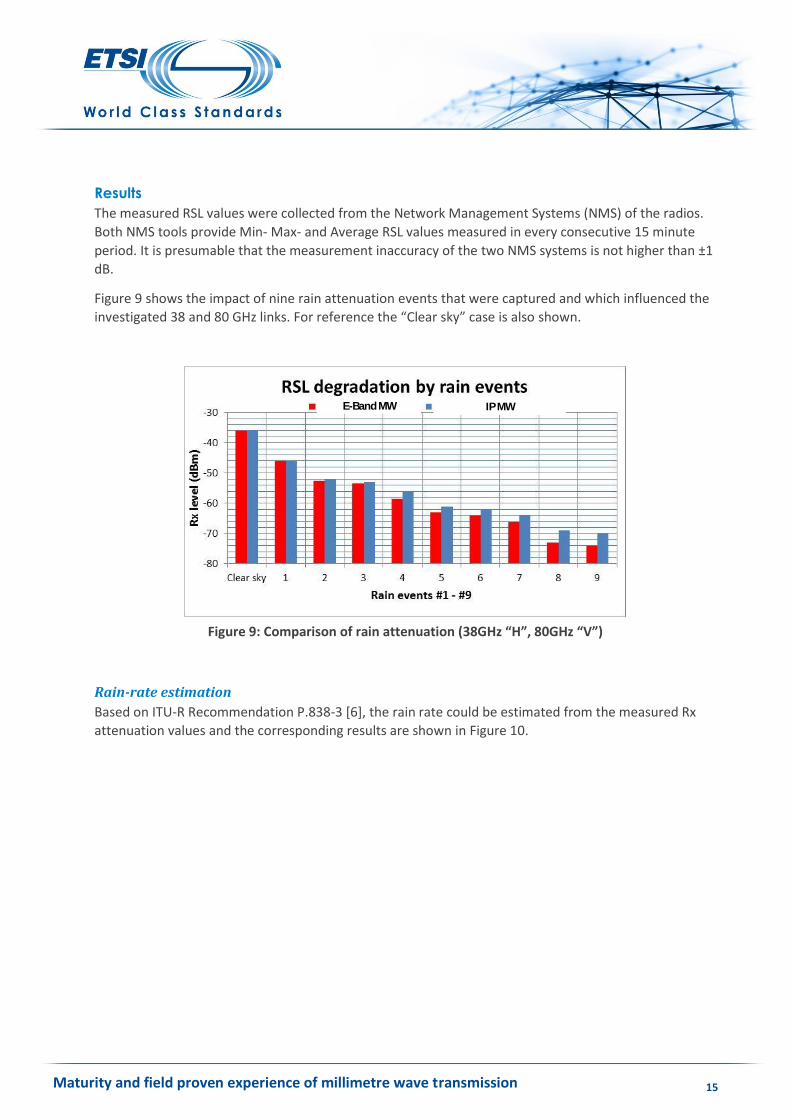
Figure 9 shows the impact of nine rain attenuation events that were captured and which influenced the
investigated 38 and 80 GHz links. For reference the “Clear sky” case is also shown.
Figure 9: Comparison of rain attenuation (38GHz “H”, 80GHz “V”)
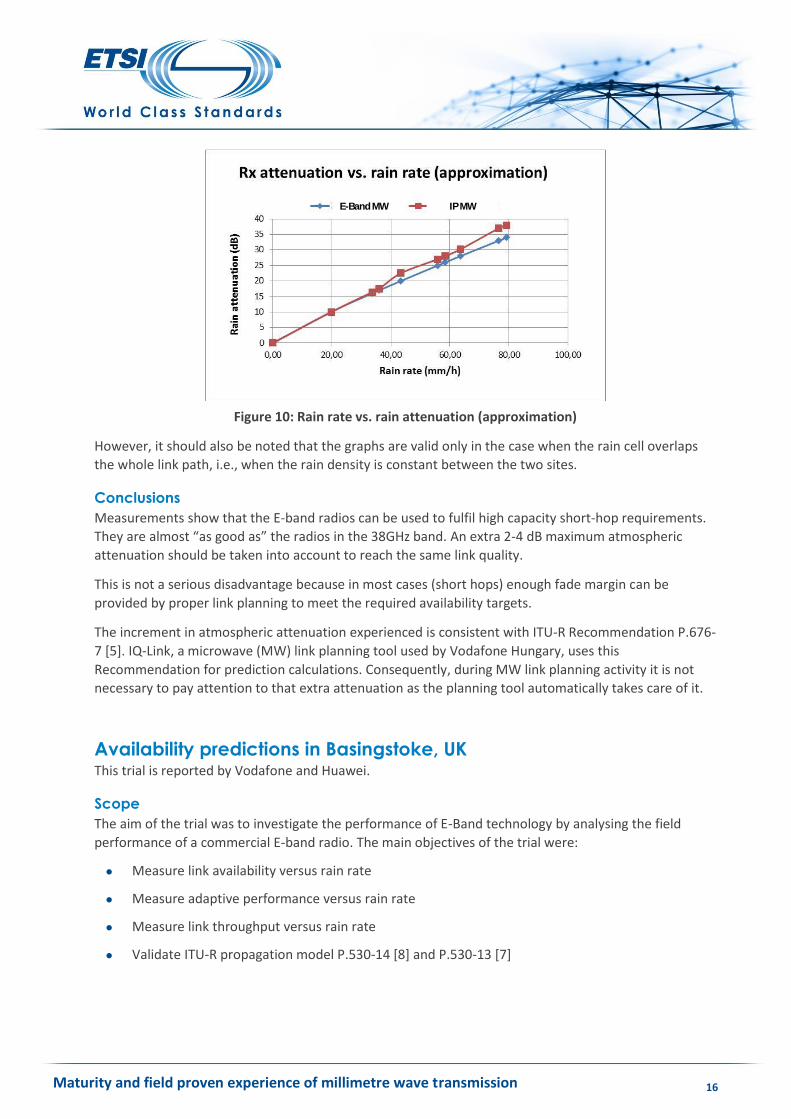
Rain-rate estimation
Based on ITU-R Recommendation P.838-3 [6], the rain rate could be estimated from the measured Rx
attenuation values and the corresponding results are shown in Figure 10.
E-Band MW IP MW
Maturity and field proven experience of millimetre wave transmission 16
Figure 10: Rain rate vs. rain attenuation (approximation)
However, it should also be noted that the graphs are valid only in the case when the rain cell overlaps
the whole link path, i.e., when the rain density is constant between the two sites.
Conclusions
Measurements show that the E-band radios can be used to fulfil high capacity short-hop requirements.
They are almost “as good as” the radios in the 38GHz band. An extra 2-4 dB maximum atmospheric
attenuation should be taken into account to reach the same link quality.
This is not a serious disadvantage because in most cases (short hops) enough fade margin can be
provided by proper link planning to meet the required availability targets.
The increment in atmospheric attenuation experienced is consistent with ITU-R Recommendation P.676-
7 [5]. IQ-Link, a microwave (MW) link planning tool used by Vodafone Hungary, uses this
Recommendation for prediction calculations. Consequently, during MW link planning activity it is not
necessary to pay attention to that extra attenuation as the planning tool automatically takes care of it.
Availability predictions in Basingstoke, UK This trial is reported by Vodafone and Huawei.
Scope
The aim of the trial was to investigate the performance of E-Band technology by analysing the field
performance of a commercial E-band radio. The main objectives of the trial were:
Measure link availability versus rain rate
Measure adaptive performance versus rain rate
Measure link throughput versus rain rate
Validate ITU-R propagation model P.530-14 [8] and P.530-13 [7]
E-Band MW IP MW
Maturity and field proven experience of millimetre wave transmission 17
Finally, a validation of the attenuation due to fog (ITU-R P.840-5 [14]) is done by analysing some fog
events during the trial.
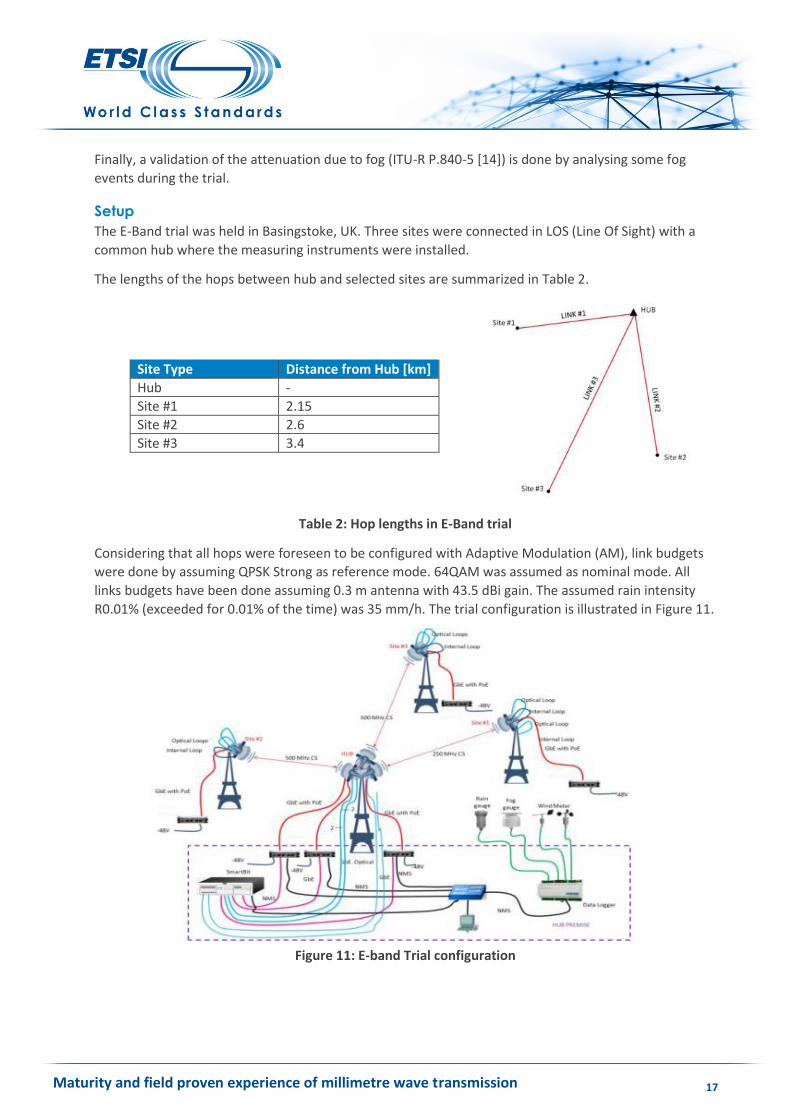
Setup
The E-Band trial was held in Basingstoke, UK. Three sites were connected in LOS (Line Of Sight) with a
common hub where the measuring instruments were installed.
The lengths of the hops between hub and selected sites are summarized in Table 2.
Table 2: Hop lengths in E-Band trial
Considering that all hops were foreseen to be configured with Adaptive Modulation (AM), link budgets
were done by assuming QPSK Strong as reference mode. 64QAM was assumed as nominal mode. All
links budgets have been done assuming 0.3 m antenna with 43.5 dBi gain. The assumed rain intensity
R0.01% (exceeded for 0.01% of the time) was 35 mm/h. The trial configuration is illustrated in Figure 11.
Figure 11: E-band Trial configuration
Site Type Distance from Hub [km]
Hub -
Site #1 2.15
Site #2 2.6
Site #3 3.4
Maturity and field proven experience of millimetre wave transmission 18
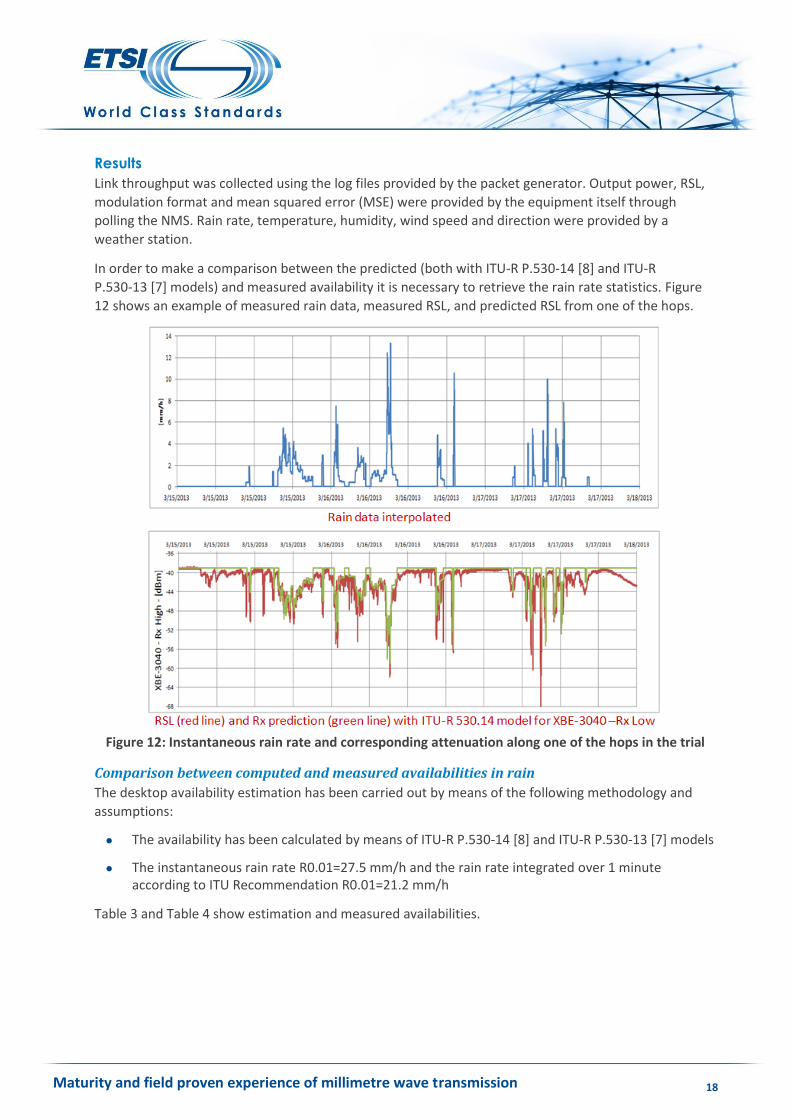
Results
Link throughput was collected using the log files provided by the packet generator. Output power, RSL,
modulation format and mean squared error (MSE) were provided by the equipment itself through
polling the NMS. Rain rate, temperature, humidity, wind speed and direction were provided by a
weather station.
In order to make a comparison between the predicted (both with ITU-R P.530-14 [8] and ITU-R
P.530-13 [7] models) and measured availability it is necessary to retrieve the rain rate statistics. Figure
12 shows an example of measured rain data, measured RSL, and predicted RSL from one of the hops.
Figure 12: Instantaneous rain rate and corresponding attenuation along one of the hops in the trial
Comparison between computed and measured availabilities in rain
The desktop availability estimation has been carried out by means of the following methodology and
assumptions:
The availability has been calculated by means of ITU-R P.530-14 [8] and ITU-R P.530-13 [7] models
The instantaneous rain rate R0.01=27.5 mm/h and the rain rate integrated over 1 minute according to ITU Recommendation R0.01=21.2 mm/h
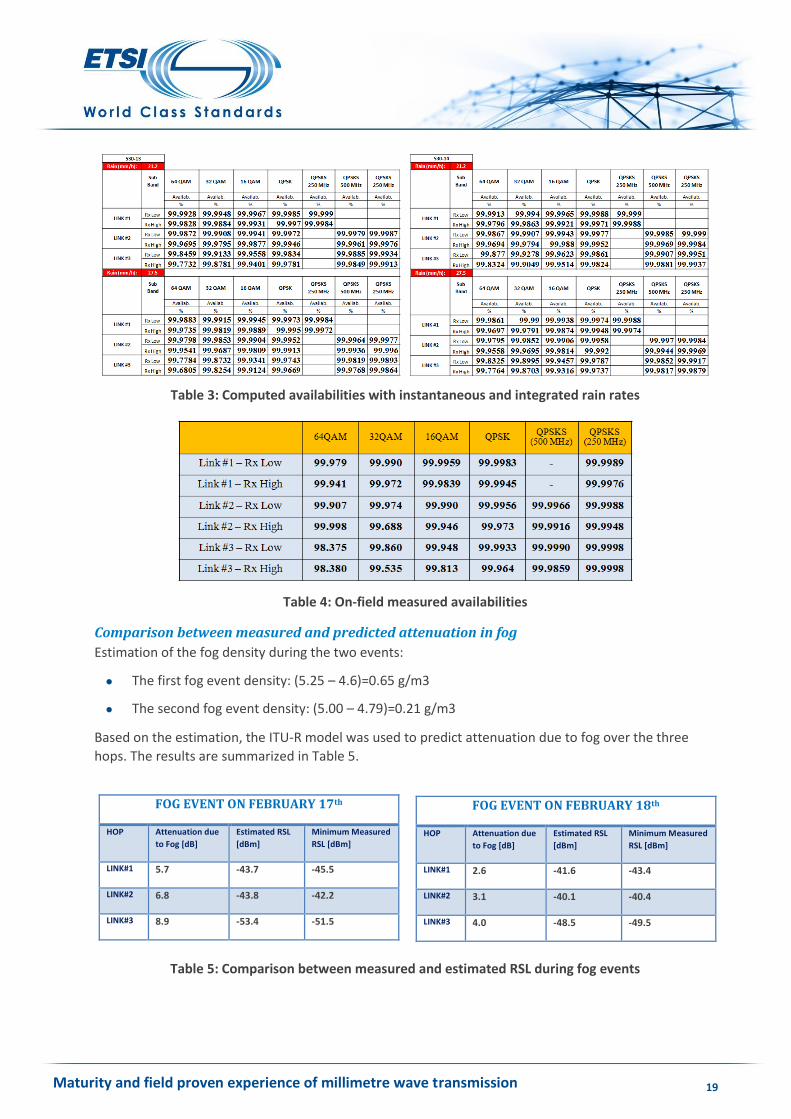
Table 3 and Table 4 show estimation and measured availabilities.
Maturity and field proven experience of millimetre wave transmission 19
Table 3: Computed availabilities with instantaneous and integrated rain rates
Table 4: On-field measured availabilities
Comparison between measured and predicted attenuation in fog
Estimation of the fog density during the two events:
The first fog event density: (5.25 – 4.6)=0.65 g/m3
The second fog event density: (5.00 – 4.79)=0.21 g/m3
Based on the estimation, the ITU-R model was used to predict attenuation due to fog over the three
hops. The results are summarized in Table 5.
FOG EVENT ON FEBRUARY 17th
HOP Attenuation due
to Fog [dB]
Estimated RSL
[dBm]
Minimum Measured
RSL [dBm]
LINK#1 5.7 -43.7 -45.5
LINK#2 6.8 -43.8 -42.2
LINK#3 8.9 -53.4 -51.5
Table 5: Comparison between measured and estimated RSL during fog events
FOG EVENT ON FEBRUARY 18th
HOP Attenuation due
to Fog [dB]
Estimated RSL
[dBm]
Minimum Measured
RSL [dBm]
LINK#1 2.6 -41.6 -43.4
LINK#2 3.1 -40.1 -40.4
LINK#3 4.0 -48.5 -49.5
Maturity and field proven experience of millimetre wave transmission 20
Conclusions
By comparing the results the following conclusions can be made:
The E-Band technology has been tested successfully in-field
As it was already clear both from the preliminary link budgets and previous chapters, the models in ITU-R P.530-13 [7] and ITU-R P.530-14 [8] are very similar.
The availabilities estimated with measured rain rates are better than those estimated in the link budgets. This is because link budgets were carried out by using the rain rate provided by ITU for the trial’s region (R0.01=35 mm/h).
It is possible to observe that, for a given rain rate, ITU-R P.530-13 [7] estimates higher availability (with respect to ITU-R P.530-14 [8]) in case of small fading margin (e.g. higher modulation formats) while it estimates lower availability in case of high fading margin (e.g. QPSK).
If we compare the estimated availabilities (with measured rain rates) with those measured in field, we can see that the rain rate that allows better predictions is the instantaneous one. That means that the two models overestimate the availability of the links if the integrated rain rate R0.01 is used.
If we consider the instantaneous rain rate, the estimated availabilities made by using ITU-R P.530-14 [8] are closer to the availabilities measured on field.
Availability predictions in Turin This trial is reported by Telecom Italia and Huawei.
Scope
The trial had the aim to characterize the use of E-band, through the collection of radio data performance
and throughput related to the weather conditions. The trial has been developed during the period from
5 June to 31 October 2013, at Telecom Italy Turin premises.
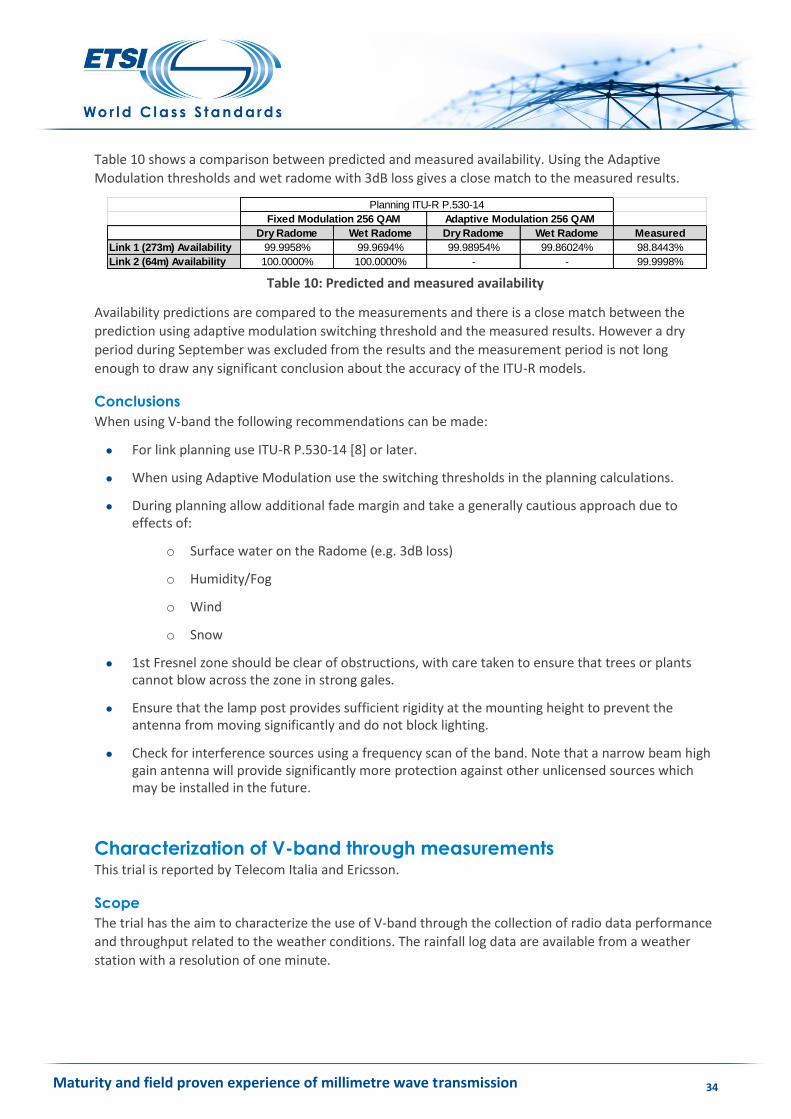
Setup
The rainfall log data are available from a weather station, with a resolution of 10 minutes, and the radio
link object of the experiment is a commercial E-band radio in a full outdoor installation with adaptive
modulation up to 64QAM.
In order to compare system performances with a traditional band installation, we used as a benchmark
a different installation that is in service in different sites close to the trial sites. This benchmark system is
an in-field installation operating in the range of 18 GHz.
Figure 13 shows the location of the E-band link (blue line), the benchmark link (red line) and some link
characteristics.
Maturity and field proven experience of millimetre wave transmission 21
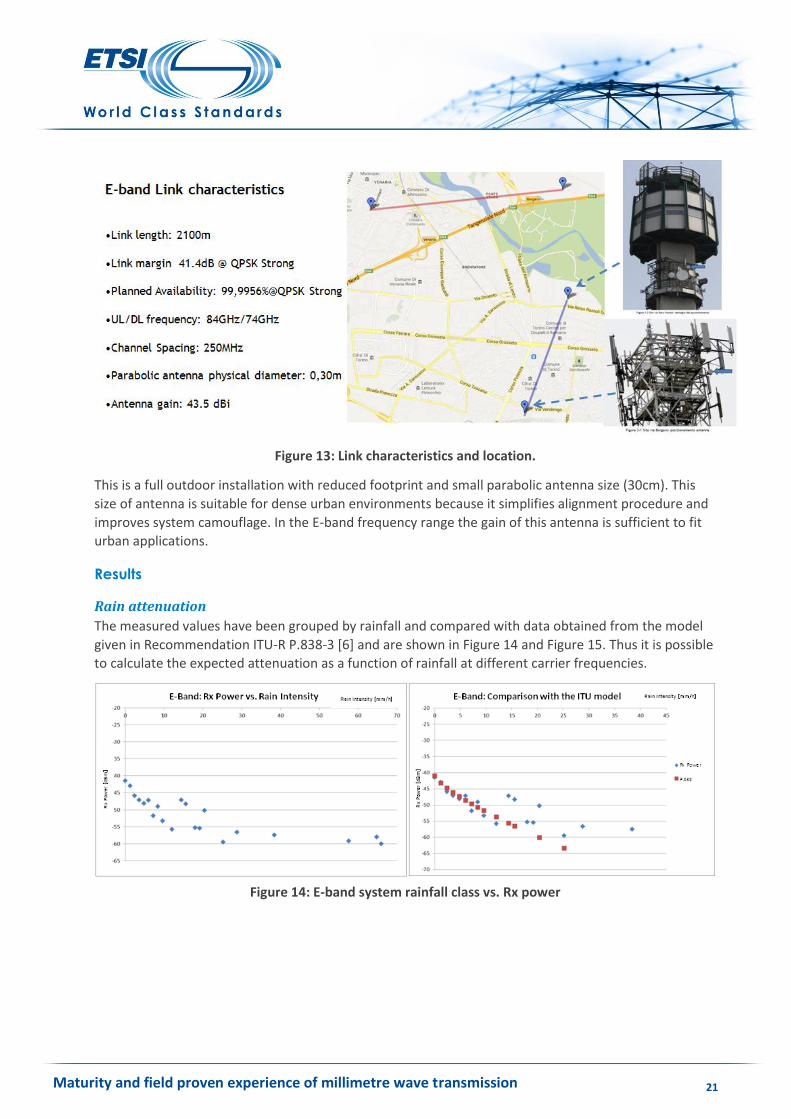
Figure 13: Link characteristics and location.
This is a full outdoor installation with reduced footprint and small parabolic antenna size (30cm). This
size of antenna is suitable for dense urban environments because it simplifies alignment procedure and
improves system camouflage. In the E-band frequency range the gain of this antenna is sufficient to fit
urban applications.
Results
Rain attenuation
The measured values have been grouped by rainfall and compared with data obtained from the model
given in Recommendation ITU-R P.838-3 [6] and are shown in Figure 14 and Figure 15. Thus it is possible
to calculate the expected attenuation as a function of rainfall at different carrier frequencies.
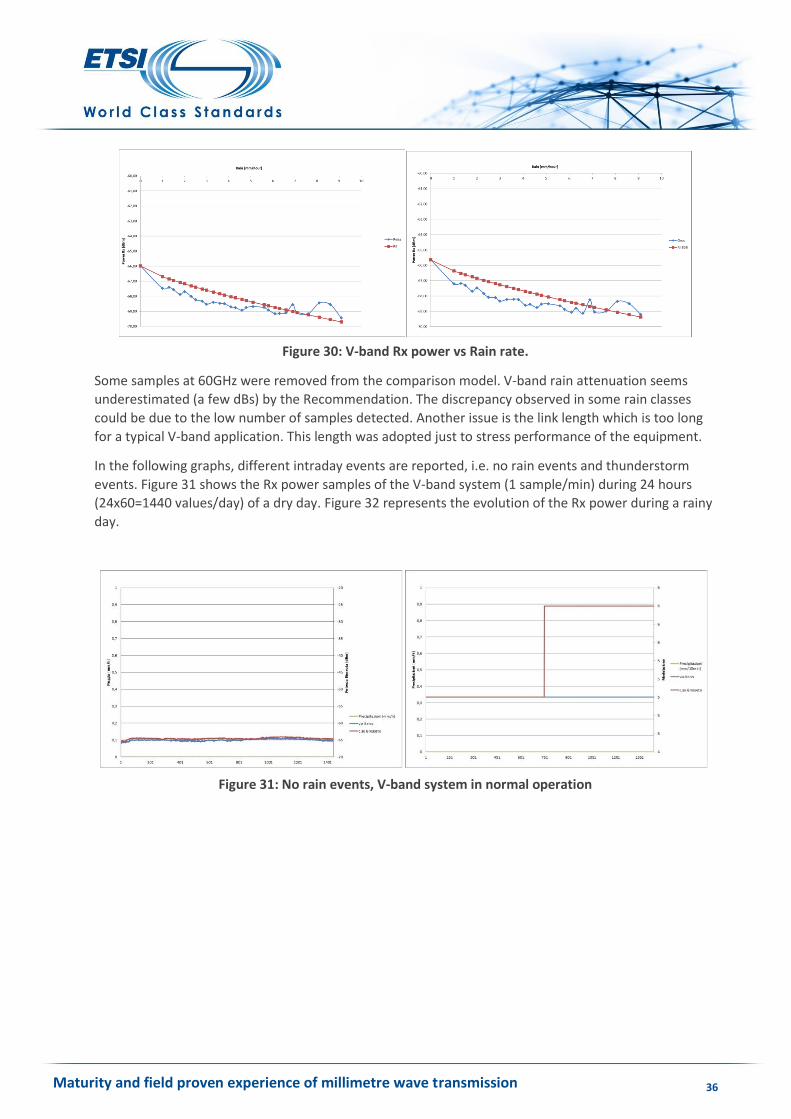
Figure 14: E-band system rainfall class vs. Rx power
Maturity and field proven experience of millimetre wave transmission 22
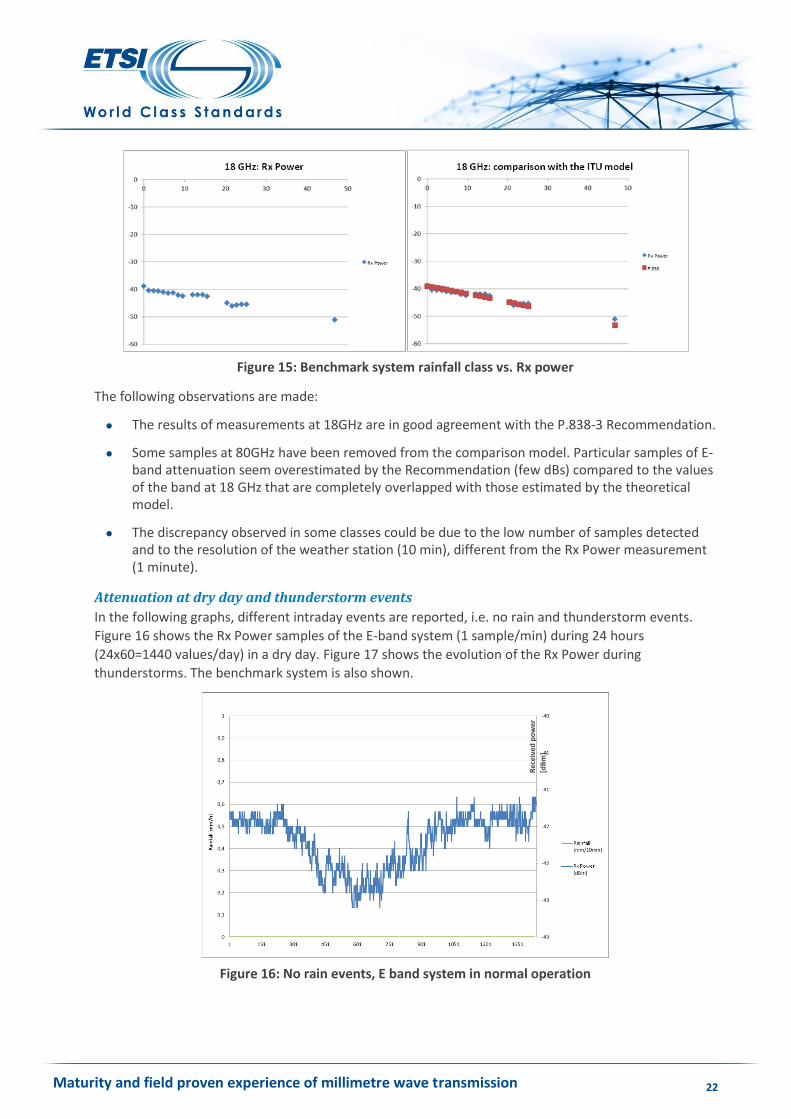
Figure 15: Benchmark system rainfall class vs. Rx power
The following observations are made:
The results of measurements at 18GHz are in good agreement with the P.838-3 Recommendation.
Some samples at 80GHz have been removed from the comparison model. Particular samples of E-band attenuation seem overestimated by the Recommendation (few dBs) compared to the values of the band at 18 GHz that are completely overlapped with those estimated by the theoretical model.
The discrepancy observed in some classes could be due to the low number of samples detected and to the resolution of the weather station (10 min), different from the Rx Power measurement (1 minute).
Attenuation at dry day and thunderstorm events
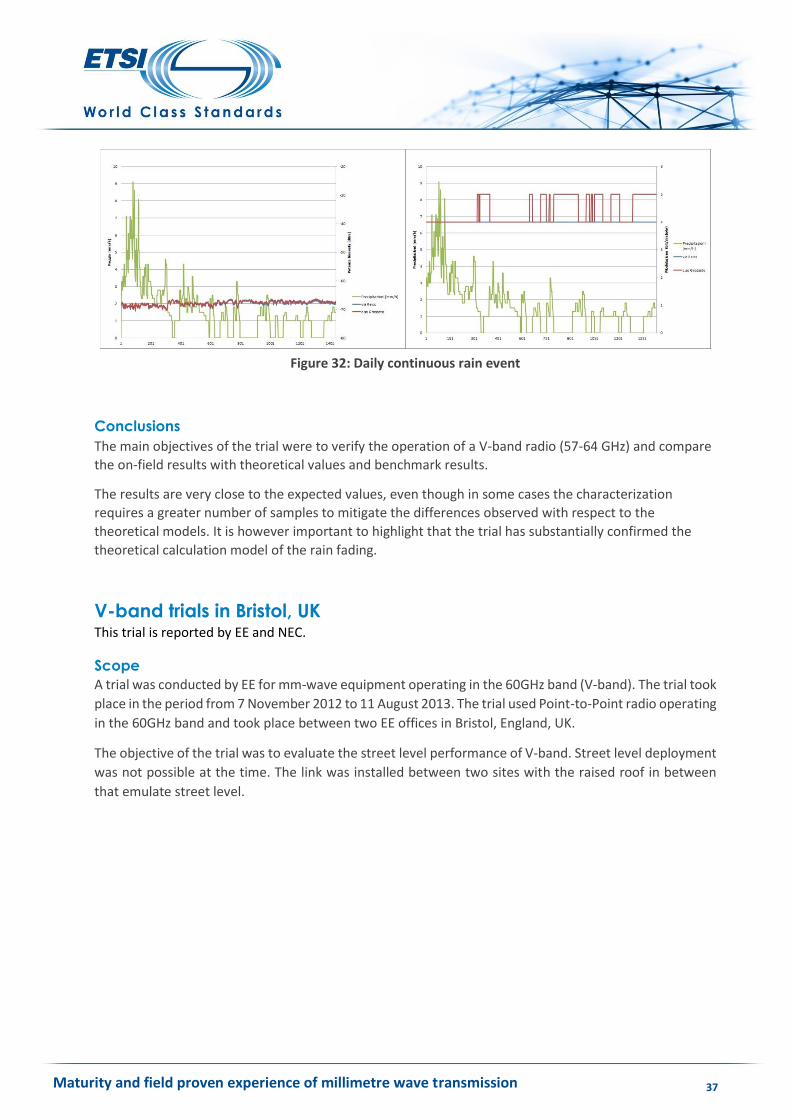
In the following graphs, different intraday events are reported, i.e. no rain and thunderstorm events.
Figure 16 shows the Rx Power samples of the E-band system (1 sample/min) during 24 hours
(24x60=1440 values/day) in a dry day. Figure 17 shows the evolution of the Rx Power during
thunderstorms. The benchmark system is also shown.
Figure 16: No rain events, E band system in normal operation
Rec
eiv
ed p
ow
er
[dB
m]
Maturity and field proven experience of millimetre wave transmission 23
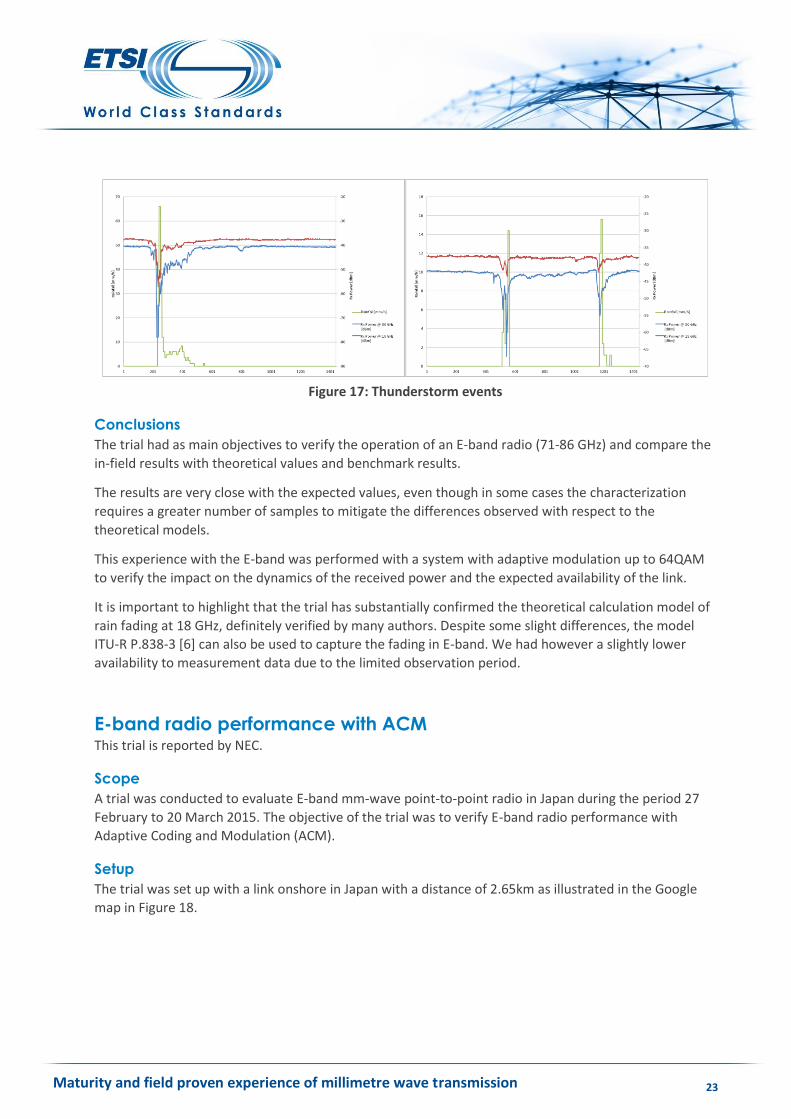
Figure 17: Thunderstorm events
Conclusions
The trial had as main objectives to verify the operation of an E-band radio (71-86 GHz) and compare the
in-field results with theoretical values and benchmark results.
The results are very close with the expected values, even though in some cases the characterization
requires a greater number of samples to mitigate the differences observed with respect to the
theoretical models.
This experience with the E-band was performed with a system with adaptive modulation up to 64QAM
to verify the impact on the dynamics of the received power and the expected availability of the link.
It is important to highlight that the trial has substantially confirmed the theoretical calculation model of
rain fading at 18 GHz, definitely verified by many authors. Despite some slight differences, the model
ITU-R P.838-3 [6] can also be used to capture the fading in E-band. We had however a slightly lower
availability to measurement data due to the limited observation period.
E-band radio performance with ACM This trial is reported by NEC.
Scope
A trial was conducted to evaluate E-band mm-wave point-to-point radio in Japan during the period 27
February to 20 March 2015. The objective of the trial was to verify E-band radio performance with
Adaptive Coding and Modulation (ACM).
Setup
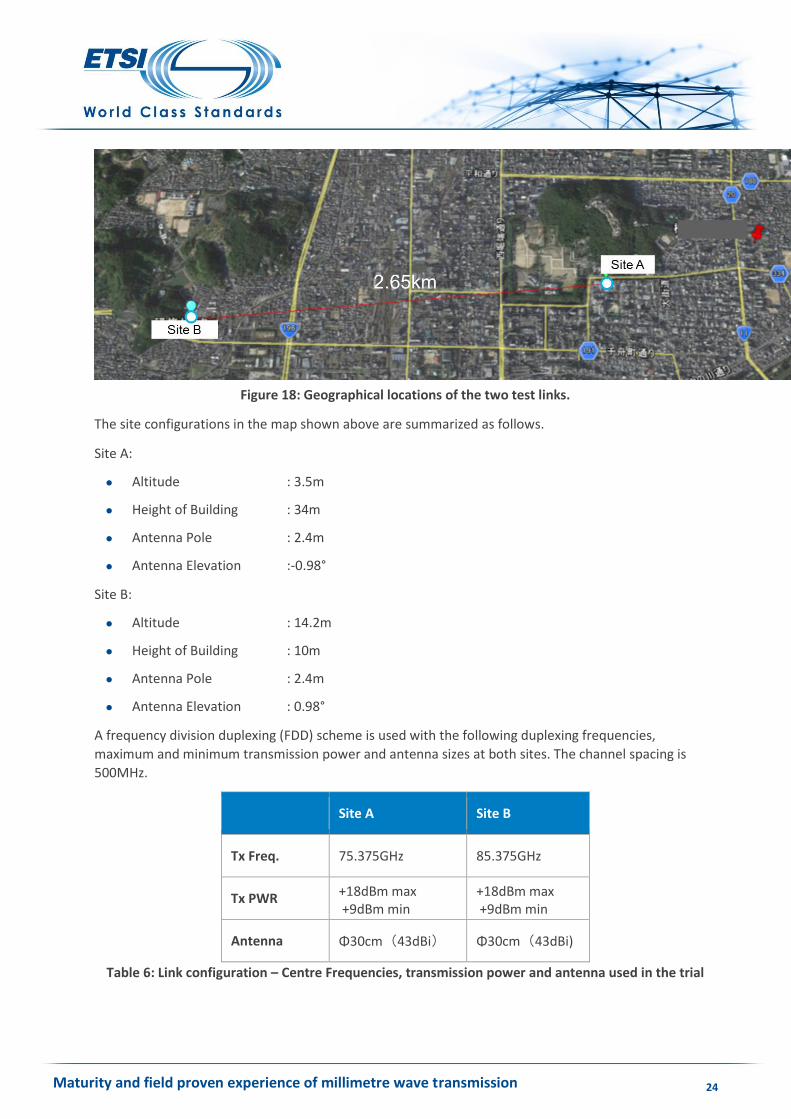
The trial was set up with a link onshore in Japan with a distance of 2.65km as illustrated in the Google
map in Figure 18.
Maturity and field proven experience of millimetre wave transmission 24
Figure 18: Geographical locations of the two test links.
The site configurations in the map shown above are summarized as follows.
Site A:
Altitude : 3.5m
Height of Building : 34m
Antenna Pole : 2.4m
Antenna Elevation :-0.98°
Site B:
Altitude : 14.2m
Height of Building : 10m
Antenna Pole : 2.4m
Antenna Elevation : 0.98°
A frequency division duplexing (FDD) scheme is used with the following duplexing frequencies,
maximum and minimum transmission power and antenna sizes at both sites. The channel spacing is
500MHz.
Site A Site B
Tx Freq. 75.375GHz 85.375GHz
Tx PWR +18dBm max +9dBm min
+18dBm max +9dBm min
Antenna Φ30cm(43dBi) Φ30cm(43dBi)
Table 6: Link configuration – Centre Frequencies, transmission power and antenna used in the trial
Maturity and field proven experience of millimetre wave transmission 25
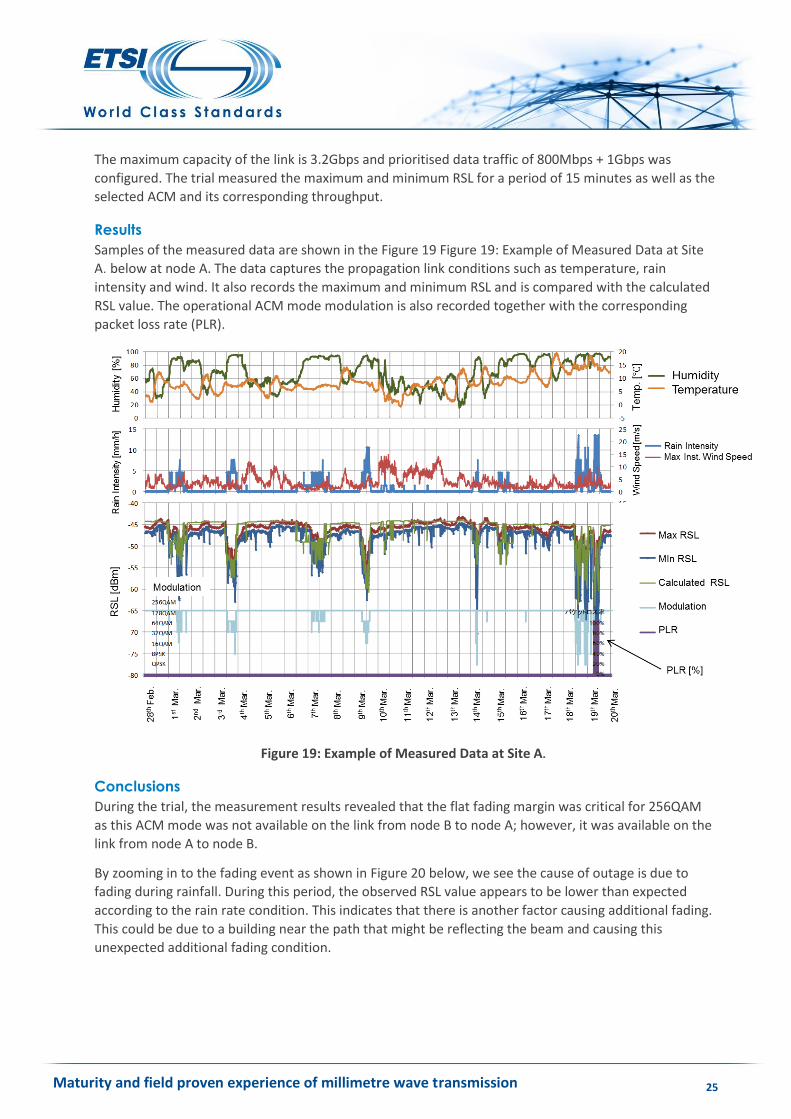
The maximum capacity of the link is 3.2Gbps and prioritised data traffic of 800Mbps + 1Gbps was
configured. The trial measured the maximum and minimum RSL for a period of 15 minutes as well as the
selected ACM and its corresponding throughput.
Results
Samples of the measured data are shown in the Figure 19 Figure 19: Example of Measured Data at Site
A.below at node A. The data captures the propagation link conditions such as temperature, rain
intensity and wind. It also records the maximum and minimum RSL and is compared with the calculated
RSL value. The operational ACM mode modulation is also recorded together with the corresponding
packet loss rate (PLR).
Figure 19: Example of Measured Data at Site A.
Conclusions
During the trial, the measurement results revealed that the flat fading margin was critical for 256QAM
as this ACM mode was not available on the link from node B to node A; however, it was available on the
link from node A to node B.
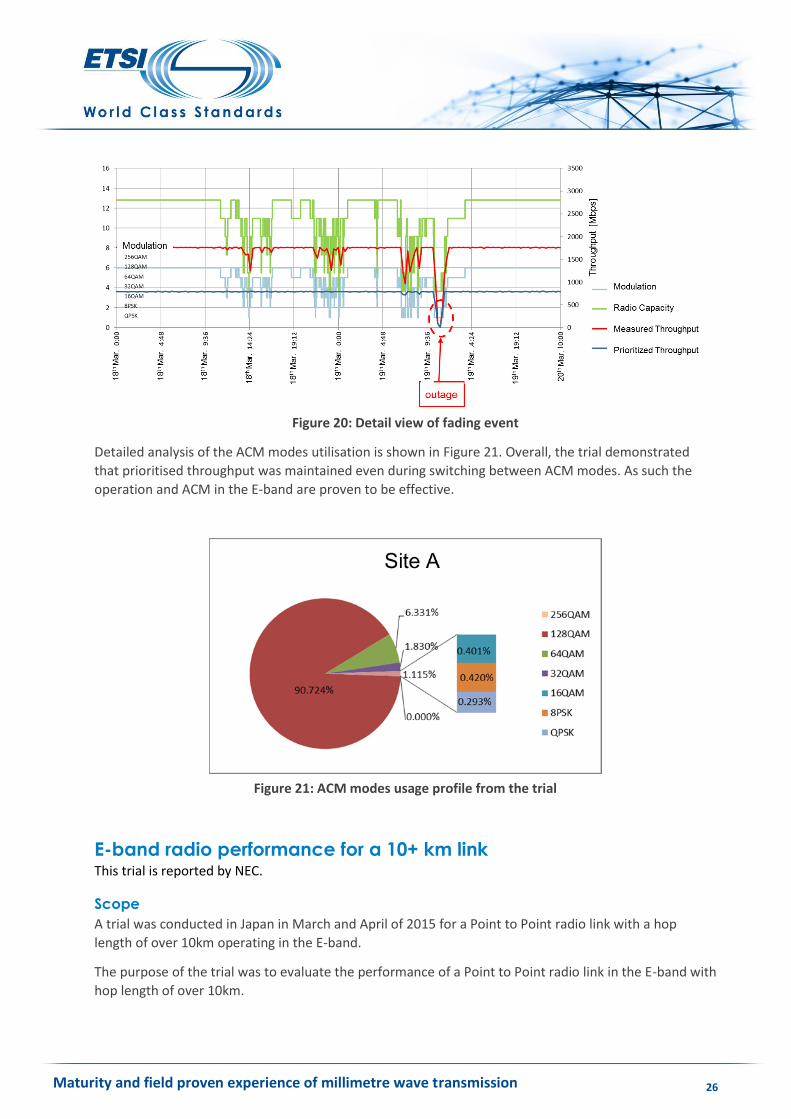
By zooming in to the fading event as shown in Figure 20 below, we see the cause of outage is due to
fading during rainfall. During this period, the observed RSL value appears to be lower than expected
according to the rain rate condition. This indicates that there is another factor causing additional fading.
This could be due to a building near the path that might be reflecting the beam and causing this
unexpected additional fading condition.
Maturity and field proven experience of millimetre wave transmission 26
Figure 20: Detail view of fading event
Detailed analysis of the ACM modes utilisation is shown in Figure 21. Overall, the trial demonstrated
that prioritised throughput was maintained even during switching between ACM modes. As such the
operation and ACM in the E-band are proven to be effective.
Figure 21: ACM modes usage profile from the trial
E-band radio performance for a 10+ km link This trial is reported by NEC.
Scope
A trial was conducted in Japan in March and April of 2015 for a Point to Point radio link with a hop
length of over 10km operating in the E-band.
The purpose of the trial was to evaluate the performance of a Point to Point radio link in the E-band with
hop length of over 10km.
Maturity and field proven experience of millimetre wave transmission 27
Setup
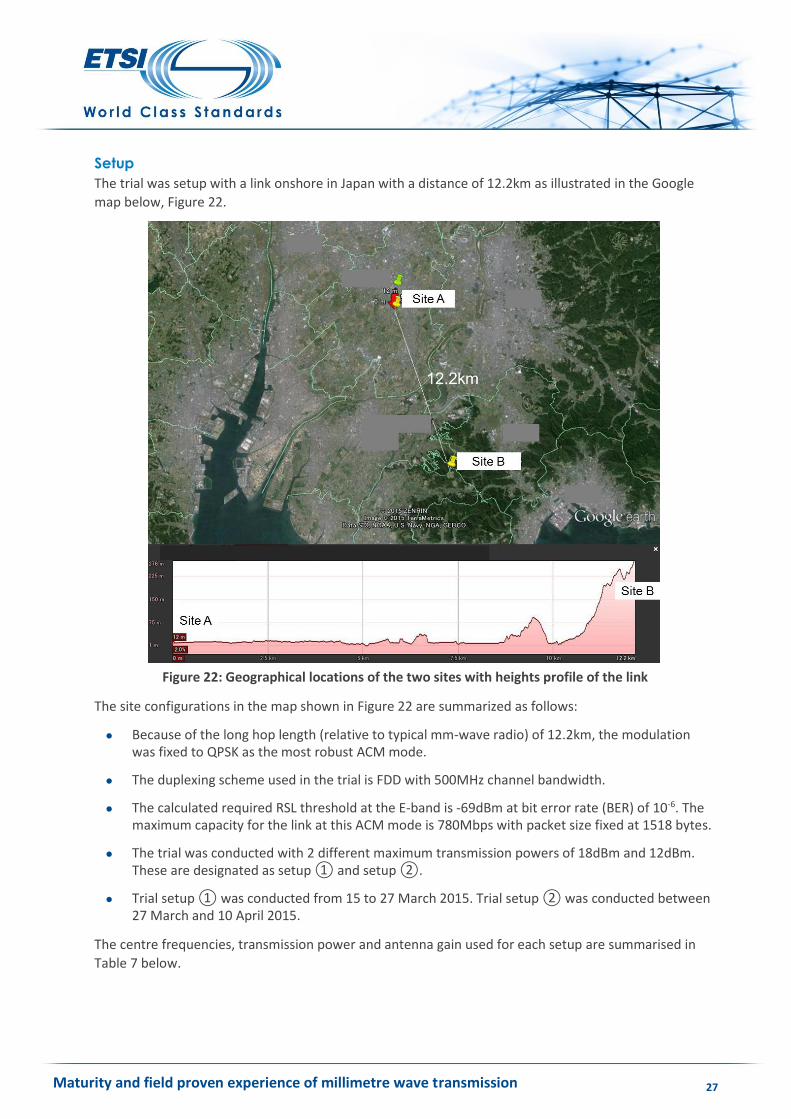
The trial was setup with a link onshore in Japan with a distance of 12.2km as illustrated in the Google
map below, Figure 22.
Figure 22: Geographical locations of the two sites with heights profile of the link
The site configurations in the map shown in Figure 22 are summarized as follows:
Because of the long hop length (relative to typical mm-wave radio) of 12.2km, the modulation was fixed to QPSK as the most robust ACM mode.
The duplexing scheme used in the trial is FDD with 500MHz channel bandwidth.
The calculated required RSL threshold at the E-band is -69dBm at bit error rate (BER) of 10-6. The maximum capacity for the link at this ACM mode is 780Mbps with packet size fixed at 1518 bytes.
The trial was conducted with 2 different maximum transmission powers of 18dBm and 12dBm. These are designated as setup ① and setup ②.
Trial setup ① was conducted from 15 to 27 March 2015. Trial setup ② was conducted between 27 March and 10 April 2015.
The centre frequencies, transmission power and antenna gain used for each setup are summarised in
Table 7 below.
Maturity and field proven experience of millimetre wave transmission 28
Site A Site B
Tx Freq. 75.375GHz 85.375GHz
Tx PWR ①+18dBm ②+12dBm
①+18dBm ②+12dBm
Antenna Φ60cm(50dBi) Φ30cm(43dBi)
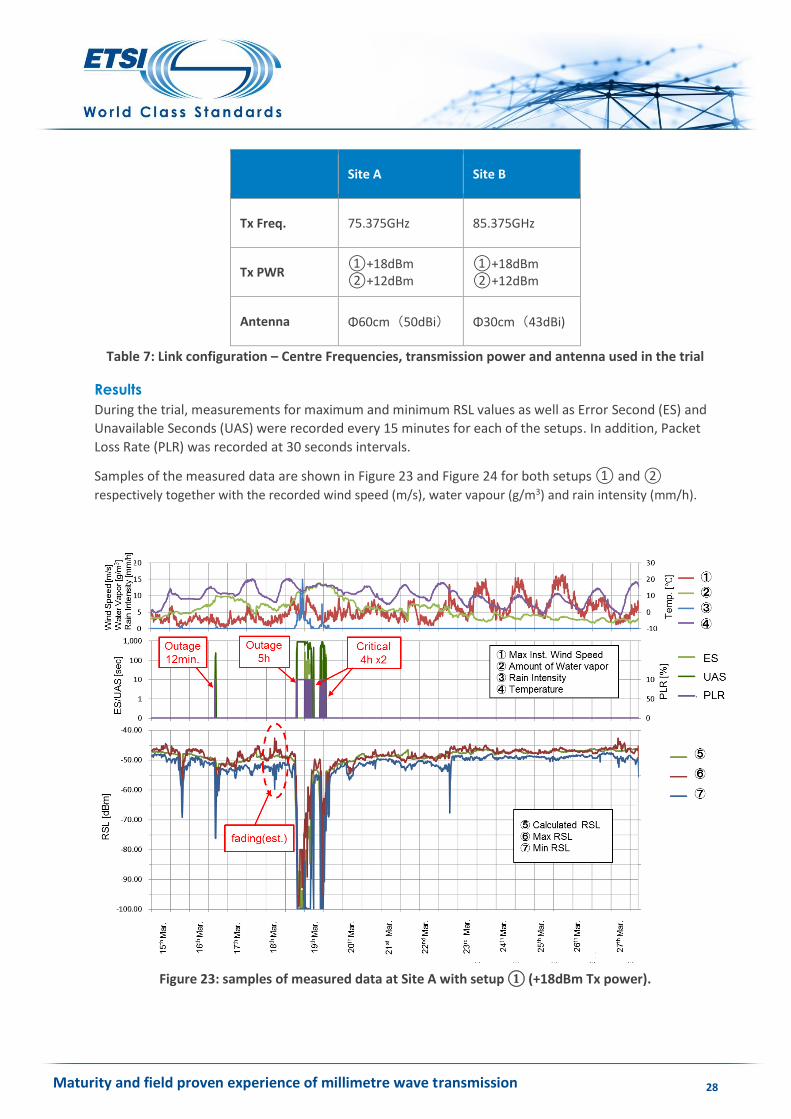
Table 7: Link configuration – Centre Frequencies, transmission power and antenna used in the trial
Results
During the trial, measurements for maximum and minimum RSL values as well as Error Second (ES) and
Unavailable Seconds (UAS) were recorded every 15 minutes for each of the setups. In addition, Packet
Loss Rate (PLR) was recorded at 30 seconds intervals.
Samples of the measured data are shown in Figure 23 and Figure 24 for both setups ① and ②
respectively together with the recorded wind speed (m/s), water vapour (g/m3) and rain intensity (mm/h).
Figure 23: samples of measured data at Site A with setup ① (+18dBm Tx power).
Maturity and field proven experience of millimetre wave transmission 29
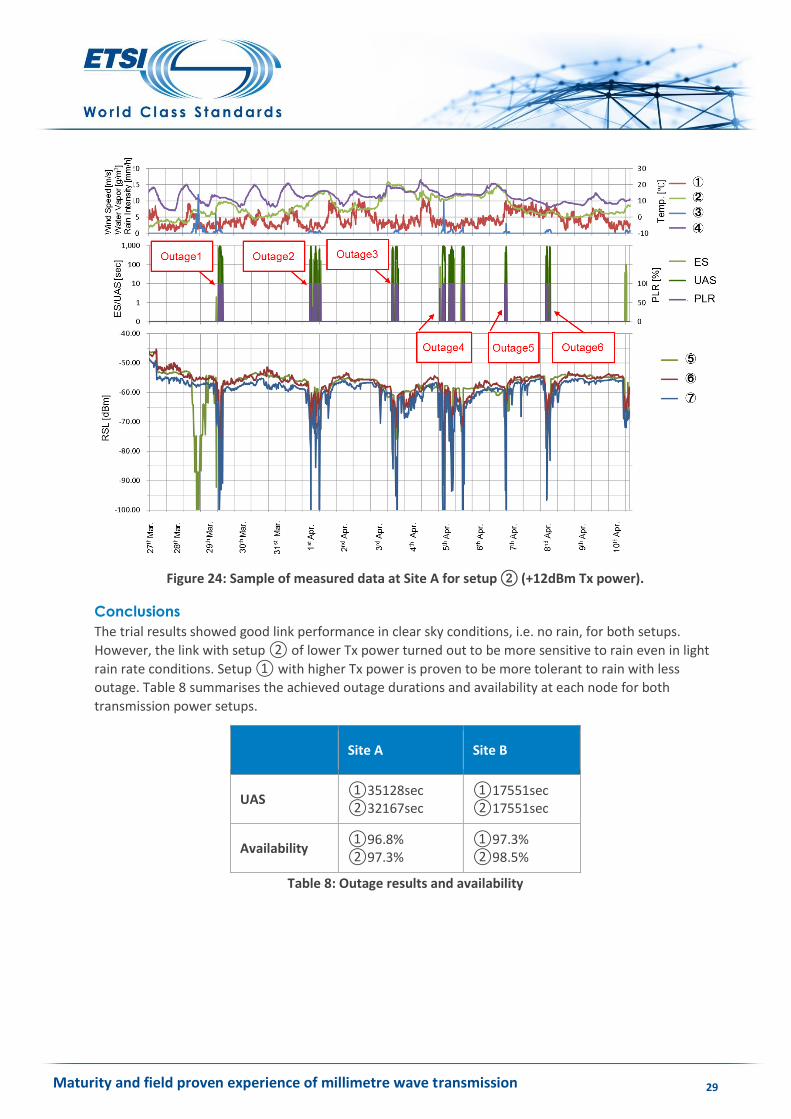
Figure 24: Sample of measured data at Site A for setup ② (+12dBm Tx power).
Conclusions
The trial results showed good link performance in clear sky conditions, i.e. no rain, for both setups.
However, the link with setup ② of lower Tx power turned out to be more sensitive to rain even in light
rain rate conditions. Setup ① with higher Tx power is proven to be more tolerant to rain with less
outage. Table 8 summarises the achieved outage durations and availability at each node for both
transmission power setups.
Site A Site B
UAS ①35128sec ②32167sec
①17551sec ②17551sec
Availability ①96.8% ②97.3%
①97.3% ②98.5%
Table 8: Outage results and availability
Maturity and field proven experience of millimetre wave transmission 30
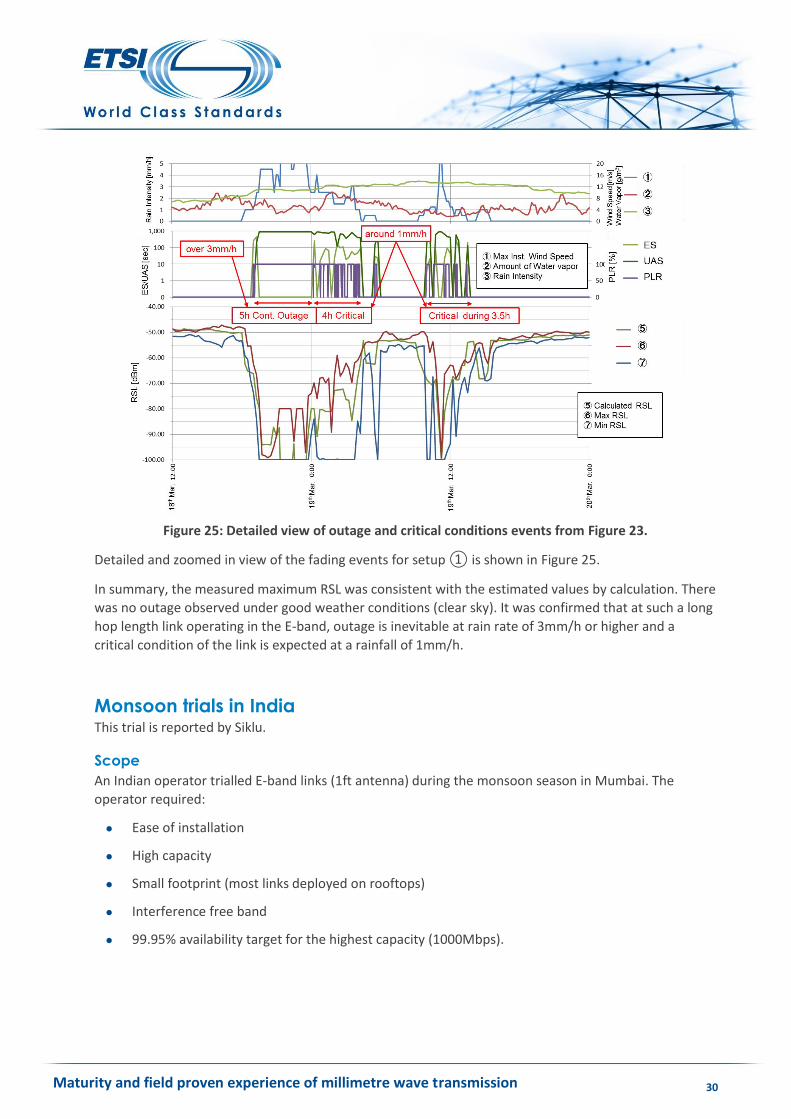
Figure 25: Detailed view of outage and critical conditions events from Figure 23.
Detailed and zoomed in view of the fading events for setup ① is shown in Figure 25.
In summary, the measured maximum RSL was consistent with the estimated values by calculation. There
was no outage observed under good weather conditions (clear sky). It was confirmed that at such a long
hop length link operating in the E-band, outage is inevitable at rain rate of 3mm/h or higher and a
critical condition of the link is expected at a rainfall of 1mm/h.
Monsoon trials in India This trial is reported by Siklu.
Scope
An Indian operator trialled E-band links (1ft antenna) during the monsoon season in Mumbai. The
operator required:
Ease of installation
High capacity
Small footprint (most links deployed on rooftops)
Interference free band
99.95% availability target for the highest capacity (1000Mbps).
Maturity and field proven experience of millimetre wave transmission 31
Setup
Two links were installed, a 750m link and a 1400m link. The link supported 5 levels of hitless adaptive
modulation schemes and the E-band radio performance was monitored and correlated with weather
statistics. The monitoring took place for an entire monsoon season in Mumbai (3 months), the monsoon
in that region is one of the harshest in India, and the 2011 season was particularly challenging. Planning
included utilization of Siklu’s link-budget-calculator, loaded with both system specifications and ITU-R
rain zones database.
Weather report
“The city (Mumbai) has received about 90 per cent of its average annual rainfall and a month of
monsoon is still left, according to data recorded at the automated weather stations installed at 34
locations across the city”. Mon 29 Aug, 2011, 01:32 hrs
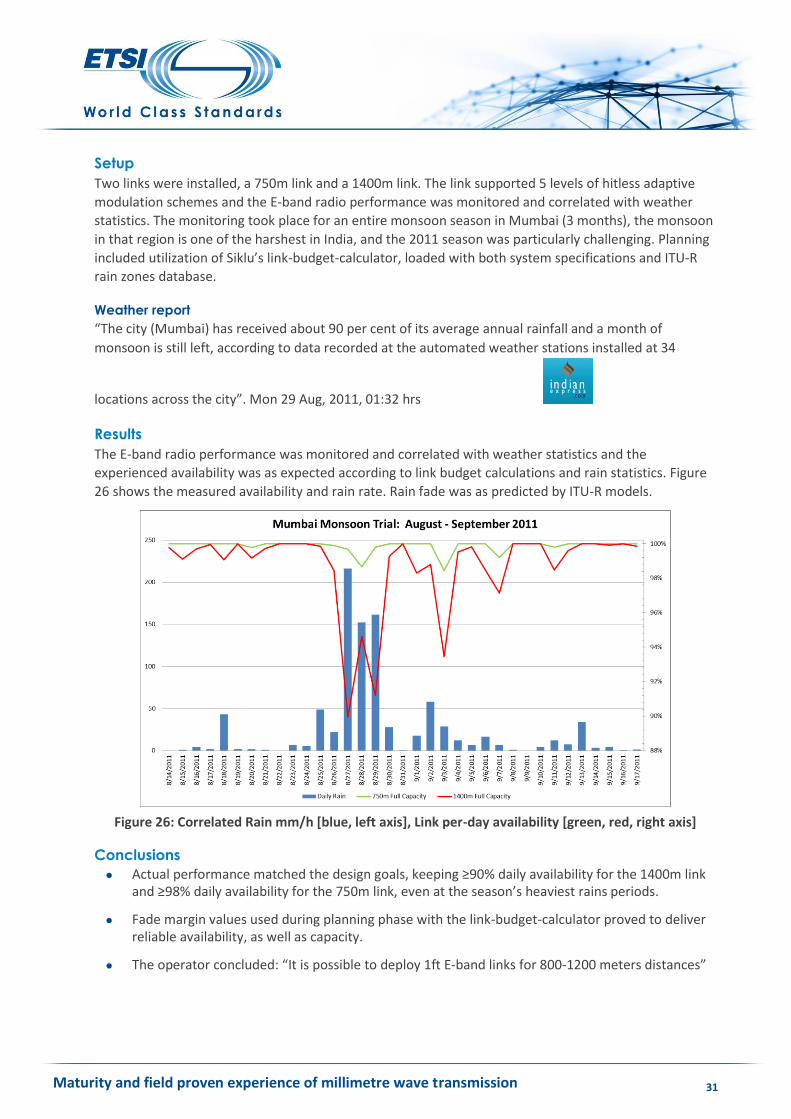
Results
The E-band radio performance was monitored and correlated with weather statistics and the
experienced availability was as expected according to link budget calculations and rain statistics. Figure
26 shows the measured availability and rain rate. Rain fade was as predicted by ITU-R models.
Figure 26: Correlated Rain mm/h [blue, left axis], Link per-day availability [green, red, right axis]
Conclusions
Actual performance matched the design goals, keeping ≥90% daily availability for the 1400m link and ≥98% daily availability for the 750m link, even at the season’s heaviest rains periods.
Fade margin values used during planning phase with the link-budget-calculator proved to deliver reliable availability, as well as capacity.
The operator concluded: “It is possible to deploy 1ft E-band links for 800-1200 meters distances”
Maturity and field proven experience of millimetre wave transmission 32
V-band field experience
In this chapter experience from independent trials with more non-conventional deployments using V-
band is described. The trials have been conducted by members of the ETSI ISG mWT and the
contributors, including their contact details, are listed in the list of authors.
Summary of V-band field experience The V-band trials, including more non-traditional street-level deployments, are reported. V-band is
characterized by oxygen absorption and unlicensed spectrum making it more suitable for shorter links.
Furthermore, it is difficult to predict performance in Non-Line-of-Sight (NLOS) deployments where the
link relies on reflections and/or diffractions that are difficult to plan for. However, the reported V-band
trials show good performance when deployed properly.
Availability predictions in Newbury, UK This trial is reported by Vodafone and Ericsson.
Scope
The aim of the trial was to investigate the performance of V-Band technology and in particular to
measure the availability.
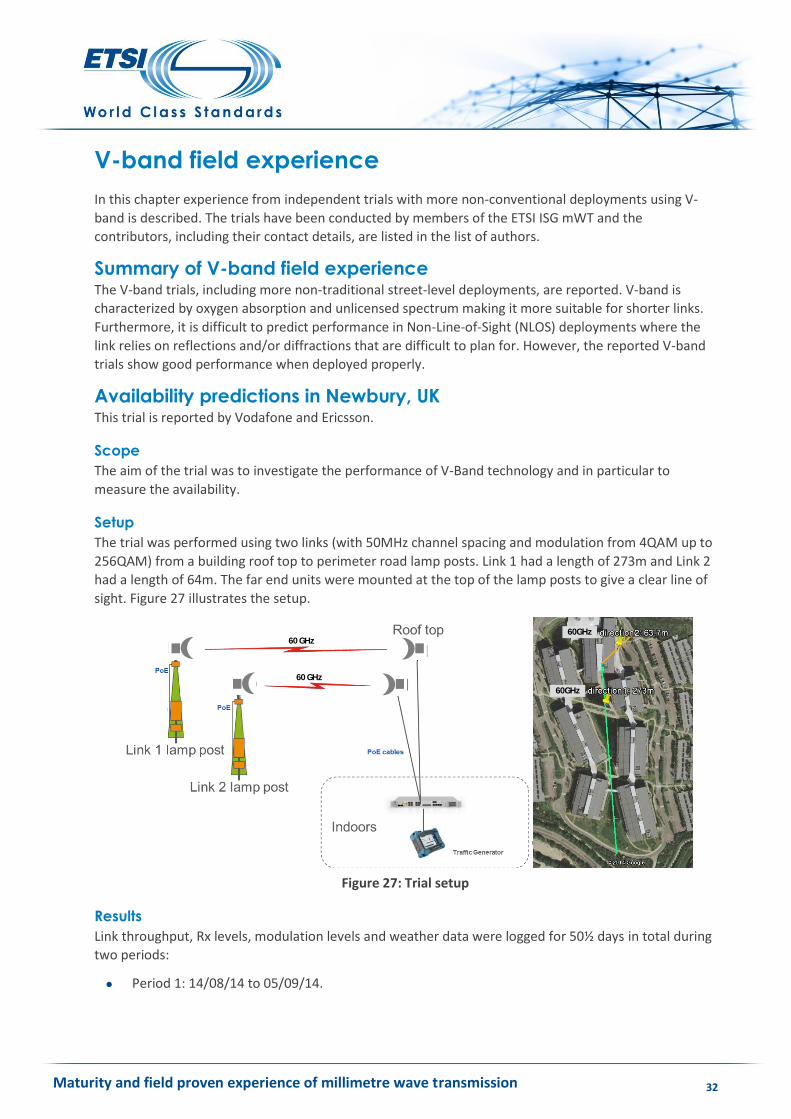
Setup
The trial was performed using two links (with 50MHz channel spacing and modulation from 4QAM up to
256QAM) from a building roof top to perimeter road lamp posts. Link 1 had a length of 273m and Link 2
had a length of 64m. The far end units were mounted at the top of the lamp posts to give a clear line of
sight. Figure 27 illustrates the setup.
Figure 27: Trial setup
Results
Link throughput, Rx levels, modulation levels and weather data were logged for 50½ days in total during
two periods:
Period 1: 14/08/14 to 05/09/14.
60 GHz
60 GHz
Insert Confidentiality Level in slide footer
60GHz
60GHz
Maturity and field proven experience of millimetre wave transmission 33
Period 2: 25/09/14 to 23/10/14.
Due to remote access difficulties, data logs were not taken during the very dry period from 5 to 25
September when link performance was at maximum.
The throughput and availability over the two measurement periods for each modulation level are found
in Table 9 and it can be seen that a high performance is achieved on both links. The long link 1 achieves
5 nines availability at 64 QAM 279.0 Mbps, with an average throughput over the period of 367.3 Mbps.
The short link 2 achieves nearly 6 nines availability at 256 QAM 367.8 Mbps.
Table 9: Throughput and availability
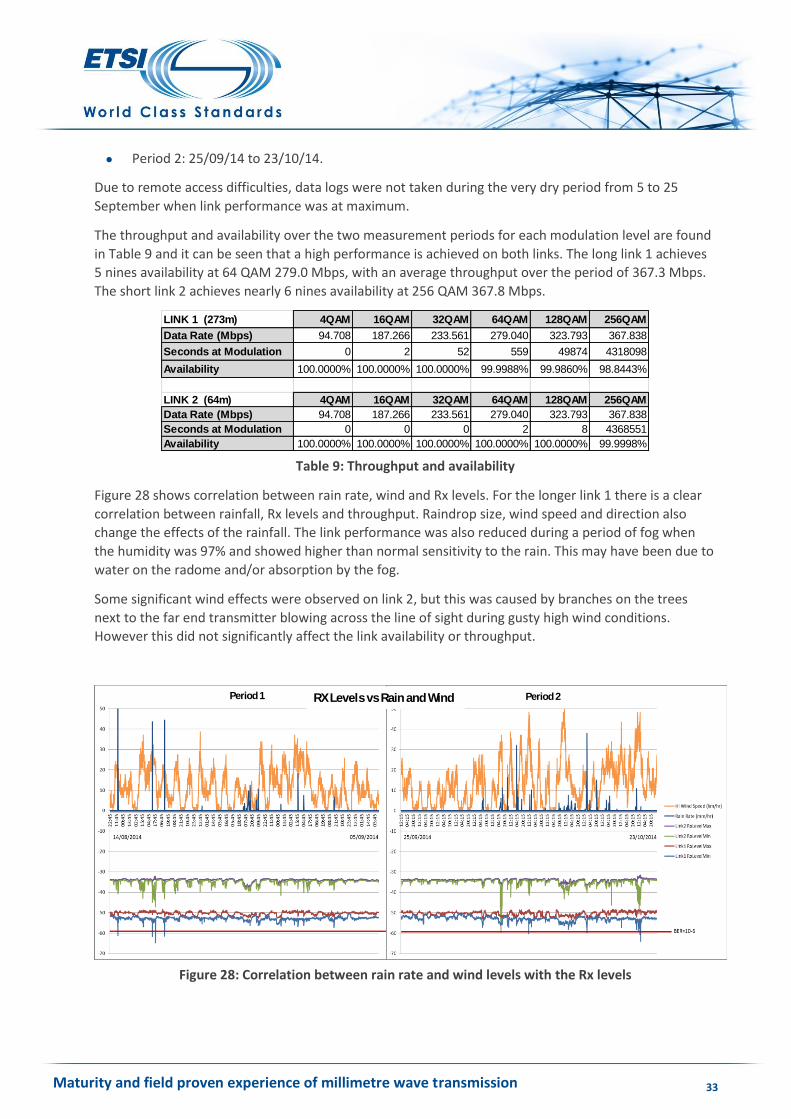
Figure 28 shows correlation between rain rate, wind and Rx levels. For the longer link 1 there is a clear
correlation between rainfall, Rx levels and throughput. Raindrop size, wind speed and direction also
change the effects of the rainfall. The link performance was also reduced during a period of fog when
the humidity was 97% and showed higher than normal sensitivity to the rain. This may have been due to
water on the radome and/or absorption by the fog.
Some significant wind effects were observed on link 2, but this was caused by branches on the trees
next to the far end transmitter blowing across the line of sight during gusty high wind conditions.
However this did not significantly affect the link availability or throughput.
Figure 28: Correlation between rain rate and wind levels with the Rx levels
LINK 1 (273m) 4QAM 16QAM 32QAM 64QAM 128QAM 256QAM
Data Rate (Mbps) 94.708 187.266 233.561 279.040 323.793 367.838
Maturity and field proven experience of millimetre wave transmission 34
Table 10 shows a comparison between predicted and measured availability. Using the Adaptive
Modulation thresholds and wet radome with 3dB loss gives a close match to the measured results.
Table 10: Predicted and measured availability
Availability predictions are compared to the measurements and there is a close match between the
prediction using adaptive modulation switching threshold and the measured results. However a dry
period during September was excluded from the results and the measurement period is not long
enough to draw any significant conclusion about the accuracy of the ITU-R models.
Conclusions
When using V-band the following recommendations can be made:
For link planning use ITU-R P.530-14 [8] or later.
When using Adaptive Modulation use the switching thresholds in the planning calculations.
During planning allow additional fade margin and take a generally cautious approach due to effects of:
o Surface water on the Radome (e.g. 3dB loss)
o Humidity/Fog
o Wind
o Snow
1st Fresnel zone should be clear of obstructions, with care taken to ensure that trees or plants cannot blow across the zone in strong gales.
Ensure that the lamp post provides sufficient rigidity at the mounting height to prevent the antenna from moving significantly and do not block lighting.
Check for interference sources using a frequency scan of the band. Note that a narrow beam high gain antenna will provide significantly more protection against other unlicensed sources which may be installed in the future.
Characterization of V-band through measurements This trial is reported by Telecom Italia and Ericsson.
Scope
The trial has the aim to characterize the use of V-band through the collection of radio data performance
and throughput related to the weather conditions. The rainfall log data are available from a weather
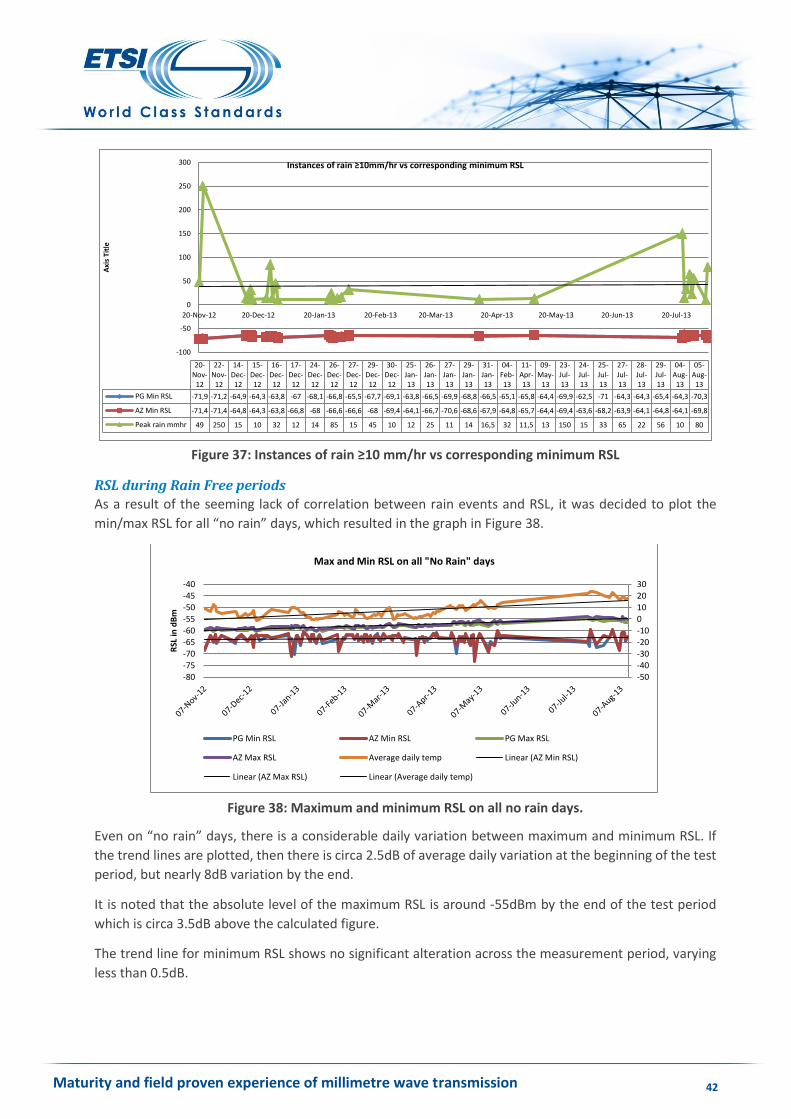
Instances of rain ≥10mm/hr vs corresponding minimum RSL
-50
-40
-30
-20
-10
0
10
20
30
-80
-75
-70
-65
-60
-55
-50
-45
-40
RSL
in d
Bm
Max and Min RSL on all "No Rain" days
PG Min RSL AZ Min RSL PG Max RSL
AZ Max RSL Average daily temp Linear (AZ Min RSL)
Linear (AZ Max RSL) Linear (Average daily temp)
Maturity and field proven experience of millimetre wave transmission 43
Conclusions
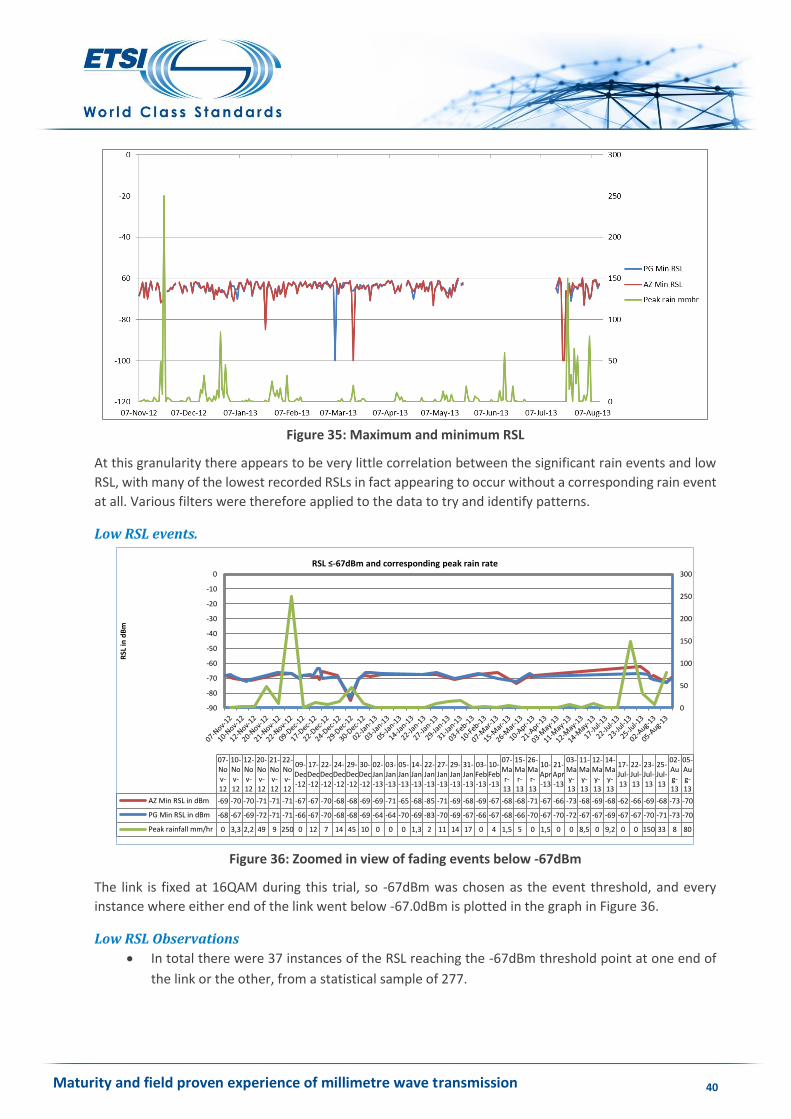
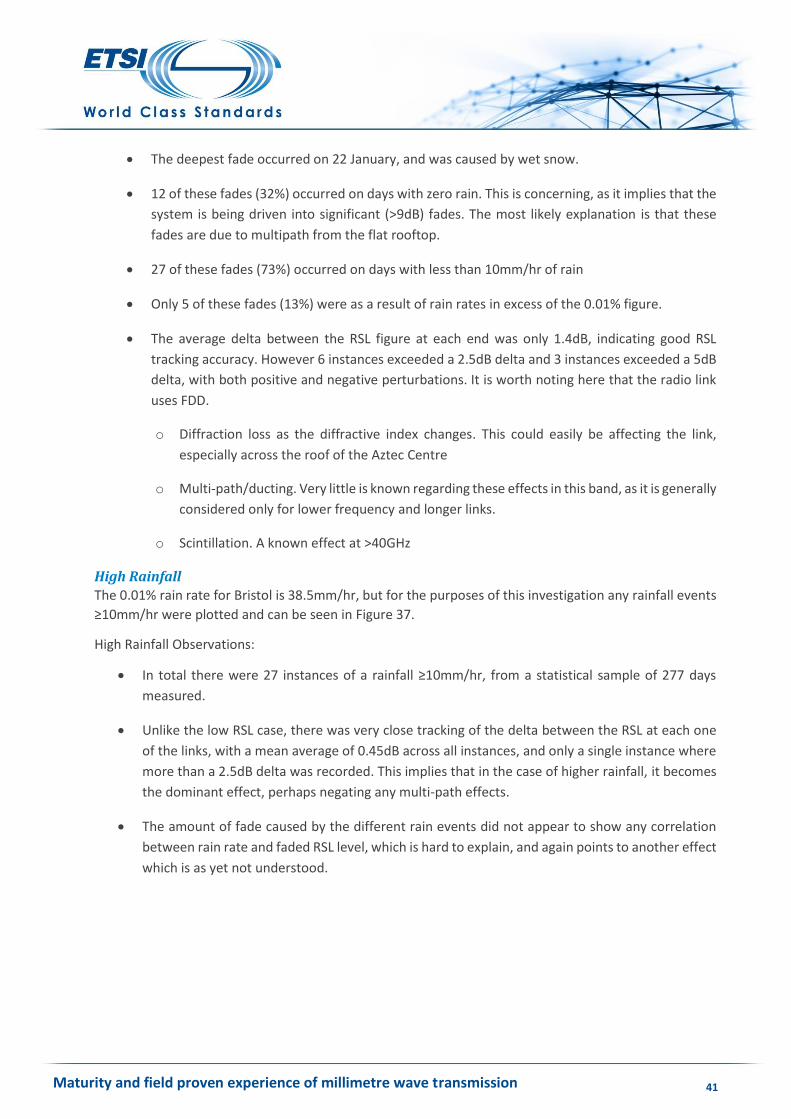
Whilst there appears to be some definite and fully expected correlation between rain intensity and fade
depth, a lot of the data recorded appears counter intuitive, and indicates either a significant multi-path
effect, probably from the roof of the Aztec centre, or an equipment issue.
Most 60GHz radios deployed to date (worldwide) appear to have been at rooftop level, for LAN extension
etc., and as such no vendor approached to date appears to have good modelling data for street level
deployment, or have considered multi-path/ducting or even in most cases scintillation within its link
calculation tools. It will be interesting to see other street level deployments if they would yield similar
results, as this could be directly relevant to the usefulness of 60GHz in such deployment scenarios.
Street-level trials This trial is reported by Siklu.
Scope
In this trial V-band mm-wave radio links were used to backhaul one of the world’s largest sports events
in an outdoor environment. The mm-wave radio served as backhaul for Wi-Fi access points providing
free Wi-Fi service for 45,000 spectators participating in the event. The objective was to assess the
effects of city infrastructure, canyon style streets, traffic and weather patterns and the effect any of
these may have on wireless links in an urban environment.
The operator required a wireless-based fibre extension solution with:
Ease of installation
High capacity
Street level deployment
Interference free band
Zero footprint (backhaul unit should not be wider than the pole it is installed on)
99.95% availability target for the highest capacity (1000Mbps).
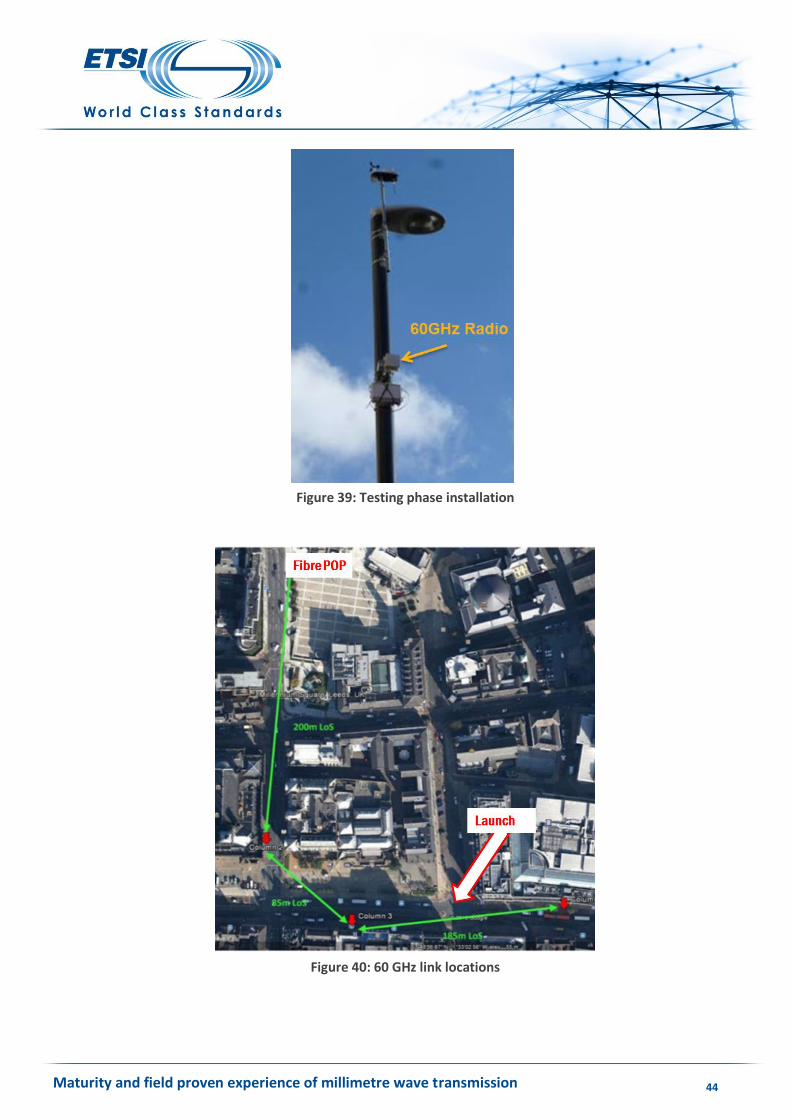
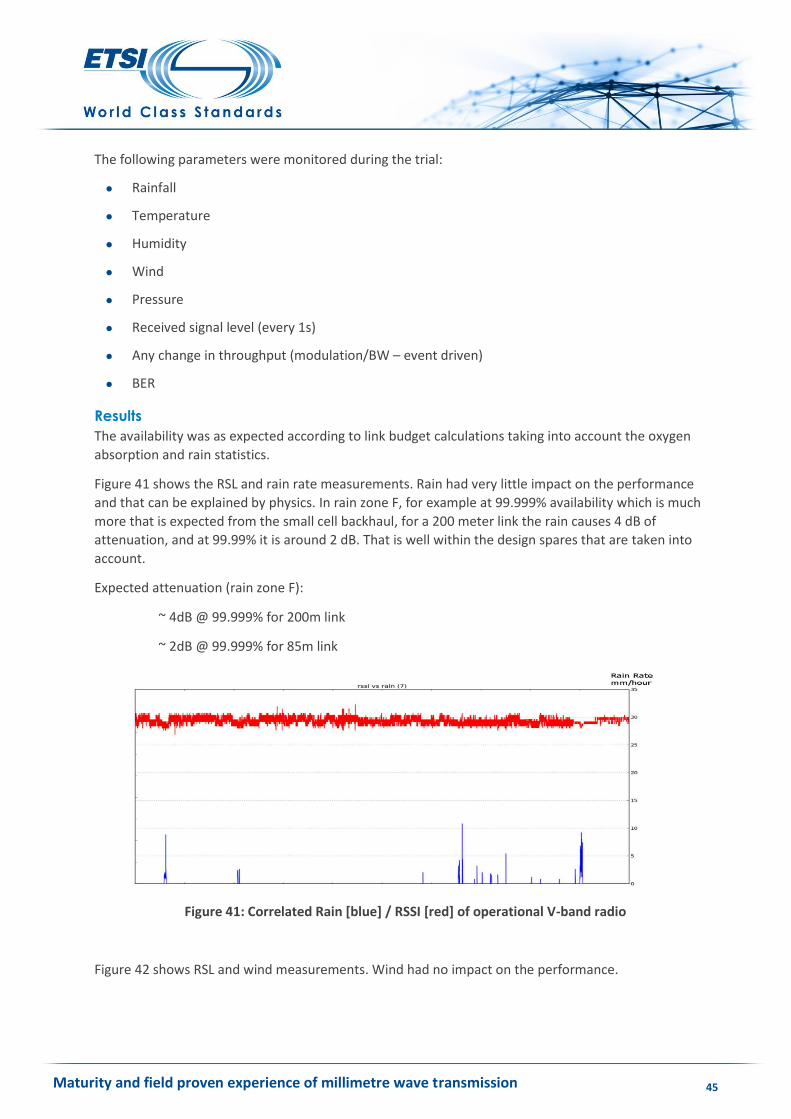
Setup
The V-band radio performance has been monitored and correlated with weather statistics. The radio
was set to provide 1000Mbps performance using 500MHz channel bandwidth (TDD). The deployments
are depicted in Figure 39 and Figure 40.
Maturity and field proven experience of millimetre wave transmission 44
Figure 39: Testing phase installation
Figure 40: 60 GHz link locations
Maturity and field proven experience of millimetre wave transmission 45
The following parameters were monitored during the trial:
Rainfall
Temperature
Humidity
Wind
Pressure
Received signal level (every 1s)
Any change in throughput (modulation/BW – event driven)
BER
Results
The availability was as expected according to link budget calculations taking into account the oxygen
absorption and rain statistics.
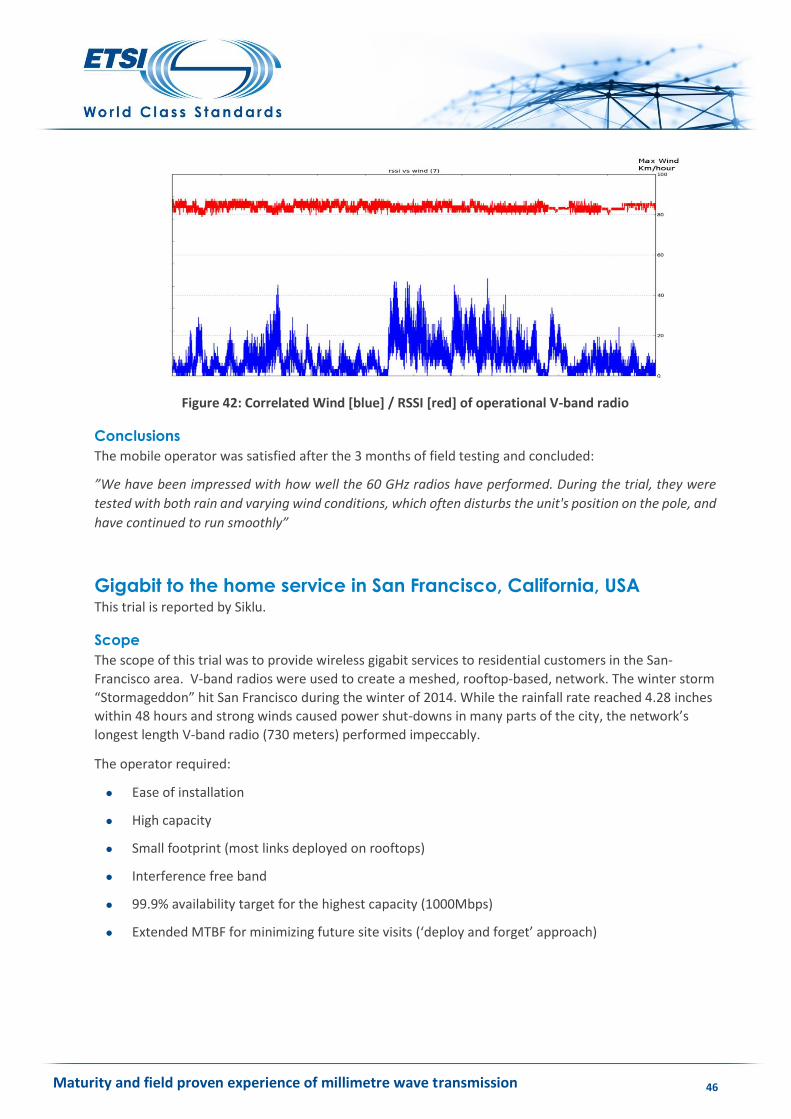
Figure 41 shows the RSL and rain rate measurements. Rain had very little impact on the performance
and that can be explained by physics. In rain zone F, for example at 99.999% availability which is much
more that is expected from the small cell backhaul, for a 200 meter link the rain causes 4 dB of
attenuation, and at 99.99% it is around 2 dB. That is well within the design spares that are taken into
account.
Expected attenuation (rain zone F):
~ 4dB @ 99.999% for 200m link
~ 2dB @ 99.999% for 85m link
Figure 41: Correlated Rain [blue] / RSSI [red] of operational V-band radio
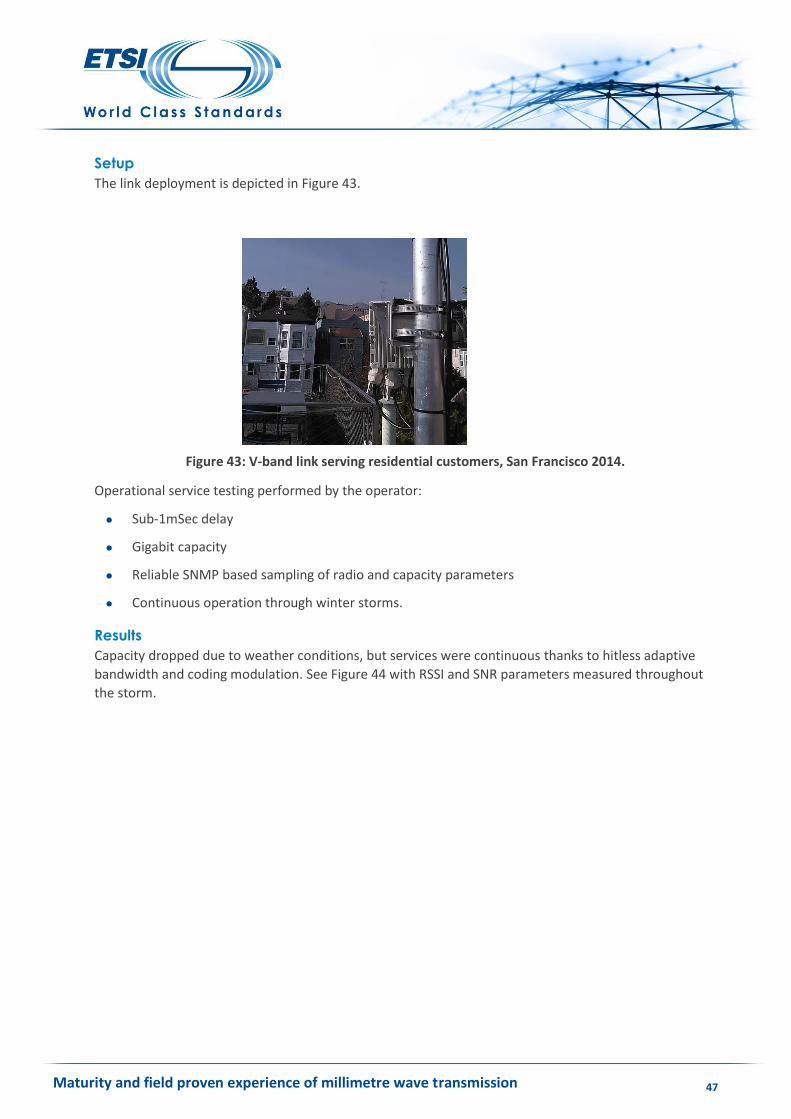
Figure 42 shows RSL and wind measurements. Wind had no impact on the performance.
Maturity and field proven experience of millimetre wave transmission 46
Figure 42: Correlated Wind [blue] / RSSI [red] of operational V-band radio
Conclusions
The mobile operator was satisfied after the 3 months of field testing and concluded:
”We have been impressed with how well the 60 GHz radios have performed. During the trial, they were
tested with both rain and varying wind conditions, which often disturbs the unit's position on the pole, and
have continued to run smoothly”
Gigabit to the home service in San Francisco, California, USA This trial is reported by Siklu.
Scope
The scope of this trial was to provide wireless gigabit services to residential customers in the San-
Francisco area. V-band radios were used to create a meshed, rooftop-based, network. The winter storm
“Stormageddon” hit San Francisco during the winter of 2014. While the rainfall rate reached 4.28 inches
within 48 hours and strong winds caused power shut-downs in many parts of the city, the network’s
longest length V-band radio (730 meters) performed impeccably.
The operator required:
Ease of installation
High capacity
Small footprint (most links deployed on rooftops)
Interference free band
99.9% availability target for the highest capacity (1000Mbps)
Extended MTBF for minimizing future site visits (‘deploy and forget’ approach)
Maturity and field proven experience of millimetre wave transmission 47
Setup
The link deployment is depicted in Figure 43.
Figure 43: V-band link serving residential customers, San Francisco 2014.
Operational service testing performed by the operator:
Sub-1mSec delay
Gigabit capacity
Reliable SNMP based sampling of radio and capacity parameters
Continuous operation through winter storms.
Results
Capacity dropped due to weather conditions, but services were continuous thanks to hitless adaptive
bandwidth and coding modulation. See Figure 44 with RSSI and SNR parameters measured throughout
the storm.
Maturity and field proven experience of millimetre wave transmission 48
Figure 44: V-band link performance during San-Francisco 2014 winter storm
Conclusions
Actual performance exceeded the design goals, keeping 100% daily availability for the 730m link, even at
the storm’s heaviest rains periods. The operator concluded: “Gigabit to the home is doing just fine
during ‘Stormageddon’”.
Street-level V-band radio link assessments for LOS and bounced-
path-NLOS conditions in dense urban environment This trial is reported by DragonWave Inc.
Scope
A series of street level tests were conducted across numerous test sessions in order to characterize
radio link delay spreads and radio system performance in various LOS and bounced-path-NLOS path
conditions. The goals of this characterization testing were:
Confirm specific antenna & radio-product designs that were targeted at street level backhaul deployments at 28, 38 & 60 GHz, where street light poles and traffic light poles were the primary mount structures (only 60 GHz data is reported here)
Confirm antenna mounting height recommendations needed to optimize operation in the presence of various “downtown” vehicular traffic conditions
Create a knowledge-base from which street-level backhaul networks can be designed/implemented to achieve useful availability
It should be noted that the information reported here is the result of most recent test sessions at V-
band. These sessions were preceded by “engineering” sessions whose goals were more related to
gathering engineering field data related to RF channel characteristics needed to undertake radio designs
targeted at addressing the propagation characteristics of street-level backhaul links.
Through previous test sessions, different radio link configurations were tested (simultaneously with
both channel sounders and with DragonWave Avenue Link backhaul radio systems). These previous
Maturity and field proven experience of millimetre wave transmission 49
undertakings were used as design inputs used to complete the DragonWave Avenue Link product
design. The information reported here is derived from a series of confirming field-test sessions
undertaken in late 2013 and early 2014.
Setup
The general test conditions used for this testing were as follows:
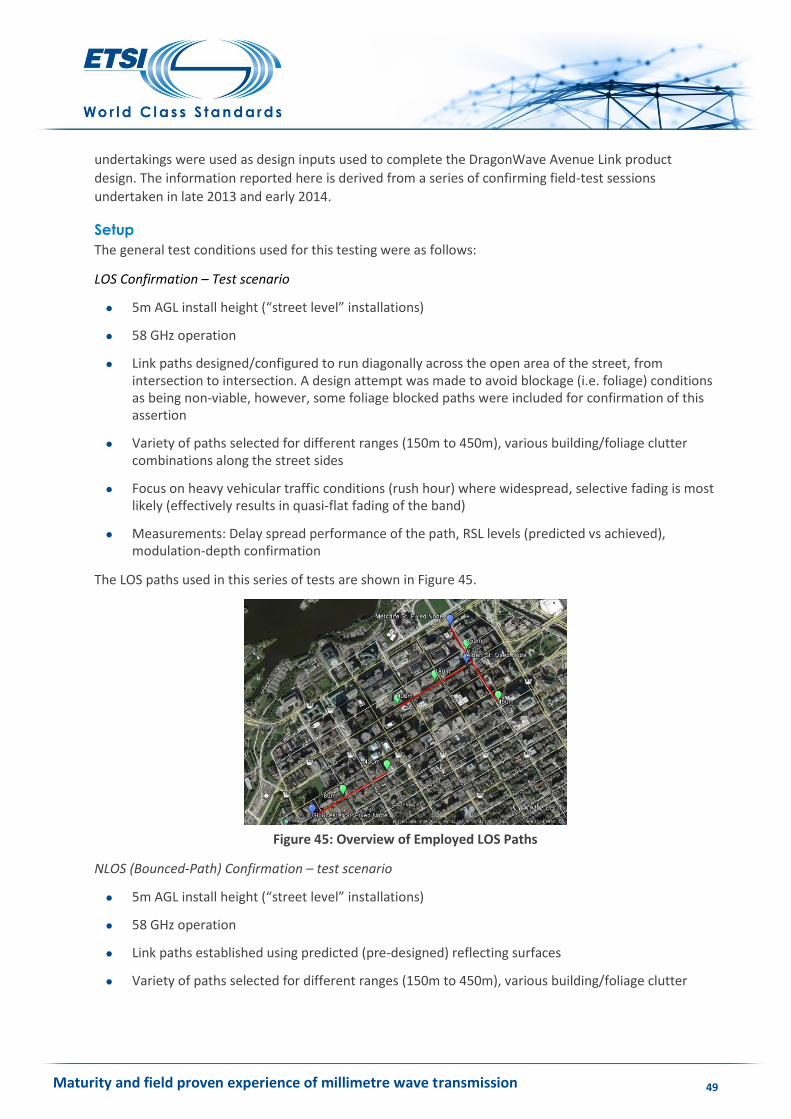
Link paths designed/configured to run diagonally across the open area of the street, from intersection to intersection. A design attempt was made to avoid blockage (i.e. foliage) conditions as being non-viable, however, some foliage blocked paths were included for confirmation of this assertion
Variety of paths selected for different ranges (150m to 450m), various building/foliage clutter combinations along the street sides
Focus on heavy vehicular traffic conditions (rush hour) where widespread, selective fading is most likely (effectively results in quasi-flat fading of the band)
Measurements: Delay spread performance of the path, RSL levels (predicted vs achieved), modulation-depth confirmation
The LOS paths used in this series of tests are shown in Figure 45.
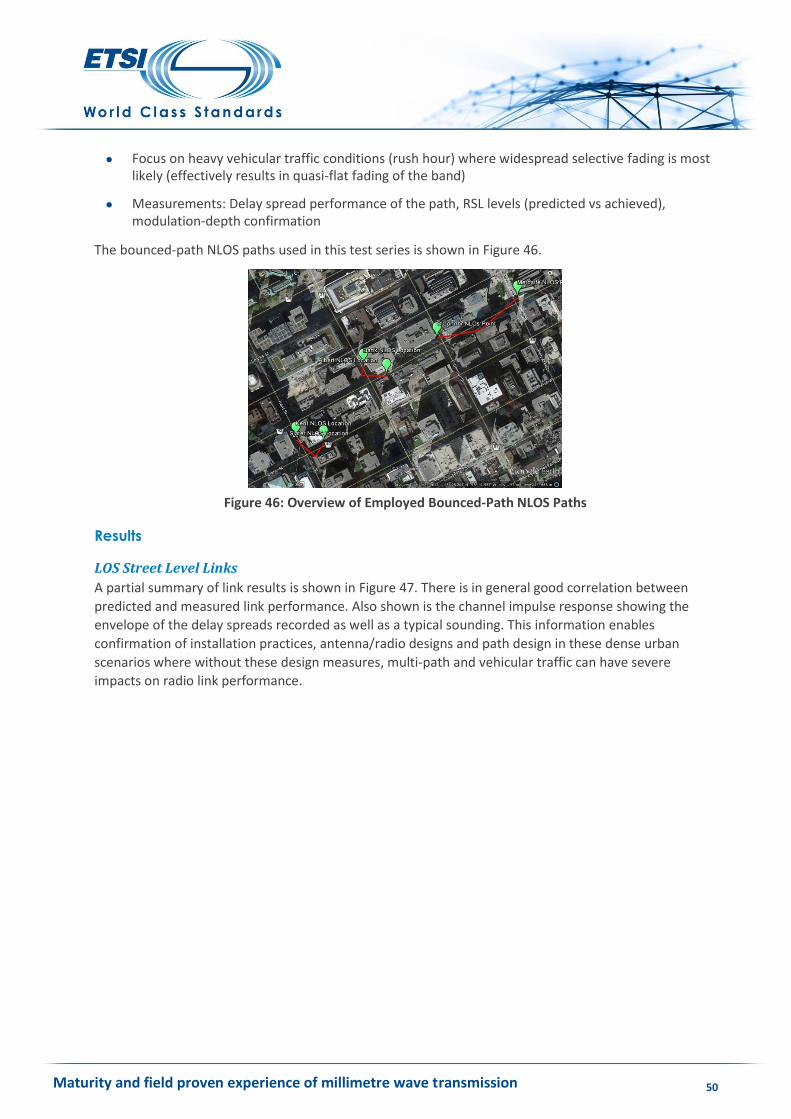
Link paths established using predicted (pre-designed) reflecting surfaces
Variety of paths selected for different ranges (150m to 450m), various building/foliage clutter
Maturity and field proven experience of millimetre wave transmission 50
Focus on heavy vehicular traffic conditions (rush hour) where widespread selective fading is most likely (effectively results in quasi-flat fading of the band)
Measurements: Delay spread performance of the path, RSL levels (predicted vs achieved), modulation-depth confirmation
The bounced-path NLOS paths used in this test series is shown in Figure 46.
Figure 46: Overview of Employed Bounced-Path NLOS Paths
Results
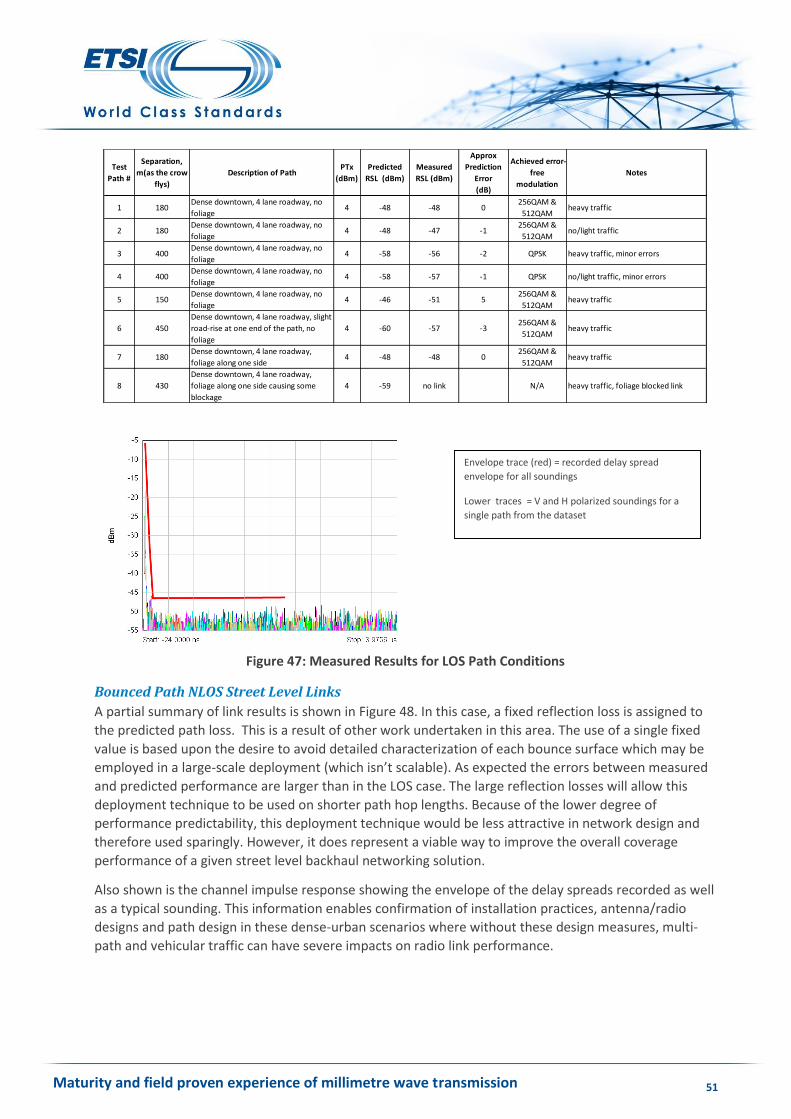
LOS Street Level Links
A partial summary of link results is shown in Figure 47. There is in general good correlation between
predicted and measured link performance. Also shown is the channel impulse response showing the
envelope of the delay spreads recorded as well as a typical sounding. This information enables
confirmation of installation practices, antenna/radio designs and path design in these dense urban
scenarios where without these design measures, multi-path and vehicular traffic can have severe
impacts on radio link performance.
Maturity and field proven experience of millimetre wave transmission 51
Figure 47: Measured Results for LOS Path Conditions
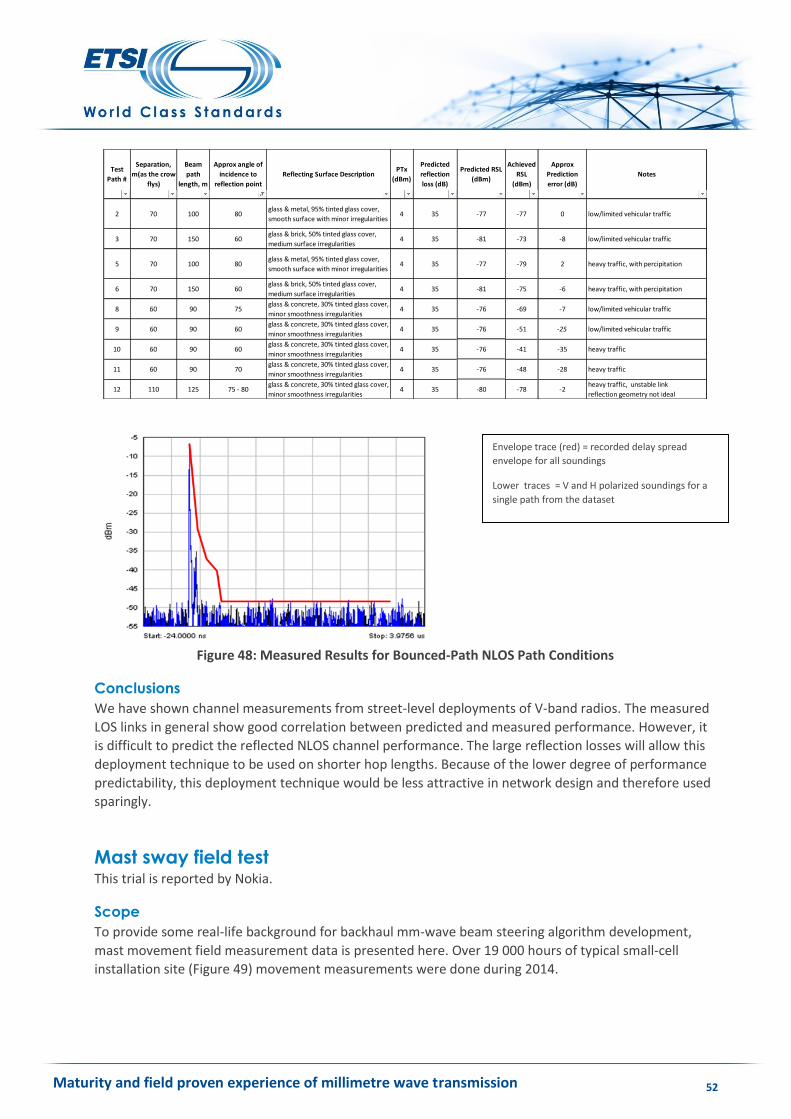
Bounced Path NLOS Street Level Links
A partial summary of link results is shown in Figure 48. In this case, a fixed reflection loss is assigned to
the predicted path loss. This is a result of other work undertaken in this area. The use of a single fixed
value is based upon the desire to avoid detailed characterization of each bounce surface which may be
employed in a large-scale deployment (which isn’t scalable). As expected the errors between measured
and predicted performance are larger than in the LOS case. The large reflection losses will allow this
deployment technique to be used on shorter path hop lengths. Because of the lower degree of
performance predictability, this deployment technique would be less attractive in network design and
therefore used sparingly. However, it does represent a viable way to improve the overall coverage
performance of a given street level backhaul networking solution.
Also shown is the channel impulse response showing the envelope of the delay spreads recorded as well
as a typical sounding. This information enables confirmation of installation practices, antenna/radio
designs and path design in these dense-urban scenarios where without these design measures, multi-
path and vehicular traffic can have severe impacts on radio link performance.
Test
Path #
Separation,
m(as the crow
flys)
Description of PathPTx
(dBm)
Predicted
RSL (dBm)
Measured
RSL (dBm)
Approx
Prediction
Error
(dB)
Achieved error-
free
modulation
Notes
1 180Dense downtown, 4 lane roadway, no
foliage4 -48 -48 0
256QAM &
512QAMheavy traffic
2 180Dense downtown, 4 lane roadway, no
foliage4 -48 -47 -1
256QAM &
512QAMno/light traffic
3 400Dense downtown, 4 lane roadway, no
foliage4 -58 -56 -2 QPSK heavy traffic, minor errors
4 400Dense downtown, 4 lane roadway, no
foliage4 -58 -57 -1 QPSK no/light traffic, minor errors
5 150Dense downtown, 4 lane roadway, no
foliage4 -46 -51 5
256QAM &
512QAMheavy traffic
6 450
Dense downtown, 4 lane roadway, slight
road-rise at one end of the path, no
foliage
4 -60 -57 -3256QAM &
512QAMheavy traffic
7 180Dense downtown, 4 lane roadway,
foliage along one side4 -48 -48 0
256QAM &
512QAMheavy traffic
8 430
Dense downtown, 4 lane roadway,
foliage along one side causing some
blockage
4 -59 no link N/A heavy traffic, foliage blocked link
Envelope trace (red) = recorded delay spread
envelope for all soundings
Lower traces = V and H polarized soundings for a
single path from the dataset
Maturity and field proven experience of millimetre wave transmission 52
Figure 48: Measured Results for Bounced-Path NLOS Path Conditions
Conclusions
We have shown channel measurements from street-level deployments of V-band radios. The measured
LOS links in general show good correlation between predicted and measured performance. However, it
is difficult to predict the reflected NLOS channel performance. The large reflection losses will allow this
deployment technique to be used on shorter hop lengths. Because of the lower degree of performance
predictability, this deployment technique would be less attractive in network design and therefore used
sparingly.
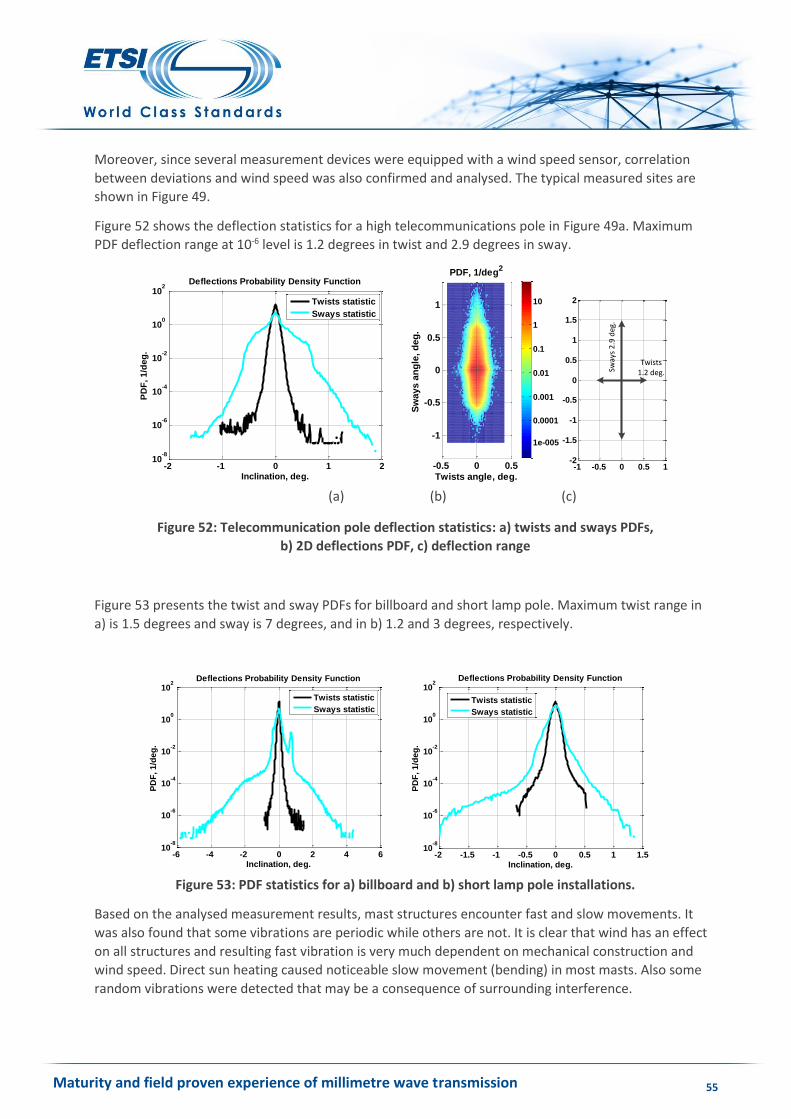
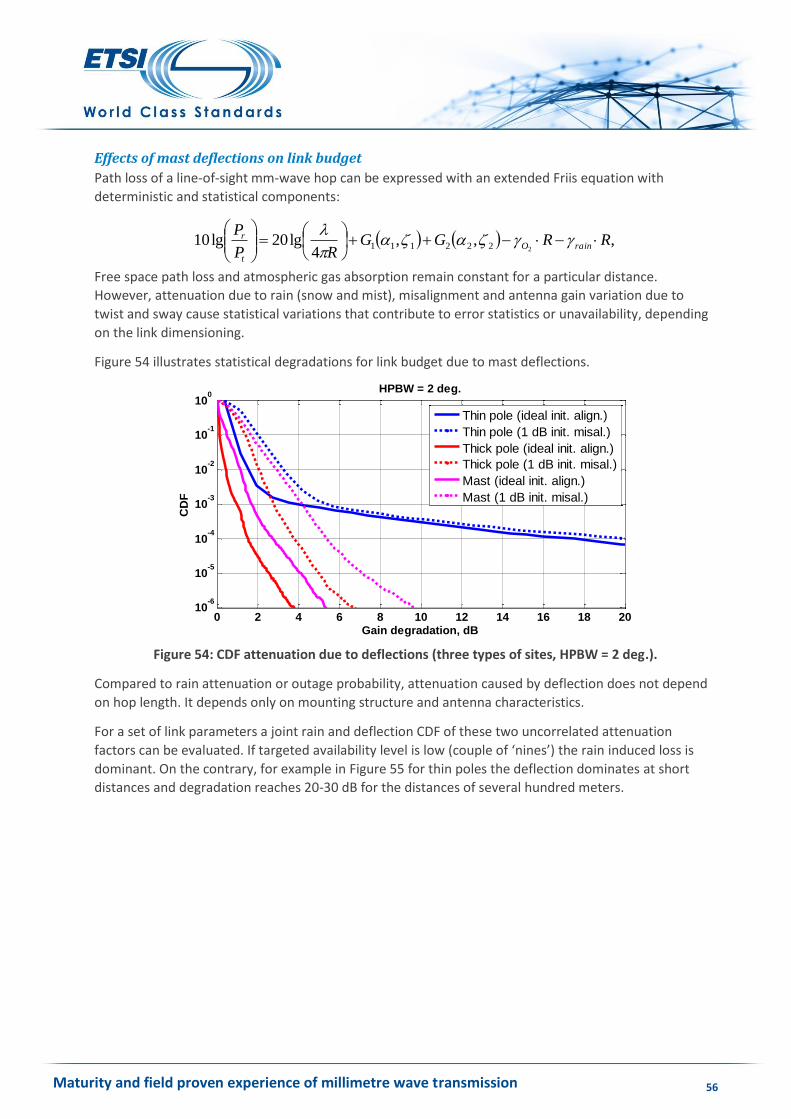
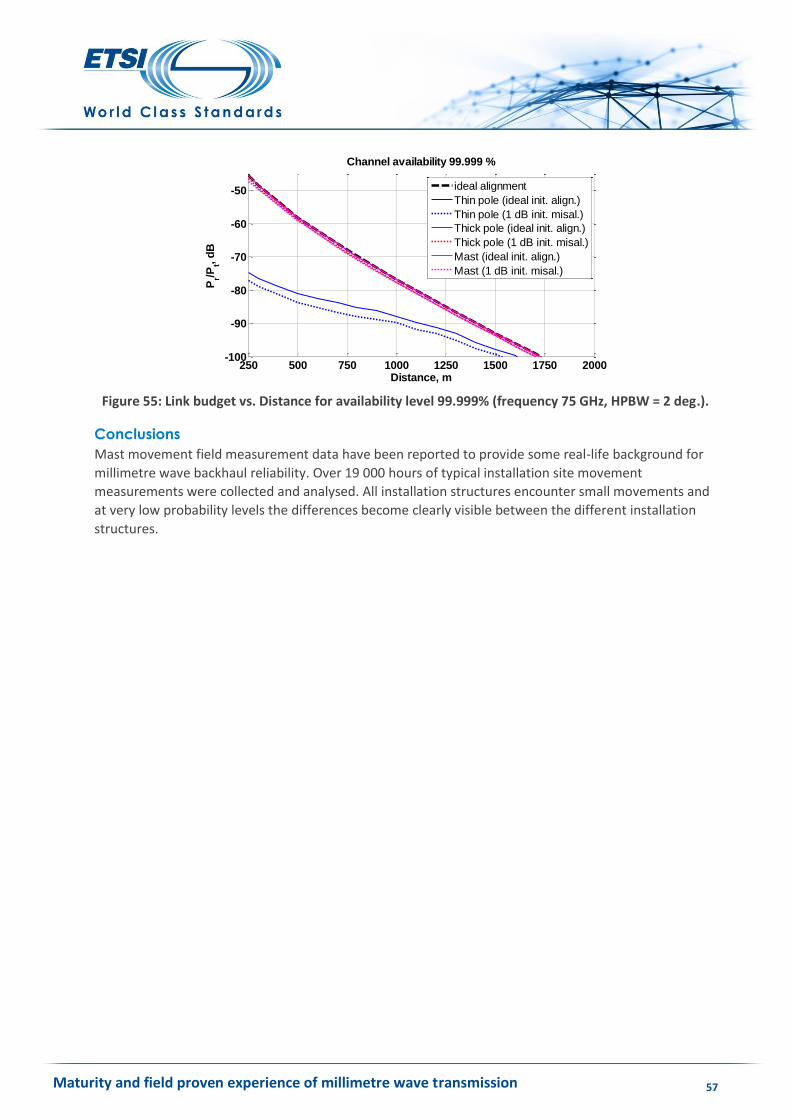
Mast sway field test This trial is reported by Nokia.
Scope
To provide some real-life background for backhaul mm-wave beam steering algorithm development,
mast movement field measurement data is presented here. Over 19 000 hours of typical small-cell
installation site (Figure 49) movement measurements were done during 2014.
Test
Path #
Separation,
m(as the crow
flys)
Beam
path
length, m
Approx angle of
incidence to
reflection point
Reflecting Surface DescriptionPTx
(dBm)
Predicted
reflection
loss (dB)
Predicted RSL
(dBm)
Achieved
RSL
(dBm)
Approx
Prediction
error (dB)
Notes
2 70 100 80glass & metal, 95% tinted glass cover,
smooth surface with minor irregularities4 35 -77 -77 0 low/limited vehicular traffic
3 70 150 60glass & brick, 50% tinted glass cover,
medium surface irregularities4 35 -81 -73 -8 low/limited vehicular traffic
5 70 100 80glass & metal, 95% tinted glass cover,
smooth surface with minor irregularities4 35 -77 -79 2 heavy traffic, with percipitation
6 70 150 60glass & brick, 50% tinted glass cover,
medium surface irregularities4 35 -81 -75 -6 heavy traffic, with percipitation
Maturity and field proven experience of millimetre wave transmission 60
Abbreviations
For the purposes of the present document, the following terms and abbreviations apply:
ACM Adaptive Coding and Modulation
AGL Above Ground Level
AM Adaptive Modulation
BER Bit Error Rate
ES Error Second
ETSI European Telecommunications Standards Institute
FDD Frequency Division Duplexing
HPBW Half-power Beam Width
ISG Industry Specification Group
ITU International Telecommunication Union
LOS Line-of-Sight
MTBF Mean Time Between Failures
MSE Mean Squared Error
MW Micro Wave
mWT millimetre Wave Transmission
nLOS near Line-of-Sight
NLOS Non-Line-of-Sight
NMS Network Management System
ODU Outdoor Unit
PLR Packet Loss Rate
PtP Point-to-Point
QPSK Quadrature Phase Shift Keying
QAM Quadrature Amplitude Modulation
RF Radio Frequency
RSL Received Signal Level
RSSI Received Signal Strength Indication
Maturity and field proven experience of millimetre wave transmission 61
Rx Receiver
UAS Unavailable Seconds
ETSI (European Telecommunications Standards Institute) 06921 Sophia Antipolis CEDEX, France Tel +33 4 92 94 42 00 [email protected] www.etsi.org
This White Paper is issued for information only. It does not constitute an official or agreed position of ETSI, nor of its Members. The views expressed are entirely those of the author(s).
ETSI declines all responsibility for any errors and any loss or damage resulting from use of the contents of this White Paper.
ETSI also declines responsibility for any infringement of any third party's Intellectual Property Rights (IPR), but will be pleased to acknowledge any IPR and correct any infringement of which it is advised.
Copyright Notification
Copying or reproduction in whole is permitted if the copy is complete and unchanged (including this copyright statement).
DECT™, PLUGTESTS™, UMTS™, TIPHON™, IMS™, INTEROPOLIS™, FORAPOLIS™, and the TIPHON and ETSI logos are Trade Marks of ETSI registered for the benefit of its Members.
3GPP™ and LTE™ are Trade Marks of ETSI registered for the benefit of its Members and of the 3GPP Organizational Partners.
GSM™, the Global System for Mobile communication, is a registered Trade Mark of the GSM Association.
GSM™, the Global System for Mobile communication, is a registered Trade Mark of the GSM Association.


![Marcel Dekker,.Project Management Maturity Model - Providing a Proven Path to Project Management Exellence.[2002.ISBN0824707540]](https://static.documents.pub/doc/80x56/55cf9d51550346d033ad1cd7/marcel-dekkerproject-management-maturity-model-providing-a-proven-path.jpg)


