For a series plug-in hybrid electric vehicle (PHEV), it is critical that batteries be sized to maximize vehicle performance variables, such as fuel efficiency, gasoline savings, and zero emission capability. The wide range of design choices and the cost of prototype vehicles calls for a development process to quickly and systematically determine the design characteristics of the battery pack, including its size, and vehicle-level control parameters that maximize the net present value (NPV) of a vehicle during the planning stage. Argonne National Laboratory has developed Autonomie, a modeling and simulation framework. With support from The MathWorks, Argonne has integrated an optimization algorithm and parallel computing tools to enable the aforementioned development process. This paper presents a study that utilized the development process, where the NPV is the present value of all the future expenses and savings associated with the vehicle. The initial investment on the battery and the future savings that result from reduced gasoline consumption are compared. The investment and savings results depend on the battery size and the vehicle usage. For each battery size, the control parameters were optimized to ensure the best performance possible with the battery design under consideration. Real-world driving patterns and survey results from the National Highway Traffic Safety Administration were used to simulate the usage of vehicles over their lifetime.
INTRODUCTION
Plug-in hybrid electric vehicles (PHEVs) have demonstrated great potential with regard to petroleum displacement. Since the benefits of PHEV technology rely heavily on the battery [1], the development of new generations of advanced batteries with a long life and low cost is critical. The objective of the study is to determine the most effective battery power and energy, based on different cost assumptions, to optimize the net present value (NPV). To achieve that goal, Autonomie, Argonne's vehicle simulation tool, is used along with an optimization algorithm developed by The MathWorks. The PHEV used for this analysis is a midsize passenger car. The characteristics of this vehicle are shown in Table 1.
Battery pack Saft, Li 16 kWh, scalable Internal resistance, open circuit voltage as a function of battery state-of-charge
Vehicle Series PHEV Midsize sedan Drag coefficient: 0.31; frontal area: 2.06; test weight: 1,350 kg
Components and their sizes differed when comparing a conventional vehicle and series PHEV. While the battery size changed, the other hybrid powertrain components were left unaltered. This allowed the focus to be placed entirely on the effect of battery size and its economic impact on the vehicle cost.
The cost of the battery was considered as an investment, and the gasoline savings (compared with a conventional vehicle) was considered as a cost savings. Since the investment and operating cost was very specific to vehicle use during its
lifetime, many assumptions were based on the Vehicle Survivability and Travel Mileage Schedules published by the National Highway Traffic Safety Administration (NHTSA) [2].
VEHICLE USAGE ASSUMPTIONS
The series PHEV was compared with a conventional midsize vehicle assumed to have an overall fuel economy of 7.9 liter/100 km (30 mpg), which is typical of a midsize sedan. The gasoline price was assumed to be $0.86/liter ($3.24/gallon). While we understand that fuel prices will vary in the future, such variations were not considered in this study. The studies conducted by NHTSA support the assumption that an average passenger car will travel over 240,000 km during its lifetime [2].
Figure 1 shows an assumption made about the decrease in vehicle daily distance over the life of the vehicle. The vehicle daily distance degradation was estimated based on average driving distances observed in NHTSA surveys [2] and real-world driving data recorded from a group of Kansas City drivers [3]. The NHTSA survey and real-world daily distance data were based on conventional vehicles, thus making the distance-degradation assumption in Figure 1 subject to further review as new survey and field data are obtained from vehicles with new technologies.
Figure 1. Vehicle daily distance
The fuel consumption of any vehicle depends on how it is driven. The studies conducted in Kansas City [3] gave an accurate picture of real-world driving characteristics in a North American city. A representative sample from the real-world drives was used in this study to estimate the fuel consumption values for the series PHEV with varying battery sizes. The main characteristics are shown in Table 2. Many simulation runs over these cycles were necessary to optimize the battery size.
Table 2. Characteristics of the real-world driving patterns used for simulating fuel economy
Parameter Value Average daily driving distance 58 km Average vehicle speed 52 km/h Average energy consumption 286 Wh/mi
The energy & power requirements for the daily drives used in this study are shown in Figures 2, 3 & 4.
It should be noted that more than 95% of the daily drives shown in Figures 2–4 can be completed with 11 kWh of stored electric energy. Similarly, about 50 kW of peak power are needed for about 95% of the daily drives, even though the average power requirement for the daily drives is less than 8 kW.
Energy requirement (kWh)
Cum
ulat
ive
perc
enta
ge o
ccur
renc
e (%
)
0
4
8
12
16
0 5 10 15 20 250
10
20
30
40
50
60
70
80
90
100
Mean=8.5 kWh
Median=8.9 kWh
Std=4 kWh
Number of Daily Drive =30
Num
ber o
f occ
uren
ces
Figure 2. Energy requirement for daily drives
0
4
8
12
16
20
0 2 4 6 8 10 120
10
20
30
40
50
60
70
80
90
100
Mean=7.6 kWMedian=7.1 kWStd=1.9 kWNumber of Daily Drive =30
Power requirement (kWh)Cu
mul
ativ
e pe
rcen
tage
occ
urre
nce
(%)
Num
ber o
f occ
uren
ces
Figure 3. Average power requirement for daily drives
0
6
12
18
0 20 40 60 80 100 1200
10
20
30
40
50
60
70
80
90
100
Mean=36.1 kWMedian=32.3 kWStd=14.1 kWNumber of Daily Drive =30
Peak Power requirement (kWh)
Cum
ulat
ive
perc
enta
ge o
ccur
renc
e (%
)
Num
ber o
f occ
uren
ces
Figure 4. Maximum power requirement for daily drives
BATTERY COST ASSUMPTIONS
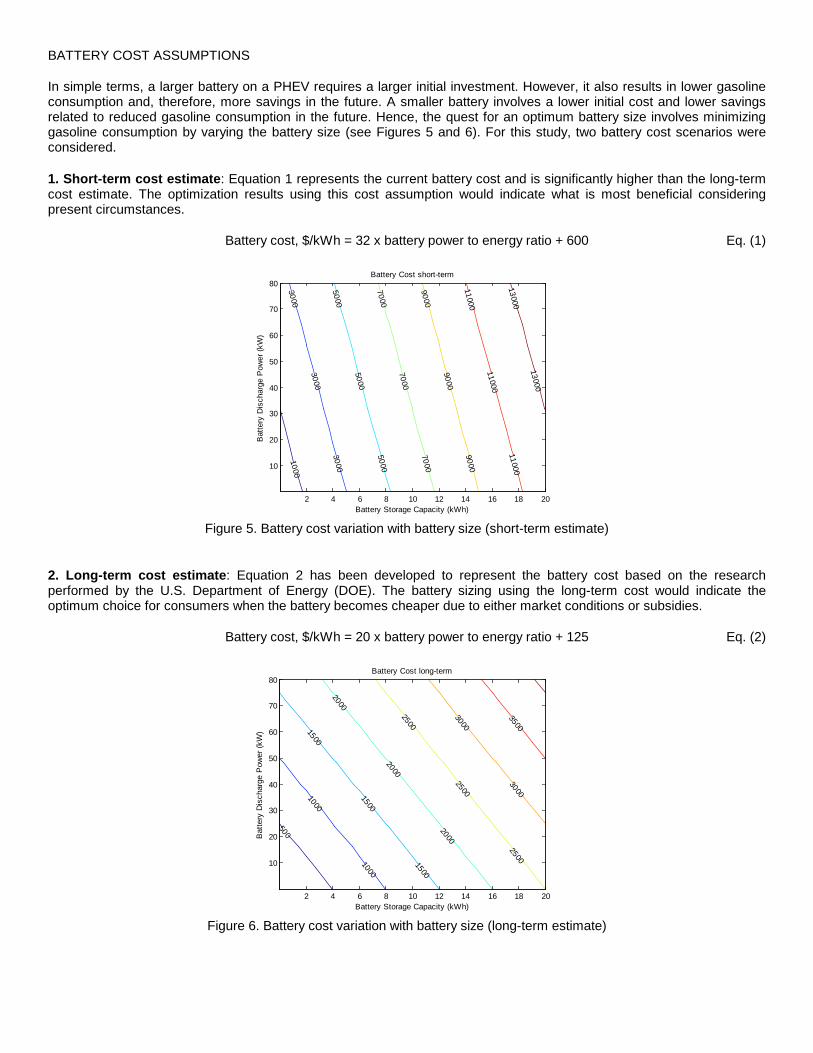
In simple terms, a larger battery on a PHEV requires a larger initial investment. However, it also results in lower gasoline consumption and, therefore, more savings in the future. A smaller battery involves a lower initial cost and lower savings related to reduced gasoline consumption in the future. Hence, the quest for an optimum battery size involves minimizing gasoline consumption by varying the battery size (see Figures 5 and 6). For this study, two battery cost scenarios were considered.
1. Short-term cost estimate: Equation 1 represents the current battery cost and is significantly higher than the long-term cost estimate. The optimization results using this cost assumption would indicate what is most beneficial considering present circumstances.
Battery cost, $/kWh = 32 x battery power to energy ratio + 600 Eq. (1)
10003000
3000
30005000
5000
50007000
7000
70009000
9000
900011000
11000
1100013000
13000
Battery Storage Capacity (kWh)
Bat
tery
Dis
char
ge P
ower
(kW
)
Battery Cost short-term
2 4 6 8 10 12 14 16 18 20
10
20
30
40
50
60
70
80
Figure 5. Battery cost variation with battery size (short-term estimate)
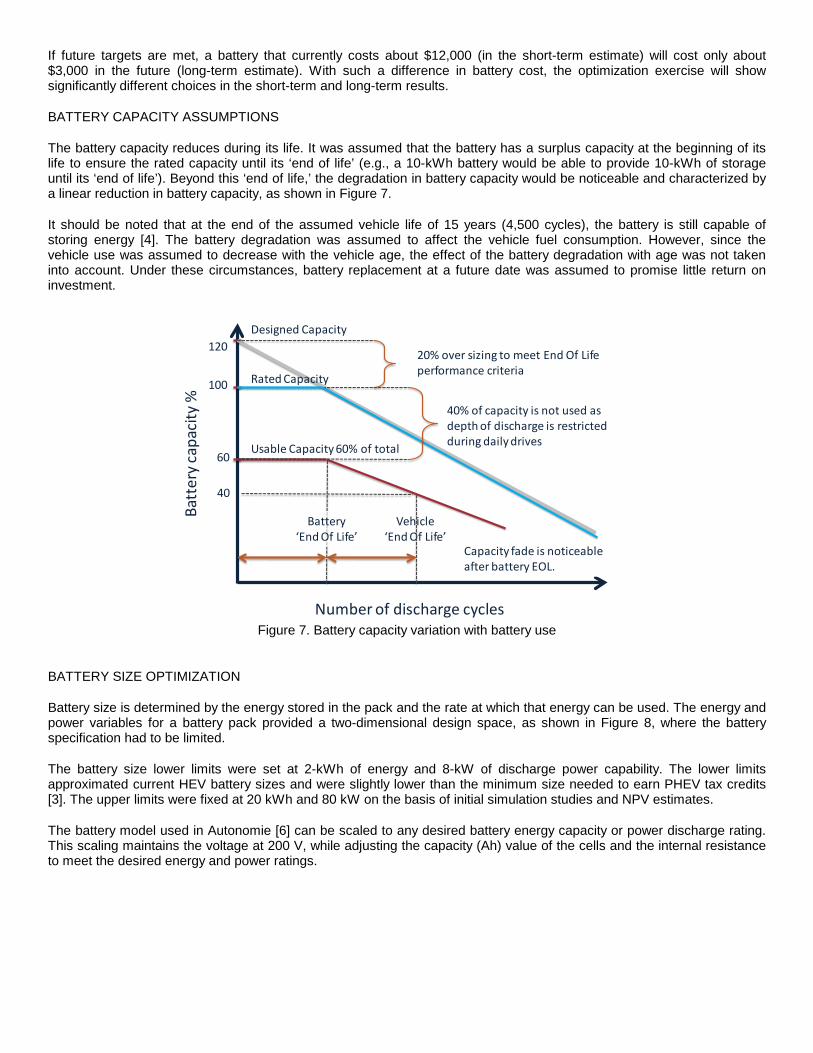
2. Long-term cost estimate: Equation 2 has been developed to represent the battery cost based on the research performed by the U.S. Department of Energy (DOE). The battery sizing using the long-term cost would indicate the optimum choice for consumers when the battery becomes cheaper due to either market conditions or subsidies.
Battery cost, $/kWh = 20 x battery power to energy ratio + 125 Eq. (2)
500
1000
1000
1500
1500
1500
2000
2000
2000
2500
2500
2500
3000
30003500
Battery Storage Capacity (kWh)
Bat
tery
Dis
char
ge P
ower
(kW
)
Battery Cost long-term
2 4 6 8 10 12 14 16 18 20
10
20
30
40
50
60
70
80
Figure 6. Battery cost variation with battery size (long-term estimate)
If future targets are met, a battery that currently costs about $12,000 (in the short-term estimate) will cost only about $3,000 in the future (long-term estimate). With such a difference in battery cost, the optimization exercise will show significantly different choices in the short-term and long-term results.
BATTERY CAPACITY ASSUMPTIONS
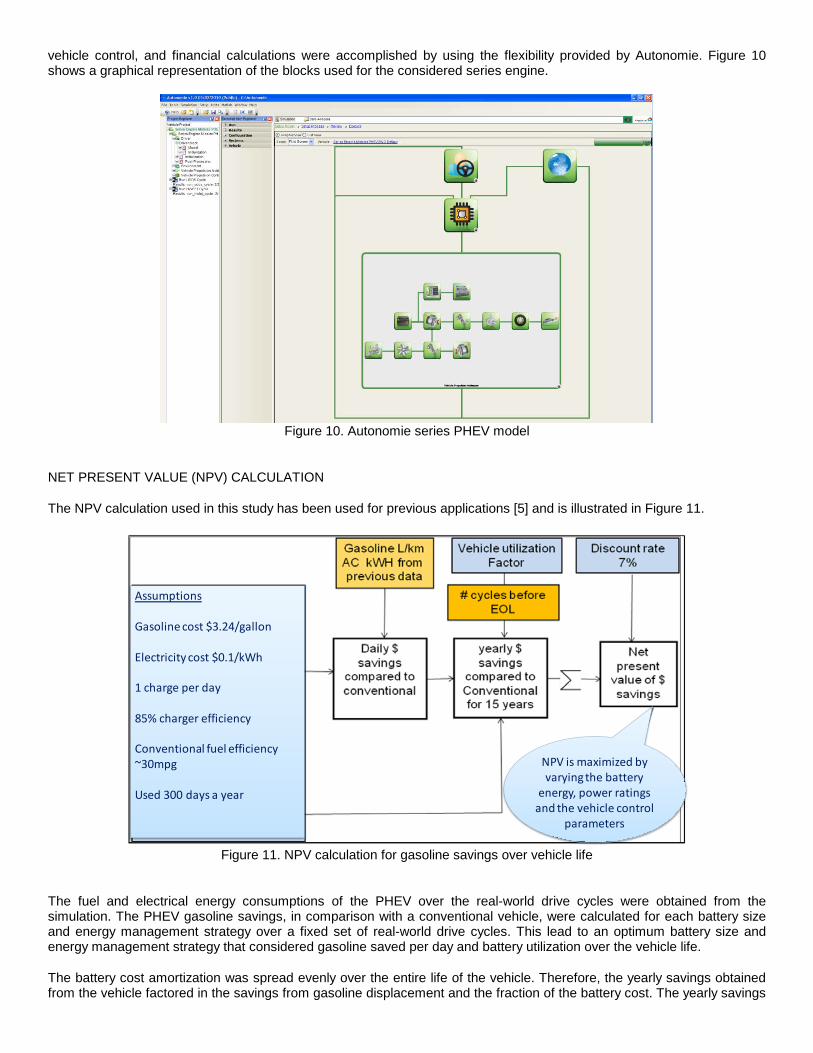
The battery capacity reduces during its life. It was assumed that the battery has a surplus capacity at the beginning of its life to ensure the rated capacity until its ‘end of life’ (e.g., a 10-kWh battery would be able to provide 10-kWh of storage until its ‘end of life’). Beyond this ‘end of life,’ the degradation in battery capacity would be noticeable and characterized by a linear reduction in battery capacity, as shown in Figure 7.
It should be noted that at the end of the assumed vehicle life of 15 years (4,500 cycles), the battery is still capable of storing energy [4]. The battery degradation was assumed to affect the vehicle fuel consumption. However, since the vehicle use was assumed to decrease with the vehicle age, the effect of the battery degradation with age was not taken into account. Under these circumstances, battery replacement at a future date was assumed to promise little return on investment.
Number of discharge cycles
Batt
ery
capa
city
%
120
100
60
20% over sizing to meet End Of Life performance criteria
40% of capacity is not used as depth of discharge is restricted during daily drives
Battery ‘End Of Life’
Capacity fade is noticeable after battery EOL.
Designed Capacity
Rated Capacity
Usable Capacity 60% of total
Vehicle ‘End Of Life’
40
Figure 7. Battery capacity variation with battery use
BATTERY SIZE OPTIMIZATION
Battery size is determined by the energy stored in the pack and the rate at which that energy can be used. The energy and power variables for a battery pack provided a two-dimensional design space, as shown in Figure 8, where the battery specification had to be limited.
The battery size lower limits were set at 2-kWh of energy and 8-kW of discharge power capability. The lower limits approximated current HEV battery sizes and were slightly lower than the minimum size needed to earn PHEV tax credits [3]. The upper limits were fixed at 20 kWh and 80 kW on the basis of initial simulation studies and NPV estimates.
The battery model used in Autonomie [6] can be scaled to any desired battery energy capacity or power discharge rating. This scaling maintains the voltage at 200 V, while adjusting the capacity (Ah) value of the cells and the internal resistance to meet the desired energy and power ratings.
Battery spec range
2 kWh 20 kWh
8 kW
80 kW
energy
pow
er
Figure 8. Battery design space
OFF threshold
ON threshold
Pow
er d
eman
d at
whe
el
Engine OFF
Engine ON
time
Figure 9. Control parameters: engine ON/OFF thresholds
VEHICLE CONTROL PARAMETERS OPTIMIZATION
For this study, we assumed a controller that turns the engine ON based on the criteria mentioned below:
1. If the battery power alone is insufficient to drive the vehicle; 2. If the battery state of charge (SOC) falls below the desired charge-sustaining SOC target value; and 3. If the power demand at the wheel is above the engine ON threshold value, and it stays above the engine OFF
threshold value, as shown in Figure 9. By optimizing the engine ON/OFF thresholds, the objective was to arrive at the optimum rule-based control strategy. The control strategy could vary from having a charge-depleting region followed by a charge-sustaining run, or a blended strategy where the engine was often used to supplement the battery power output.
SIMULATION
Autonomie [6] is the modeling and simulation tool developed by Argonne National Laboratory as a successor to the Powertrain Systems Analysis Toolkit (PSAT). The tool provides the ability to create a vehicle model with the desired component sizes, and then simulate it over any number of drive cycles. The post-processing capabilities of Autonomie allow for further analysis of the simulation results. Apart from calculating frequently used values, such as vehicle fuel consumption or the efficiencies of various components, the post-processing can be further extended to estimate very specific results, such as the vehicle economic feasibility. In this case, the series PHEV model developed in Autonomie was used in the MATLAB® environment for the optimization exercise. However, the battery size scaling, modification of the
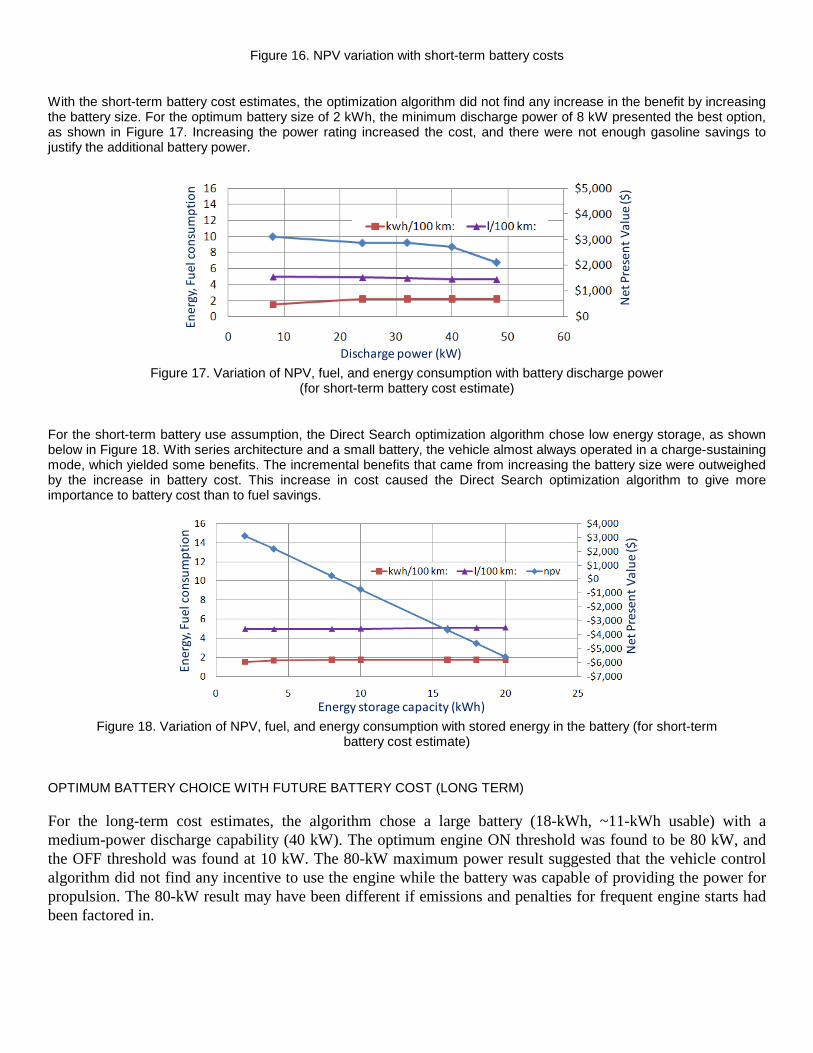
vehicle control, and financial calculations were accomplished by using the flexibility provided by Autonomie. Figure 10 shows a graphical representation of the blocks used for the considered series engine.
Figure 10. Autonomie series PHEV model
NET PRESENT VALUE (NPV) CALCULATION
The NPV calculation used in this study has been used for previous applications [5] and is illustrated in Figure 11.
Assumptions
Gasoline cost $3.24/gallon
Electricity cost $0.1/kWh
1 charge per day
85% charger efficiency
Conventional fuel efficiency ~30mpg
Used 300 days a year
NPV is maximized by varying the battery
energy, power ratings and the vehicle control
parameters
Figure 11. NPV calculation for gasoline savings over vehicle life
The fuel and electrical energy consumptions of the PHEV over the real-world drive cycles were obtained from the simulation. The PHEV gasoline savings, in comparison with a conventional vehicle, were calculated for each battery size and energy management strategy over a fixed set of real-world drive cycles. This lead to an optimum battery size and energy management strategy that considered gasoline saved per day and battery utilization over the vehicle life.
The battery cost amortization was spread evenly over the entire life of the vehicle. Therefore, the yearly savings obtained from the vehicle factored in the savings from gasoline displacement and the fraction of the battery cost. The yearly savings
were repeated for the 15 years of vehicle life, which resulted in a series of numbers that represented the yearly expenses/savings from owning and using a PHEV. The NPV of each set of expenses/savings provided a dollar amount for the present worth of those expenses/savings.
The Direct Search numerical optimizer, available in MATLAB®, was used to read the output of the NPV calculations and to apply its optimization algorithm to command new battery size parameters and vehicle control parameters to maximize the NPV. The optimization problem statement is shown in Figure 12.
Figure 12. Optimization problem statement: Maximize the NPV by changing battery and control parameters
The left side of Figure 12 shows four independent optimization variables related to the vehicle control and battery design variables manipulated by the numerical optimizer to maximize the NPV calculation over a set of 30 real-world drive cycles. Simultaneous optimization of the vehicle control and battery design parameters was necessary to achieve a realistic result, since influence interactions between the control and hardware design parameters have reached an equal level of importance and design sensitivity in modern vehicles.
OPTIMIZATION APPROACH
Figure 13 shows the top-level optimization process used to optimize the battery and control design parameters across a set of 30 real-world drive-cycles. Starting with a nominal set of four control and battery design parameters, a Direct Search optimization algorithm was used to generate an initial set of eight normalized variation coordinates in the four dimensions being searched. The initial eight-point grid was scaled to cover the entire range of the four design parameters so that local minima could be avoided. At each of the eight initial points, 30 real-world drive-cycles were simulated in parallel computing rapid-accelerator operating mode to determine the NPV for each point.
The four-dimensional coordinate with the highest NPV was then chosen as the new center-point of the optimization, and the span of subsequent variations was reduced until a 1% normalized parameter variation tolerance was met. The optimization approach shown in Figure 11 was chosen to avoid the problem of local minima, which often is encountered in systems that have discrete state changes due to variations in control and hardware parameters, and to provide a simple, robust approach to finding the global maximum NPV value.
For the Autonomie PHEV model involved in this study, a typical 4-variable battery and control parameter optimization that used 30 real-world drive cycles per simulation required approximately 1,000 simulations in total to be executed. The process required approximately 4 hours of run-time on a single quad-core PC.
Figure 13. Direct search optimization approach
OPTIMIZATION RESULTS
NET OPERATIONAL COST SAVINGS
A PHEV has two operating costs: gasoline and electricity. A large battery allows for the use of more electricity and less gasoline. For any specific battery size, we can compute the optimum electricity and gasoline consumption for the vehicle, as part of the control optimization. A conventional vehicle will consume approximately $16,000 worth of gasoline over its 240,000-km lifetime. With this information, we can further estimate the net savings obtained by using a PHEV, as shown in Figure 14.
This might suggest the largest possible battery as the best option. However, the battery cost will impact that choice. The NPV of the amortized battery cost and the gasoline savings accrued over the entire vehicle life will determine which battery offers the maximum value, as well as the return on investment that can be expected from a PHEV battery.
70007000
7000 7000 7000
80008000
8000
8000 8000
1000
0
10000
10000 10000
1100
0
11000
11000
12000
12000
Battery Storage Capacity (kWh)
Bat
tery
Dis
char
ge P
ower
(kW
)
Net operational savings for PHEV over a 30mpg vehicle
2 4 6 8 10 12 14 16 18 20
10
20
30
40
50
60
70
Figure 14. Variation of savings in operational cost with battery size (battery cost not included)
Two optimization tests were conducted with long-term battery costs and short-term battery costs (reflecting the present scenario). Since the NPV was highly dependent upon the initial investment, significantly different results were expected for these two cases. The results obtained are shown in Figure 15. The following sections provide a detailed review of how the battery cost, energy, and power requirements of the drive cycles have influenced the results.
2 kWh 20 kWh
8 kW
80 kW
energy
pow
er 40 kW 18 kWhLong term
8 kW 2 kWhShort term
Figure 15. Battery sizes chosen for maximum NPV
OPTIMUM BATTERY CHOICE WITH CURRENT BATTERY COST (SHORT TERM)
The short-term battery life results gave a very different picture than the long-term results. The higher battery costs forced the optimizer to reduce the battery size as far as possible.
The gasoline displacement obtained in this case was enough to offset the battery cost, but it was not enough to justify the investment on a larger battery. A 2-kWh battery with an 8-kW power discharge capacity would still result in higher PHEV fuel efficiency than a conventional vehicle. The gasoline savings from a small battery were not estimated to be as much as the savings associated with a large battery. Since the investment needed for a small battery was low, the series PHEV still yielded a positive NPV if the battery size was reduced. The contour plot in Figure 16 shows the gradual reduction in savings as the battery size was increased. It also shows some areas where there will be a net loss because of the costly battery.
It should be noted that the same gasoline and electrical energy consumption was used to compute the plots shown Figures 16 and 19. The variation in the contour values was entirely due to the change in battery cost and the estimation of the NPV of expenses and savings.
0
0
0
0
500
500
500
500
500
1000
1000
1000
1000
1000
2000
200020
00
20002400
2400
2400
2600
2600
2800
Battery Storage Capacity (kWh)
Bat
tery
Dis
char
ge P
ower
(kW
)
NPV variation
2 4 6 8 10 12 14 16 18 2010
20
30
40
50
60
70
80
Figure 16. NPV variation with short-term battery costs
With the short-term battery cost estimates, the optimization algorithm did not find any increase in the benefit by increasing the battery size. For the optimum battery size of 2 kWh, the minimum discharge power of 8 kW presented the best option, as shown in Figure 17. Increasing the power rating increased the cost, and there were not enough gasoline savings to justify the additional battery power.
Discharge power (kW)
Ener
gy, F
uel c
onsu
mpt
ion
Net
Pre
sent
Val
ue ($
)
Figure 17. Variation of NPV, fuel, and energy consumption with battery discharge power
(for short-term battery cost estimate)
For the short-term battery use assumption, the Direct Search optimization algorithm chose low energy storage, as shown below in Figure 18. With series architecture and a small battery, the vehicle almost always operated in a charge-sustaining mode, which yielded some benefits. The incremental benefits that came from increasing the battery size were outweighed by the increase in battery cost. This increase in cost caused the Direct Search optimization algorithm to give more importance to battery cost than to fuel savings.
Energy storage capacity (kWh)
Ener
gy, F
uel c
onsu
mpt
ion
Net
Pre
sent
Val
ue ($
)
Figure 18. Variation of NPV, fuel, and energy consumption with stored energy in the battery (for short-term
battery cost estimate)
OPTIMUM BATTERY CHOICE WITH FUTURE BATTERY COST (LONG TERM)
For the long-term cost estimates, the algorithm chose a large battery (18-kWh, ~11-kWh usable) with a medium-power discharge capability (40 kW). The optimum engine ON threshold was found to be 80 kW, and the OFF threshold was found at 10 kW. The 80-kW maximum power result suggested that the vehicle control algorithm did not find any incentive to use the engine while the battery was capable of providing the power for propulsion. The 80-kW result may have been different if emissions and penalties for frequent engine starts had been factored in.
4000
4000
4000 40004000
4500
4500
4500
4500 4500
5000
5000
5000
5000 5000
5500
5500
5500
5500
5800
5800
5800
5800
6020
6020
6020
6080
Battery Storage Capacity (kWh)
Bat
tery
Dis
char
ge P
ower
(kW
)
NPV variation
2 4 6 8 10 12 14 16 18 20
10
20
30
40
50
60
70
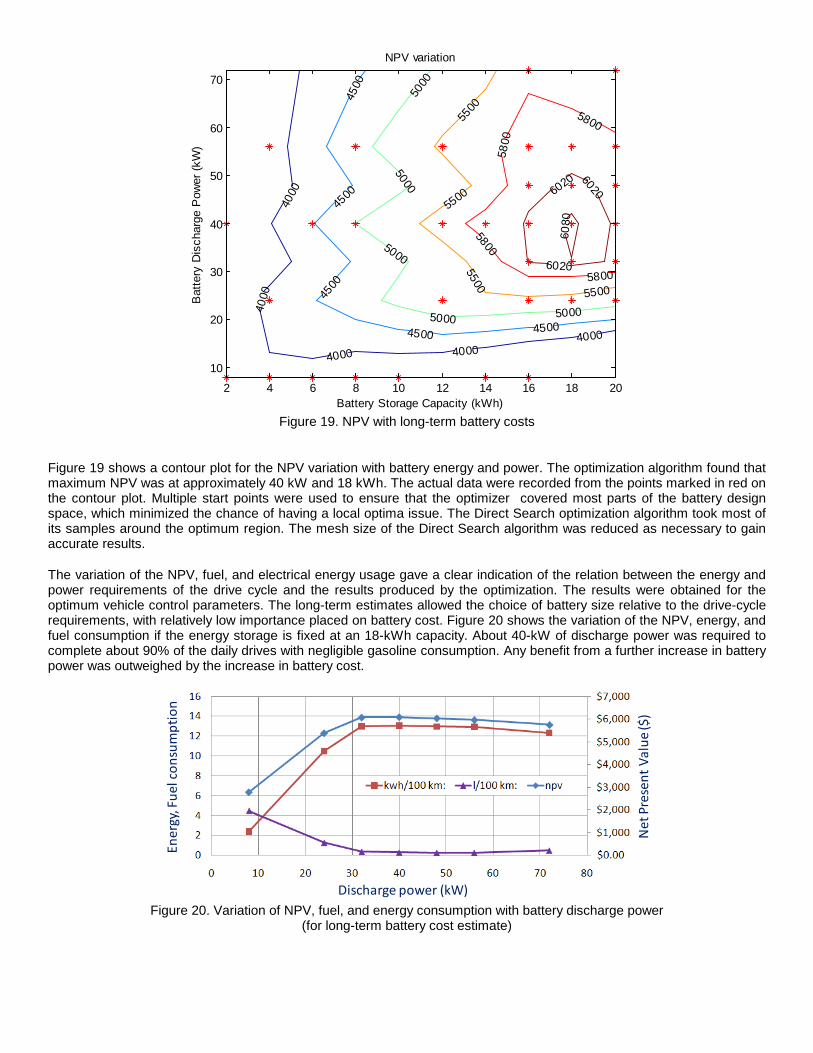
Figure 19. NPV with long-term battery costs
Figure 19 shows a contour plot for the NPV variation with battery energy and power. The optimization algorithm found that maximum NPV was at approximately 40 kW and 18 kWh. The actual data were recorded from the points marked in red on the contour plot. Multiple start points were used to ensure that the optimizer covered most parts of the battery design space, which minimized the chance of having a local optima issue. The Direct Search optimization algorithm took most of its samples around the optimum region. The mesh size of the Direct Search algorithm was reduced as necessary to gain accurate results.
The variation of the NPV, fuel, and electrical energy usage gave a clear indication of the relation between the energy and power requirements of the drive cycle and the results produced by the optimization. The results were obtained for the optimum vehicle control parameters. The long-term estimates allowed the choice of battery size relative to the drive-cycle requirements, with relatively low importance placed on battery cost. Figure 20 shows the variation of the NPV, energy, and fuel consumption if the energy storage is fixed at an 18-kWh capacity. About 40-kW of discharge power was required to complete about 90% of the daily drives with negligible gasoline consumption. Any benefit from a further increase in battery power was outweighed by the increase in battery cost.
Discharge power (kW)
Ener
gy, F
uel c
onsu
mpt
ion
Net
Pre
sent
Val
ue ($
)
Figure 20. Variation of NPV, fuel, and energy consumption with battery discharge power
(for long-term battery cost estimate)
Similarly, the increase in energy storage capacity yielded savings benefits until it reached 18 kWh (~11 kWh usable). As shown in Figure 21, this also is significant, since 18 kWh of energy could be used to satisfy 95% of the daily driving requirement. Further increases in energy storage would have increased the cost of the battery, with little savings in return.
Energy storage capacity (kWh)
Ener
gy, F
uel c
onsu
mpt
ion
Net
Pre
sent
Val
ue ($
)
Figure 21. Variation of NPV, fuel, and energy consumption with stored energy in the battery
(for long-term battery cost estimate)
CONCLUSIONS
A new development process for the planning of PHEVs has been proposed by Argonne National Laboratory, with the support of simulation and optimization tools from The MathWorks during the course of the study. Only a few years ago, a similar study involving thousands of simulated runs over 30 different drive cycles might have been very difficult due to the lack of hardware computing power and available off-shelf simulation tools compatible with parallel computing and optimization. Autonomie has provided the capability to build and run vehicle models over drive cycles, while utilizing the parallel computing and optimization capabilities in MATLAB®, thereby making such extensive studies possible within a reasonable time frame for everyday engineers. The application of the tools demonstrated the need to use such a process when sizing components to maximize NPV, which is a critical part of setting component requirements.
ACKNOWLEDGMENTS
This work was supported by DOE’s Vehicle Technology Office under the direction of David Anderson and Lee Slezak. The submitted manuscript has been created by UChicago Argonne, LLC, Operator of Argonne National Laboratory ("Argonne"). Argonne, a U.S. Department of Energy Office of Science laboratory, is operated under Contract No. DE-AC02-06CH11357. The U.S. Government retains for itself, and others acting on its behalf, a paid-up nonexclusive, irrevocable worldwide license in said article to reproduce, prepare derivative works, distribute copies to the public, and perform publicly and display publicly, by or on behalf of the Government.
REFERENCES
1. Karbowski, D., Haliburton, C., and Rousseau, A., "Impact of Component Size on Plug-in Hybrid Vehicle Energy Consumption Using Global Optimization," presented at the 23rd International Electric Vehicle Symposium, Anaheim, CA, Dec. 2007.
2. NHTSA, "Vehicle Survivability and Travel Mileage Schedules," National Center for Statistics and Analysis, National Highway Traffic Safety Administration, U.S. Department of Transportation, Washington, DC, 2006.
3. Kansas City Real World Driving Pattern from NHTSA. 4. U.S. House of Representatives, 110th Congress, "Energy Improvement and Extension Act of 2008," H.R. 6049,
available at: http://www.govtrack.us/congress/bill.xpd?bill=h110-6049, 2008. 5. Shidore, N., et.al., "Impact of Energy Management on the NPV Gasoline Savings of PHEVs," SAE, 2010. 6. Vyas, A., et.al., "Plug-in Hybrid Electric Vehicles: How Does One Determine Their Potential for Reducing U.S. Oil
Dependence?" presented at the small lecture series at the 23rd International Battery and Fuel Cell Electric Vehicle Symposium and Exposition (EVS 23), Anaheim, CA, Dec. 2–5, 2007.
7. Argonne National Laboratory, Autonomie, Computer Software, available at: http://www.transportation.anl.gov/ modeling_simulation/index.html, 2009.
8. USABC goals for PHEV Energy Storage Systems, available at: http://www.uscar.org/guest/ article_view.php?articles_id=85, 2006.