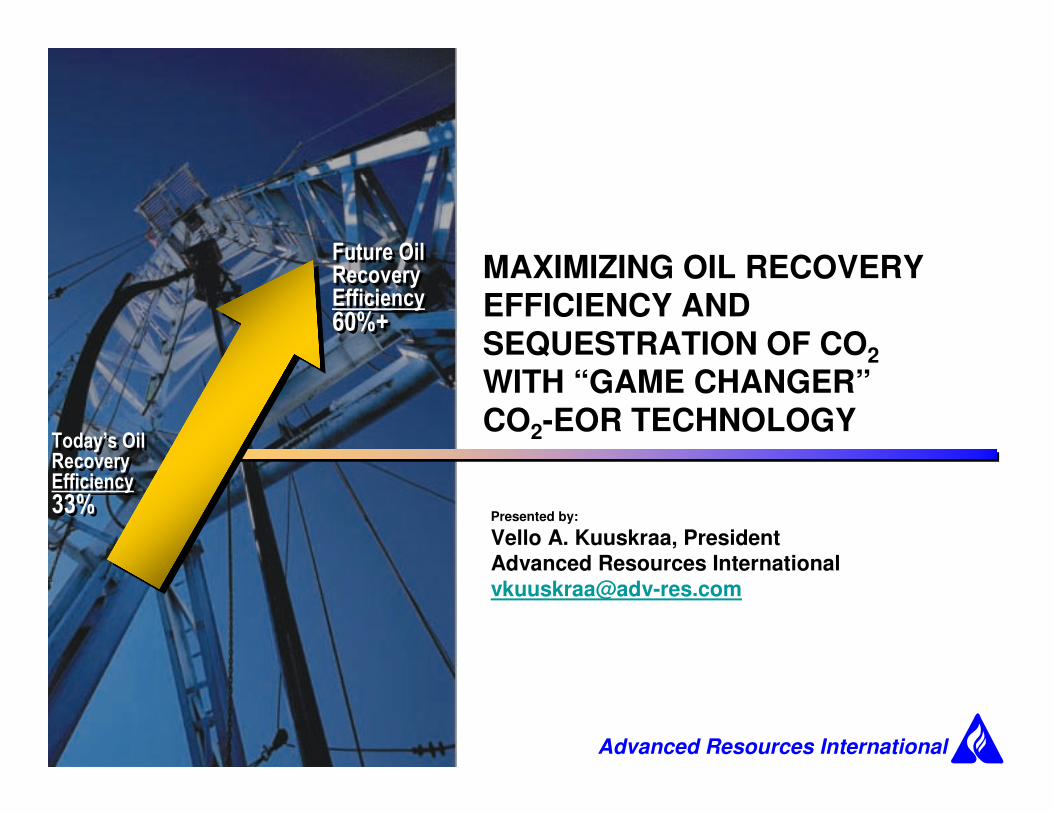
JAF02713.PPT 1 January 2008 MAXIMIZING OIL RECOVERY EFFICIENCY AND SEQUESTRATION OF CO 2 WITH “GAME CHANGER” CO 2 -EOR TECHNOLOGY Presented by: Vello A. Kuuskraa, President Advanced Resources International [email protected]Today’s Oil Recovery Efficiency 33% Today’s Oil Recovery Efficiency 33% Future Oil Recovery Efficiency 60%+ Future Oil Recovery Efficiency 60%+ Advanced Resources International
Transcript
JAF02713.PPT 1 January 2008
MAXIMIZING OIL RECOVERY EFFICIENCY AND SEQUESTRATION OF CO2
WITH “GAME CHANGER”CO2-EOR TECHNOLOGY
Presented by:
Vello A. Kuuskraa, PresidentAdvanced Resources International
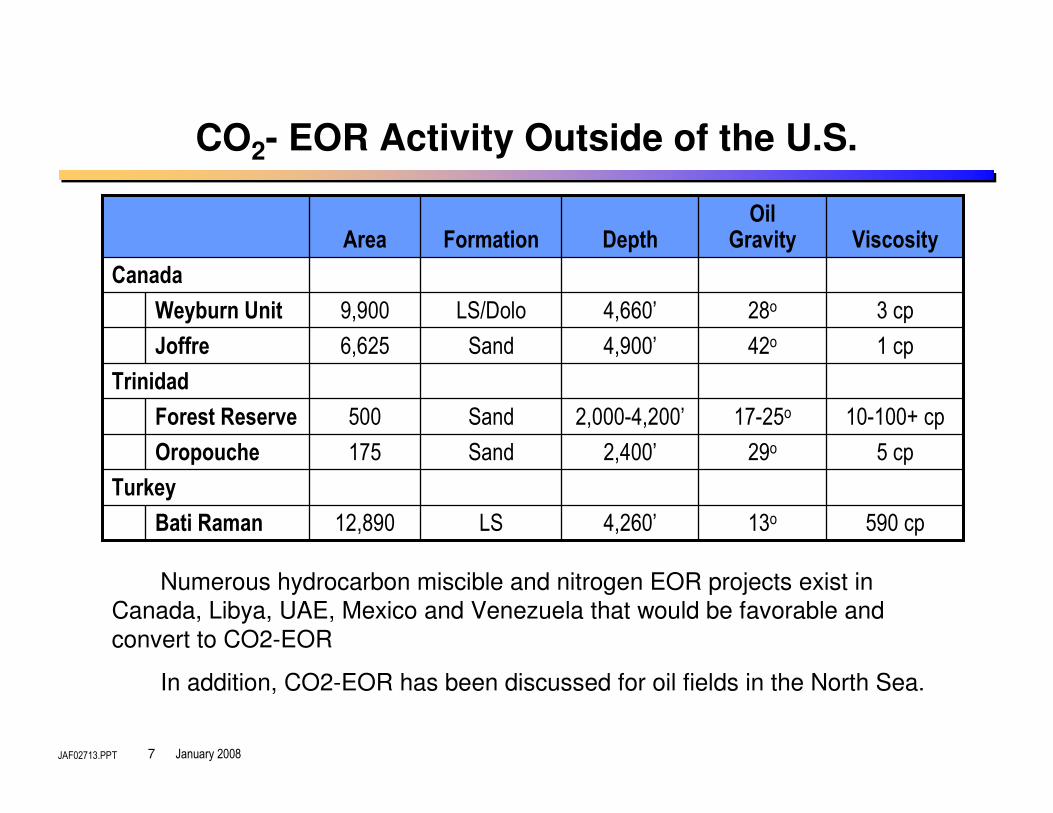
Numerous hydrocarbon miscible and nitrogen EOR projects exist inCanada, Libya, UAE, Mexico and Venezuela that would be favorable and convert to CO2-EOR
In addition, CO2-EOR has been discussed for oil fields in the North Sea.
JAF02713.PPT 8 January 2008
OUTLOOK FOR CO2-EOR
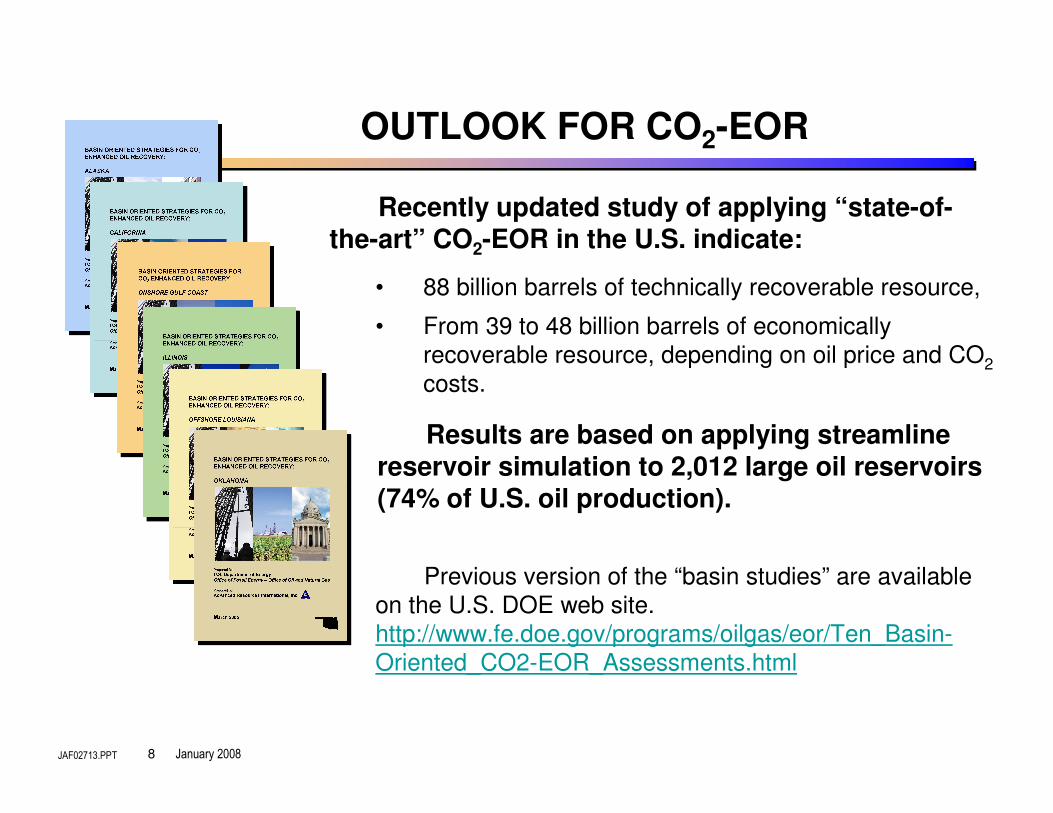
Recently updated study of applying “state-of-the-art” CO2-EOR in the U.S. indicate:
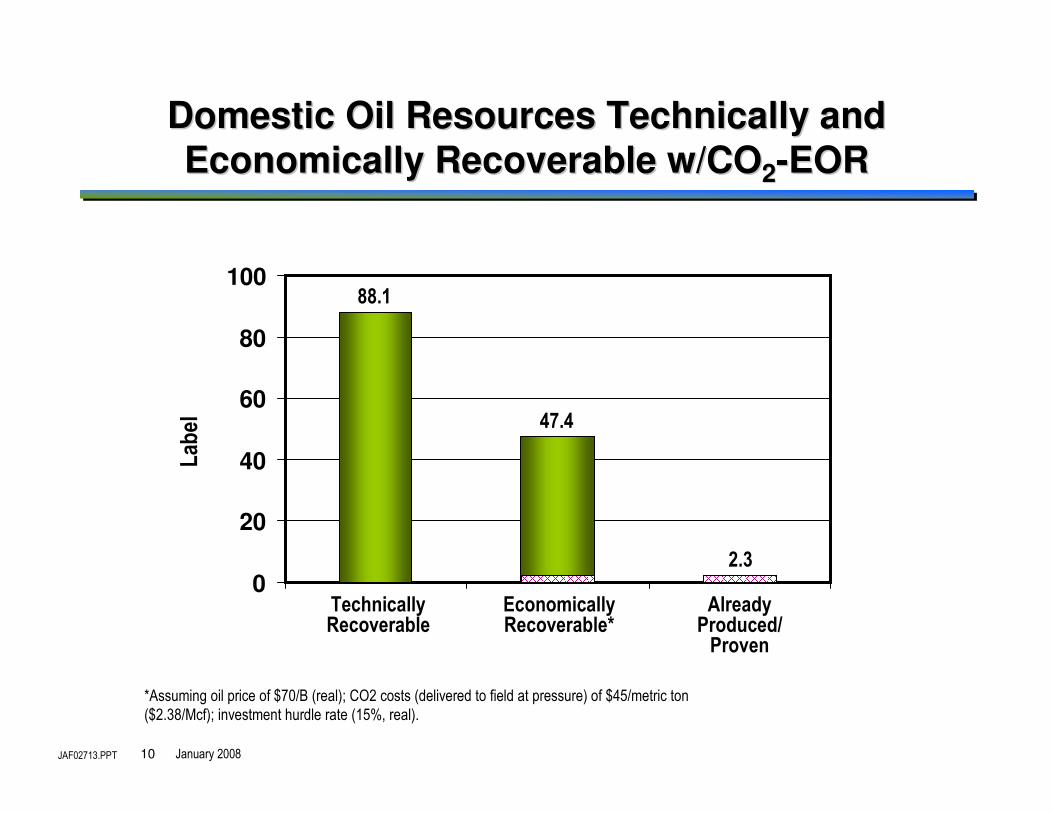
• 88 billion barrels of technically recoverable resource,
• From 39 to 48 billion barrels of economically recoverable resource, depending on oil price and CO2
costs.
Previous version of the “basin studies” are available on the U.S. DOE web site. http://www.fe.doe.gov/programs/oilgas/eor/Ten_Basin-Oriented_CO2-EOR_Assessments.html
Results are based on applying streamline reservoir simulation to 2,012 large oil reservoirs (74% of U.S. oil production).
JAF02713.PPT 9 January 2008
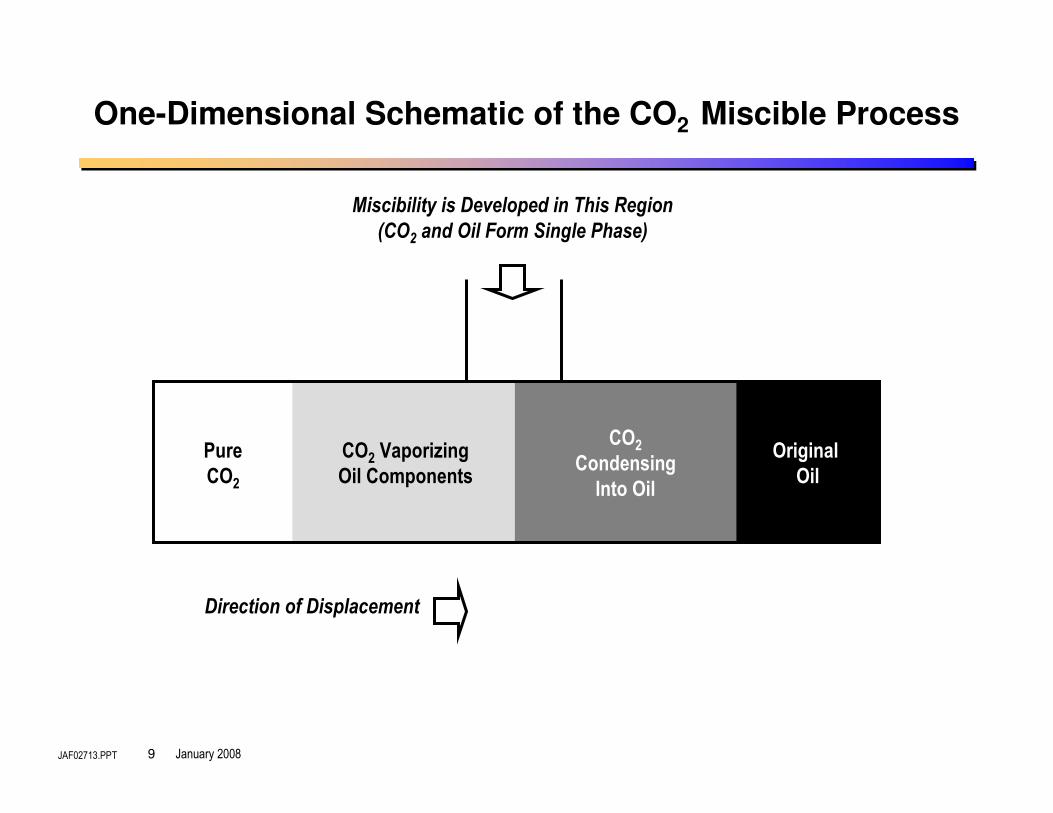
One-Dimensional Schematic of the CO2 Miscible Process
PureCO2
CO2 VaporizingOil Components
CO2CondensingInto Oil
Original Oil
Miscibility is Developed in This Region
(CO2 and Oil Form Single Phase)
Direction of Displacement
JAF02713.PPT 10 January 2008
Domestic Oil Resources Technically and Domestic Oil Resources Technically and
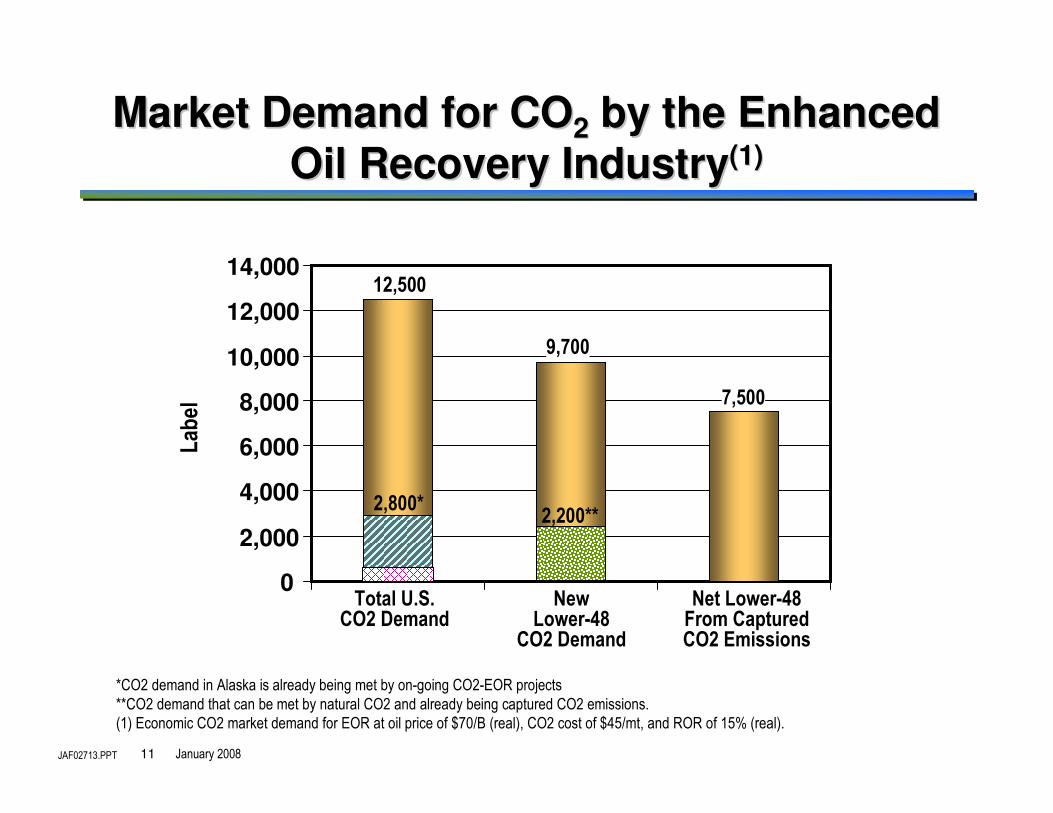
*CO2 demand in Alaska is already being met by on-going CO2-EOR projects**CO2 demand that can be met by natural CO2 and already being captured CO2 emissions.(1) Economic CO2 market demand for EOR at oil price of $70/B (real), CO2 cost of $45/mt, and ROR of 15% (real).
Total U.S.CO2 Demand
NewLower-48
CO2 Demand
Net Lower-48From CapturedCO2 Emissions
0
2,000
4,000
6,000
8,000
10,000
12,000
14,00012,500
9,700
7,500
2,800*2,200**
JAF02713.PPT 12 January 2008
* Source: 12th Annual CO2 Flooding Conference, Dec. 2006** MMcfd of CO2 can be converted to million metric tons per year by first multiplying by 365 (days per year) and then dividing by 18.9 * 103 (Mcf per metric ton).
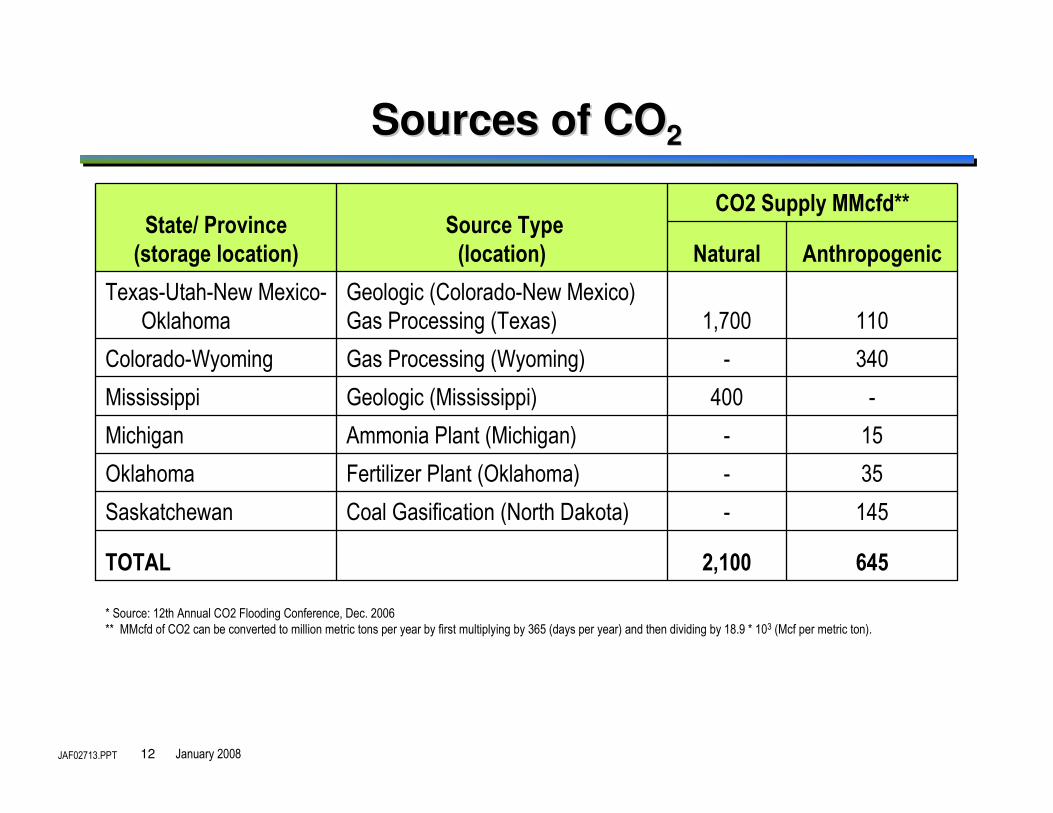
6452,100TOTAL
145-Coal Gasification (North Dakota)Saskatchewan
35-Fertilizer Plant (Oklahoma)Oklahoma
15-Ammonia Plant (Michigan)Michigan
-400Geologic (Mississippi)Mississippi
340-Gas Processing (Wyoming)Colorado-Wyoming
1101,700Geologic (Colorado-New Mexico) Gas Processing (Texas)
Texas-Utah-New Mexico-Oklahoma
AnthropogenicNatural
CO2 Supply MMcfd**Source Type (location)
State/ Province (storage location)
Sources of COSources of CO22
JAF02713.PPT 13 January 2008
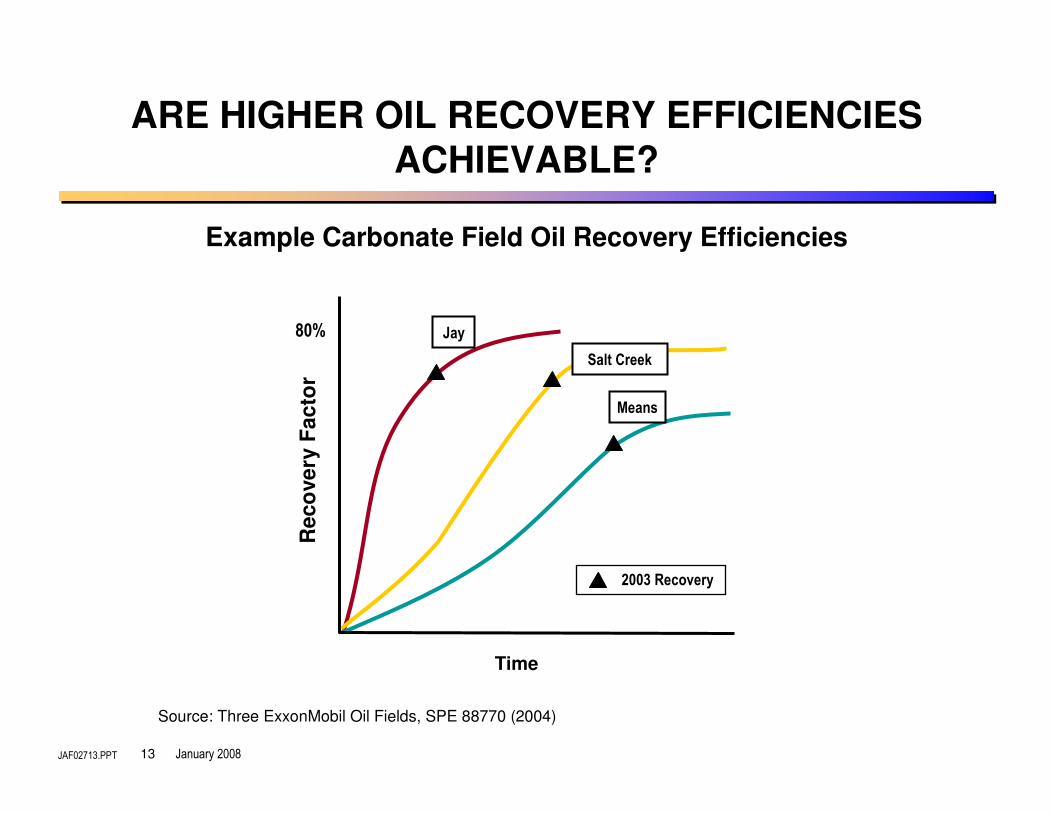
ARE HIGHER OIL RECOVERY EFFICIENCIES ACHIEVABLE?
Example Carbonate Field Oil Recovery Efficiencies
Source: Three ExxonMobil Oil Fields, SPE 88770 (2004)
Re
co
ve
ry F
ac
tor
Time
80%
Salt Creek
Means
Jay
2003 Recovery
JAF02713.PPT 14 January 2008
“NEXT GENERATION” CO2-EOR TECHNOLOGY
Reservoir modeling and selected field tests show that high oil recovery efficiencies are possible with innovative applications of CO2-EOR.
So far, except for a handful of cases, the actual performance of CO2-EOR has been less than optimum due to:
• Geologically complex reservoirs
• Limited process control
• Insufficient CO2 injection
JAF02713.PPT 15 January 2008
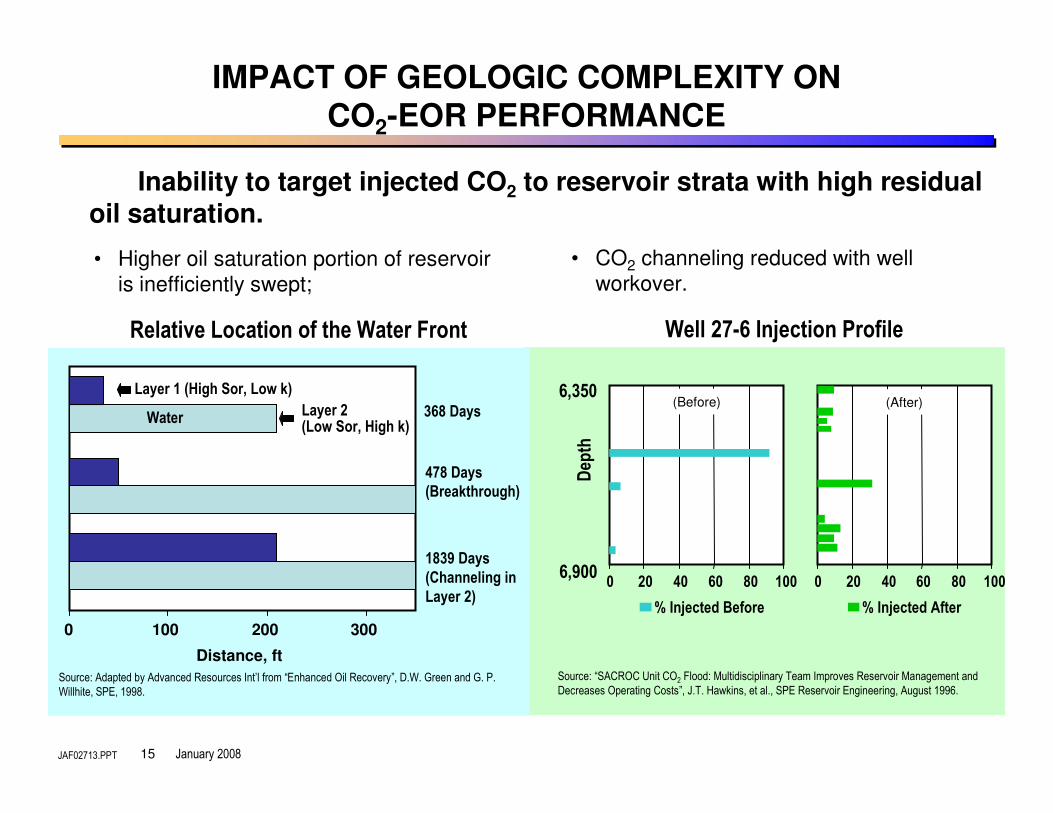
IMPACT OF GEOLOGIC COMPLEXITY ON CO2-EOR PERFORMANCE
Inability to target injected CO2 to reservoir strata with high residual oil saturation.
0 20 40 60 80 1006,900
Depth
6,350
% Injected Before
0 20 40 60 80 100
% Injected After
Well 27-6 Injection Profile
(Before) (After)
Source: “SACROC Unit CO2 Flood: Multidisciplinary Team Improves Reservoir Management andDecreases Operating Costs”, J.T. Hawkins, et al., SPE Reservoir Engineering, August 1996.
1839 Days(Channeling in Layer 2)
478 Days(Breakthrough)
368 Days
Source: Adapted by Advanced Resources Int’l from “Enhanced Oil Recovery”, D.W. Green and G. P. Willhite, SPE, 1998.
Relative Location of the Water Front
0 100 200 300
Distance, ft
Layer 1 (High Sor, Low k)
Layer 2 (Low Sor, High k)
Water
• Higher oil saturation portion of reservoir is inefficiently swept;
• CO2 channeling reduced with well workover.
JAF02713.PPT 16 January 2008
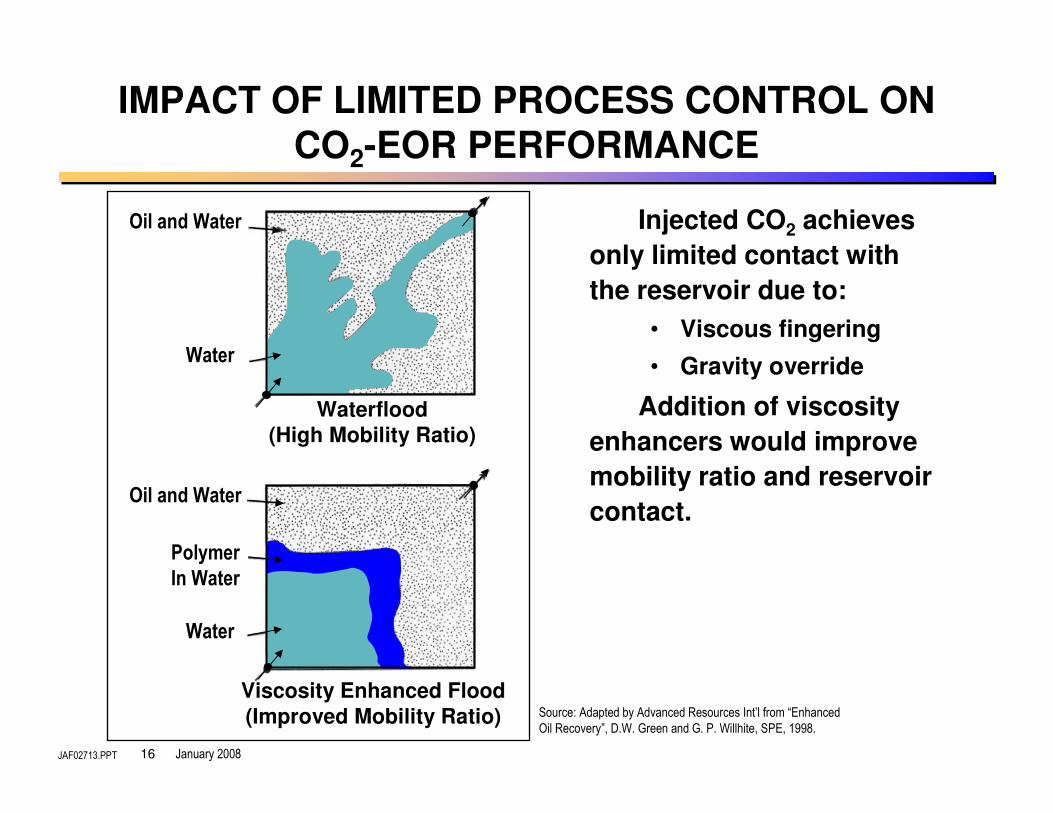
IMPACT OF LIMITED PROCESS CONTROL ON
CO2-EOR PERFORMANCE
Injected CO2 achieves
only limited contact with
the reservoir due to:
• Viscous fingering
• Gravity override
Addition of viscosity
enhancers would improve
mobility ratio and reservoir
contact.
Source: Adapted by Advanced Resources Int’l from “Enhanced Oil Recovery”, D.W. Green and G. P. Willhite, SPE, 1998.
Oil and Water
Water
Oil and Water
Water
PolymerIn Water
Waterflood(High Mobility Ratio)
Viscosity Enhanced Flood
(Improved Mobility Ratio)
JAF02713.PPT 17 January 2008
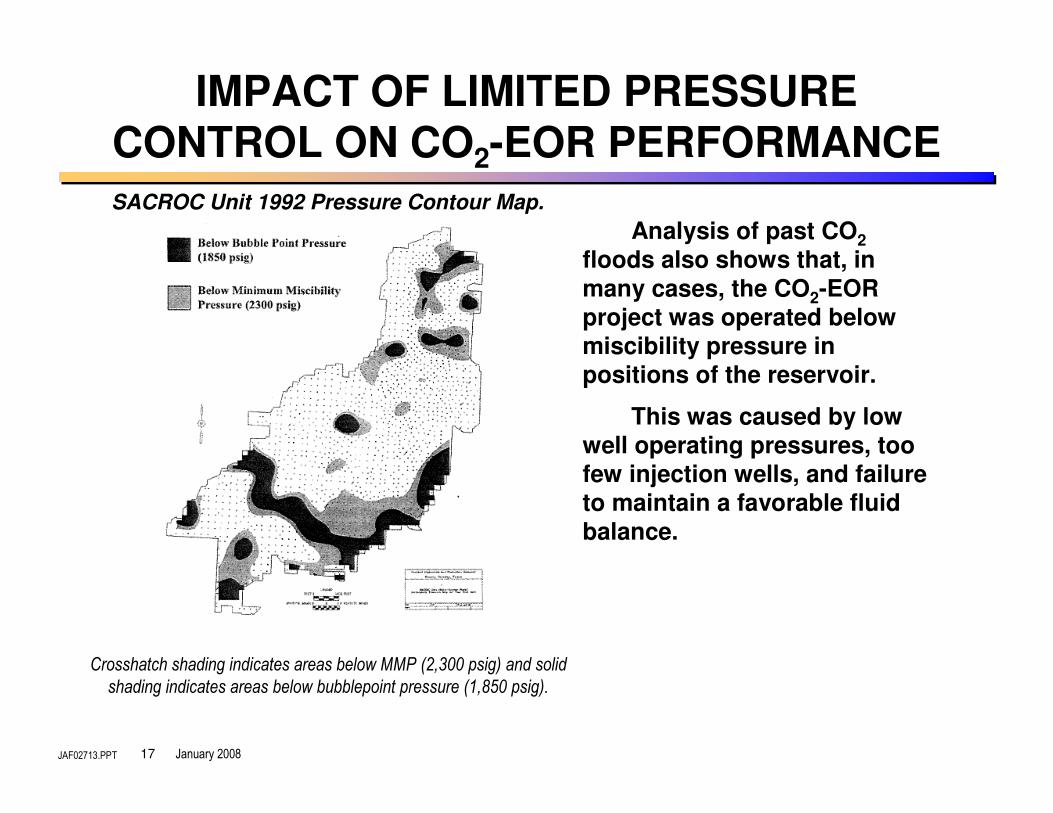
IMPACT OF LIMITED PRESSURE CONTROL ON CO2-EOR PERFORMANCE
Analysis of past CO2
floods also shows that, in
many cases, the CO2-EOR project was operated below miscibility pressure in positions of the reservoir.
This was caused by low well operating pressures, too few injection wells, and failure to maintain a favorable fluid
balance.
Crosshatch shading indicates areas below MMP (2,300 psig) and solid
shading indicates areas below bubblepoint pressure (1,850 psig).
SACROC Unit 1992 Pressure Contour Map.
JAF02713.PPT 18 January 2008
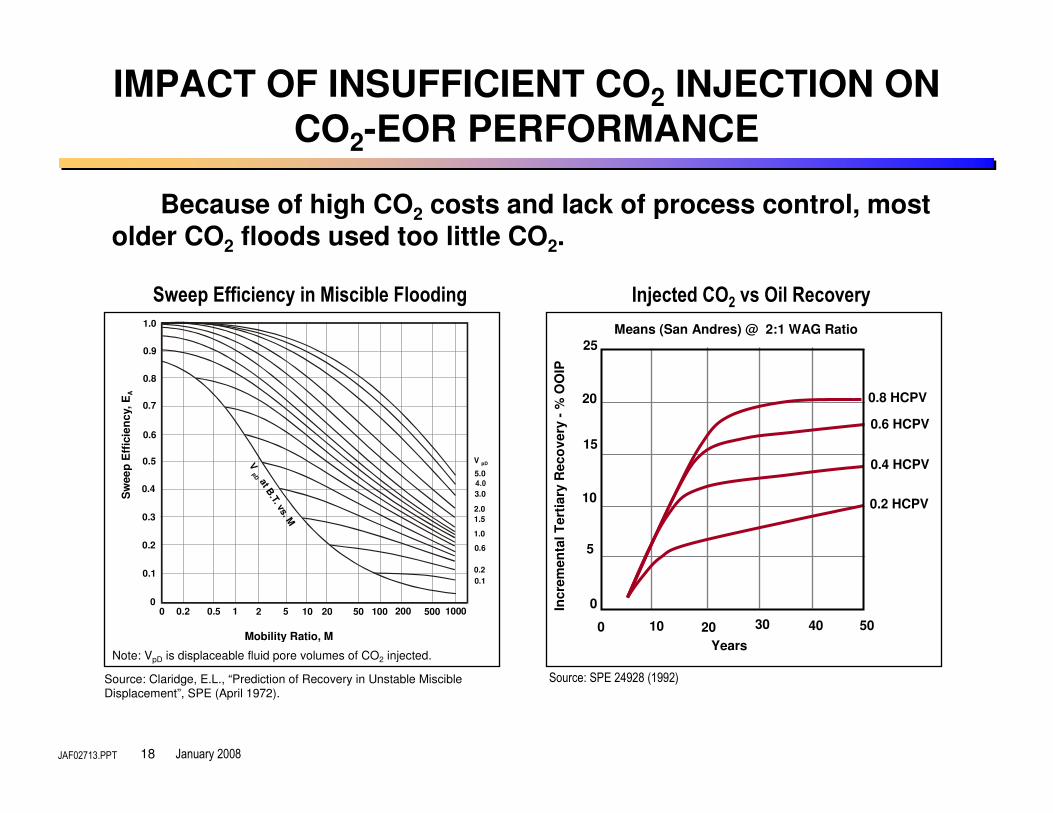
Means (San Andres) @ 2:1 WAG Ratio
IMPACT OF INSUFFICIENT CO2 INJECTION ON
CO2-EOR PERFORMANCE
Source: Claridge, E.L., “Prediction of Recovery in Unstable Miscible Displacement”, SPE (April 1972).
Note: VpD is displaceable fluid pore volumes of CO2 injected.
1.0
0.9
0.8
0.7
0.6
0.5
0.4
0.3
0.2
0.1
00.20 0.5 1 2 105 5020 200100 1000500
5.0
2.0
3.0
1.0
V pD
0.1
0.2
1.5
0.6
Sw
ee
p E
ffic
ien
cy,
EA
Mobility Ratio, M
V
at B.T. vs. M
pD
Injected CO2 vs Oil RecoverySweep Efficiency in Miscible Flooding
Source: SPE 24928 (1992)
Because of high CO2 costs and lack of process control, most older CO2 floods used too little CO2.
20
15
10
5
0
25
403020 50100
Years
Incre
men
tal T
ert
iary
Reco
very
-%
OO
IP
0.8 HCPV
0.6 HCPV
0.4 HCPV
0.2 HCPV
JAF02713.PPT 19 January 2008
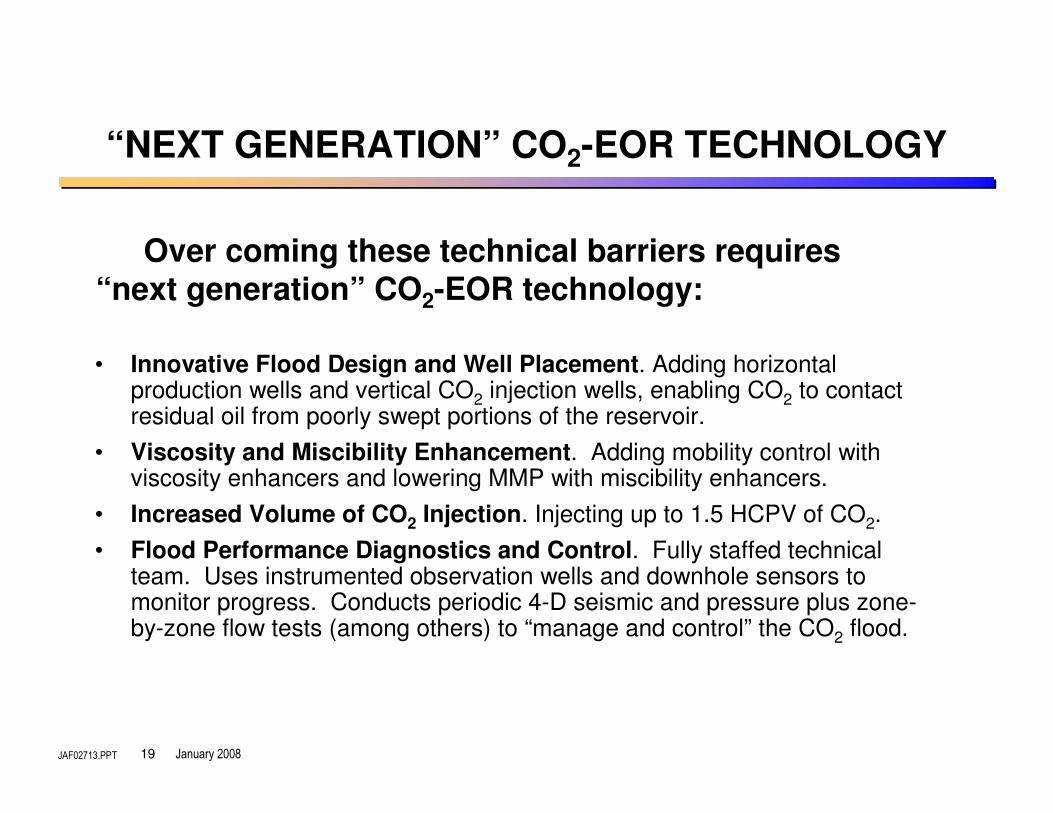
“NEXT GENERATION” CO2-EOR TECHNOLOGY
• Innovative Flood Design and Well Placement. Adding horizontal production wells and vertical CO2 injection wells, enabling CO2 to contact residual oil from poorly swept portions of the reservoir.
• Viscosity and Miscibility Enhancement. Adding mobility control with viscosity enhancers and lowering MMP with miscibility enhancers.
• Increased Volume of CO2 Injection. Injecting up to 1.5 HCPV of CO2.
• Flood Performance Diagnostics and Control. Fully staffed technical team. Uses instrumented observation wells and downhole sensors to monitor progress. Conducts periodic 4-D seismic and pressure plus zone-by-zone flow tests (among others) to “manage and control” the CO2 flood.
Over coming these technical barriers requires “next generation” CO2-EOR technology:
JAF02713.PPT 20 January 2008
“GAME CHANGER” CO2-EOR TECHNOLOGY (Cont’d)
• Reviews performance of past CO2-EOR floods.
• Sets forth theoretically and scientifically possible advances in technology for CO2-EOR.
• Examines how much “game changer” CO2-EOR technology would increase oil recovery and CO2
storage capacity.
The DOE report, “Evaluating the Potential for “Game Changer”Improvements in Oil Recovery Efficiency from CO2-Enhanced Oil Recovery”:
Available on the U.S. DOE web site. http://www.fe.doe.gov/programs/oilgas/publications/eor_co2/Game_Changer_Document.pdf
JAF02713.PPT 21 January 2008
Expanding CO2 Storage Capacity: A Case Study. Large Gulf Coast oil reservoir with 340 million barrels (OOIP) in the main pay zone.
• Primary/Secondary Oil Recovery: 153 million barrels (45% of OOIP)
• Main Pay Zone:
– Depth - - 14,000 feet
– Oil Gravity - - 33oAPI
– Porosity - - 29%
– Net Pay - - 325 feet
– Initial Pressure - - 6,620 psi
– Miscibility Pressure - - 3,250 psi
Theoretical CO2 storage capacity: 2,710 Bcf (143 million tonnes)
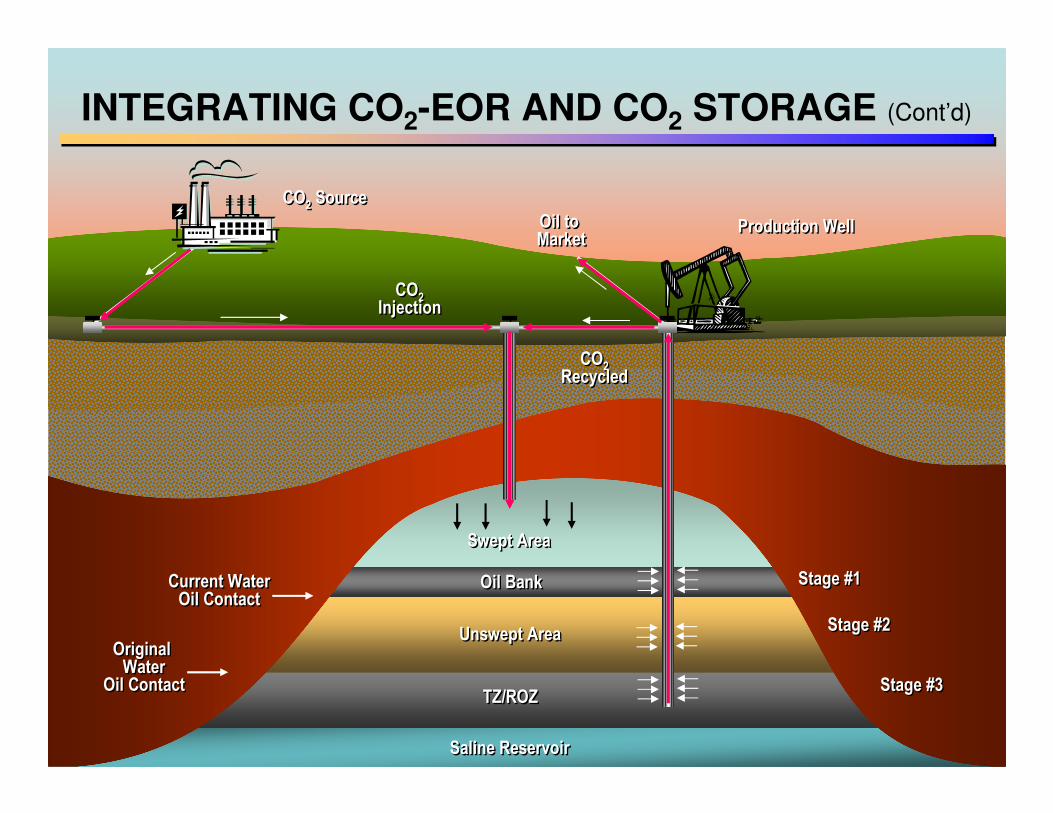
INTEGRATING CO2-EOR AND CO2 STORAGE
Another 100 million barrels (OIP) in the underlying 130 feet of residual oil zone and an underlying saline reservoir 195 feet thick.
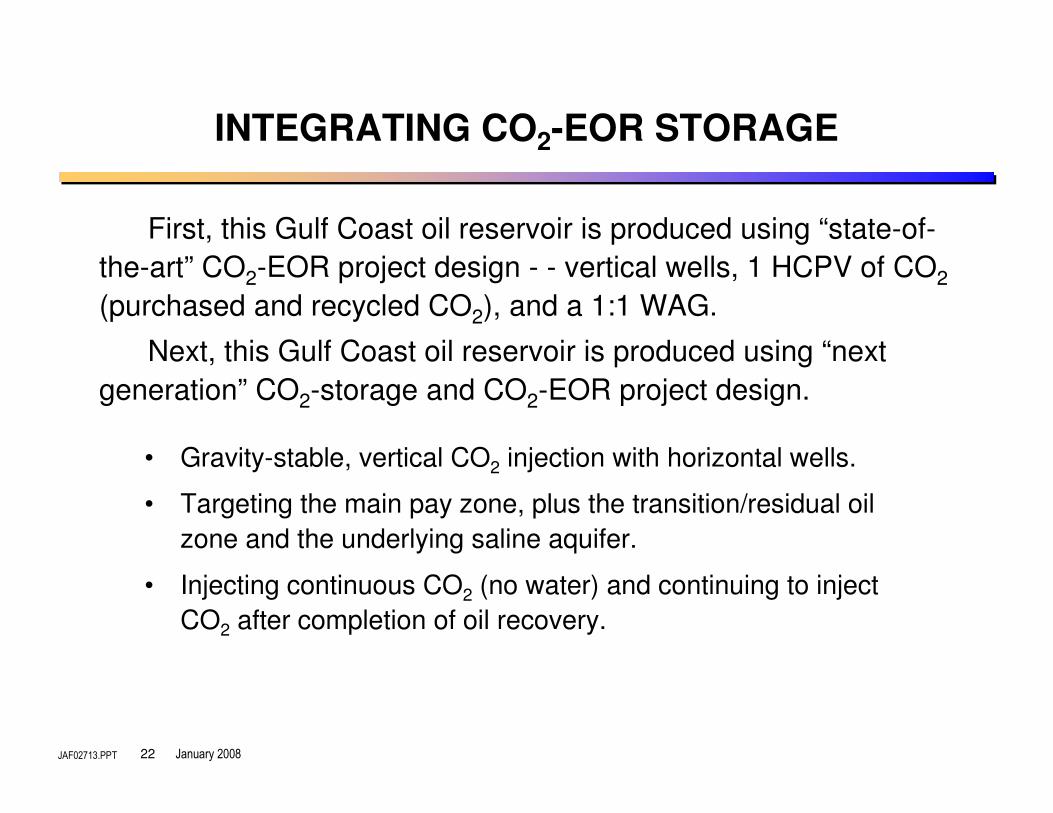
JAF02713.PPT 22 January 2008
INTEGRATING CO2-EOR STORAGE
First, this Gulf Coast oil reservoir is produced using “state-of-
the-art” CO2-EOR project design - - vertical wells, 1 HCPV of CO2
(purchased and recycled CO2), and a 1:1 WAG.
Next, this Gulf Coast oil reservoir is produced using “next
generation” CO2-storage and CO2-EOR project design.
• Gravity-stable, vertical CO2 injection with horizontal wells.
• Targeting the main pay zone, plus the transition/residual oil
zone and the underlying saline aquifer.
• Injecting continuous CO2 (no water) and continuing to inject
CO2 after completion of oil recovery.
JAF02713.PPT 23 January 2008
CO2InjectionCO2
Injection
CO2 SourceCO2 Source
Oil to MarketOil to Market
Production WellProduction Well
CO2RecycledCO2
Recycled
Current Water Oil Contact
Current Water Oil Contact
Original Water
Oil Contact
Original Water
Oil Contact
Stage #1Stage #1
Stage #2Stage #2
Stage #3Stage #3TZ/ROZTZ/ROZ
Unswept AreaUnswept Area
Oil BankOil Bank
Swept AreaSwept Area
INTEGRATING CO2-EOR AND CO2 STORAGE (Cont’d)
Saline ReservoirSaline Reservoir
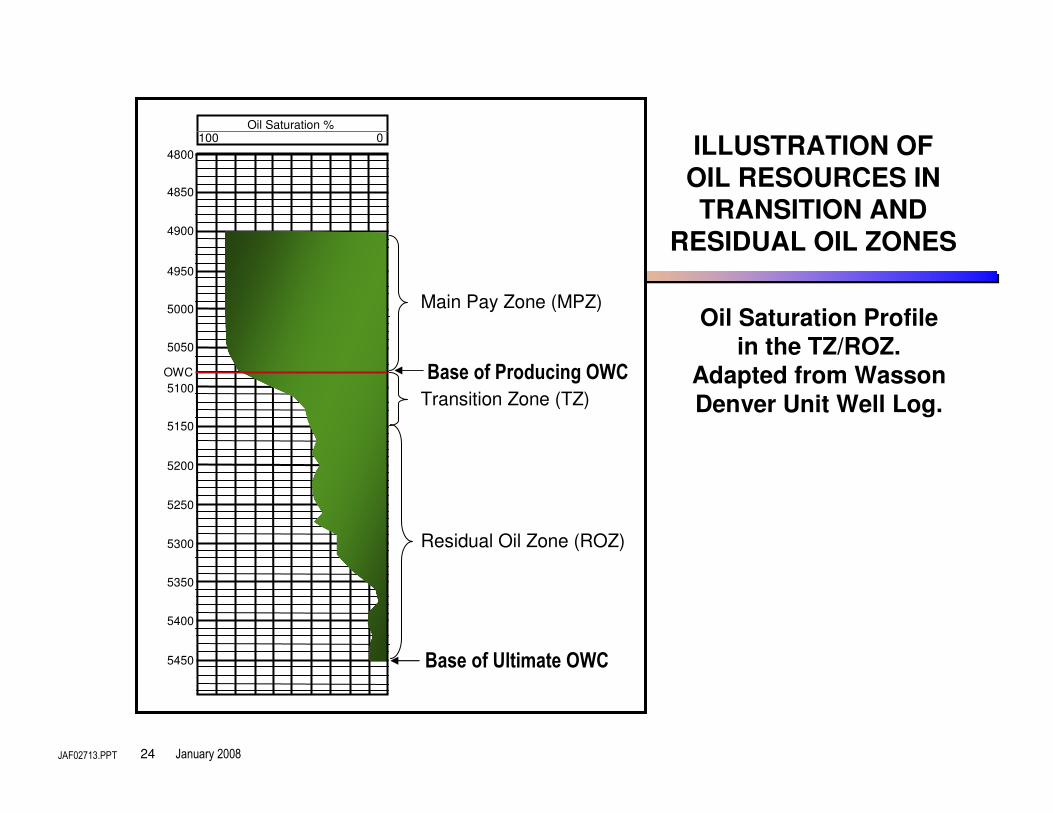
JAF02713.PPT 24 January 2008
ILLUSTRATION OFOIL RESOURCES IN TRANSITION AND
RESIDUAL OIL ZONES
Oil Saturation Profile in the TZ/ROZ.
Adapted from Wasson
Denver Unit Well Log.
Main Pay Zone (MPZ)
Transition Zone (TZ)
Residual Oil Zone (ROZ)
Base of Ultimate OWC
Base of Producing OWC
4900
4950
4800
4850
5000
5050
5400
5350
5300
5250
5200
5150
5100
5450
OWC
100 0Oil Saturation %
JAF02713.PPT 25 January 2008
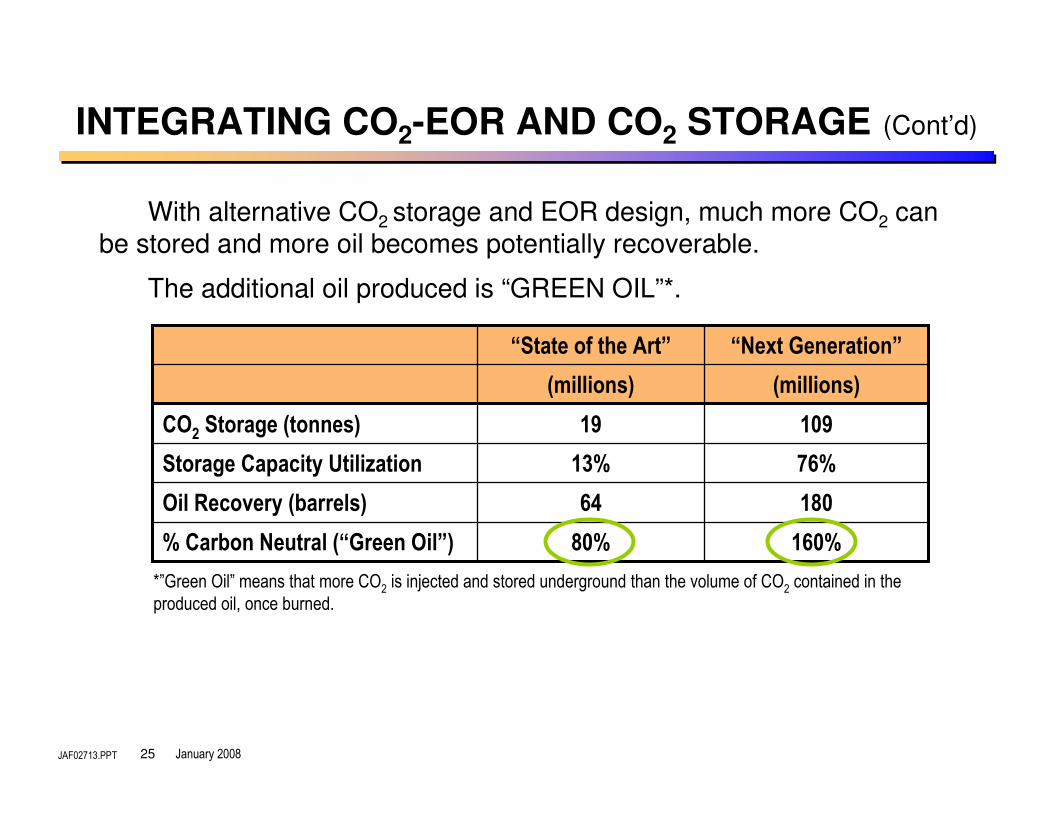
With alternative CO2 storage and EOR design, much more CO2 can be stored and more oil becomes potentially recoverable.
The additional oil produced is “GREEN OIL”*.
18064Oil Recovery (barrels)
76%13%Storage Capacity Utilization
160%80%% Carbon Neutral (“Green Oil”)
10919CO2 Storage (tonnes)
(millions)(millions)
“Next Generation”“State of the Art”
INTEGRATING CO2-EOR AND CO2 STORAGE (Cont’d)
*”Green Oil” means that more CO2 is injected and stored underground than the volume of CO2 contained in the produced oil, once burned.
JAF02713.PPT 26 January 2008
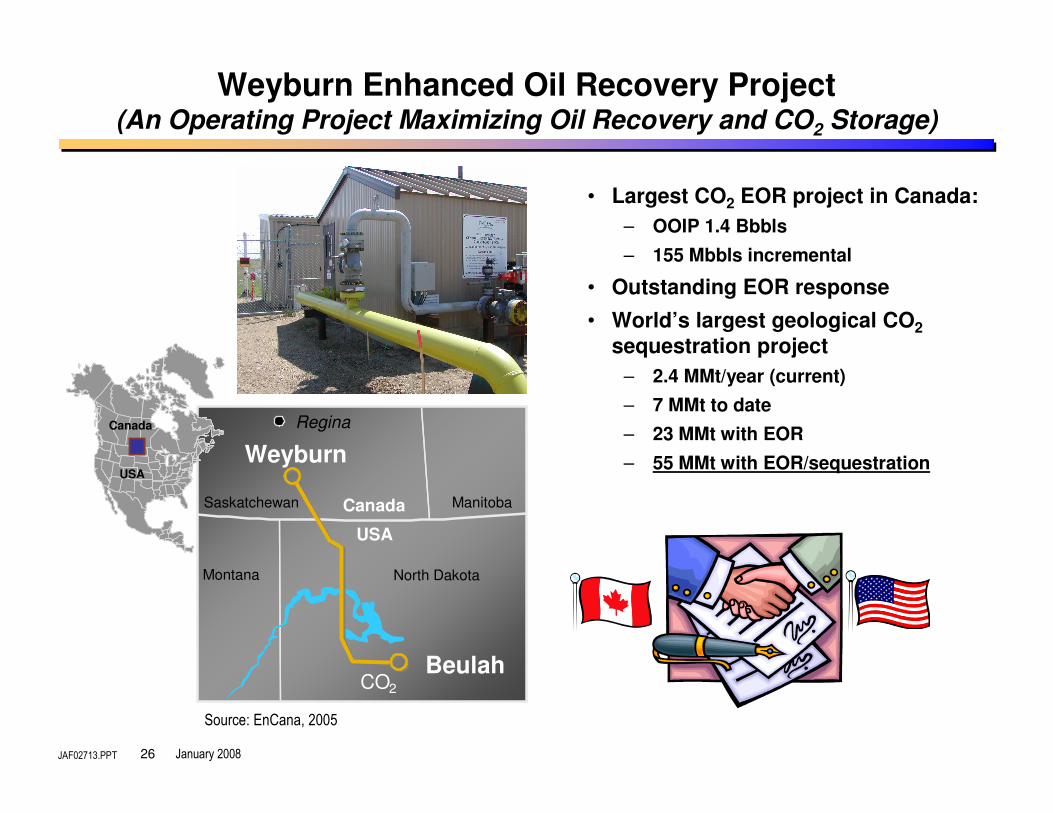
Weyburn Enhanced Oil Recovery Project(An Operating Project Maximizing Oil Recovery and CO2 Storage)
• Largest CO2 EOR project in Canada:
– OOIP 1.4 Bbbls
– 155 Mbbls incremental
• Outstanding EOR response
• World’s largest geological CO2
sequestration project
– 2.4 MMt/year (current)
– 7 MMt to date
– 23 MMt with EOR
– 55 MMt with EOR/sequestration
Regina
Weyburn
CO2
Beulah
North Dakota
Saskatchewan
Montana
ManitobaCanada
USA
Canada
USA
Source: EnCana, 2005
JAF02713.PPT 27 January 2008
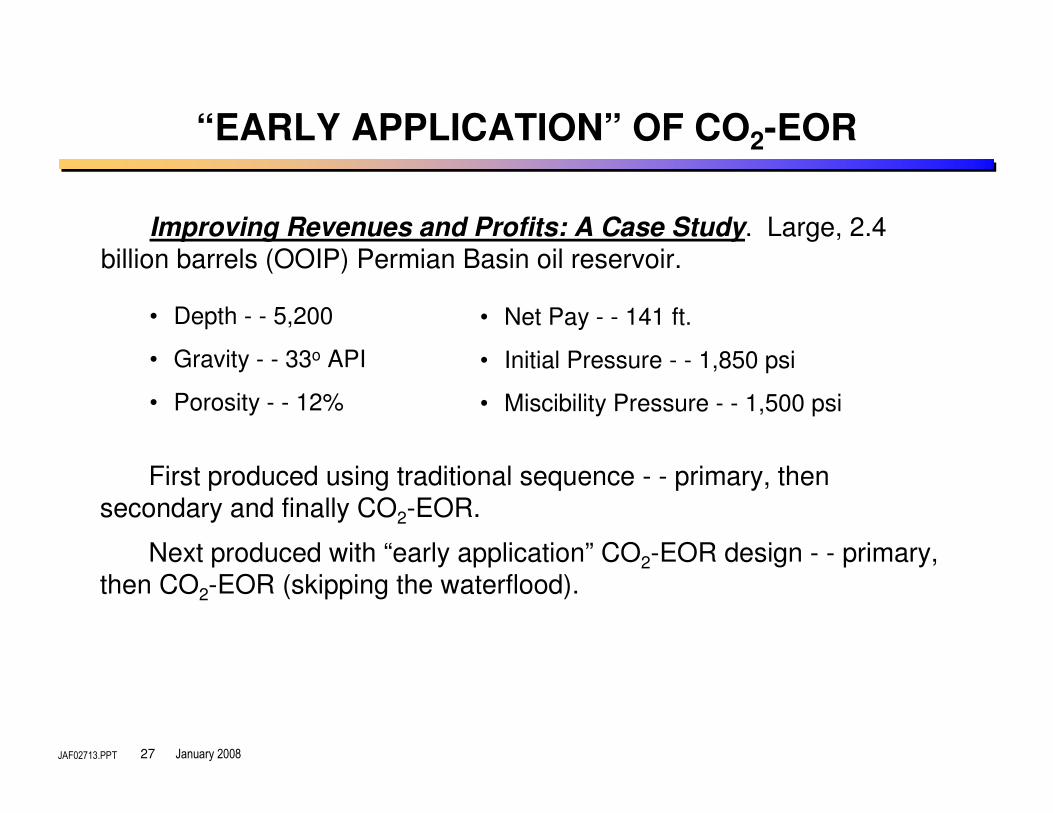
“EARLY APPLICATION” OF CO2-EOR
Improving Revenues and Profits: A Case Study. Large, 2.4 billion barrels (OOIP) Permian Basin oil reservoir.
First produced using traditional sequence - - primary, then secondary and finally CO2-EOR.
Next produced with “early application” CO2-EOR design - - primary, then CO2-EOR (skipping the waterflood).
• Depth - - 5,200
• Gravity - - 33o API
• Porosity - - 12%
• Net Pay - - 141 ft.
• Initial Pressure - - 1,850 psi
• Miscibility Pressure - - 1,500 psi
JAF02713.PPT 28 January 2008
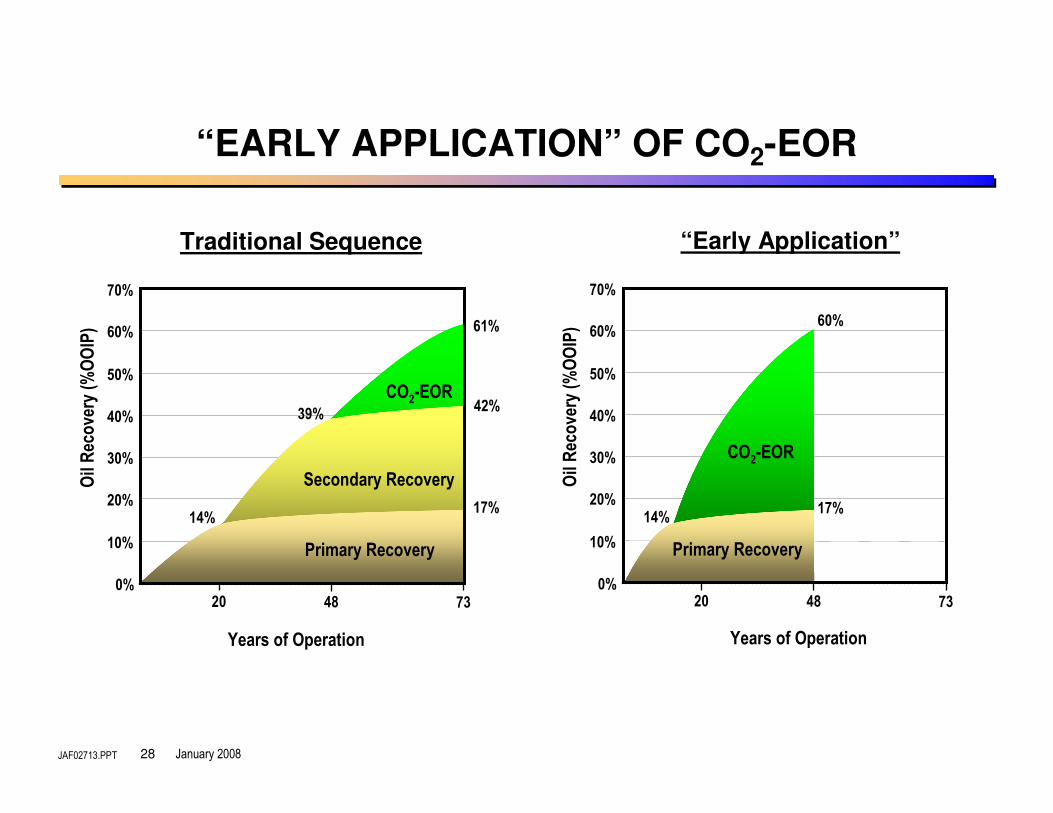
“EARLY APPLICATION” OF CO2-EOR
Traditional Sequence “Early Application”
0%
10%
20%
30%
40%
50%
60%
70%
4820 73
Years of Operation
Oil Recovery (%OOIP)
17%
61%
14%
39%
Primary Recovery
Secondary Recovery
CO2-EOR42%
0%
10%
20%
30%
40%
50%
60%
70%
4820 73
Oil Recovery (%OOIP)
17%
60%
14%
Primary Recovery
CO2-EOR
Years of Operation
JAF02713.PPT 29 January 2008
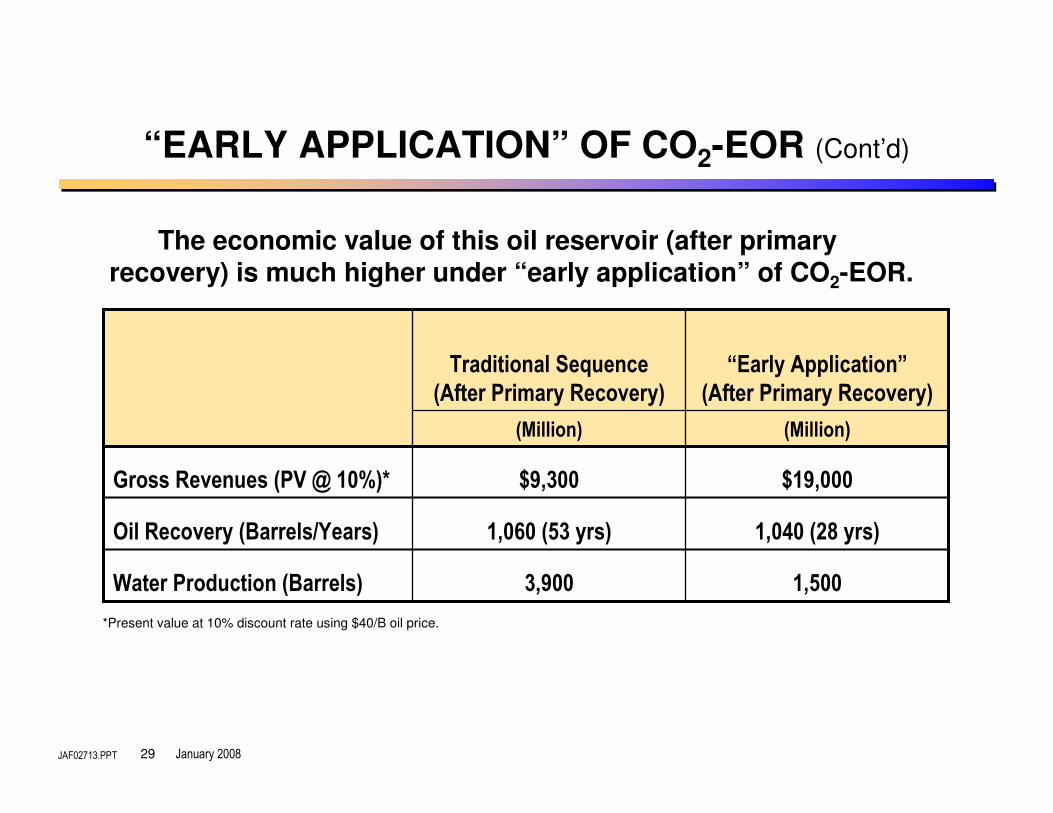
“EARLY APPLICATION” OF CO2-EOR (Cont’d)
The economic value of this oil reservoir (after primary recovery) is much higher under “early application” of CO2-EOR.
*Present value at 10% discount rate using $40/B oil price.
JAF02713.PPT 30 January 2008
SUMMARY
1. CO2 enhanced oil recovery, while still an emerging industry, has the potential to add significant volumes of future oil supply, in the U.S. and worldwide.
2. Thirty years of experience shows that CO2-EOR is a technically sophisticated and challenging process, but one that can be successful if “managed and controlled”, not just “operated”.
3. “Game Changer” CO2-EOR technologies, incorporating scientifically possible but not yet fully developed advances, could significantly increase oil recovery efficiency.
JAF02713.PPT 31 January 2008
SUMMARY (Cont’d)
4. “Early application” of CO2-EOR technology can significantly increase the economic value of the remaining oil resource.
5. Wide-scale application of CO2-EOR is constrained by lack of sufficient “EOR-Ready” CO2 supplies. A mutually beneficial link exists between CO2-EOR and new industrial sources of CO2.
6. Under a “carbon constrained world”, productively using industrial CO2 emissions for CO2-EOR will become a winning strategy.