Page 1
Maximizing SCM Content of Blended Cements
John Guynn John Kline President, Roman Cement, LLC Principal, Kline Consulting, LLC
1475 Princeton, Ave. 1887 Nottingham Road
Salt lake City, UT 84105 Allentown, PA, USA 18103
[email protected] [email protected]
Abstract - Today Portland cement substitutes known as supplementary cementitious materials or SCMs are used to improve the
performance while reducing the environmental footprint of concrete. There are several factors that impact the amount of SCMs that can
be added to concrete while maintaining its basic integrity. This paper describes a newly developed framework for optimizing the
substitution of cement with SCMs in concrete. This framework has been developed based on recent testing results and clearly indicates
that paying close attention to cement and SCM particle size distributions and the corresponding packing density of the combined
ingredients will allow for an optimization of the cement and SCMs in concrete. This framework has been developed on the basis of
several independent laboratory studies and can be adapted as a base for evaluating and optimizing any combination of cement and SCMs.
The means to produce cement / SCM blends with the optimized particle size distributions with existing equipment configurations are also
explored.
I. INTRODUCTION
Concrete is the most widely used commodity in the world after water and is being used in ever-increasing amounts,
particularly in developing countries to build infrastructure. The production of Portland cement – the main strength producing
component of concrete – has increased proportionately and dramatically to meet demand. The cement industry today generates
approximately 5% of the anthropogenic CO2 emissions worldwide. Companies around the world are looking for means to
reduce the carbon footprint of concrete and cement. The best way to improve concrete’s carbon footprint is to make it with
less Portland cement. Substituting Portland cement with supplementary cementitious materials (SCMs) is one means.
Common SCMs include fly ash, slags, and natural pozzolans. Fly ash is a waste product from coal combustion, typically
from coal fired power plants. Slags are waste products from metal production, e.g., iron and steel. Natural pozzolans are found in nature as volcanic ashes, but can also be manufactured by calcining clays and shales. These SCMs are often classified
together as “pozzolans” because they include amorphous silica that reacts with excess lime released during Portland cement
hydration. Limestone can also be used as a partial cement substitute. The higher the level of SCMs contained in the blended
cement and corresponding concrete, the better from both a cost and carbon footprint perspective.
Blended cements offer several advantages over pure Portland cements when making concrete:
They can achieve similar or superior structural integrity;
Have a lower carbon footprint;
Can be more cost effective to produce; and
Can utilize waste material streams from other industries.
The authors propose that SCMs can be most effectively used as cement substitutes when the particle size distributions (PSDs) of the cement and SCM fractions are optimized to complement each other. This paper describes the means to increase
the content of SCMs in blended cements and concrete, including: (1) a simple analytical framework for predicting permissible SCM replacement levels; (2) case studies that validate the analytical framework; and (3) industrially feasible manufacturing
systems for making optimized blended cements.
Ordinary Portland cement (OPC) is made up of finely ground calcium silicate particles. These particles react with water to
form calcium silicate hydrates (hydration reactions) which interlock providing concrete its strength. Cement needs to be
ground fine enough to allow the majority of the cement particles to fully react. Today cement is ground in various types of
mills and size classified primarily with dynamic air separators giving a typical PSD as shown in Fig. 2. SCMs are usually
processed for use in concrete through the same means, and usually have PSDs similar to Portland cement.
Page 1 of 15
978-1-4799-5580-0/14/$31.00 © 2015 IEEE
2015-CIC-0004
Page 2
The water demand, or more simply, the water content of concrete is expressed as a unitless weight fraction (w/c) which is
the weight of water divided by the weight of cement. When SCMs are added to the Portland cement, the water content of the
concrete is adjusted to include the SCMs (w/cm), that is the weight of water per weight of cementitious materials (Portland
cement plus SCMs).
Water serves a dual purpose in concrete, it is a necessary ingredient in the hydration reactions but also acts as a lubricant
that separates the particles in concrete and allows the fresh concrete to flow. The required flowability of concrete usually
determines the amount of water that is used. Excess water, required only for flow, does not react and remains as small water
pockets in the concrete. These water pockets create voids in the concrete and can reduce its strength and durability.
The foregoing principles are often in conflict and cannot be satisfied simultaneously. For example, increasing cement
fineness simultaneously increases reactivity and water demand, which have opposite effects on concrete strength. This is
equally true for OPC as it is for blended cements. Therefore there is an inherent contradiction between grinding cement finer
(which requires more water for coating and lubricating the cement particles) and controlling the water content of the concrete
to maximize strength.
Recent studies involving independent particle size selection of cement and SCMs allow us to break this contradiction. The
PSDs of the cement and SCMs blends are adjusted to maximize the particle packing density. This minimizes the void volume
in the blended cement, thus requiring less water for flow. If in addition, a portion of the very fine cement particles are replaced
with very fine SCM particles, cement flocculation is decreased which lowers water demand further. Reducing the water
demand of the concrete produces denser, less porous, and stronger concrete. Both also provide the additional benefits of
reduced shrinkage and ion permeability, which further enhances concrete strength and durability.
Particle size distributions that maximize packing densities are defined mathematically by a Fuller distribution. This is an
idealized mathematical particle size distribution model that is applicable to all particles in concrete, in which smaller particles
fill the voids around and between larger particles. The Fuller distribution is defined by (1), where D represents the maximum
particle size in the mixture and Pi represents the percentage of particles finer than size di. A typical value for the exponent n is
0.45. The equation is dimensionless.
(1)
The Fuller distribution is a theoretical, or ideal, particle size distribution that provides dense packing of particles and is also
used for aggregate sizing in concrete.
II. ANALYTICAL FRAMEWORK
The framework developed for predicting permissible SCM replacement levels was derived from empirical strength data
across a wide range of SCM substitution levels. The simplified analytical framework includes: (1) three fundamental design
principles; (2) a procedure to develop an optimization score; and (3) a method for predicting permissible SCM replacement
levels. A “permissible” SCM replacement level for a blended cement means the blended cement will reliably provide adequate
strength, acceptable water demand, and other performance criteria based on predetermined standards. Certain concrete
applications may require different performance criteria, in these cases the framework may need to be adjusted for those specific
situations.
A. Three Fundamental Design Principles
The three fundamental design principles are:
1. Maintain a broad particle size distribution (PSD) (e.g., a Fuller distribution);
2. Minimize the quantity of coarse Portland cement particles (>24 µm); and
Page 2 of 15
978-1-4799-5580-0/14/$31.00 © 2015 IEEE
2015-CIC-0004
Page 3
3. Minimize the quantity of overly fine Portland cement particles (<8 µm).
Large Portland cement particles (> 24 µm) do not fully hydrate within a specified time duration (e.g., 91 days) and
essentially become “wasted cement”. On the other hand, fine Portland cement particles increase water demand as a result of
excessive surface area and flocculation without providing a corresponding strength increase. Nevertheless, a broad particle
size distribution including coarse (>24 µm) and fine (<8 µm) particles, as defined by the Fuller distribution, is required to
maximize particle packing density. Therefore, a well-optimized blend will have a minimum amount of improperly sized
cement particles (provided by a narrow PSD cement). The blend would also include fine and coarse SCM particles to improve
the packing density according to the Fuller distribution, ensuring a low water demand.
B. Obtaining an Optimization Score Using The Three Fundamental Design Principles
The authors found, based on an analysis of empirical data, that the three fundamental design principles were not equal in
effect and have therefore been weighted as follows:
Principle 1, Maintain a broad particle size distribution – 1.5 (maximum score)
Principle 2, Minimize oversized cement particles – 1.5 (maximum score)
Principle 3, Minimize undersized cement particles – 1.0 (maximum score)
In the following discussions, cement blends in compliance with a given design principle are awarded the maximum score.
Cement blends in violation of a given design principle are awarded a score of “zero”. Cement blends in partial compliance
with a given design principle are awarded a partial score between zero and the maximum score. The optimization score for a
blended cement is the sum of all three scores. As shown by the case studies and other empirical data, the optimization score is
easy to determine and fairly accurate. Increasing scores indicate the ability to substitute more SCMs for ordinary Portland
cement.
The data also demonstrates that the optimization score is largely independent of the type of SCM that is utilized and
therefore very robust as a predictive tool. The following case studies indicate that blended cements in compliance with all
three fundamental design principles produced similar compressive and flexural strengths when using various combinations of
SCMs. This is particularly surprising since the SCMs utilized (GGBFS, Class F fly ash, steel slag, and limestone) have very
different chemistries and reactivities. The work in this paper is based primarily on optimizing blends of cement and SCMs to
obtain equivalent strengths in concrete. Other properties of the concrete such as sulfate resistance and freeze thaw durability
are believed to be improved through this optimization process; however, specific performance requirements will need to be
taken into account by the practitioner as well.
C. Predicting Permissible SCM Replacement Levels Using the Optimization Score
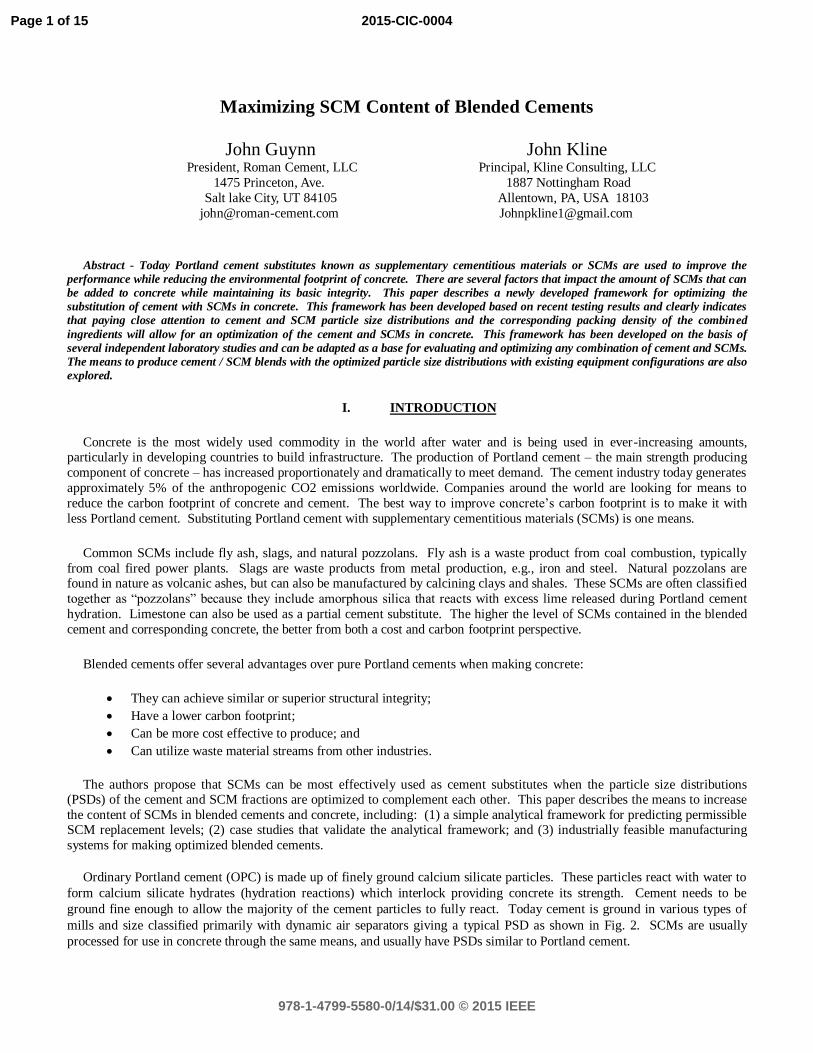
The permissible SCM replacement level for a blended cement can be fairly accurately estimated by comparing its
optimization score with optimization scores for the blended cements in the case studies below. Fig. 1. demonstrates how the 4
case study results, with SCM replacement levels of 20%, 35%, 55%, and 75% respectively, compare to their optimization
scores. Pure, 100% ordinary Portland cement (OPC) is used as the baseline (0% SCM replacement) with an optimization score
of 1 as explained below.
Page 3 of 15
978-1-4799-5580-0/14/$31.00 © 2015 IEEE
2015-CIC-0004
Page 4
Fig. 1. Comparison of optimization scores and achievable SCM substitution rates
III. CASE STUDY COMPARISONS
A. Base Case - Ordinary Portland Cement (Optimization Score of 1.0)
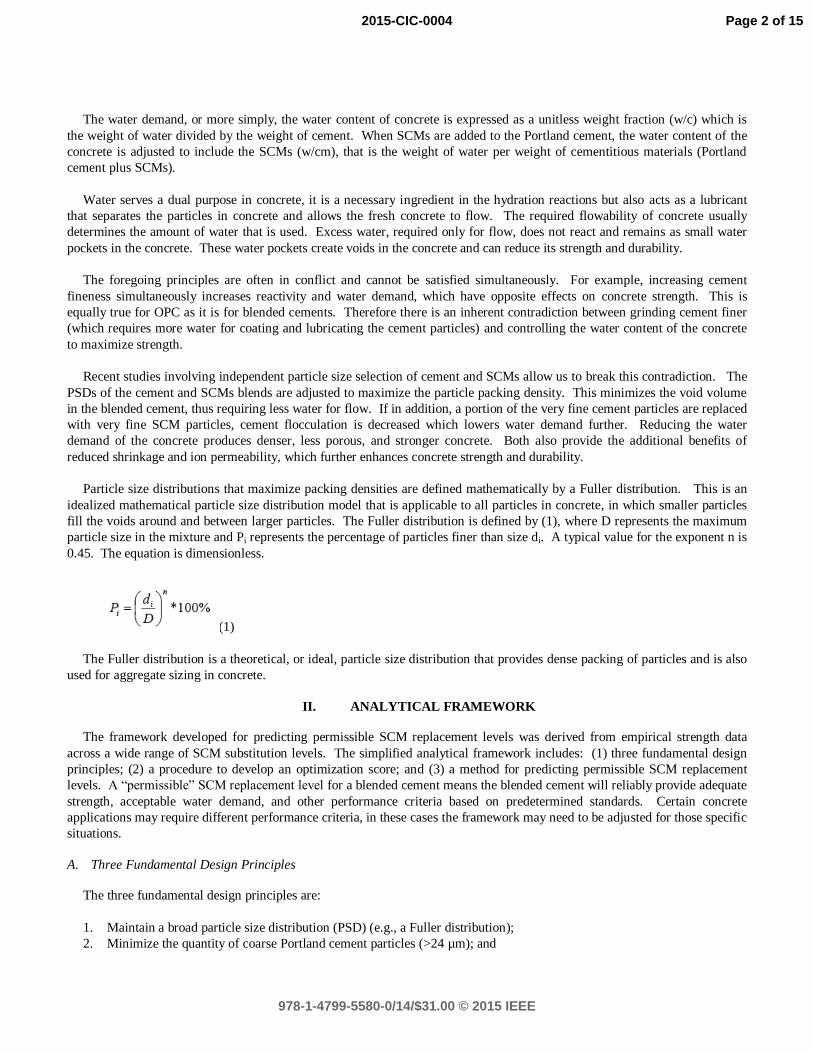
At one end of the spectrum, a typical OPC (Type I-II) is represented by the PSD chart in Fig 2. This OPC has a d90 (90%
of particles less than) 40-45 µm, a d10 (10% of particles less than) 1-2 µm, and a PSD narrower than a Fuller distribution.
Fuller distributions for cement particles are difficult to obtain using conventional classification techniques typical to cement
manufacture.
Fig. 2. A typical particle size distribution chart for ordinary Portland cement (OPC)
The typical OPC, as illustrated in Fig. 2., is in substantial (but not total) compliance with Principle 3 because the PSD,
though broad, is narrower than a Fuller distribution. This OPC violates Principles 2 and 3 because the yellow shaded area
0
10
20
30
40
50
60
70
80
1 2 3 4
SCM
Su
bst
itu
tio
n %
Optimization Score
Page 4 of 15
978-1-4799-5580-0/14/$31.00 © 2015 IEEE
2015-CIC-0004
Page 5
(particles <8 µm) and pink shaded area (particles >24 µm) consist entirely of Portland cement particles. Thus, its optimization
score is estimated by the authors to be 1.0 (1.0 + 0.0 + 0.0). The low optimization score may explain why simple blended
cements consisting of OPC and separately processed SCM can show a drop in strength, particularly early strength, when
compared to 100% OPC at even modest substitutions in OPC of 15-25%. For this reason it is customary to increase the total
binder content in concrete to make up for the drop in strength (e.g., 500 lbs. of 100% OPC in a cubic yard of concrete might be
replaced with 600 lbs. of blended cement consisting of 450 lbs. of OPC and 150 lbs. of fly ash).
B. Case Study 1 - 80% Cement / 20% SCM Blend (Optimization Score of 2.0)
A first binary blended cement of the case studies with 80% Portland cement and 20% SCM was made using a fine cement
and a coarse fly ash fraction represented by the two PSD charts in Fig. 3. & 4.
Fig. 3. Fine OPC particle size distributions for 80/20 blended cements
Fig. 4. Coarse flyash particle size distributions for 80/20 blended cements
This first binary blend is in substantial, but not total, compliance with Principle 2 due to the smaller but significant fraction
of coarse cement particles (>24 µm) in the shaded purple area. It violates Principle 3 due to the large amount of very fine
cement particles (<8 µm) in the shaded yellow area; and substantially, but not entirely, complies with Principle 1 because the
coarse fly ash particles in the shaded purple area broadens the overall PSD of the blend, but not to the extent of a Fuller
distribution. The estimated score is 2.0 (1.0 + 1.0 + 0.0), which explains why this binary blend had similar strength at all ages 4
0
1
2
3
4
5
6
0.1 1 10 100
Dif
fere
nti
al
[%]
Size [µm]
Original
D90-24.3
D90-12.1
D90-10.8
D90-8.6
Figure 1. Particle size distributions of the five cements shown as probability density
functions. Each curve is the average of six individual measurements and the error bars
(one standard deviation) would fall within the size of the shown symbols.
0
1
2
3
4
5
6
7
0.1 1 10 100 1000
Dif
fere
nti
al
[%]
Size [µm]
Original
D10-14.8
D10-13.0
D10-10.8
D10-4.2
Figure 2. Particle size distributions of the five Class F fly ashes shown as probability
distribution functions. Each curve is the average of six individual measurements and the
error bars (one standard deviation) would fall within the size of the shown symbols.
Page 5 of 15
978-1-4799-5580-0/14/$31.00 © 2015 IEEE
2015-CIC-0004
Page 6
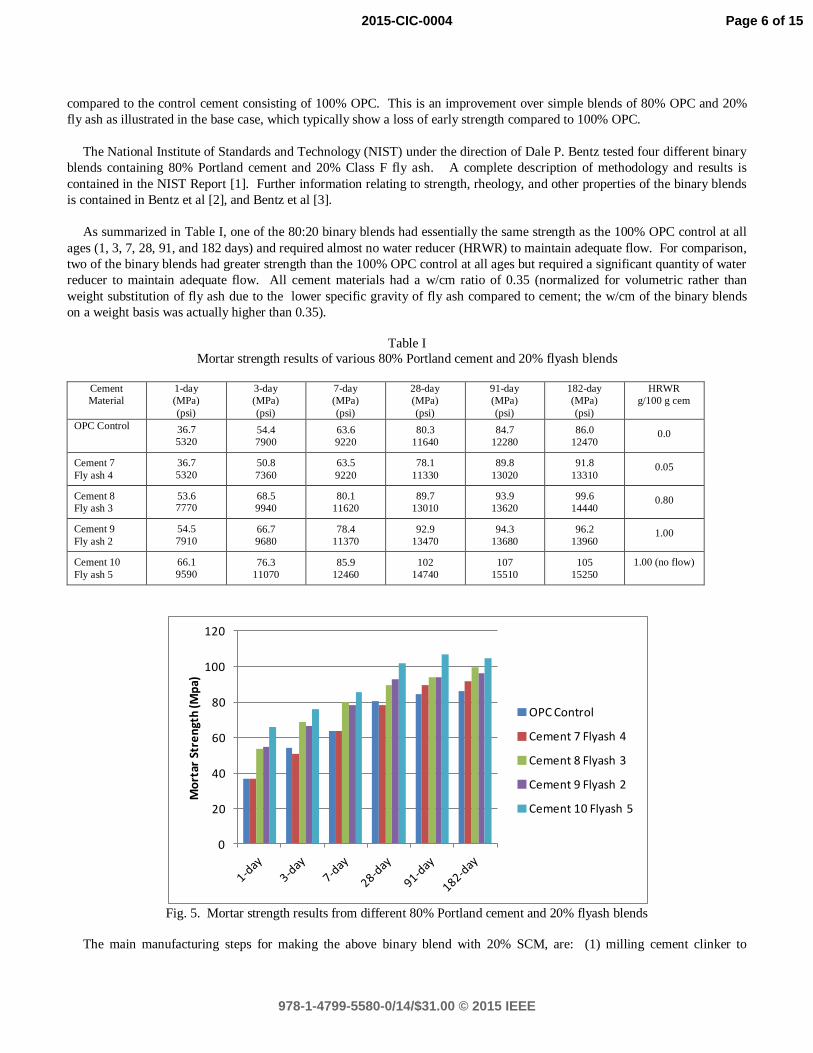
compared to the control cement consisting of 100% OPC. This is an improvement over simple blends of 80% OPC and 20%
fly ash as illustrated in the base case, which typically show a loss of early strength compared to 100% OPC.
The National Institute of Standards and Technology (NIST) under the direction of Dale P. Bentz tested four different binary
blends containing 80% Portland cement and 20% Class F fly ash. A complete description of methodology and results is
contained in the NIST Report [1]. Further information relating to strength, rheology, and other properties of the binary blends
is contained in Bentz et al [2], and Bentz et al [3].
As summarized in Table I, one of the 80:20 binary blends had essentially the same strength as the 100% OPC control at all
ages (1, 3, 7, 28, 91, and 182 days) and required almost no water reducer (HRWR) to maintain adequate flow. For comparison,
two of the binary blends had greater strength than the 100% OPC control at all ages but required a significant quantity of water
reducer to maintain adequate flow. All cement materials had a w/cm ratio of 0.35 (normalized for volumetric rather than
weight substitution of fly ash due to the lower specific gravity of fly ash compared to cement; the w/cm of the binary blends
on a weight basis was actually higher than 0.35).
Table I
Mortar strength results of various 80% Portland cement and 20% flyash blends
Cement
Material
1-day
(MPa)
(psi)
3-day
(MPa)
(psi)
7-day
(MPa)
(psi)
28-day
(MPa)
(psi)
91-day
(MPa)
(psi)
182-day
(MPa)
(psi)
HRWR
g/100 g cem
OPC Control 36.7
5320 54.4
7900
63.6
9220
80.3
11640
84.7
12280
86.0
12470 0.0
Cement 7
Fly ash 4
36.7
5320
50.8
7360
63.5
9220
78.1
11330
89.8
13020
91.8
13310 0.05
Cement 8
Fly ash 3
53.6 7770
68.5
9940
80.1
11620
89.7
13010
93.9
13620
99.6
14440 0.80
Cement 9
Fly ash 2
54.5
7910 66.7
9680
78.4
11370
92.9
13470
94.3
13680
96.2
13960 1.00
Cement 10
Fly ash 5
66.1
9590 76.3
11070
85.9
12460
102
14740
107
15510
105
15250
1.00 (no flow)
Fig. 5. Mortar strength results from different 80% Portland cement and 20% flyash blends
The main manufacturing steps for making the above binary blend with 20% SCM, are: (1) milling cement clinker to
0
20
40
60
80
100
120
Mo
rtar
Str
en
gth
(Mp
a)
OPC Control
Cement 7 Flyash 4
Cement 8 Flyash 3
Cement 9 Flyash 2
Cement 10 Flyash 5
Page 6 of 15
978-1-4799-5580-0/14/$31.00 © 2015 IEEE
2015-CIC-0004
Page 7
provide a fine cement fraction with a desired d90 (e.g., 10-20 µm) using known mills, such as a ball mill, vertical roller mill, or
roll press; (2) milling and/or classifying one or more SCMs to provide a coarse SCM fraction with a desired d10 (e.g., 5-20
µm); and (3) blending the fine cement and coarse SCM fractions prior to use in concrete.
C. Case Study 2 - 65% Cement / 35% SCM (Optimization Score of 2.5)
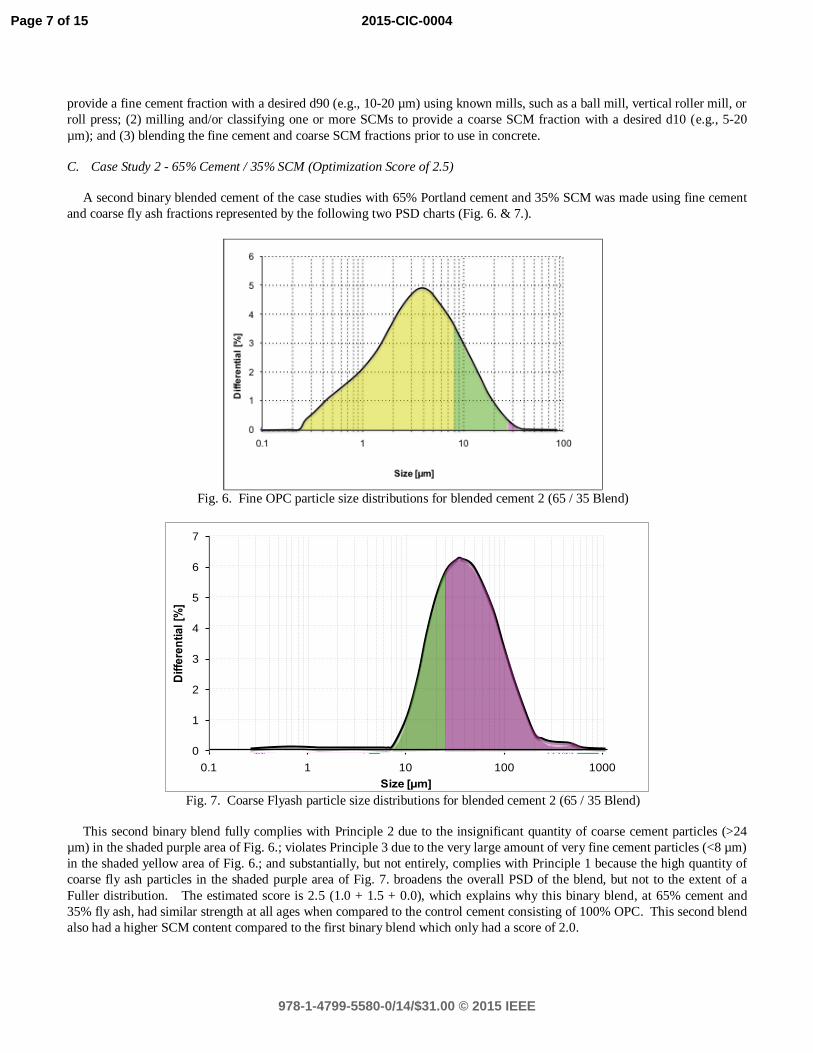
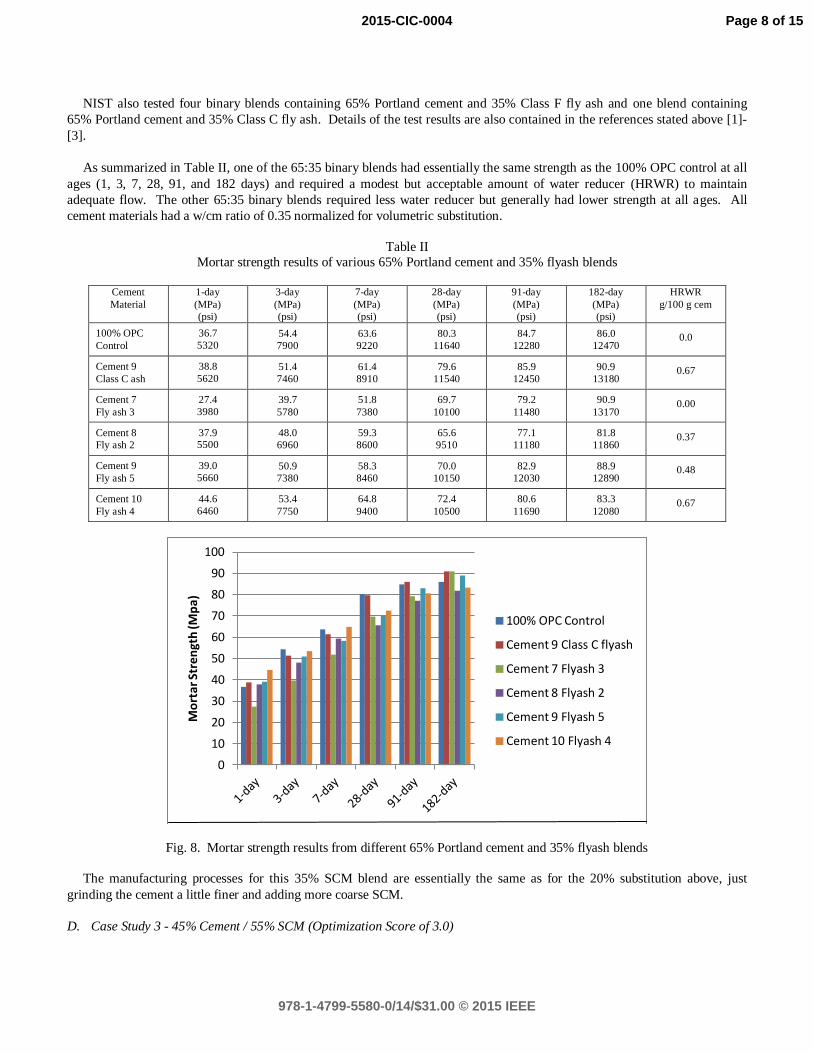
A second binary blended cement of the case studies with 65% Portland cement and 35% SCM was made using fine cement
and coarse fly ash fractions represented by the following two PSD charts (Fig. 6. & 7.).
Fig. 6. Fine OPC particle size distributions for blended cement 2 (65 / 35 Blend)
Fig. 7. Coarse Flyash particle size distributions for blended cement 2 (65 / 35 Blend)
This second binary blend fully complies with Principle 2 due to the insignificant quantity of coarse cement particles (>24
µm) in the shaded purple area of Fig. 6.; violates Principle 3 due to the very large amount of very fine cement particles (<8 µm)
in the shaded yellow area of Fig. 6.; and substantially, but not entirely, complies with Principle 1 because the high quantity of
coarse fly ash particles in the shaded purple area of Fig. 7. broadens the overall PSD of the blend, but not to the extent of a
Fuller distribution. The estimated score is 2.5 (1.0 + 1.5 + 0.0), which explains why this binary blend, at 65% cement and
35% fly ash, had similar strength at all ages when compared to the control cement consisting of 100% OPC. This second blend
also had a higher SCM content compared to the first binary blend which only had a score of 2.0.
4
0
1
2
3
4
5
6
0.1 1 10 100
Dif
fere
nti
al
[%]
Size [µm]
Original
D90-24.3
D90-12.1
D90-10.8
D90-8.6
Figure 1. Particle size distributions of the five cements shown as probability density
functions. Each curve is the average of six individual measurements and the error bars
(one standard deviation) would fall within the size of the shown symbols.
0
1
2
3
4
5
6
7
0.1 1 10 100 1000
Dif
fere
nti
al
[%]
Size [µm]
Original
D10-14.8
D10-13.0
D10-10.8
D10-4.2
Figure 2. Particle size distributions of the five Class F fly ashes shown as probability
distribution functions. Each curve is the average of six individual measurements and the
error bars (one standard deviation) would fall within the size of the shown symbols.
Page 7 of 15
978-1-4799-5580-0/14/$31.00 © 2015 IEEE
2015-CIC-0004
Page 8
NIST also tested four binary blends containing 65% Portland cement and 35% Class F fly ash and one blend containing
65% Portland cement and 35% Class C fly ash. Details of the test results are also contained in the references stated above [1]-
[3].
As summarized in Table II, one of the 65:35 binary blends had essentially the same strength as the 100% OPC control at all
ages (1, 3, 7, 28, 91, and 182 days) and required a modest but acceptable amount of water reducer (HRWR) to maintain
adequate flow. The other 65:35 binary blends required less water reducer but generally had lower strength at all ages. All
cement materials had a w/cm ratio of 0.35 normalized for volumetric substitution.
Table II
Mortar strength results of various 65% Portland cement and 35% flyash blends
Cement
Material
1-day
(MPa)
(psi)
3-day
(MPa)
(psi)
7-day
(MPa)
(psi)
28-day
(MPa)
(psi)
91-day
(MPa)
(psi)
182-day
(MPa)
(psi)
HRWR
g/100 g cem
100% OPC
Control
36.7
5320 54.4
7900
63.6
9220
80.3
11640
84.7
12280
86.0
12470 0.0
Cement 9
Class C ash
38.8
5620 51.4
7460
61.4
8910
79.6
11540
85.9
12450
90.9
13180 0.67
Cement 7
Fly ash 3
27.4
3980
39.7
5780
51.8
7380
69.7
10100
79.2
11480
90.9
13170 0.00
Cement 8
Fly ash 2
37.9 5500
48.0
6960
59.3
8600
65.6
9510
77.1
11180
81.8
11860 0.37
Cement 9
Fly ash 5
39.0
5660 50.9
7380
58.3
8460
70.0
10150
82.9
12030
88.9
12890 0.48
Cement 10
Fly ash 4
44.6
6460
53.4
7750
64.8
9400
72.4
10500
80.6
11690
83.3
12080 0.67
Fig. 8. Mortar strength results from different 65% Portland cement and 35% flyash blends
The manufacturing processes for this 35% SCM blend are essentially the same as for the 20% substitution above, just
grinding the cement a little finer and adding more coarse SCM.
D. Case Study 3 - 45% Cement / 55% SCM (Optimization Score of 3.0)
0
10
20
30
40
50
60
70
80
90
100
Mo
rtar
Str
en
gth
(Mp
a)
100% OPC Control
Cement 9 Class C flyash
Cement 7 Flyash 3
Cement 8 Flyash 2
Cement 9 Flyash 5
Cement 10 Flyash 4
Page 8 of 15
978-1-4799-5580-0/14/$31.00 © 2015 IEEE
2015-CIC-0004
Page 9
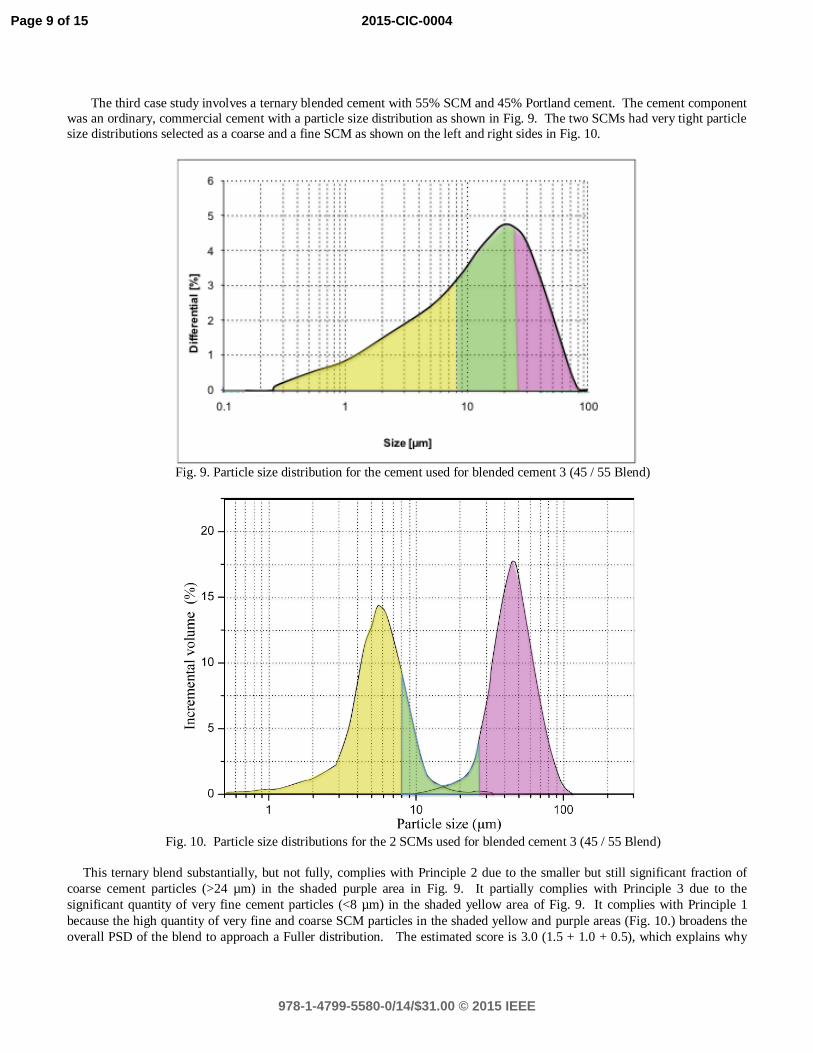
The third case study involves a ternary blended cement with 55% SCM and 45% Portland cement. The cement component
was an ordinary, commercial cement with a particle size distribution as shown in Fig. 9. The two SCMs had very tight particle
size distributions selected as a coarse and a fine SCM as shown on the left and right sides in Fig. 10.
Fig. 9. Particle size distribution for the cement used for blended cement 3 (45 / 55 Blend)
Fig. 10. Particle size distributions for the 2 SCMs used for blended cement 3 (45 / 55 Blend)
This ternary blend substantially, but not fully, complies with Principle 2 due to the smaller but still significant fraction of
coarse cement particles (>24 µm) in the shaded purple area in Fig. 9. It partially complies with Principle 3 due to the
significant quantity of very fine cement particles (<8 µm) in the shaded yellow area of Fig. 9. It complies with Principle 1
because the high quantity of very fine and coarse SCM particles in the shaded yellow and purple areas (Fig. 10.) broadens the
overall PSD of the blend to approach a Fuller distribution. The estimated score is 3.0 (1.5 + 1.0 + 0.5), which explains why
Page 9 of 15
978-1-4799-5580-0/14/$31.00 © 2015 IEEE
2015-CIC-0004
Page 10
this ternary blend had higher SCM substitution (55%) when compared to the second binary blend (35%) with a score of 2.5.
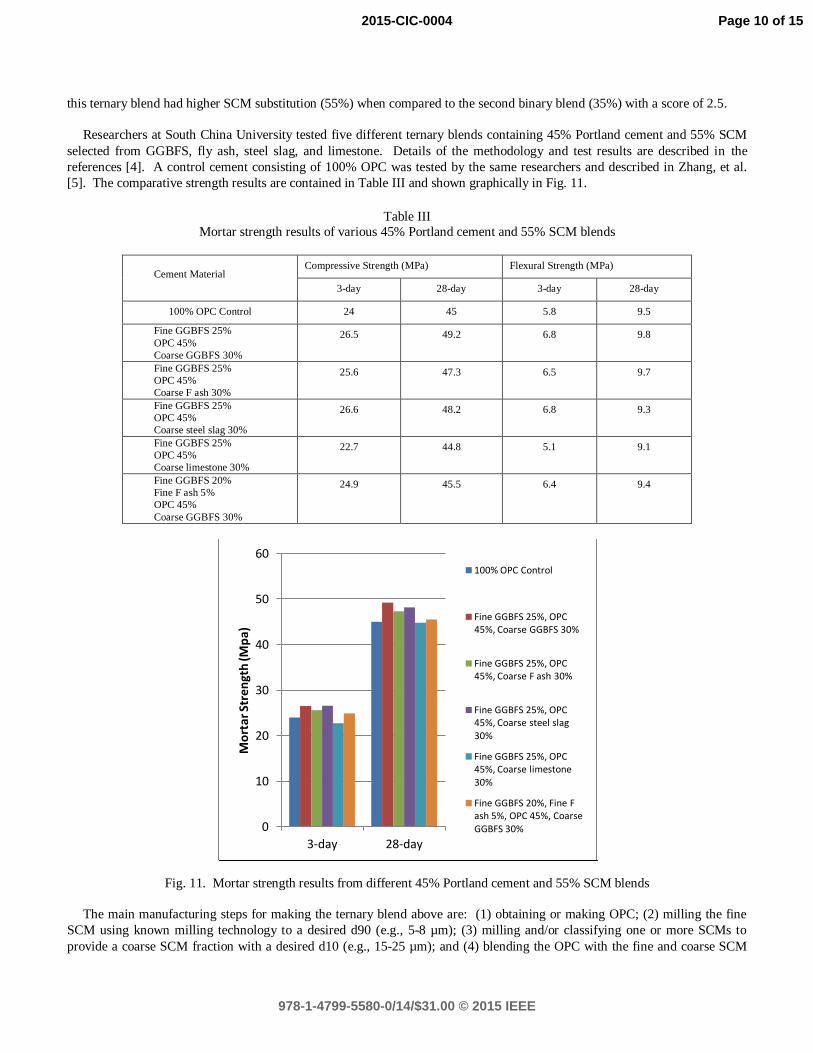
Researchers at South China University tested five different ternary blends containing 45% Portland cement and 55% SCM
selected from GGBFS, fly ash, steel slag, and limestone. Details of the methodology and test results are described in the
references [4]. A control cement consisting of 100% OPC was tested by the same researchers and described in Zhang, et al.
[5]. The comparative strength results are contained in Table III and shown graphically in Fig. 11.
Table III
Mortar strength results of various 45% Portland cement and 55% SCM blends
Cement Material Compressive Strength (MPa) Flexural Strength (MPa)
3-day 28-day 3-day 28-day
100% OPC Control 24 45 5.8 9.5
Fine GGBFS 25%
OPC 45%
Coarse GGBFS 30%
26.5 49.2 6.8 9.8
Fine GGBFS 25%
OPC 45%
Coarse F ash 30%
25.6 47.3 6.5 9.7
Fine GGBFS 25%
OPC 45%
Coarse steel slag 30%
26.6 48.2 6.8 9.3
Fine GGBFS 25%
OPC 45%
Coarse limestone 30%
22.7 44.8 5.1 9.1
Fine GGBFS 20%
Fine F ash 5%
OPC 45%
Coarse GGBFS 30%
24.9 45.5 6.4 9.4
Fig. 11. Mortar strength results from different 45% Portland cement and 55% SCM blends
The main manufacturing steps for making the ternary blend above are: (1) obtaining or making OPC; (2) milling the fine
SCM using known milling technology to a desired d90 (e.g., 5-8 µm); (3) milling and/or classifying one or more SCMs to
provide a coarse SCM fraction with a desired d10 (e.g., 15-25 µm); and (4) blending the OPC with the fine and coarse SCM
0
10
20
30
40
50
60
3-day 28-day
Mo
rtar
Str
en
gth
(Mp
a)
100% OPC Control
Fine GGBFS 25%, OPC 45%, Coarse GGBFS 30%
Fine GGBFS 25%, OPC 45%, Coarse F ash 30%
Fine GGBFS 25%, OPC 45%, Coarse steel slag 30%
Fine GGBFS 25%, OPC 45%, Coarse limestone 30%
Fine GGBFS 20%, Fine F ash 5%, OPC 45%, Coarse GGBFS 30%
Page 10 of 15
978-1-4799-5580-0/14/$31.00 © 2015 IEEE
2015-CIC-0004
Page 11
fractions.
E. Case Study 4 - 25% Cement 75% SCM (Optimization Score of 4.0)
The use of ordinary Portland cement in case study 3 gave the blend a large amount of cement fines and a portion of
oversized cement particles. Gap grading can overcome these limitations, by removing the unwanted size fractions. This is
done in the lab, by carefully separating out the particles of interest and discarding the rest. The gap-graded, ternary blended
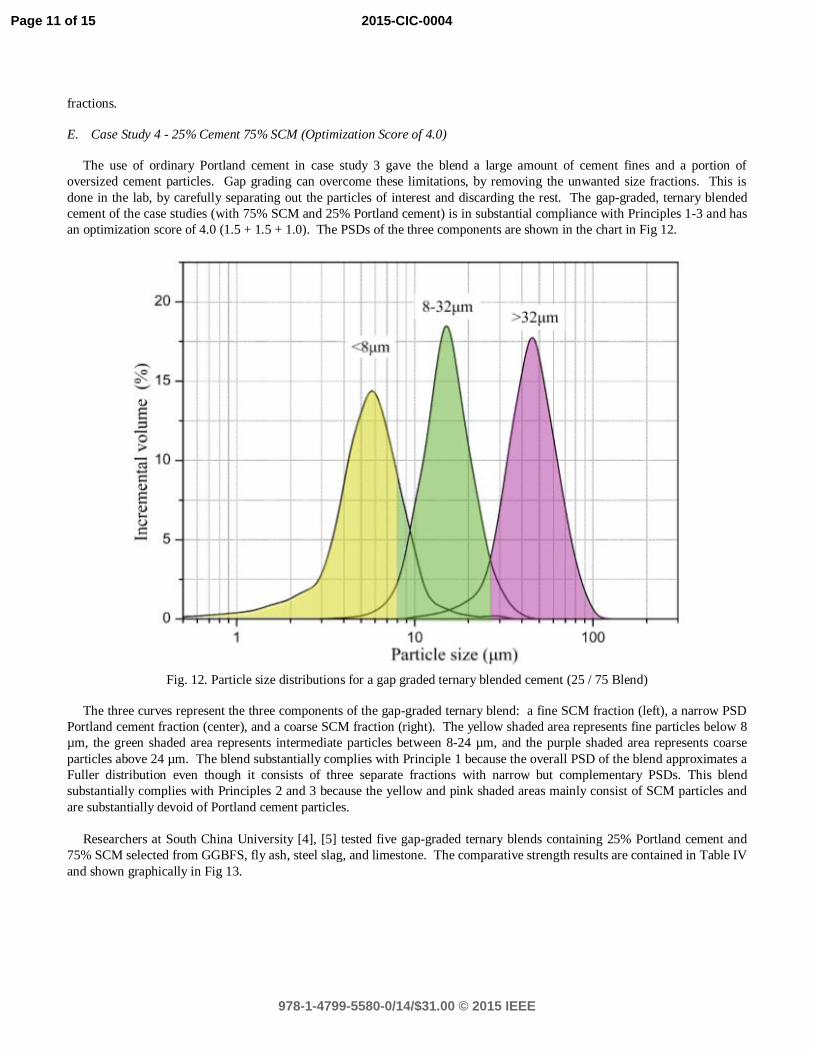
cement of the case studies (with 75% SCM and 25% Portland cement) is in substantial compliance with Principles 1-3 and has
an optimization score of 4.0 (1.5 + 1.5 + 1.0). The PSDs of the three components are shown in the chart in Fig 12.
Fig. 12. Particle size distributions for a gap graded ternary blended cement (25 / 75 Blend)
The three curves represent the three components of the gap-graded ternary blend: a fine SCM fraction (left), a narrow PSD
Portland cement fraction (center), and a coarse SCM fraction (right). The yellow shaded area represents fine particles below 8
µm, the green shaded area represents intermediate particles between 8-24 µm, and the purple shaded area represents coarse
particles above 24 µm. The blend substantially complies with Principle 1 because the overall PSD of the blend approximates a
Fuller distribution even though it consists of three separate fractions with narrow but complementary PSDs. This blend
substantially complies with Principles 2 and 3 because the yellow and pink shaded areas mainly consist of SCM particles and
are substantially devoid of Portland cement particles.
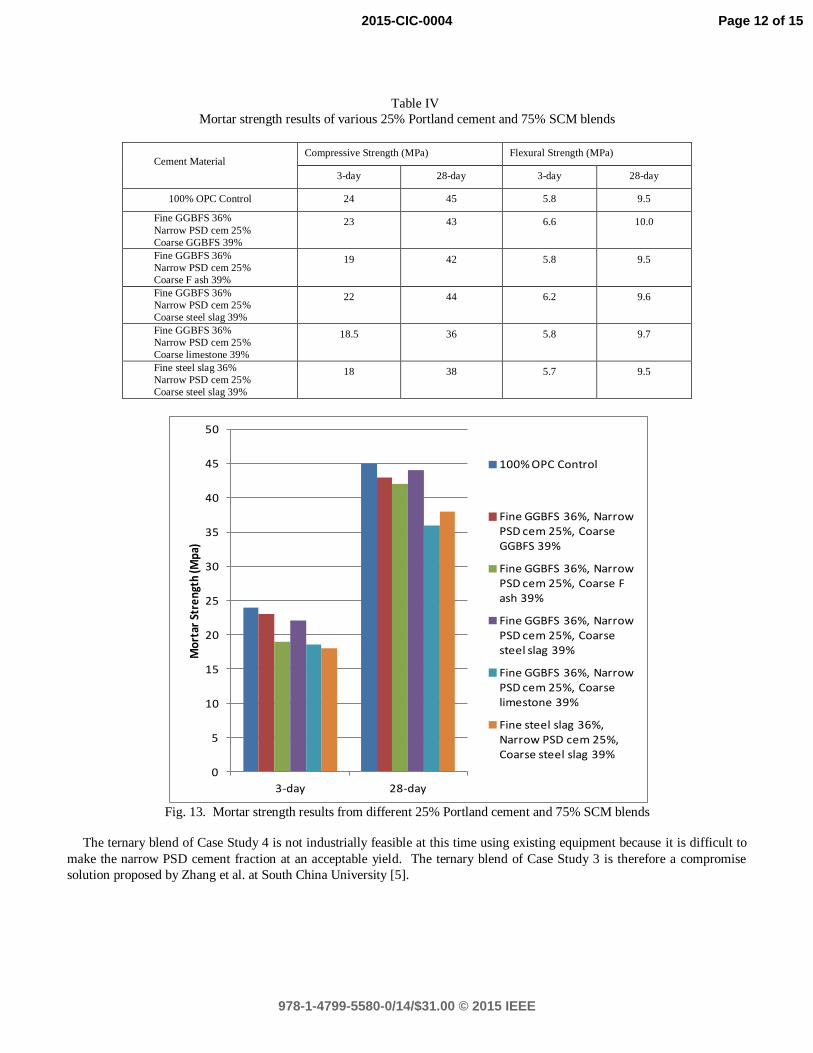
Researchers at South China University [4], [5] tested five gap-graded ternary blends containing 25% Portland cement and
75% SCM selected from GGBFS, fly ash, steel slag, and limestone. The comparative strength results are contained in Table IV
and shown graphically in Fig 13.
Page 11 of 15
978-1-4799-5580-0/14/$31.00 © 2015 IEEE
2015-CIC-0004
Page 12
Table IV
Mortar strength results of various 25% Portland cement and 75% SCM blends
Cement Material Compressive Strength (MPa) Flexural Strength (MPa)
3-day 28-day 3-day 28-day
100% OPC Control 24 45 5.8 9.5
Fine GGBFS 36%
Narrow PSD cem 25%
Coarse GGBFS 39%
23 43 6.6 10.0
Fine GGBFS 36%
Narrow PSD cem 25%
Coarse F ash 39%
19 42 5.8 9.5
Fine GGBFS 36%
Narrow PSD cem 25%
Coarse steel slag 39%
22 44 6.2 9.6
Fine GGBFS 36%
Narrow PSD cem 25%
Coarse limestone 39%
18.5 36 5.8 9.7
Fine steel slag 36%
Narrow PSD cem 25%
Coarse steel slag 39%
18 38 5.7 9.5
Fig. 13. Mortar strength results from different 25% Portland cement and 75% SCM blends
The ternary blend of Case Study 4 is not industrially feasible at this time using existing equipment because it is difficult to
make the narrow PSD cement fraction at an acceptable yield. The ternary blend of Case Study 3 is therefore a compromise
solution proposed by Zhang et al. at South China University [5].
0
5
10
15
20
25
30
35
40
45
50
3-day 28-day
Mor
tar
Stre
ngth
(Mpa
)
100% OPC Control
Fine GGBFS 36%, Narrow PSD cem 25%, Coarse GGBFS 39%
Fine GGBFS 36%, Narrow PSD cem 25%, Coarse F ash 39%
Fine GGBFS 36%, Narrow PSD cem 25%, Coarse steel slag 39%
Fine GGBFS 36%, Narrow PSD cem 25%, Coarse limestone 39%
Fine steel slag 36%, Narrow PSD cem 25%, Coarse steel slag 39%
Page 12 of 15
978-1-4799-5580-0/14/$31.00 © 2015 IEEE
2015-CIC-0004
Page 13
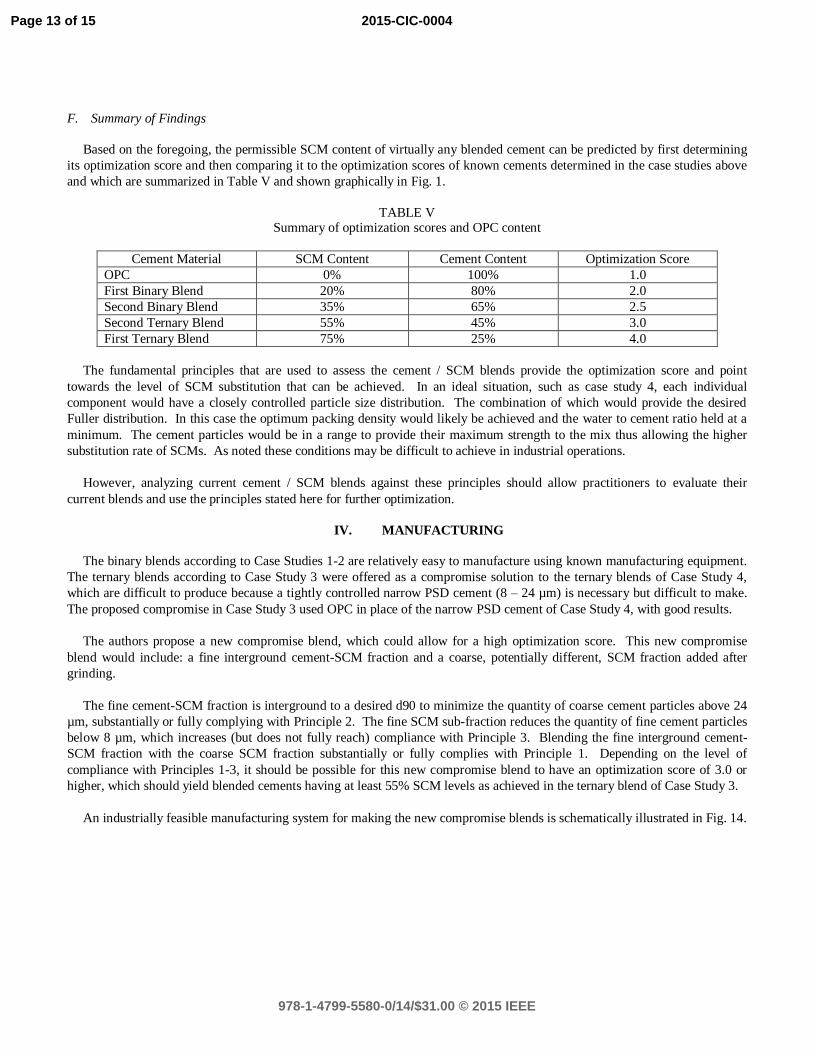
F. Summary of Findings
Based on the foregoing, the permissible SCM content of virtually any blended cement can be predicted by first determining
its optimization score and then comparing it to the optimization scores of known cements determined in the case studies above
and which are summarized in Table V and shown graphically in Fig. 1.
TABLE V Summary of optimization scores and OPC content
Cement Material SCM Content Cement Content Optimization Score
OPC 0% 100% 1.0
First Binary Blend 20% 80% 2.0
Second Binary Blend 35% 65% 2.5
Second Ternary Blend 55% 45% 3.0
First Ternary Blend 75% 25% 4.0
The fundamental principles that are used to assess the cement / SCM blends provide the optimization score and point
towards the level of SCM substitution that can be achieved. In an ideal situation, such as case study 4, each individual
component would have a closely controlled particle size distribution. The combination of which would provide the desired
Fuller distribution. In this case the optimum packing density would likely be achieved and the water to cement ratio held at a
minimum. The cement particles would be in a range to provide their maximum strength to the mix thus allowing the higher
substitution rate of SCMs. As noted these conditions may be difficult to achieve in industrial operations.
However, analyzing current cement / SCM blends against these principles should allow practitioners to evaluate their
current blends and use the principles stated here for further optimization.
IV. MANUFACTURING
The binary blends according to Case Studies 1-2 are relatively easy to manufacture using known manufacturing equipment.
The ternary blends according to Case Study 3 were offered as a compromise solution to the ternary blends of Case Study 4,
which are difficult to produce because a tightly controlled narrow PSD cement (8 – 24 µm) is necessary but difficult to make.
The proposed compromise in Case Study 3 used OPC in place of the narrow PSD cement of Case Study 4, with good results.
The authors propose a new compromise blend, which could allow for a high optimization score. This new compromise
blend would include: a fine interground cement-SCM fraction and a coarse, potentially different, SCM fraction added after
grinding.
The fine cement-SCM fraction is interground to a desired d90 to minimize the quantity of coarse cement particles above 24
µm, substantially or fully complying with Principle 2. The fine SCM sub-fraction reduces the quantity of fine cement particles
below 8 µm, which increases (but does not fully reach) compliance with Principle 3. Blending the fine interground cement-
SCM fraction with the coarse SCM fraction substantially or fully complies with Principle 1. Depending on the level of
compliance with Principles 1-3, it should be possible for this new compromise blend to have an optimization score of 3.0 or
higher, which should yield blended cements having at least 55% SCM levels as achieved in the ternary blend of Case Study 3.
An industrially feasible manufacturing system for making the new compromise blends is schematically illustrated in Fig. 14.
Page 13 of 15
978-1-4799-5580-0/14/$31.00 © 2015 IEEE
2015-CIC-0004
Page 14
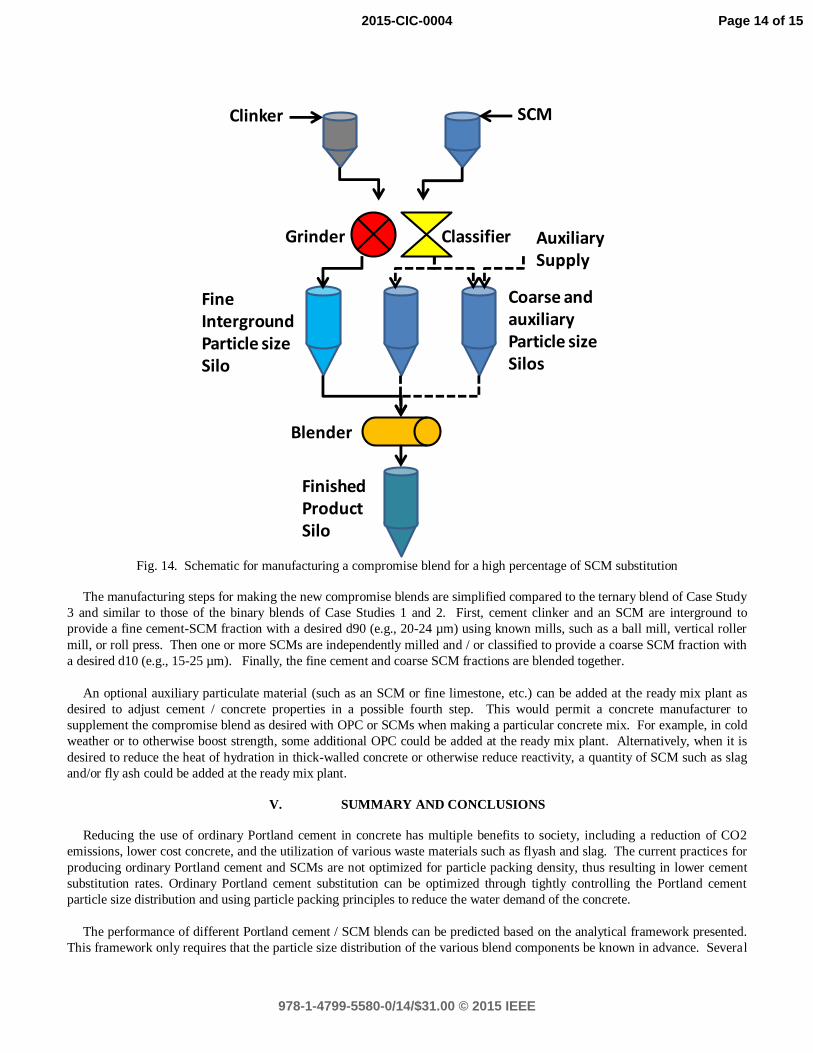
Fig. 14. Schematic for manufacturing a compromise blend for a high percentage of SCM substitution
The manufacturing steps for making the new compromise blends are simplified compared to the ternary blend of Case Study
3 and similar to those of the binary blends of Case Studies 1 and 2. First, cement clinker and an SCM are interground to
provide a fine cement-SCM fraction with a desired d90 (e.g., 20-24 µm) using known mills, such as a ball mill, vertical roller
mill, or roll press. Then one or more SCMs are independently milled and / or classified to provide a coarse SCM fraction with
a desired d10 (e.g., 15-25 µm). Finally, the fine cement and coarse SCM fractions are blended together.
An optional auxiliary particulate material (such as an SCM or fine limestone, etc.) can be added at the ready mix plant as
desired to adjust cement / concrete properties in a possible fourth step. This would permit a concrete manufacturer to
supplement the compromise blend as desired with OPC or SCMs when making a particular concrete mix. For example, in cold
weather or to otherwise boost strength, some additional OPC could be added at the ready mix plant. Alternatively, when it is
desired to reduce the heat of hydration in thick-walled concrete or otherwise reduce reactivity, a quantity of SCM such as slag
and/or fly ash could be added at the ready mix plant.
V. SUMMARY AND CONCLUSIONS
Reducing the use of ordinary Portland cement in concrete has multiple benefits to society, including a reduction of CO2
emissions, lower cost concrete, and the utilization of various waste materials such as flyash and slag. The current practices for
producing ordinary Portland cement and SCMs are not optimized for particle packing density, thus resulting in lower cement
substitution rates. Ordinary Portland cement substitution can be optimized through tightly controlling the Portland cement
particle size distribution and using particle packing principles to reduce the water demand of the concrete.
The performance of different Portland cement / SCM blends can be predicted based on the analytical framework presented.
This framework only requires that the particle size distribution of the various blend components be known in advance. Several
Clinker SCM
Blender
Finished ProductSilo
Grinder Classifier
Coarse and auxiliary Particle sizeSilos
Fine IntergroundParticle sizeSilo
Auxiliary Supply
Page 14 of 15
978-1-4799-5580-0/14/$31.00 © 2015 IEEE
2015-CIC-0004
Page 15
case studies are examined that demonstrate the validity of the framework. The framework also provides insights for companies
that wish to increase clinker substitution while maintaining concrete integrity.
Finally the production methods for cement and SCMs are briefly explored which gives information on what can and cannot
be accomplished using existing equipment in cement and concrete plants today. It is shown that intergrinding OPC and SCM
blends is often better than field mixing these components at the concrete plant. It is also shown that compromise blends can be
produced with existing equipment, by paying careful attention to the particle sizes of the blended components. The application
of these approaches should enable greater SCM substitution in the future, thus further reducing the carbon footprint of
concrete.
References
[1] Bentz, et al., “Optimization of Particle Sizes in High Volume Fly Ash Blended Cements,” NISTIR 7763, (Feb. 2011)
[2] Bentz, et al., “Optimization of cement and fly ash particle sizes to produce sustainable concretes,” Cement and Concrete Composites, Vol. 33 (8), 824-
831 (2011)
[3] Bentz, et al., Influence of particle size distributions on yield stress and viscosity of cement-fly ash pastes, Cement and Concrete Research, Vol. 42 (2),
404-409 (2012)
[4] Zhang, et al., “Influence of preparation method on the performance of ternary blended cements,” Cement & Concrete Composites 52, 18 – 16 (2014)
[5] Zhang, et al., “A new gap-graded particle size distribution and resulting consequences on properties of blended cement,” Cement & Concrete Composites
33, 543-550 (2011)
Page 15 of 15
978-1-4799-5580-0/14/$31.00 © 2015 IEEE
2015-CIC-0004