110
Maximum Throughput of IEEE 802.11 Access Points: Test Procedure and Measurements Enrico Pelletta 10th August 2004

Maximum Throughput of IEEE 802.11 AccessPoints: Test Procedure and Measurements
Enrico Pelletta
10th August 2004

Abstract
Performance measurements of IEEE 802.11 access points are becoming increasinglyimportant since it is the predominant choice for high-speed wireless LAN networks.Among the different possible access point’s figures of merit, we focus our investiga-tion on throughput performance. In particular, in this work we present measurementsof the access point’s maximum saturation throughput. The saturation throughput isachieved when the access point always has a frame ready to transmit, and it reachesthe maximum for optimal transmission conditions and appropriate offered traffic. Weshow that the maximum saturation throughput is the key figure of merit to characterizethe performance of the access points.
Several different standards are currently part of the 802.11 family, but we restrictour investigation to IEEE 802.11b devices. This standard is currently the most mature,with the largest number of devices, and with the most complete set of tools. Never-theless, since the newer 802.11a and 802.11g are rapidly increasing their importance,we designed our measurement method in a way that it is possible to use it with others802.11 technologies.
The first contribution of this work is a methodology to produce and measure themaximum saturation throughput of any 802.11b access point. The proposed procedureincludes the testbed setup, the software tools and the mathematical support for pro-cessing the results. All these aspects were investigated in order to define a unique andrepeatable test procedure. The main effort was invested maximising and stabilising theaccess point performance. It was necessary to limit the impact of external factors thatinterfered with the access point optimal status and produced large throughput instabil-ity. We use the average value of the maximum saturation throughput as the figure ofmerit for 802.11 APs, and the test procedure allowed computing such a value with adefined confidence level and accuracy. The instant value of the saturation throughputeven in optimal conditions has a too large variance to be significant.
The second contribution of this work is the measurement results obtained follow-ing our proposed methodology from five different IEEE 802.11b access points. Thepurpose of the tests was to validate our methodology, and this result was successfullyachieved. Moreover, the analysis of the test results suggests some conclusions about theperformance of current access points. The downlink maximum saturation throughputis often limited by the access point performance, while the uplink maximum satura-tion throughput is rarely compromised. Therefore, the downlink saturation throughputis the key figure of merit of the access point, and the generic maximum saturationthroughput of any access point is the 802.11 link capacity. On the other hand, increas-ing the offered load to the access point’s Ethernet interface does not always increasethe downlink throughput; some access points present a downlink throughput reductionwhen the offered load exceeds their bridging capabilities. Finally, despite all the accesspoints claim to use omni-directional antennas, some of them exhibit better performance
1

2
in certain orientations with respect to the mobile stations.
Contents
1 Introduction 10
2 Background and Related Work 122.1 IEEE 802.11 Overview . . . . . . . . . . . . . . . . . . . . . . . . . 12
2.1.1 Highlights . . . . . . . . . . . . . . . . . . . . . . . . . . . . 122.1.2 Distributed Coordination Function . . . . . . . . . . . . . . . 132.1.3 IEEE 802.11 Extensions . . . . . . . . . . . . . . . . . . . . 15
2.2 Summary of previous work on IEEE 802.11 performance . . . . . . . 162.2.1 Papers on 802.11 performance analysis . . . . . . . . . . . . 16
2.2.1.1 IEEE 802.11 Medium Access Control performance 172.2.1.2 Network and transport protocols performance on IEEE
802.11 . . . . . . . . . . . . . . . . . . . . . . . . 192.2.1.3 Performance of 802.11 Access Points . . . . . . . . 21
2.2.2 IEEE 802.11 White Papers . . . . . . . . . . . . . . . . . . . 22
3 Maximum Saturation Throughput 283.1 Saturation Throughput definition and importance . . . . . . . . . . . 28
3.1.1 Access Point’s Throughput . . . . . . . . . . . . . . . . . . . 283.1.2 Saturation Throughput Definition . . . . . . . . . . . . . . . 29
3.2 Conditions to maximise the AP’s saturation throughput . . . . . . . . 293.2.1 IEEE 802.11 Radio Performance Maximisation . . . . . . . . 293.2.2 IEEE 802.11 Medium Access Control Performance Maximisa-
tion . . . . . . . . . . . . . . . . . . . . . . . . . . . . . . . 303.3 Importance of the Maximum Saturation Throughput . . . . . . . . . . 31
4 Challenges in measuring the APs throughput 334.1 Preliminary Tests Procedure . . . . . . . . . . . . . . . . . . . . . . 334.2 Preliminary tests results . . . . . . . . . . . . . . . . . . . . . . . . . 34
4.2.1 Saturation downlink throughput behaviours . . . . . . . . . . 344.2.2 Effects of different AP configurations . . . . . . . . . . . . . 37
4.2.2.1 The Cisco Aironet 1200 Case . . . . . . . . . . . . 424.2.2.2 Avaya RG-II Case . . . . . . . . . . . . . . . . . . 42
4.2.3 Offered Load versus AP throughput . . . . . . . . . . . . . . 424.2.4 Conclusions . . . . . . . . . . . . . . . . . . . . . . . . . . . 45
4.3 Important Notes . . . . . . . . . . . . . . . . . . . . . . . . . . . . 464.3.1 Initial Transient . . . . . . . . . . . . . . . . . . . . . . . . . 464.3.2 Measurement of the Signal and Noise Levels . . . . . . . . . 46
3

CONTENTS 4
5 A Statistical Framework for Throughput Analysis 515.1 Significant Statistical Indexes for Saturation Throughput . . . . . . . 515.2 Characteristics of the Saturation Throughput Samples . . . . . . . . 525.3 Throughput measurement accuracy and number of samples . . . . . . 57
5.3.1 Background . . . . . . . . . . . . . . . . . . . . . . . . . . . 575.3.2 Estimation of the number of necessary samples . . . . . . . . 58
6 Measurement of AP Maximum Throughput 606.1 Particularities of the IEEE 802.11 AP Throughput . . . . . . . . . . . 60
6.1.1 AP’s downlink Throughput . . . . . . . . . . . . . . . . . . . 616.1.2 AP’s Uplink Throughput . . . . . . . . . . . . . . . . . . . . 656.1.3 Wireless-to-Wireless Throughput . . . . . . . . . . . . . . . 696.1.4 Uplink/downlink Throughput . . . . . . . . . . . . . . . . . 726.1.5 Conclusions . . . . . . . . . . . . . . . . . . . . . . . . . . . 75
6.2 Maximum Saturation Throughput Measurement Procedure . . . . . . 776.2.1 Test Procedure . . . . . . . . . . . . . . . . . . . . . . . . . 77
6.2.1.1 Optimal AP orientation . . . . . . . . . . . . . . . 786.2.1.2 Measurement of the AP throughput performance . . 786.2.1.3 Maximum AP throughput verification . . . . . . . . 79
6.2.2 Testbed for Maximum Throughput measurements . . . . . . . 806.2.3 Important Notes . . . . . . . . . . . . . . . . . . . . . . . . 82
7 IEEE 802.11 AP’s Saturation Throughput 847.1 Former Lucent products . . . . . . . . . . . . . . . . . . . . . . . . . 84
7.1.1 Avaya RG-II . . . . . . . . . . . . . . . . . . . . . . . . . . 847.1.2 Proxim/Orinoco AP1000 . . . . . . . . . . . . . . . . . . . . 877.1.3 Proxim/Orinoco AP2000 . . . . . . . . . . . . . . . . . . . . 907.1.4 Notes on former Lucent 802.11b APs . . . . . . . . . . . . . 95
7.2 Cisco Aironet 1200 . . . . . . . . . . . . . . . . . . . . . . . . . . . 957.3 Ericsson A11d (Symbol AP-4121) . . . . . . . . . . . . . . . . . . . 997.4 Conclusions . . . . . . . . . . . . . . . . . . . . . . . . . . . . . . . 103
8 Conclusions 105
9 Future Work 107

List of Figures
2.1 Backoff procedure according to IEEE 802.11. . . . . . . . . . . . . . . . . . . 142.2 Basic Access Mechanism according to IEEE 802.11. . . . . . . . . . . . . . . . 152.3 RTS/CTS access according to IEEE 802.11. . . . . . . . . . . . . . . . . . . . 15
4.1 Cisco Aironet 1200 instant throughput and radio signals over a 1-hour test. . . . . . 354.2 Avaya RG-II throughput and radio signals over a 1-hour test. . . . . . . . . . . . 364.3 Avaya RG-II throughput and radio signals over a 1-hour test (test repetition). . . . . . 384.4 Avaya RG-II throughput and radio signals over 8 hour test. . . . . . . . . . . . . 394.5 Avaya RG-II throughput and radio signals over a 1-hour test with different AP orienta-
tion. . . . . . . . . . . . . . . . . . . . . . . . . . . . . . . . . . . . 404.6 Cisco AIR 1200 instant throughput and radio signals over a 1-hour test (Second Test). . 414.7 Cisco Aironet A1200 instant throughput and radio signals over a 1-hour test when en-
forcing legacy 802.11 client compatibility and no proprietary Aironet extensions. . . . 434.8 Avaya RG-II throughput over a 1-hour test using Micro Cell profile. . . . . . . . . 444.9 Avaya RG-II throughput over a 1-hour test using Micro Cell profile and not optimal AP
orientation. . . . . . . . . . . . . . . . . . . . . . . . . . . . . . . . . . 444.10 Different APs downlink throughput performance when increasing the offered load. Each
point represents the best throughput on 5 minutes interval over 5 independent tests. . . 454.11 Per packet throughput relative to the first 200 ms of activity. . . . . . . . . . . . . 474.12 Avaya RG-II instant throughput and radio signals over a 1-hour test. . . . . . . . . 494.13 Cisco/Aironet A1200 instant throughput and radio signals. Detail of 10 minutes over a
one-hour test. . . . . . . . . . . . . . . . . . . . . . . . . . . . . . . . . 50
5.1 Instantaneous throughput of the Cisco/Aironet A1200 in the first second of the test. Eachthroughput sample is made of a single packet. . . . . . . . . . . . . . . . . . . 53
5.2 Instantaneous throughput of the Avaya RG-II in the first second of the test. Each through-put sample is made of a single packet. . . . . . . . . . . . . . . . . . . . . . 53
5.3 Maximum, average and minimum downlink throughput using Avaya RG-II and CiscoAIR1200 computed for different sample length. . . . . . . . . . . . . . . . . . 54
5.4 Average behaviour of the downlink standard deviation with different sample size usingAvaya RG-II and Cisco AIR 1200. . . . . . . . . . . . . . . . . . . . . . . . 55
6.1 Cisco AIR 1200 and Avaya RG-II downlink test results. The graphs show the specificAP throughput computed on sequential samples of 150 ms each. The two different testswere run the time necessary to collect 12805 samples. . . . . . . . . . . . . . . 62
6.2 Avaya RG-II and Cisco AIR 1200 downlink test results. Average throughput and confi-dence intervals for the different test sessions with 1 and 2 receivers. . . . . . . . . 63
5

LIST OF FIGURES 6
6.3 Cisco AIR 1200 downlink throughput with different offered load: from 500 to 800pkt/sec. The measurements confidence level is 95% and 5% accuracy. . . . . . . . . 64
6.4 Avaya RG-II downlink throughput with different offered load: from 350 to 800 pkt/sec.The measurements confidence level is 95% and 5% accuracy. . . . . . . . . . . . 64
6.5 Cisco AIR 1200 and Avaya RG-II uplink test results. The graphs show the AP throughputcomputed on sequential samples of 150 ms each. The two different tests were run thetime necessary to collect 12805 samples. . . . . . . . . . . . . . . . . . . . . 66
6.6 Uplink test results. Average throughput and confidence intervals for the different testsessions with 1 and 2 senders. . . . . . . . . . . . . . . . . . . . . . . . . 67
6.7 Avaya RG-II and Cisco AIR 1200 uplink aggregate average throughput and confidenceinterval with one (a) and two (b) senders. The throughput was computed on sequentialsamples of 150 ms each. The measurements confidence level is 95% and 3% accuracy. 68
6.8 Avaya RG-II throughput for wireless-to-wireless communications. The test was run upto collect 7683 consecutive throughput samples of 150 ms. . . . . . . . . . . . . 70
6.9 Cisco AIR 1200 throughput for wireless-to-wireless communications. The test was runup to collect 7683 consecutive throughput samples of 150 ms. . . . . . . . . . . . 71
6.10 Avaya RG-II uplink/downlink throughput behaviour. The test was run the necessary timeto measure the throughput with a confidence level of 95% and with 5% accuracy. . . . 73
6.11 Cisco AIR 1200 uplink/downlink throughput behaviour. The test was run the necessarytime to measure the throughput with a confidence level of 95% and with 5% accuracy. . 74
6.12 Avaya RG-II and Cisco AIR1200 compared test results. The graphs show the aggregatethroughput average and confidence intervals for uplink, downlink and uplink/downlinktests. Note that the uplink shows the case of 2 wireless senders and the up/down link testthroughput is the aggregate throughput in the 802.11 link that is slightly higher than theAP real aggregate throughput. . . . . . . . . . . . . . . . . . . . . . . . . 76
6.13 Testbed for IEEE802.11 AP throughput Measurements. . . . . . . . . . . . . . . 80
7.1 Avaya RG-II downlink throughput versus AP/Client orientation. The diagram shows theaverage throughput value and its confidence interval (confidence level 95%, 5% accuracy). 85
7.2 Avaya RG-II downlink throughput versus offered load. The diagram shows the averagethroughput value and its confidence interval (confidence level 95%, 5% accuracy). . . 86
7.3 Avaya RG-II downlink instant saturation throughput in optimal conditions (180 degreesAP orientation, 450 pkt/sec offered load) and cumulate number of packet retransmis-sions. . . . . . . . . . . . . . . . . . . . . . . . . . . . . . . . . . . . 87
7.4 Orinoco AP1000 downlink saturation throughput versus AP/Client orientation. The di-agram shows the average throughput value and its confidence interval (confidence level95%, 5% accuracy). . . . . . . . . . . . . . . . . . . . . . . . . . . . . . 88
7.5 Orinoco AP1000 downlink instant saturation throughput versus AP/Client orientationand cumulative number of packet retransmissions. . . . . . . . . . . . . . . . . 89
7.6 Orinoco AP1000 downlink saturation throughput versus offered load. The diagramshows the average throughput value and its confidence interval (confidence level 95%,5% accuracy). . . . . . . . . . . . . . . . . . . . . . . . . . . . . . . . 89
7.7 Orinoco AP1000 downlink instant saturation throughput under optimal conditions (90degrees AP orientation, 800 pkt/sec offered load) and cumulative number of packet re-transmissions. . . . . . . . . . . . . . . . . . . . . . . . . . . . . . . . 90
7.8 Orinoco AP2000 downlink saturation throughput versus AP/Client orientation. The di-agram shows the average throughput value and its confidence interval (confidence level95%, 5% accuracy). . . . . . . . . . . . . . . . . . . . . . . . . . . . . . 91
7.9 Orinoco AP2000 downlink instant saturation throughput versus AP/Client orientation. . 92

LIST OF FIGURES 7
7.10 Orinoco AP2000 downlink saturation throughput versus offered load. The diagramshows the average throughput value and its confidence interval (confidence level 95%,5% accuracy). . . . . . . . . . . . . . . . . . . . . . . . . . . . . . . . 92
7.11 Orinoco AP2000 downlink instant saturation throughput in an optimal environment andwith optimal orientation and different offered loads. The diagrams show the throughputsamples and cumulative number of packet retransmissions. . . . . . . . . . . . . 93
7.12 Orinoco AP2000 downlink instant saturation throughput in optimal conditions (90 de-grees AP orientation, 600 pkt/sec offered load) and cumulative number of packet re-transmissions. . . . . . . . . . . . . . . . . . . . . . . . . . . . . . . . 94
7.13 Cisco AIR 1200 downlink saturation throughput versus AP/Client orientation. The di-agram shows the average throughput value and its confidence interval (confidence level95%, 5% accuracy). . . . . . . . . . . . . . . . . . . . . . . . . . . . . . 96
7.14 Cisco AIR 1200 downlink instant saturation throughput versus AP/Client orientation.The diagrams show the throughput samples (top) and cumulative number of packet re-transmissions (bottom). . . . . . . . . . . . . . . . . . . . . . . . . . . . 96
7.15 Cisco AIR 1200 downlink saturation throughput versus offered load. The diagram showsthe average throughput value and its confidence interval (confidence level 95%, 5% ac-curacy). . . . . . . . . . . . . . . . . . . . . . . . . . . . . . . . . . . 97
7.16 Cisco AIR 1200 downlink instant saturation throughput in optimal conditions (0 degreesAP orientation, 800 pkt/sec offered load) and cumulate number of packet retransmis-sions. . . . . . . . . . . . . . . . . . . . . . . . . . . . . . . . . . . . 98
7.17 Ericsson A11d downlink saturation throughput versus AP/Client orientation. The dia-gram shows the average throughput value and its confidence interval (confidence level95%, 5% accuracy). . . . . . . . . . . . . . . . . . . . . . . . . . . . . . 99
7.18 Ericsson A11d downlink saturation throughput versus offered load. The diagram showsthe average throughput value and its confidence interval (confidence level 95%, 5% ac-curacy). . . . . . . . . . . . . . . . . . . . . . . . . . . . . . . . . . . 100
7.19 Ericsson A11d downlink instant saturation throughput in optimal conditions (0 degreesAP orientation, 500 pkt/sec offered load) and cumulate number of packet retransmis-sions. . . . . . . . . . . . . . . . . . . . . . . . . . . . . . . . . . . . 101
7.20 Ericsson A11d uplink instant saturation throughput in optimal conditions (0 degrees APorientation, 800 pkt/sec offered load). . . . . . . . . . . . . . . . . . . . . . 102
7.21 Ericsson A11d uplink instant saturation throughput in optimal conditions. The diagramsshow a single minute of the uplink test. The complete test is shown in Figure 7.20. . . 103

List of Tables
2.1 Atheros Inc. estimation of the maximum theoretical application-level throughput pro-vided by the different IEEE 802.11 standards. The values are taken from [11, 12]. . . . 26
5.1 Avaya RG-II preliminary test 1, statistical analysis with different time length samples. . 535.2 Cisco Aironet 1200 preliminary test 1, statistical analysis with different time length samples. 545.3 IEEE802.11b maximum frame transmission cycle-time at different link rate. . . . . . 565.4 Sample’s minimum time length to get a specific maximum measurement error at the
different 802.11b link rate. . . . . . . . . . . . . . . . . . . . . . . . . . . 575.5 Number of necessary samples and estimate time to complete a test session to
measure the throughput with a confidence level of 95% and different levels ofaccuracy. . . . . . . . . . . . . . . . . . . . . . . . . . . . . . . . . . 59
6.1 Avaya RG-II downlink test results. The throughput was computed on sequential samplesof 150 ms each. The measurements confidence level is 95% and the accuracy is 3%. . 61
6.2 Cisco AIR 1200 downlink test results. The throughput was computed on sequentialsamples of 150 ms each. The measurements confidence level is 95% and the accuracy is3%. . . . . . . . . . . . . . . . . . . . . . . . . . . . . . . . . . . . 61
6.3 Avaya RG-II uplink test results. The throughput was computed on sequential samples of150 ms each. The measurements confidence level is 95% and 3% accuracy. . . . . . 65
6.4 Cisco AIR 1200 uplink test results. The throughput was computed on sequential samplesof 150 ms each. The measurements confidence level is 95% and 3% accuracy. . . . . 67
6.5 Avaya RG-II Wireless-to-Wireless test result. The throughput was computed on sequen-tial samples of 150 ms packets each. The measurement confidence level is 95% with 5%accuracy. . . . . . . . . . . . . . . . . . . . . . . . . . . . . . . . . . 70
6.6 Cisco AIR-1200 Wireless-to-Wireless test result. The throughput was computed on se-quential samples of 150 ms packets each. The measurement confidence level is 95%with 5% accuracy. . . . . . . . . . . . . . . . . . . . . . . . . . . . . . 71
6.7 Uplink/downlink test results. The throughput was computed on sequential samples of150 ms each. The measurements confidence level is 95% and 5% accuracy. . . . . . 72
7.1 Avaya RG-II downlink throughput versus orientation (average confidence level 95%,accuracy 5%). . . . . . . . . . . . . . . . . . . . . . . . . . . . . . . . 85
7.2 Avaya RG-II downlink throughput versus offered load. . . . . . . . . . . . . . . 867.3 Avaya RG-II downlink maximum saturation throughput significant statistical indexes
(confidence level 95%, 3% accuracy). . . . . . . . . . . . . . . . . . . . . . 867.4 Orinoco AP1000 downlink saturation throughput versus AP/Client orientation (average
confidence level 95%, accuracy 5%). . . . . . . . . . . . . . . . . . . . . . . 88
8

LIST OF TABLES 9
7.5 Orinoco AP1000 downlink saturation throughput versus offered load (confidence level95%, accuracy 5%). . . . . . . . . . . . . . . . . . . . . . . . . . . . . . 88
7.6 Orinoco AP1000 downlink maximum saturation throughput significant statistical indexes(average confidence level 95%, 3% accuracy). . . . . . . . . . . . . . . . . . . 90
7.7 Orinoco AP2000 downlink saturation throughput versus AP/Client orientation (averageconfidence level 95%, accuracy 5%). . . . . . . . . . . . . . . . . . . . . . . 91
7.8 Orinoco AP2000 downlink saturation throughput versus offered load (average confi-dence level 95%, accuracy 5%). . . . . . . . . . . . . . . . . . . . . . . . . 92
7.9 Orinoco AP2000 downlink maximum saturation throughput significant statistical indexes(confidence level 95%, 3% accuracy). . . . . . . . . . . . . . . . . . . . . . 94
7.10 Cisco AIR 1200 downlink saturation throughput versus AP/Client orientation (averageconfidence level 95%, accuracy 5%). . . . . . . . . . . . . . . . . . . . . . . 96
7.11 Cisco AIR 1200 downlink saturation throughput versus offered load (confidence level95%, accuracy 5%). . . . . . . . . . . . . . . . . . . . . . . . . . . . . . 97
7.12 Cisco AIR 1200 downlink maximum saturation throughput significant statistical indexes(confidence level 95%, 3% accuracy). . . . . . . . . . . . . . . . . . . . . . 98
7.13 Ericsson A11d downlink saturation throughput versus AP/Client orientation (confidencelevel 95%, accuracy 5%). . . . . . . . . . . . . . . . . . . . . . . . . . . . 100
7.14 Ericsson A11d downlink saturation throughput versus offered load (confidence level95%, accuracy 5%). . . . . . . . . . . . . . . . . . . . . . . . . . . . . . 100
7.15 Ericsson A11d downlink maximum saturation throughput significant statistical indexes(confidence level 95%, 3% accuracy). . . . . . . . . . . . . . . . . . . . . . 101
7.16 Ericsson A11d uplink maximum saturation throughput significant statistical indexes (con-fidence level 95%, 3% accuracy). . . . . . . . . . . . . . . . . . . . . . . . 102
7.17 Summary table of the downlink saturation throughput performance of the AP modelstested in chapter 7. . . . . . . . . . . . . . . . . . . . . . . . . . . . . . 104

Chapter 1
Introduction
In the last years, Wireless Local Area Network (WLAN) technologies have reached alarge popularity that is still growing. This kind of access network solution has beendeployed for several different usages, from home personal applications to large publicaccess systems, as well as point-to-point backbone radio links. The large popularity hasgenerated an increasing demand for improving their features, mainly in terms of highercapacity and increased security. The technological and commercial development ofwireless LANs have been helped by the results of different studies that offered differentmodels for predicting their behaviour.
Despite that different standards have been proposed, the most widely used WLANtechnologies are the different evolutions of the original IEEE 802.11 standard: 802.11b,802.11a and 802.11g. The wide usage of IEEE 802.11 based WLANs has generated alarge interest in modelling their behaviour. Examples of the various published studiesare [13, 15].
WLAN models were often validated with simulations and rarely supported by realperformance measurements. The few studies including real measurements were basedon tests with a single solution: one access point model with one kind of wireless clientinterface. Moreover, the real system measurements are generally limited to a specificand restricted aspect of the proposed model. In order to get information about theperformance of real devices in a real scenario, the only available source has been theperformance analysis provided by the different device producers. These reports aremade to advertise specific products and are often incomplete. In fact, the goal of suchwhite papers is to demonstrate the efficiency of a specific implementation under somespecific, and not always well-defined circumstances [9, 10].
In this thesis, we complete the previous work on IEEE 802.11 performance, byproviding maximum saturation throughput measurements in a real scenario. Our testswere performed on different commercial devices in a controlled testbed. This work hastwo main goals: to propose a WLAN APs test procedure, and to show the results wefound with the commercial devices we could test. The large number of different avail-able WLAN solutions, the continuous and fast development of new implementationsand the new standards make it impossible to present a complete and definitive perfor-mance evaluation. Instead, we propose our test methodology for performing tests onany AP implementation. Therefore, it is possible to create a well-defined platform forperformance evaluation and cross comparisons. Note that our purpose has never beento grade different commercial products in order to find the best devices. The aim ofour tests were more general, despite of the fact that we found many interesting results
10

CHAPTER 1. INTRODUCTION 11
related to the characteristics of specific AP models which could be used to justify apurchase.
Our work has been completely focused on 802.11b devices. However, the proposedprocedure involves simple tests on basic functionality that is common to APs of otherwireless standards. For this reason, we are confident that our test procedure can be suc-cessfully adapted to APs of any kind of WLAN technologies. Anyhow, an exhaustiveextension of the proposed test procedure to standards different from 802.11b is left tofuture work.
The performance of a single AP is a key factor in order to design and tune wirelessLAN systems. The results from previous work based on mathematical models and sim-ulations, are often not sufficient when planning for real systems. Theoretical modelsshow the performance and limitations of algorithms and mechanisms defined by thestandard. These kinds of results are essential to propose improvements to the standarditself, but of little application to network planning and deployment. On the other hand,real measurements include the effects of the specific implementation policies and ofthe environment. The results from tests on real devices are more useful for real systemanalysis and development.
In particular, our approach to the wireless LAN performance evaluation comes fromthe need of developing and improving an existing large WLAN access system. Sincethe beginning of year 2000, we have developed a large wireless access network basedon IEEE 802.11 technology for the IT-University in Kista1 (Stockholm, Sweden). Theinitial aim of this project was to offer wireless connectivity to a large group of stu-dents, and then we evolved it to a Campus wireless system [1]. Nowadays, we aregrowing our solution to a metropolitan area wireless system [2] due to the Stockhol-mOpen Project2. In order to predict the behaviour of such a large system, we haveoften faced the problem of estimating the local wireless cell performance. The study ofthe available WLAN literature shows the need of making new and different tests. Wefound the need to identify a reference value of maximum throughput for the APs andto justify some anomalous behaviours. In order to fulfill our goal we had to create ourproposed test procedure. This document presents the final result of this process.
The remainder of the report is structured as follows. Chapter 2 introduces the im-portant aspects of the IEEE 802.11 standard and related work. After this, chapter 3defines the target of our measurement, and chapter 4 presents the challenges to per-form such measurements. Chapter 5 presents the statistical framework necessary for acorrect performance analysis producing results with a defined precision. Chapter 6 de-scribes our recommended test procedure providing more details about general 802.11AP behaviours. Chapter 7 shows the performance of the different AP models we tested.Chapter 8 contains our conclusions and chapter 9 addresses some suggested futurework to extend our test methodology.
1IT-University in Kista: http://www.it.kth.se2The StockholmOpen Project: http://www.stockholmopen.net

Chapter 2
Background and Related Work
In this section we present the necessary background and related work. The chapter isdivided into two main sections: the first section presents the most important aspectsof the IEEE 802.11 family standards, with a special focus on the Media Access Con-trol system (MAC). The second section presents related work on IEEE 802.11 perfor-mance. In particular, we firstly examine some articles and academic works. Secondly,we present some white papers on 802.11 performance provided by different WLANvendors.
2.1 IEEE 802.11 OverviewIn this section, we present an overview of the IEEE 802.11 standard with particularemphasis on the Medium Access Control (MAC) part. The 802.11b and 802.11a dif-ferences with respect to the original standard will be presented as well, and the 802.11gwill be pointed as a newer alternative. The main references on this section will be theoriginal IEEE standard documents [4, 5, 6].
2.1.1 HighlightsThe original IEEE 802.11 standard was published in June 1997[4], and it was the finalresult of a long process of integration and standardization of previous wireless LANtechnologies. The IEEE 802.11 scope is to develop a Medium Access Control (MAC)and physical layer (PHY) specification for wireless connectivity for fixed, portable,and moving stations within a local area [4]. Several wireless communication aspectsare covered in this standard. In particular IEEE 802.11
� Describes functions and services required by compliant devices. Note that twomain operational modes are defined: Ad-Hoc (peer-to-peer) and Infrastructure(managed).
� Defines the MAC procedures to support asynchronous data unit delivery withinthe wireless system.
� Defines several physical signalling techniques and interface functions that arecontrolled by the IEEE 802.11 MAC.
� Permits the operation of several multiple overlapping IEEE 802.11 wireless LANs.
12

CHAPTER 2. BACKGROUND AND RELATED WORK 13
� Describes the requirements and procedures to provide authentication of 802.11stations and user data transmission privacy.
The IEEE 802.11 standard has a wide scope and includes alternative MAC modes andprotocols to support a large range of applications. We focus our attention on the infras-tructure mode that was especially designed for implementing wireless access networks.In this kind of applications the access points found their utility.
IEEE 802.11 defines two alternative MAC protocols: the Distributed Coordina-tion Function (DCF), and the Point Coordination Function (PCF). The first protocol isthe largely used and defines a distributed medium access arbitration mechanism. Thesecond protocol has been used only for particular applications; for example point tomulti-points wireless links. This protocol defines a centralized medium access arbitra-tion mechanism. In the next section we present with more details the DCF. No moreinformation is given regarding the PCF, because it is not usually implemented in thedevices we study in this document.
The original IEEE 802.11 standard defines a physical layer including two possibledata transmission rates: 1 Mbps and 2Mbps. A maximum transmission speed of 2Mbps was found too low compared to the users requirements. Therefore, differentgroups developed alternative physical layers to increase the data transmission rates.The work of the different groups produced at different times alternative extensions tothe original 802.11 standard. We examine with more details the three existing IEEE802.11 extension regarding the physical layer in section 2.1.3. Other groups defineddifferent IEEE 802.11 extensions to propose new functionalities and/or services. Wewill not examine these different extensions because they are outside the scope of ourwork.
2.1.2 Distributed Coordination FunctionThe largely used IEEE 802.11 medium access control protocol is the distributed coordi-nation function. This protocol defines a distributed medium access arbitration that canbe used in both the two fundamental IEEE 802.11 operational modes: ad-hoc (peer-to-peer) and infrastructure (managed). It is important to remind that the different IEEE802.11 physical layer extensions did not modify the access protocol.
The DCF implements the carrier sense multiple access with collision avoidance(CSMA/CA) method. Any wireless stations must implement this protocol in order tosuccessfully transmit data on the radio link. The aim of this protocol is to avoid that astation transmits a frame when another one is already using the medium, and minimizethe probability that two stations start to transmit a frame at the same time. The IEEE802.11 defines a basic access system and an extra method (RTS/CTS) to minimize thecollision probability and/or consequences. We first examine the basic access, and thenwe explain how RTS/CTS works.
According to the CSMA/CA any station with a frame ready to be transmitted sensesthe radio channel to determine if another station is already transmitting. If the channelis idle for a defined time (Distributed Interframe Space, DIFS), the station starts totransmit the frame. If any transmission is detected during this initial gap, the stationmust defer to the end of the current transmission. Note that the IEEE 802.11 defines aminimum gap between two consecutive frame transmissions. After deferral or beforetransmitting a new frame directly following a successful transmission, the station mustselect a random backoff interval and decrease the backoff interval counter while themedium is idle. The station that first uses up the backoff time can start to transmit

CHAPTER 2. BACKGROUND AND RELATED WORK 14
Figure 2.1: Backoff procedure according to IEEE 802.11.
the frame. The other stations sense that the channel was busy and defer at the endof the current transmission. Note that when the channel is idle again, after a newDIFS interval, the stations that still need to transmit start decrementing the backoffcounter from the value at which it was previously stopped. Figure 2.1 illustrates thismechanism.
It is important to understand how the backoff time is determined. The IEEE 802.11standard defines a contention window where the station backoff time must be. Each sta-tion has is own contention window with a dimension that can change in a defined rangeaccording to the working conditions. The minimum contention window is defined byIEEE 802.11 and its initially used by any station that wants to transmit a packet. If acollision happens, the stations that produced it must increase their contention windows.After each consecutive collision the contention windows is exponentially extended upto a maximum value also defined in IEEE 802.11. When a station successfully trans-mits a frame, it resets its contention window to the minimum value.
The IEEE 802.11 defines a time slot to use as a unit for the contention widows. Theminimum and maximum dimension of the contention windows is defined through theminimum and maximum number of time slots to use for it. After a collision, the stationdoubles the number of slots of its contention widows up to the maximum possiblevalue. The station’s backoff time is chosen by randomly taking a number of slots in thecurrent range of the contention window.
The IEEE 802.11 requires that any unicast frame must be acknowledged. Thismechanism enforces transmission reliability in the radio link allowing the station know-ing if the frame transmission succeeds and taking proper countermeasures when failing(i.e. to increase the contention window and retransmission of the frame). A specialacknowledgment-frame must follow any unicast frame. This frame is sent from theframe destination to the sender in a prioritized way, thus it directly follows the originalframe transmission. In order to implement this mechanism the acknowledged frameis sent directly after the original frame without any backoff time and with a shorterinterval (Short Interframe Space, SIFS) than the DIFS to anticipate any other stationsthat want to transmit. The basic access mechanism is illustrated in Figure 2.2 .
The basic access performs well as long as all the stations can listen to all the oth-ers and therefore can accurately determine when the channel is busy. If one or morestations are out of the range of some of the others ones, the system might fail. For ex-ample, using infrastructure mode, two wireless clients are at two opposite edges of the

CHAPTER 2. BACKGROUND AND RELATED WORK 15
Figure 2.2: Basic Access Mechanism according to IEEE 802.11.
Figure 2.3: RTS/CTS access according to IEEE 802.11.
AP coverage area. In this case the two clients cannot hear each other, therefore theirtransmissions might collide at the AP. To prevent such a problem, the IEEE 802.11allows adding some extra signalling to the basic access method. A station with a dataframe to transmit first sends a Request-To-Transmit (RTS) frame using the basic ac-cess to request channel. The RTS includes the time that the client needs the mediumfor transmitting the data. The AP reply to a RTS with a Clear-To-Transmit (CTS) mes-sage that includes the time the channel is reserved to the granted transmission (NetworkAllocation Vector, NAV). The client that sent the original request starts to transmit thedata frame after receiving the CTS and waiting a short gap (SIFS). All the other nodesin the AP’s range get the CTS frame; therefore they defer any transmission until the endof reserved time (NAV). Figure 2.3 shows the RTS/CTS mechanism. It is important tonote that the RTS/CTS reduces the hidden nodes collision probability with respect tothe basic access, but does not completely avoid it. The collision can still happen whenthe station try to transmit the RTS frame. However, this frame has a small dimensionand a collision produce a lower impact to the link throughput. The IEEE 802.11 allowsusing a mixed mechanism where long frames are sent using the RTS/CTS system, butnot short ones. In the same radio cell might coexist clients using RTS/CTS and not.
2.1.3 IEEE 802.11 ExtensionsThe original IEEE 802.11 standard defines different physical layers: 2.4 GHz usingDirect Sequence Spread Spectrum (DSSS) or Frequency Hopping (FH), and infrared.However, the highest physical transmission rate was 2 Mbps. Different groups pro-posed extensions to the original 802.11 physical layer to support higher transmissionspeed.
The first group that completed its work was the IEEE 802.11b in September 1999[5]. The IEEE 802.11b defines a new physical layer using the 2.4 GHz radio bandand DSSS or FH. Four data transmission rates are allowed: the two original 802.11(1 and 2Mbps) plus two new ones (5.5Mbps and 11Mbps). The IEEE 802.11b doesnot modify the 802.11 MAC, but for the introduction of the minimum parameters for

CHAPTER 2. BACKGROUND AND RELATED WORK 16
supporting the new data rates. Note that 802.11b guarantees backward compatibilitywith legacy 802.11 devices.
The IEEE 802.11a [6] was published together with the IEEE 802.11b, but only re-cently compliant devices were available. This group produced a completely differentphysical layer with respect to the 802.11 and 802.11b. IEEE 802.11a uses a radio spec-trum in the range of 5 GHz and Orthogonal Frequency Division Multiplexing (OFDM).This standard is not backward compatible with 802.11/802.11b devices, but offers sev-eral different higher data rates: 6, 9, 12, 18, 24, 36, 48 and 54 Mbps. The 802.11a MACis the same of the previous standards, but for the support for different data rates and thevalue of different parameters; for example DIFS, SIFS, contention window slot, etc...
Recently IEEE 802.11g was published providing a new physical layer for IEEE802.11 [7]. This standard was designed to provide high speed (up to 54Mbps) andbackward compatibility with the currently largest used IEEE 802.11b devices. Thisstandard defines a physical layer based on 2.4 GHz radio frequency spectrum and usestwo different transmission type: DSSS and OFDM. The available data rates includethe 802.11b and 802.11a ones; IEEE 802.11g uses: 1, 2, 5.5, 6, 9, 11, 12, 18, 24,36, 48 and 54 Mbps. Note that the data rates corresponding to the 802.11a ones useOFDM, the others use DSSS. Devices using 802.11b cannot sense OFDM transmis-sions. In order to make working together devices using not compatible radio trans-mission modes, 802.11g enforces the usage of a hybrid solution between 802.11 basicaccess and RTS/CTS. The 802.11b devices cannot sense 802.11g high rate transmis-sions, thus CTS frame are sent using 802.11b transmission to notify to legacy devicesthat the channel is taken by other stations. IEEE 802.11g can reach the same perfor-mance of 802.11a only when no 802.11 backward compatibility is enforced. In this lastcase the normal basic access or RTS/CTS are used. Note that the 802.11g and 802.11adevices cannot share the same radio cell because they use a different radio frequencyspectrum.
2.2 Summary of previous work on IEEE 802.11 perfor-mance
The performance of the IEEE 802.11 protocol has been deeply studied in the last years.In this section, we present related work in this topic and we underline important resultsand the limitations that made our investigation necessary.
2.2.1 Papers on 802.11 performance analysisPerformance analysis has always taken an important part of IEEE 802.11 related workfor proving the different theories or validating new proposed models or improvements.In all the papers we present, performance is studied by using simulation or by runningtests on a specific wireless LAN implementation. Simulation has been the best optionto compare the performance of different algorithms. This approach allows skippingdevice implementation details and the effects of a real environment. Instead, tests ona specific implementation are used to verify the performance or specific behaviours incomplex situation (i.e. the performance of higher level protocols over IEEE 802.11protocols) or in a real environment.
We are going to present five different papers related to three different aspects ofIEEE 802.11 performance. The first group of two papers will show different analytical

CHAPTER 2. BACKGROUND AND RELATED WORK 17
models of 802.11 access mechanism. The two works proposed two level of analysiswith different approximation. G. Bianchi [13] used a Markov chain based model tostudy the performance of the 802.11 Medium Access Control technique. Bianchi’smodel works on any 802.11 mode over any available physical layer. Y.C Tay and K.C.Chua [14] proposed a simpler model using average values for stochastic variables. Thissecond model only works when using the 802.11 basic access system.
The second aspect of 802.11 we are going to present is related to the performance ofdifferent higher-level protocols over a wireless link. G. Xylomenos and G.C. Polyzos[16] showed interesting behaviours of a legacy wireless link technology that anticipatedthe IEEE 802.11 and had the same main characteristics. A. Kamerman and G. Aben[15] used a very simple model of the 802.11 MAC layer to study the performance ofTCP/IP and IPX over IEEE 802.11b. The proposed approach is also used to estimatethe performance of IEEE 802.11a.
The third aspect of 802.11 we are going to present is about IEEE 802.11 AP perfor-mance evaluation. I. Al Khatib [17] proposed an analytical model for the IEEE 802.11access points evaluation, this model is based on queuing theory.
2.2.1.1 IEEE 802.11 Medium Access Control performance
G. Bianchi in [13] proposed an analytical study of the 802.11 Medium Access Control(MAC) performance based on Markov chains. The goal of the proposed model was toestimate the throughput of the 802.11 MAC. In this article, throughput was defined asthe fraction of the time the channel is used to successfully transmit payload bits [13].The complexity of the system imposed the author to restrict the scope of his model. Themost important assumption was to concentrate the work on the “Saturation Through-put”. Bianchi defined this concept as: “the limit reached by the system throughput asthe offered load increases”[13]. This value represents the maximum load the systemcan carry in stable conditions [13]. Bianchi’s model is valid with the assumption ofideal channel conditions (i.e. no hidden terminals, good signal quality). Thus, duringthe analysis, the author assumed a fixed number of stations in a short range that alwayshave a packet to transmit.
The 802.11 Medium Access Control analysis is divided into two parts. First,Bianchi studied the behaviour of a single station. A Markov chain based model wasused to compute the stationary probability that a specific station transmit a packet in ageneric slot time. The throughput is expressed by studying the possible events withina generic slot time as a function of the probability previously modelled. The proposedmodel is true when using both 802.11 access methods: basic and RTS/CTS and even inthe case of a combination of the two systems. Bianchi’s model was validated using theresults of several simulations. For simplicity, the article presented investigations aboutdifferent cases where either the basic access system or RTS/CTS were used. Hybridsolutions, using basic access and RTS/CTS together were not studied. Moreover, allthe investigations supposed the transmission of packets of a fixed size (1500 bytes).
Bianchi’s analytical model features parameters to model the different aspects of theMAC layer, in particular the contention window. The IEEE 802.11 standard fixes thevalues of many physical and link layer protocol parameters. Depending on the physi-cal medium in use (Infrared, Direct Sequence Spread Spectrum (DSSS), or FrequencyHopping Spread Spectrum (FHSS)) specific values are defined for the minimum andmaximum number of slots for the contention window, and the length of a single slot.Unfortunately, the author decided to use for his analysis the values relative to the FHSS.Thus, the contention window is larger in terms of number of slot and time length of the

CHAPTER 2. BACKGROUND AND RELATED WORK 18
slot than the DSSS case. Nowadays, the most commonly used physical medium isDSSS. As a consequence, the results and analysis reported in Bianchi’s articles [13]cannot be used to predict the behaviours of current 802.11 networks. Bianchi’s analyt-ical model is still valid, but a re-computation of the results with the DSSS parametersis necessary.
We would like to underline two interesting general results of Bianchi’s paper. First:small changes in the contention window strongly affect the overall performance in re-lation to the number of stations. Those parameters are fixed in the 802.11 standard.However, some current AP implementations1 allow the change of the contention win-dow characteristics in order to provide a sort of quality of service to different packettypes. A second result is that RTS/CTS has better performance than the basic accesscontrol system. This result seems to be contradictory to the results of other studies, butBianchi analysis in [13] was focused on a different physical layer and it was applied tospecific working conditions.
Y.C. Tay and K.C. Chua in [14] proposed a simple analytical model of the 802.11Medium Access Control mechanism. Instead of using stochastic analysis, this modelpresets the average values for variables when possible. The proposed model can beused under almost the same conditions as the Bianchi one [13]. However, Tay andChua restricted their model validity to only the basic access system. Multiple stationswere supposed to share the wireless channel without a coordinating base station (peer-to-peer mode was used) and without hidden nodes. The saturation throughput wasanalyzed. Thus, each wireless station always had a packet to transmit.
In order to validate the new model, Tay and Chua used the same simulation tooldeveloped and used by Bianchi in the article presented above. The resulting model ismuch simpler than the Bianchi one. However, it provided accurate results according toperformed simulations and compared to Bianchi’s results. The fundamental assump-tions of the Tay and Chua model are that the collision probability is very low (maximum0.5) even in saturation condition, and the back-off time is approximated to half of thecontention window (average value of the uniform probability distribution) [14]. Evenin this case, this throughput analysis cannot be used for current 802.11 APs. The au-thors computed the throughput on a FHSS physical medium in order to compare theresult of their model to Bianchi’s. A new throughput computation of the results of [14]is necessary to get a DSSS throughput analysis.
Tay and Chua showed the utility of their model demonstrating some characteristicsof the 802.11 medium access control. In particular, they showed that:
� The probability of a collision only depends on the number of transmitting sta-tions and the minimum and maximum dimensions of the contention window.However, the choice of the maximum window size has minimal effect on thecollision rate and saturation throughput,
� The saturation throughput depends on both the number of transmitting stationsand the minimum contention window in equal amounts. Thus halving the ini-tial contention window size (minimum size) is similar in effect to doubling thenumber of transmitting stations. In general, the maximum saturation throughputis a trade-off between bandwidth wastage by collisions and backoff. For a largenumber of transmitting stations, the saturation throughput can be approximatedby a simple formula which only includes the number of stations, the initial con-
1For instance Cisco Aironet 1200 series 802.11 APs. http://www.cisco.com

CHAPTER 2. BACKGROUND AND RELATED WORK 19
tention window and the time used for the protocol overhead such as the time tosend acknowledgments, DIFS, SIFS, etc...
� For throughput maximization: the initial value of the contention window shouldlinearly increase with the number of transmitting stations and be proportional tothe square root of the packet size (in number of time slots).
2.2.1.2 Network and transport protocols performance on IEEE 802.11
G. Xylomenos and G.C. Polyzos in [16] investigated the performance of TCP and UDPtransport protocols over Lucent WaveLAN radio technology. Lucent WaveLAN prod-ucts were first released in the early ’90s, before the IEEE 802.11 standard was ap-proved. The initial WaveLAN products used 900MHz radio frequency, then a 2.4GHzDSSS at 2Mbps version was also released before the IEEE 802.11 publication. Thissecond kind of device is the one used for the tests presented in [16]. The first 2Mbps2.4GHz WaveLAN used a radio and link layer very similar to the IEEE 802.11 final re-lease, but with some important differences. Firstly, Lucent WaveLAN did not use linklayer frame acknowledgments. The transport layer instead of the MAC layer handledtransmission errors and undetected collisions therefore the radio link was not reliable.This important difference makes the performance measurements provided by G. Xy-lomenos and G.C. Polyzos in [16] not comparable with the performance of currentIEEE 802.11 compliant devices. Moreover, many effects described and measured in[16], especially for TCP are not exportable to the IEEE 802.11 technology.
Despite the big difference in the technology, there are many valid aspects in Xy-lomenos and Polyzos article regarding the test procedure. Their focus was on perfor-mance measurements on real devices. Thus, tests were performed in order to measurethe effective throughput in different and realistic scenarios. Particular or unexpectedbehaviours were further analyzed and then explained by parsing the test results andlogs. The WaveLAN devices utilized peer-to-peer (Ad-Hoc) mode; no APs were used.Xylomenos and Polyzos tried to mix different kinds of hardware platforms using sta-tionary computers and laptops, and several radio device implementations (PCMCIAand ISA radio interfaces). The problem of the repeatability of the tests was addressedwith the chosen solution being one of the most commonly used (see section 2.2.2:IEEE 802.11 White Papers). Tests were performed in a few different selected placesin a real environment (some rooms in a university building). Moreover, the radio linkstatus was monitored during the different sessions and the recorded values are providedin [16] to show the global radio signal quality during the tests. Because the high vari-ance of the test results, each single test session was repeated five times and the mean,the maximum and the minimum values reported. Note that, Xylomenos and Polyzosmeasured and analyzed the end-to-end UDP and TCP throughput over the radio link.This implies, the performance of the end machines (sender and receiver), the differentdrivers, operating system and even the specific transport and network protocol imple-mentations were included into the analysis. This kind of approach is understandable,but forced the authors to consider many factors into the interpretation of the results.According to this kind of approach, the overall end-to-end performance of the wirelesssystem is studied, not only the specific wireless part.
A. Kamerman and G. Aben in [15] analyzed the performance of TCP/IP and IPXover IEEE 802.11b using the basic access system and RTS/CTS. The authors studiedthe 802.11 medium access control mechanism and provided a raw model of the wirelesslink capacity. Kamerman and Abel’s model only considers the different overheads and

CHAPTER 2. BACKGROUND AND RELATED WORK 20
payload transmission time. The backoff time is always zero producing an unrealisticcontinuous packet transmission stream. The authors ran some tests to validate theirmodel. The tests were performed sending TCP or IPX data from a server connected toan Ethernet link to one or more wireless stations through an AP. The tests were donetransferring a large file using a tool called Chariot2. Note that, not many details areprovided in [15] about the performed tests. However, the tests were run in an optimalenvironment and the effects of the produced traffic were examined on both sides of theAP: Ethernet and 802.11b radio link. The screening of the traffic on the wireless linkwas performed with a network analyzer. This technique allowed Kamerman and Abento study the behaviour of the radio link and integrate the first raw MAC model results.Unfortunately, no details are given in [15] about the tools used to monitor the radiolink.
Kamerman and Aben measured the performance of IEEE 802.11 using their modeland comparing the results with real measurements on a specific 802.11 system. Inparticular, they simulated and measured TCP/IP 802.11b cell’s throughput using 1, 3and 5 clients. They separately simulated the behaviour of each 802.11b available datalink. Therefore, during the measurements they forced the AP and wireless clients touse only one data link rate: 1 then 2, 5.5 and 11 Mbps. The tests and simulations wererepeated for the two different 802.11 access protocols: basic access and RTS/CTS.Kamerman and Abel do not provide any exact value of the throughput they measured,but some figures. The pictures shows that for the available data link rates (1, 2, 5.5and 11 Mbps) using the basic access the respective measured throughput was around:0.8 Mbps, 1.5 Mbps, 3.3 Mbps and 5 Mbps. When using RTS/CTS, they measured anapproximate throughput of: 0.9 Mbps, 1.4 Mbps, 2.9 Mbps and 4.1 Mbps. Note that inboth cases the aggregate throughput only slightly increased with the number of clientsand that measured and simulated values were very closed.
The test that Kamerman and Abel performed generated not symmetric bidirectionaltraffic on the wireless link. The downstream (AP to wireless station) was made of bigpackets (almost all of 1500 bytes of link payload). Only small TCP Acknowledgepackets were sent into the other direction. Note that, using 802.11b at 2.4 GHz DSSSphysical level, the performance of a transport protocol as TCP is better using the basicaccess system than RTS/CTS.
The authors run the same kind of test and simulation using IPX instead of IP net-work protocol. In this case each single packet at transport protocol needs an acknowl-edgment; IPX does not use transmission windows techniques as TCP/IP. The perfor-mance in this case is different compared to the previous one. Mainly, the channelcapacity could not be saturated using a single wireless station.
An interesting result by Kamerman and Abel is the analysis of the 802.11b band-width usage. This analysis is generated integrating the proposed MAC model and the802.11b traffic analysis during the performed tests. This analysis shows that the over-head of the different network layers of the wireless link quickly increases with the datalink rate. Therefore, the percent of the raw data bandwidth used by real payload trans-mission decreased with faster data link rates. The authors extended the results of theirinvestigation on 802.11b to the case of 5GHz 802.11a. Even in this case the differentoverheads due to link layer 802.11 protocol takes an increasing percent of the avail-able bandwidth with faster link rate. According to Kamerman and Abel results, IEEE802.11a using 54 Mbps link rate cannot produce more than around 28 Mbps TCP/IPthroughput. No 802.11a implementation was available at the time the paper was pre-
2Chariot 3.1, Ganymede Software Inc., http://www.ganymede.com/html/chariot.html .

CHAPTER 2. BACKGROUND AND RELATED WORK 21
sented, so no validation was provided for this last result.
2.2.1.3 Performance of 802.11 Access Points
Al Khatib presented an interesting study on the 802.11b AP performance [17]. Theaim of his work was to design a simple analytical model of an IEEE 802.11 AP. Theresult was a single FIFO (First In First Out) queue model with a single server system.According to this scheme, all the packets coming from both interfaces (Ethernet and802.11) go into a single queue. The packets are served one by one and send out to theappropriate media. Different APs have different performance that produces differentvalues for the system parameters. The main focus of this work was to study the packetdelay introduced by the AP. In a second step, the system throughput was computedfrom knowledge of the packet delays.
Experimental measurements were made to obtain the total delay introduced on thepackets when passing through an AP. This total delay, Response time (R) accordingto Al Khatib’s notation in [17], is the time difference between the departure time andthe arrival time of the packet. The departure time is the time instant when the last bitof the packet leaves the system. The arrival time is the time instant when the last bitof the packet enters the system. Note that the response time is the sum of two mainterms: the Waiting Time (W) and the Service Time (S). W is the time a packet spendsin the service queue. S is the time the system needs to handle the packet and forward it.According to the previous definitions, the time spent by the packet to enter the systemis not considered. Instead, the time to transmit the packet on the destination media isincluded into the response time. This transmission time adds to the service time. AlKhatib estimated the waiting and service times of each packet by studying the arrivaland departure time of all the packets sent during a test session. The service time ofa specific packet has been approximated as the difference of the departure time of thepacket and the departure time of the previous one. The conclusion of this work wasthat the service time is a linear function of the packet payload [17].
According to Al Khatib’s analysis, the large difference of the Medium Access Con-trol of the two media used by the AP, Ethernet and 802.11, produces different servicetimes. The higher complexity of the IEEE 802.11 MAC makes the downlink (Ethernetto 802.11b) service time longer than the uplink (802.11b to Ethernet) one. Al Khatib’smeasurements in [17] showed this kind of behaviour and underline an interesting phe-nomenon. The difference between the uplink service time and the downlink servicetime is not a constant value but depends on the packet size. Al Khatib defined theuplink-downlink Contrast (UDC) as: “the absolute value of the difference between theuplink and downlink service time in relation to the packet size”[17]. There are im-portant differences in the service time and UDC due to specific AP implementations.Packet service times vary from AP to AP. Moreover the UDC behaviour changes on dif-ferent APs. Some kinds of AP show a convergent UDC that means the UDC decreaseswhen the packet size increases. Other APs show an opposite behaviour. In particu-lar, Al Khatib showed that the Lucent WaveLAN Point-II has a convergent UDC, theOrinoco AP2000 a divergent one.
In order to study the AP throughput, Al Khatib proposed a different model of thesystem. The AP was modelled as a data link with variable bandwidth. The instantbandwidth was defined as the link layer dimension in bits of a packet divided by its timeof arrival to destination minus the time of arrival to destination of the preceding packet.Al Khatib showed that the bandwidth could be computed with knowledge of the servicetime. The service time of a packet into the AP depends on the packet size. Thus the AP

CHAPTER 2. BACKGROUND AND RELATED WORK 22
bandwidth is not constant, but depends on the packet size. Moreover, the bandwidthdepends on the stream direction: downlink or uplink. After studying the bandwidth, AlKhatib studied the maximum throughput of the APs defined as the user payload dataover the time needed to transmit it on the link. Al Khatib showed that the throughputis directly proportional to the bandwidth. The purpose of Al Khatib work was not toexactly measured the uplink and/or downlink throughput of different APs, but studytheir behaviours. However, according to Al Khatib’s results Lucent WaveLAN Point-IIproduced a maximum downlink throughput around 3.9 Mbps. Instead the Orinoco AP2000 produce and maximum throughput of 5.4 Mbps. Note that Al Khatib producedan analysis of the throughput versus packet size.
2.2.2 IEEE 802.11 White PapersThe main source for IEEE 802.11 device performance measurements are product brochuresand white papers provided by device producers. Product brochures are too concise andpartial whilst white papers are usually more complete and often propose interestingmethodologies. In this section we are going to present white papers from different802.11 producers, these documents show the performance of different evolutions ofthe main 802.11 standard.
The first paper is taken from the Proxim Inc. web site [8] and presents the perfor-mance of the Lucent Inc. WaveLAN 802.11 products3. This document aims to demon-strate that WaveLAN 802.11 products can be successfully used to provide wirelessnetwork connectivity in different scenarios. At the time the report was first published,802.11 devices had just been marketed and were not well known. Many techniciansworried about the real usability of the 802.11 technologies. The main reservation wasthat interferences and different environmental effects could prevent the use of suchradio technology in many situations. The Lucent report shows WaveLAN productsperformance in normal and critical scenarios. Moreover, throughput measurementswere taken to quantify the normal performance and the effect of different forms ofnoise and interference. The second paper is taken from the Atheros Inc. web site[9]. Atheros Inc. was the first manufacturer providing integrated circuits implement-ing IEEE 802.11a. This paper was published before the commercial 802.11a deviceswere available on the market. The radio spectrum around 5GHz used by 802.11a wasexpected to provide a much smaller cell than the 2.4GHz used by 802.11b. Because ofthe used radio spectrum, 802.11a real throughput was also expected to quickly decreasewith the distance making 802.11b better performing already in a medium range. Thisreport aims to demonstrate that the previous convictions were wrong and to show thebetter performance of 802.11a compared to 802.11b. Intersil Inc. published on its website [10] a white paper on the newest IEEE 802.11g standard performance. Through-put versus range measurements are presented to compared the performance of the 2.4GHz Orthogonal Frequency Division Multiplexing (OFDM) 802.11g radio technologywith the 5 GHz still OFDM 802.11a one. The last white papers we examine are takenform Atheros Inc. web site and were later published with respect to the previous one[11, 12]. These last paper focus on 802.11b, 802.11a and 802.11g performance anal-yses and they present a general test methodology and some test result providing crosscomparisons of the different technologies.
All papers we examine have some common aspects. All of them try to demonstrate
3Proxim Inc. bought in August 2002 Orinoco. Before Orinoco was part of Agere that was a spin off ofLucent Inc. developing the original WaveLAN products.

CHAPTER 2. BACKGROUND AND RELATED WORK 23
the good performance of a specific 802.11 related standard and performance is mainlythroughput versus range. The study of the throughput versus the range for WLANtechnologies presents many difficulties. Throughput can be measured using differentmethodologies, but the range is something much harder to model. The papers wepresent use a common test procedure to measure the throughput at different ranges. Ina realistic environment, as an office area in a building, different locations are selectedspread in a uniform mode around the test area. An AP is placed in a fix position, thatusually is one corner of the test area, and a client is placed at the previously selectedpositions. A throughput measurement test is performed once per selected location foreach technology. Finally, statistical indexes of the test results are presented to showthe different behaviours. This approach aims to prevent common objections regardingthe fact that is almost impossible to define and fix the radio signal quality at the testtime. The area layout (dimension, shape and characteristics of the rooms), the buildingmaterials (different kind of walls, glass, etc...), the natural variance of the radio signalin the gigahertz range, and possible radio sources of interferences make impossible todefine standard and repeatable test condition. By using a realistic environment (i.e.office areas) and selecting in a pseudo stochastic way the test locations, the authors tryto show that the test was objective. However, the described approach does not providea repeatable testbed. It is not possible to repeat the measurement in any other place andexactly reproduce the same test conditions. Note that in the studied white papers noindication of the radio signal quality in the different test location was given. Thus therange remains an ambiguous quantity.
The testbeds used in the different experiments were similar, but completely differ-ent were the system used to measure the data throughput. In the first case [8], the APwas connected to a Novel NetWare server and a NetWare client run the correspond-ing client. The available wireless throughput was measured using a Novel NetWaretool called perform3.exe. No more information is given about the generated traffic.The Atheros paper proposes a different system to estimate the 802.11 throughput. Byknowing the link layer Packet Error Rate (PER) is possible to calculate the maximumthroughput using a specific mathematical model of the 802.11 standard. This modelincludes the performance of the 802.11 standard, the radio performance of the devicesin use and the environmental condition. Other effects due to the specific device im-plementation, packet collisions and multiple clients are not considered, so the result isone maximum possible throughput. In order to calculate the PER, 100 broadcast (i.e.not acknowledged frames in the 802.11 link layer) packets were sent to the client. Thepercentage of lost packet during the test session gives the necessary PER value. Notethat no information is provided about the total time of a test session (i.e. the senderpacket rate). The Intersil white paper does not provide any information about how thethroughput was measured.
The white papers we present show two common limitations that affect the credi-bility of the results. Firstly, each single test is performed only once, or only one resultis considered and no many details are given about the duration of the performed tests.This kind of experiment usually generates results with a high variance. Thus, the deci-sion of using a single sample of unknown characteristics per test is open to criticism.Related work such as articles or academic works shows an alternative approach. Forexample: in [16] each test session was repeated five times to estimate the variancebetween runs. The second limitation is that the performance of the different wirelessstandards is analysed measuring the performance of a single, often not well-identified,commercial solution.
In the Atheros paper [9], the throughput samples taken at the selected positions for

CHAPTER 2. BACKGROUND AND RELATED WORK 24
the different radio technologies were elaborated to provide a cross comparison of thetested solutions. This paper [9] firstly compares the 802.11a physical layer and avail-able data links with the 802.11b ones. Secondly, it compares the produced throughputof the 802.11a and 802.11b. The first goal is achieved comparing of best data link rateversus range for 802.11a and 802.11b. The authors compare the throughput medianover the measured samples versus the range per available data link. The conclusion isthat 802.11a is more performing than 802.11b because the different available data linkrates are more performing at each range. However, many details are not reported, themedian index may be appropriate, but without any further information cannot be usedas an absolute performance index. The Atheros paper compares the produced through-put versus range of 802.11b and 802.11a. The document shows diagrams where thedifferent throughput values are shown, and it says that the reported throughput sampleswere “binned and averaged”[9] to produce the shown results. Thus, we can considerthe reported throughput as a sort of best possible performance at any range. The high-est 802.11a throughput (at close distance) is around 27Mbps. Instead, 802.11b has amaximum throughput of around 6 Mbps. The throughput of both standards decreasewith the range, and the 802.11a throughput decreases faster than the 802.11b one, butit is always the higher.
The Intersil [10] white papers use an approach to compare the performance of802.11a and 802.11g similar to the previous Atheros paper, but no explanation is givenabout the throughput measurement procedure. This paper provides the results of thethroughput measurement at different locations in an office area using 802.11a and802.11g devices. The 802.11g showed overall better performance than and 802.11a.The maximum measured value of the 802.11g throughput was around 22Mbps. In-stead, the 802.11a had a maximum throughput of 17 Mbps. The performance of thetwo technologies decrease with the range, but the 802.11a performance decreases fasterthan the 802.11g one. Despite the maximum throughput measured values, the authorsconcluded that the two technologies have the same performance in a short distancerange [9]. Note that the authors of this paper presented a second remarkable con-clusion: 802.11a provides the highest system throughput, 802.11g provides the bestcoverage with comparable throughput. This conclusion is supported by the fact that802.11a provides 9 radio independent channels versus only 3 channels for 802.11g.Therefore, the small 802.11a cells made this technology more suitable for large sys-tem providing service to many users. IEEE 802.11g is more suited for smaller systemwhere few users are spread around a large area.
During the Summer 2003, Atheros Inc. published in its Internet home page4 twomore white papers about IEEE802.11 a/b/g performance evaluation and test methodol-ogy. The first paper “Methodology for Testing Wireless LAN Performance” [11], pro-vides some guidelines for testing 802.11 devices. The second paper “802.11 WirelessLAN Performance” [12], provides some test results produced using the methodologypresented in the previous paper. Because of the clear relations between the two papers,we are going to examine them together. Note that, the two Atheros papers focus on802.11 system throughput versus range.
The main organization of the papers is the following. First, the authors introducedthe factors affecting the 802.11 throughput and coverage. Second, the authors presentan estimation of the maximum theoretical 802.11 throughput. Finally, they provide amethodology to benchmark a real system. In the second paper, different Atheros based802.11 solutions are compared using the proposed methodology.
4Atheros Inc. http://www.atheros.com

CHAPTER 2. BACKGROUND AND RELATED WORK 25
According to Atheros’s white papers, the factors that limit the 802.11 throughputand coverage are:
1. 802.11 Protocol: the effective protocol throughput is lower than the availablelink rates because:
(a) Protocols headers (802.11 frames header, IP headers, TCP/UDP headers,etc...)
(b) 802.11 acknowledgment packets
(c) Medium Access Control protocol (i.e. contention window and back-offtime).
2. Radio environment:
(a) Radio energy attenuation with propagation
(b) Antenna’s design (i.e. antenna performance)
(c) Fading effects due to radio scattering and multi-path
(d) Radio interferences because other devices using an overlapping spectrumor other sources of radio noise.
3. Frequency (2.4GHz for 802.11b/g, 5GHz for 802.11a):
(a) Antenna design. In general antennas of the same physical size tend to getmore directional as the frequency increases (Advantage 5GHz)
(b) Absorption due to propagation through objects tends to increase with fre-quency. (Advantage 2.4GHz)
(c) Scattering around objects might have a positive or negative effect on signalstrength as a function of frequency (Advantage Neutral)
(d) Noise generated by other electronic/radio devices (Advantage 5GHz), and
(e) Cable loss increases with the frequency making more critical the link be-tween the radio modem and the antenna. (Advantage 2.4GHz).
4. Vendor equipment design, and interoperability.
The Atheros white papers provide an estimation of the maximum theoretical through-put when using different 802.11 standards, see Table 2.1 from [11, 12]. Unfortunately,the documents do not give details about how these values were computed. The authorsexplain that the maximum throughput is relative to a stream of IP packets of 1500 bytestransmitted using 802.11 basic MAC protocol (not RTS/CTS) in optimal radio channelconditions (close range, no radio interferences) without any transmission errors.
The Atheros white papers proposed the following test methodology. As first step,it is necessary to identify the kind of area where the tests should be conducted. Threedifferent scenarios were identified:
� outdoor
� open office
� closed office.

CHAPTER 2. BACKGROUND AND RELATED WORK 26
Num
ber
ofch
anne
ls
Mod
ulat
ion
Max
imum
Lin
kR
ate
Max
imum
TC
PR
ate
Max
imum
UD
PR
ate
802.11b 3 CCK 11 Mbps 5.9 Mbps 7.1 Mbps
802.11g (with 802.11b) 3 OFDM/CCK 54 Mbps 14.4 Mbps 19.5 Mbps
802.11g (only g) 3 OFDM/CCK 54 Mbps 24.4 Mbps 30.5 Mbps
802.11a 19 OFDM 54 Mbps 24.4 Mbps 30.5 Mbps
Table 2.1: Atheros Inc. estimation of the maximum theoretical application-level throughput provided bythe different IEEE 802.11 standards. The values are taken from [11, 12].
The 802.11 capacity is expected to vary a lot when changing between the different pos-sible areas. The authors recommend identifying the most likely scenario and focusingon it. The relative performance and throughput for different products should be similaracross the different environments. Therefore, if AP1 is significantly better than AP2outdoor, most probably, AP1 is better than AP2 even in an open or close office.
In order to practically perform the tests, the Atheros papers address a large set ofwell-known tools for throughput measurement. For example: Chariot or Qcheck fromNetIQ, a generic ftp client/server system, or Netperf from HP labs. The throughputshould be measured in 4 different conditions related to the two possible main trafficdirections: uplink or downlink, using TCP over IP or UDP over IP. However, the mostimportant kind of test was identifying the downloading throughput using TCP. Theauthors recommend this test because it is the most common scenario in real systems.
To produce an exhaustive comparison of different 802.11 systems, the authors rec-ommend running tests mixing devices from the same vendor and not according to apredefined scheme. First AP and clients from the same vendor, then AP from one ven-dor and clients from a different one. Finally, APs from different vendor with the testedclient. In order to compare performance of different products from several vendors, itis necessary to run a large number of tests.
The final step for the test preparation is to choose the set of test locations. First thelocation of the AP is selected inside the test area. The AP location must be the same forall the APs to test. Second, an unused and radio interferences free channel is selectedfor the test. Finally it is necessary to select a set of locations for the 802.11 client. Theminimum recommended number of different locations is eight. The range should varyfrom a minimum value of three feet (the authors recommended five feet as minimumdistance), up to the coverage edge. At least one location should be fixed on the rangeborders.
A throughput test session has to be performed according to the recommend proce-dure of testing tool in use. However, each single test session should be short, but thetest has to be repeated at least 3 times per client location. After each test session, theauthors recommend to slightly move the client and/or turn it 45 degrees or more. It isrecommended to test throughput with TCP/IP using both traffic directions: download-ing or uploading. Tests using UDP/IP are considered optional.
The presented results are significant, and it is important to note the effort the authorsinvested proposing a general, easy and reproducible method for testing 802.11 prod-

CHAPTER 2. BACKGROUND AND RELATED WORK 27
ucts. Despite the large improvement compared to the test methodologies proposed bythe previously examined white papers, this paper proposed methodology is not novel,and presents some problems. The use of general purposes throughput measurementstools, plus the choice of recommending the use of TCP/IP demonstrate the intention oftreating 802.11 as a wire-based technology. We believe that the 802.11 specific char-acteristics, and its general performance instability cannot be completely addressed inthis way. The Atheros white paper recommended to repeat the same test session atleast three times and to move the client after each test session. This was done in orderto try to include in the standard throughput measure procedure some of the stochasticbehaviour of the 802.11 link. However, the test reproducibility is limited by the factthat any environment is unique. Running the proposed kind of tests in two differentbuildings, you will result in two different measured values.
We found important two notes reported in these Atheros papers. The first one isabout 802.11g. This standard provides backward compatibility with previous 802.11b.When using 802.11g with 802.11b back-compatibility, 802.11g stations use a specialMAC protocol sending CTS messages before transmitting a packet to notify to 802.11bclients that the channel will be used to avoid collision. This procedure is necessarybecause 802.11g stations use OFDM radio channel modulation that 802.11b stationscannot decode. An alternative solution is to use normal RTS/CTS protocol, but the au-thors of the Atheros paper believe it will affect the performance even more. The secondnote is about the maximum throughput of some 802.11b products. Using some specificvendor solutions, it might happen to measure a throughput higher than the maximumtheoretical one. The high performance happens because some producers reduce thestandard 802.11b back-off time to increase performance risking interoperability prob-lems. We are going to analyze the behaviour of some APs that implement this kind ofsolution.

Chapter 3
Maximum SaturationThroughput
In this chapter, we provide the definition of the maximum saturation throughput of an802.11 AP. This quantity is a key figure of merit of the IEEE 802.11 AP and is the goalof our measurements. The chapter is divided in three sections. The first section presentsthe definition of maximum saturation throughput. The second section describes thenecessary conditions to produce the maximum saturation throughput on an AP and howto achieve them. The third section explains why the maximum saturation throughput isan important figure of merit for the 802.11 APs.
3.1 Saturation Throughput definition and importance
3.1.1 Access Point’s ThroughputThe throughput in data communication systems is traditionally defined as the ratio ofan amount of data over the time needed to transfer it. We aim our investigation to theperformance analysis therefore data is the successfully received (i.e. usable) amount ofinformation. Thus, we use the general formula:
T hroughput � Received DataTransmission Time
(3.1)
The previous general formula needs to be further clarified by detailing what weconsider “Received Data” and “Transmission Time”.
We define “Received Data” as the amount of 802.11 payload data successfully re-ceived by the destination node expressed in number of bits. The IEEE standard 802.11specifies a link layer protocol and regular AP devices are bridges between two differ-ent link layers: Ethernet and IEEE 802.11. The payload transported in the link layerframes represents the service the AP offers, therefore we aim to measure a quantitycommonly defined as goodput.
Despite the fact that we want to measure the link layer throughput, we need touse some kind of network and transport protocol for generating the test stream and per-forming the experiments. We decided to use UDP over IP. TCP over IP uses end-to-end
28

CHAPTER 3. MAXIMUM SATURATION THROUGHPUT 29
control mechanisms and produces bi-directional traffic. The TCP/IP and 802.11 linkcharacteristics combine producing complex results. UDP/IP is a simpler and lighterprotocols combination that better matches our requirements.
The “Transmission Time” is the unit of time used for computing the throughput,and we measure it in seconds. Using a small time unit, you might expect to measurethroughput values with a large variance. On the contrary, using large time units, youmeasure an average behaviour. In the first case, you get sharp values close to the edgesof AP capacity range, but you have to collect a large population of samples to computethe average behaviour of an AP. In the second case, you already measure an averagecapacity of the AP, but loosing short time behaviours of the 802.11 system. Both theprevious kinds of results are useful to characterise the AP performance. We do notfurther investigate this problem in this chapter. Instead, we deeply analyse the optimaltime unit dimension to measure the throughout of 802.11 APs in chapter 5.
3.1.2 Saturation Throughput DefinitionThe previous sub-section provided a generic throughput definition. In this sub-sectionwe express the specific kind of throughput that we aim to measure.
In our work we concentrate on the “Saturation Throughput” of the 802.11 accesspoints. This is a performance figure define as the throughput produced by the AP insaturation and stable conditions, i.e. the AP’s transmission queue is always non-emptyand it is working in a not transient condition. Thus, the AP continuously transmits andits transmission queue has always at least on packet ready to be transmitted.
The value of the saturation throughput of a particular 802.11 AP is not a constantvalue independent from external conditions. In fact, many factors might influence thesaturation throughput performance of an 802.11 APs making its value varying in alarge range. We focus our work on measuring and analysing the maximum saturationthroughput of the APs. Therefore we need to enforce all the necessary conditions inorder to maximise the saturation performance of the 802.11 APs. We investigate theconditions to maximise the saturation throughput in section 3.2. The next sub-sectionillustrates why the maximum saturation throughput is a key figure of merit for 802.11APs.
3.2 Conditions to maximise the AP’s saturation through-put
The IEEE 802.11 AP and radio-link performances depend on different factors related tothe environmental conditions and the IEEE 802.11 Medium Access Control protocol’smodes and configuration parameters. In this subsection we present the most importantfactors that might influence the system saturation throughput and we illustrate how itis possible to maximise the performance.
3.2.1 IEEE 802.11 Radio Performance MaximisationThe performance of the IEEE 802.11 radio data link depends on many environmentalfactors:
� Distance between the different radio stations (i.e. radio signal attenuation withpropagation).

CHAPTER 3. MAXIMUM SATURATION THROUGHPUT 30
� Presence of noise or radio channel interference sources.� Physical obstacles like walls, windows, furniture, etc...� Radio signal reflections (radio signal multi-paths and scattering).
All these factors are important contributors to the entire system behaviour. In orderto maximise the AP’s saturation throughput, it is necessary to create the best possibleenvironmental conditions:
� No 802.11 radio channel interferences.� Short distance between the different wireless nodes (but higher than the mini-
mum recommended one).� A small environment to minimise radio multi-paths effects. Note that the optimal
test environment should be an open outdoor space with no obstacles, but it isnot practically achievable. Instead, a small and close environment represents agood compromise. In fact large indoor environment maximize the effect of radiomulti-paths [8].
To achieve the previous conditions, we recommend running the experiments in an en-vironment with no active APs, except the one under test. The radio spectrum needs tobe previously scanned using proper 802.11 software tools. Non-802.11 radio devicesmay still interfere with the AP under test. For example: microwaves-ovens, cordlessphones, etc... Unfortunately, the presence of this kind of radio sources cannot be di-rectly detected with normal 802.11 site surveillance software tools. Radio frequencyanalysers are expensive and difficult to use. Therefore, we recommend monitoring the802.11 signal and noise levels using 802.11 software tools during the test sessions.Anomalous noise or signal levels during a specific test could indicate the presence ofdifferent radio sources interfering with the tested system, and suggest invalidating theresults of the test session in progress. In the next section we examine again this problemproviding more details and test results.
All the wireless nodes used for the test have to be placed in a single small room,such as an office. No obstacles should be between the radio stations and their relativedistance must be short, but higher than the minimum recommended by the vendor. Insuch conditions you can presume optimal radio performance: maximum signal level,minimum signal multi-paths and scattering effects.
Despite the effort we put to find and achieve the best possible test condition, it isimportant to note that there is no set of recommendations that can absolutely guaranteethe best condition at any time. In fact the radio spectrum used by 802.11 devices isextremely sensitive to many environmental factors, even to small objects present in thetest environment. The signal quality changes in an unpredictable way with location andtime, and even air and temperature conditions. Our test environment recommendationsaim to provide a general framework to select a proper location for measuring the APsperformance. However, preliminary tests are always recommended to verify that thechosen environment has the proper characteristics.
3.2.2 IEEE 802.11 Medium Access Control Performance Maximi-sation
The 802.11 Medium Access Control protocol’s characteristics impose additional con-straints to maximise the AP’s saturation throughput.

CHAPTER 3. MAXIMUM SATURATION THROUGHPUT 31
The IEEE 802.11 standard defines two different modes for the access control mediumprotocol: basic access and RTS/CTS (Request-To-Transmit/Clear-To-Transmit) [6].
In order to achieve the maximum saturation throughput, we recommend performingthe test using the basic access mechanism. According to the related work (Kamerman[15]), using 802.11b the basic access system provides higher performance in a com-parable test condition. Moreover, related work about others 802.11 standard uses thebasic access system because it is considered the best for performance [15].
Related work also shows that the 802.11 throughput depends on the packets size.Under optimal radio conditions, the larger are the packets, the higher the throughput(see Bianchi [13] and Al Khatib [17]). Thus, in order to maximise the throughput, thedata streams must be made of IP packets of 1500 bytes. This is the largest possiblepacket size when using AP between the 802.11 medium and Ethernet.
Commercial IEEE 802.11 APs provide the administrator the possibility to cus-tomize the system configuration by selecting alternative kinds of profiles. A large setof options is available and may produce different performance under different condi-tions. The target of this document is to analyse the maximum IEEE APs performance,but many times the set of possible AP options is too large to be extensively examined.Thus, we suggest using the vendor recommend configuration that guarantees full in-teroperability between different 802.11 implementations. We examine with details thisproblem in chapter 4.
3.3 Importance of the Maximum Saturation Through-put
The related work presents several throughput performance analyses regarding differentAP models. Throughput versus range is probably the most commonly use figure ofmerit for 802.11 APs; for example it was used in [9, 10, 11, 12]. Instead, we preferto focus our investigation on the maximum saturation throughput. There are severalreasons for such a choice:
� The maximum saturation throughput is a very important performance figure. Itprovides an absolute upper value for the performance of the AP useful for differ-ent purposes, such as dimensioning wireless LAN systems.
� Many of the conditions to produce and maximise the saturation throughput canbe almost exactly defined and reproduced. Therefore, it is possible to recreatewith an acceptable precision the same test environment almost everywhere atany time. Note that it is not possible to do the same operation when measuringthroughput versus range in a real scenario (See [9, 10, 11, 12]). In this case manyfundamental conditions cannot be exactly defined and reproduced. For examplethe characteristics of the test area: dimension of the test area, walls material,obstacle etc...
� To measure the maximum saturation throughput means to stress the AP, thusmaking it to work at its full capacity. This condition magnifies good behavioursor imperfections of each AP model.
� In general, a device that shows a relative level of performance under specific con-ditions produces performance of the same level under different conditions too. A

CHAPTER 3. MAXIMUM SATURATION THROUGHPUT 32
high quality device has very high throughput in optimal conditions, large cover-age, and relative high throughput at the coverage edge. Vice-versa, a low qualitydevice has relative low performance in any scenario. This kind of behaviour wasalso noticed in the related work, see [11, 12].
It is important to note that maximum saturation throughput does not indicate the per-formance of the AP in a real environment. The test data streams and environmentalconditions to achieve are not comparable to the normal conditions where an AP usuallyworks. However, this figure of merit can be use to compare the behaviour of differentdevices and to identify their possible weaknesses or good characteristics.

Chapter 4
Challenges in measuring theAPs throughput
This chapter presents the general behaviour of generic IEEE 802.11b APs and its mainpurpose is to motivate and introduce the test procedure we present in the next chapters.It is important to note that the focus of this chapter tests is only to show some specificbehaviours of the 802.11 APs, not to produce valid throughput measurements.
The 802.11 APs show a general high performance variance and many peculiar char-acteristics that make challenging measuring their throughput. In order to provide asignificant set of examples, we performed several tests on two AP models, the AvayaRG-II and the Cisco Aironet 1200. These two devices belong to two complete differ-ent classes of systems: the RG-II is a low price device designed for home applications.The Cisco Aironet 1200 is a high price AP model designed for large WLAN systems.We chose these two AP models because they target completely different users, andshow distinct behaviours and performance. Thus they are appropriated for providingan example of the large existing variety of devices.
The chapter is divided in three sections. The first one describes the simple testprocedure we follow for performing tests. The second section reports the results of ourtests. The last section report some important notes suggested by the analyses of thetests results.
4.1 Preliminary Tests ProcedureThe goal of the tests we present in this chapter is to produce significant examples of thepossible behaviours of 802.11b access points. The test procedure is intentionally simpleand the values of some parameters are partially arbitrary. However, the behaviours ofthe APs coming from these tests are accurate. In fact they were validated with theresults shown in chapter 7 and performed according to the more accurate test procedureillustrated in chapter 3 and 6.
The preliminary tests were performed in the following way. We measured the max-imum saturation throughput of the two APs sending packets from a transmitter on theEthernet side to a wireless node (downlink test). According to section 3.2 points, weused UDP/IP packets of 1472 bytes of UDP payload (i.e. 1500 bytes IP). The offeredload at the AP was 800 packets per second. This kind of stream produces the wantedsaturation condition to the AP. In fact, the traffic stream is higher than the AP capacity
33
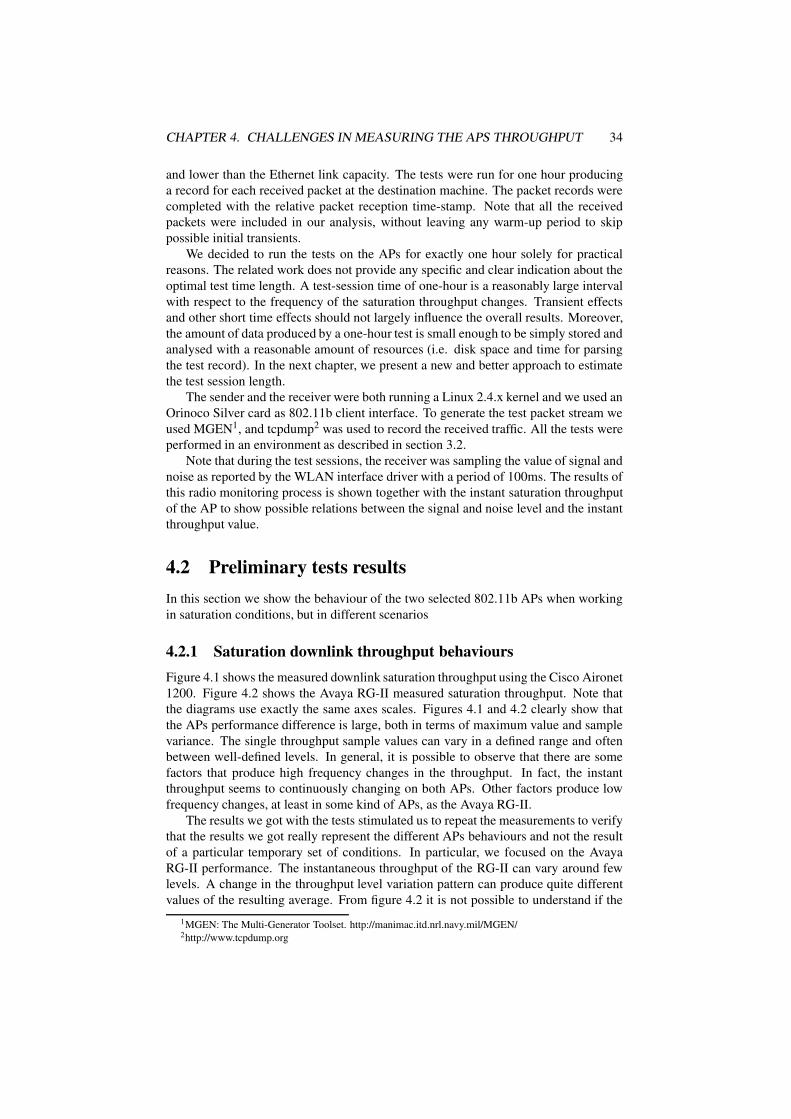
CHAPTER 4. CHALLENGES IN MEASURING THE APS THROUGHPUT 34
and lower than the Ethernet link capacity. The tests were run for one hour producinga record for each received packet at the destination machine. The packet records werecompleted with the relative packet reception time-stamp. Note that all the receivedpackets were included in our analysis, without leaving any warm-up period to skippossible initial transients.
We decided to run the tests on the APs for exactly one hour solely for practicalreasons. The related work does not provide any specific and clear indication about theoptimal test time length. A test-session time of one-hour is a reasonably large intervalwith respect to the frequency of the saturation throughput changes. Transient effectsand other short time effects should not largely influence the overall results. Moreover,the amount of data produced by a one-hour test is small enough to be simply stored andanalysed with a reasonable amount of resources (i.e. disk space and time for parsingthe test record). In the next chapter, we present a new and better approach to estimatethe test session length.
The sender and the receiver were both running a Linux 2.4.x kernel and we used anOrinoco Silver card as 802.11b client interface. To generate the test packet stream weused MGEN1, and tcpdump2 was used to record the received traffic. All the tests wereperformed in an environment as described in section 3.2.
Note that during the test sessions, the receiver was sampling the value of signal andnoise as reported by the WLAN interface driver with a period of 100ms. The results ofthis radio monitoring process is shown together with the instant saturation throughputof the AP to show possible relations between the signal and noise level and the instantthroughput value.
4.2 Preliminary tests resultsIn this section we show the behaviour of the two selected 802.11b APs when workingin saturation conditions, but in different scenarios
4.2.1 Saturation downlink throughput behavioursFigure 4.1 shows the measured downlink saturation throughput using the Cisco Aironet1200. Figure 4.2 shows the Avaya RG-II measured saturation throughput. Note thatthe diagrams use exactly the same axes scales. Figures 4.1 and 4.2 clearly show thatthe APs performance difference is large, both in terms of maximum value and samplevariance. The single throughput sample values can vary in a defined range and oftenbetween well-defined levels. In general, it is possible to observe that there are somefactors that produce high frequency changes in the throughput. In fact, the instantthroughput seems to continuously changing on both APs. Other factors produce lowfrequency changes, at least in some kind of APs, as the Avaya RG-II.
The results we got with the tests stimulated us to repeat the measurements to verifythat the results we got really represent the different APs behaviours and not the resultof a particular temporary set of conditions. In particular, we focused on the AvayaRG-II performance. The instantaneous throughput of the RG-II can vary around fewlevels. A change in the throughput level variation pattern can produce quite differentvalues of the resulting average. From figure 4.2 it is not possible to understand if the
1MGEN: The Multi-Generator Toolset. http://manimac.itd.nrl.navy.mil/MGEN/2http://www.tcpdump.org

CHAPTER 4. CHALLENGES IN MEASURING THE APS THROUGHPUT 35
0
2
4
6
8
10
0 5 10 15 20 25 30 35 40 45 50 55 60
Thr
ough
put (
Mbp
s)
Time (min)
(a) AIR 1200 instant throughput
150
160
170
180
190
200
210
220
230
0 5 10 15 20 25 30 35 40 45 50 55 60
Lev
el
Time (min)
(b) AIR A1200 Signal and Noise levels during throughput test
Figure 4.1: Cisco Aironet 1200 instant throughput and radio signals over a 1-hour test.

CHAPTER 4. CHALLENGES IN MEASURING THE APS THROUGHPUT 36
0
2
4
6
8
10
0 5 10 15 20 25 30 35 40 45 50 55 60
Thr
ough
put (
Mbp
s)
Time (min)
(a) RGII instant throughput
150
160
170
180
190
200
210
220
230
0 5 10 15 20 25 30 35 40 45 50 55 60
Lev
el
Time (min)
(b) RGII Signal and Noise Levels during throughput test
Figure 4.2: Avaya RG-II throughput and radio signals over a 1-hour test.

CHAPTER 4. CHALLENGES IN MEASURING THE APS THROUGHPUT 37
AP performance has a regular and reproducible pattern. Moreover, it was not possibleto identify the cause of the specific pattern we got in our test.
Figure 4.3 shows the result of a second test we performed on the Avaya RG-II. Thistest was performed according the same procedure and in the same environment as thefirst test. Despite of the effort we put to reproduce the same conditions, the second testshows different performance. In particular, the AP shows a general behaviour close tothe Cisco Aironet A1200 one, but with a lower average throughput value. Note that thesignal and noise values during the second test (figure 4.3) were worse than during thefirst one (see figure 4.2).
The described behaviour of the AP can be explained with the possibility that theAvaya RG-II would produce different levels of performance according to a regularpattern. If the pattern time period length is much longer than our test time (1 hour), theresult of different tests could look random. Figure 4.4 shows the result of a test of 8hours we performed on the Avaya RG-II. The test conditions were the same as in theprevious tests, except for the test time length. No kind of pattern is recognisable evenwith respect to the previous test results. Note in Figure 4.4 that the AP performancedecreases after 1.5 hours even if the signal level increases. Apparently, the Avaya RG-IIAP has different behaviours in similar conditions.
In order to find the factors that may influence the AP’s performance, we repeatedthe test changing some characteristics of the testbed, but respecting all the test proce-dures we had already defined.
In section 3.2 we recommended to run the test in a small environment placing theradio devices in close range. No constraints were defined regarding the mutual positionand/or orientation of the devices, except their respective distance. Figure 4.5 shows theresult of two new tests on the Avaya RG-II. The first test (Figure 4.5.a) was performedorienting the AP’s front side to the client. The second test (Figure 4.5.b) was performedafter turning the AP 180 degrees. The difference of performance between the two testsis clear and similar results were found by repeating the tests. Despite the fact theAP’s antenna is supposed to be omni-directional, the device shows a relation betweenthe throughput behaviour and orientation. The maximum value of the AP’s saturationthroughput does not change with the orientation, but the performance stability. Whenthe AP is not oriented in an optimal way, the instant throughput varies around differentlevels related to the different available link rates. The instantaneous throughput valuesproduce a random pattern related to the relative transmission error probability that ishigher with not optimal orientations. Note that different environmental conditions mayalways produce different result despite the AP’s orientation. We observed that non-optimal orientations might produce good or bad performance. However, the optimalAP’s orientation always produces the best performance.
Different types of AP have different behaviours. For example: Cisco Aironet 1200produces much more stable and reproducible behaviours than Avaya RG-II. Figure 4.6shows the result of a second test we ran on Cisco Aironet 1200. The result of thissecond test is close to the result of the first one. All the tests we ran on the CiscoAironet 1200 show similar results independently of the AP’s orientation.
4.2.2 Effects of different AP configurationsAny kind of AP provides the administrator the possibility to select different configu-rations. Configurable parameters allow optimising the AP performance according tothe specific work conditions or customer needs. Different configurations may thereforechange the performance and behaviours of the AP.
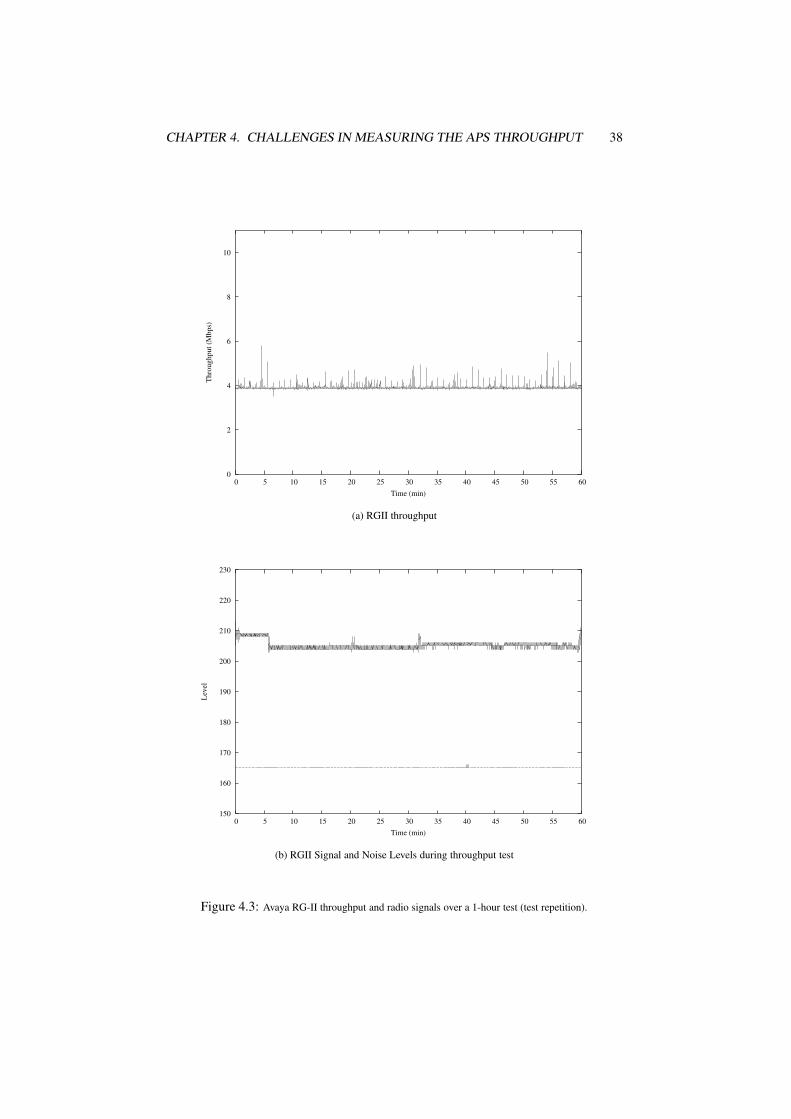
CHAPTER 4. CHALLENGES IN MEASURING THE APS THROUGHPUT 38
0
2
4
6
8
10
0 5 10 15 20 25 30 35 40 45 50 55 60
Thr
ough
put (
Mbp
s)
Time (min)
(a) RGII throughput
150
160
170
180
190
200
210
220
230
0 5 10 15 20 25 30 35 40 45 50 55 60
Lev
el
Time (min)
(b) RGII Signal and Noise Levels during throughput test
Figure 4.3: Avaya RG-II throughput and radio signals over a 1-hour test (test repetition).
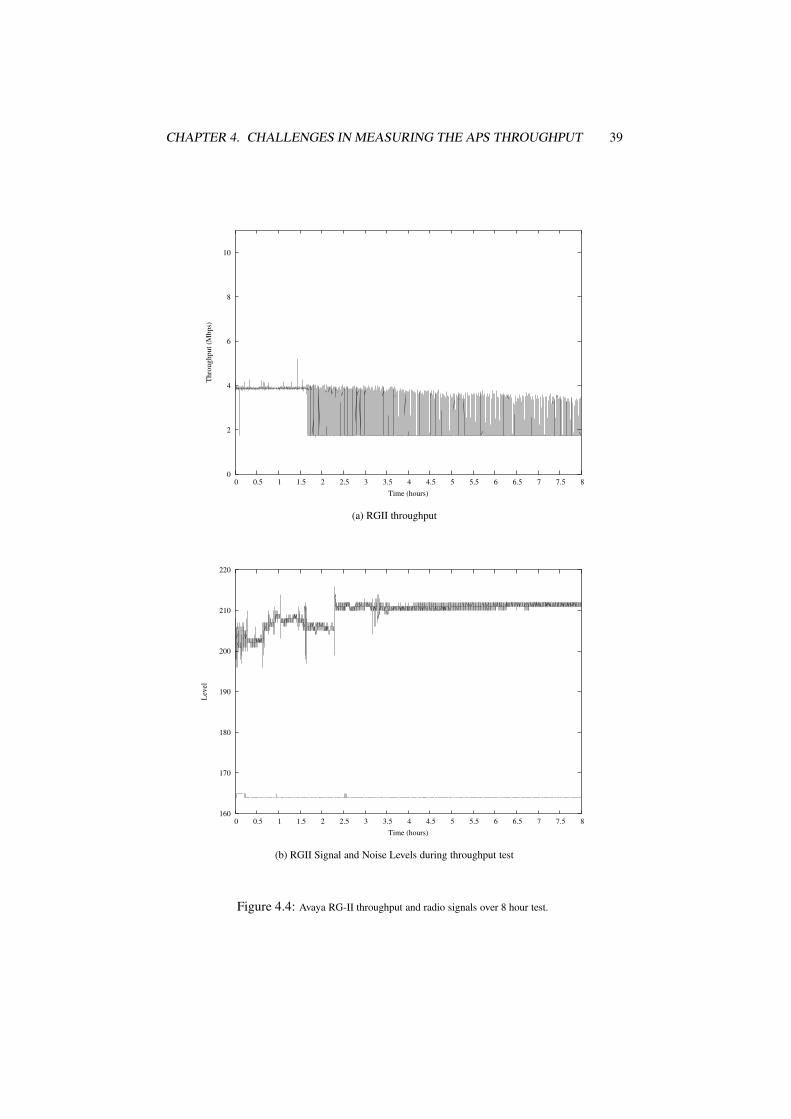
CHAPTER 4. CHALLENGES IN MEASURING THE APS THROUGHPUT 39
0
2
4
6
8
10
0 0.5 1 1.5 2 2.5 3 3.5 4 4.5 5 5.5 6 6.5 7 7.5 8
Thr
ough
put (
Mbp
s)
Time (hours)
(a) RGII throughput
160
170
180
190
200
210
220
0 0.5 1 1.5 2 2.5 3 3.5 4 4.5 5 5.5 6 6.5 7 7.5 8
Lev
el
Time (hours)
(b) RGII Signal and Noise Levels during throughput test
Figure 4.4: Avaya RG-II throughput and radio signals over 8 hour test.

CHAPTER 4. CHALLENGES IN MEASURING THE APS THROUGHPUT 40
0
2
4
6
8
10
0 5 10 15 20 25 30 35 40 45 50 55 60
Thr
ough
put (
Mbp
s)
Time (min)
(a) RGII throughput with the AP front side pointing to the client
0
2
4
6
8
10
0 5 10 15 20 25 30 35 40 45 50 55 60
Thr
ough
put (
Mbp
s)
Time (min)
(b) RGII throughput with the AP back side pointing to the client
Figure 4.5: Avaya RG-II throughput and radio signals over a 1-hour test with different AP orientation.

CHAPTER 4. CHALLENGES IN MEASURING THE APS THROUGHPUT 41
0
2
4
6
8
10
0 5 10 15 20 25 30 35 40 45 50 55 60
Thr
ough
put (
Mbp
s)
Time (min)
(a) Cisco AIR A1200 instant throughput.
150
160
170
180
190
200
210
220
230
0 5 10 15 20 25 30 35 40 45 50 55 60
Lev
el
Time (min)
(b) AIR A1200 Signal and Noise level during Throughput test
Figure 4.6: Cisco AIR 1200 instant throughput and radio signals over a 1-hour test (Second Test).

CHAPTER 4. CHALLENGES IN MEASURING THE APS THROUGHPUT 42
4.2.2.1 The Cisco Aironet 1200 Case
Figure 4.1 shows the high performance of the Cisco Aironet 1200. This AP producedan average saturation throughput of over 7.1 Mbps. How could the Cisco Aironet 1200be so fast? The answer came parsing the AP configuration and reading the relativedocumentation. The Cisco A1200 configuration interface offers a special option (activeby default) to use no better specified “Aironet Extensions”. When this option is notactive the maximum throughput of the AP is around 6.2 Mbps. Figure 4.7 shows theCisco Aironet 1200’s behaviour without the “Aironet Extensions” and enforcing legacy802.11 client compatibility. We did not have the appropriate tools to analyse whatexactly happens when the “Aironet Extensions” are active. However, the Cisco Aironet1200 always works properly in any conditions with the different kind of clients wetried. Thus, the “Aironet Extensions” seem to not break the basic 802.11b constraints.A reasonable, but not directly verifiable, explanation of the higher performance is thatthe “Aironet Extensions” option disregards the standard 802.11 contention window byusing smaller values. This conclusion is supported from the information reported inthe Atheros white papers [11, 12] about the use of such a solution on some commercial802.11b AP models.
4.2.2.2 Avaya RG-II Case
This AP model offers five different profiles to optimise the performance accordingto the customer WLAN cell characteristics. The available options are: Large cells,Medium cells, Small cells, Mini cells and Micro cells. Note that the tests shown inthe previous sub-section were performed using the default configuration (Large cell).For example: figure 4.2 shows the saturation throughput of the Avaya RG-II with opti-mal orientation using Large cell profile. When changing the configuration profile, theAvaya RG-II saturation throughput changes. Figure 4.8 shows the performance of thesame AP in the same conditions using the same test procedure, when the Micro cellprofile is used.
Different configurations produce different behaviours. However, the performancesof the alternative configuration profiles are all affected by some hardware characteris-tics of the AP, i.e. the antenna orientation. For example: figure 4.9 shows the result ofa test on an Avaya RG-II using Micro cell profile and non-optimal AP’s orientation.
The Avaya RG-II documentation does not specify if the different profiles are as-sociated to different radio transmission signal power levels. Many kinds of AP allowthe administrator to set different levels of transmission power for the radio producingdifferent physical dimensions of the AP’s cell. No significant changes of the radio celldimension and/or of the signal and noise levels were noticed when changing betweenthe different profiles of the Avaya RG-II. The different cell profiles seem to do notenforce different levels of radio transmission power.
4.2.3 Offered Load versus AP throughputThe aim of this work is to measure the AP’s saturation throughput. In the downlinktest, this constraint implies that the AP always has a packet to transmit. This conditioncan be practically achieved by sending to the AP as many packets as it can bridgeto the 802.11 link plus one. A way of assuring this condition during the test is tosend to the AP Ethernet interface as many packets as possible. During our tests, wealways used data streams slightly lower than 10 Mbps (800 pkt/sec with 1500 bytes

CHAPTER 4. CHALLENGES IN MEASURING THE APS THROUGHPUT 43
0
2
4
6
8
10
0 5 10 15 20 25 30 35 40 45 50 55 60
Thr
ough
put (
Mbp
s)
Time (min)
(a) AIR A1200 throughput
150
160
170
180
190
200
210
220
230
0 5 10 15 20 25 30 35 40 45 50 55 60
Thr
ough
put (
Mbp
s)
Time (min)
SignalNoise
(b) AIR A1200 Signal and Noise levels during throughput test
Figure 4.7: Cisco Aironet A1200 instant throughput and radio signals over a 1-hour test when enforcinglegacy 802.11 client compatibility and no proprietary Aironet extensions.

CHAPTER 4. CHALLENGES IN MEASURING THE APS THROUGHPUT 44
0
2
4
6
8
10
0 5 10 15 20 25 30 35 40 45 50 55 60
Thr
ough
put (
Mbp
s)
Time (min)
Figure 4.8: Avaya RG-II throughput over a 1-hour test using Micro Cell profile.
0
2
4
6
8
10
0 5 10 15 20 25 30 35 40 45 50 55 60
Thr
ough
put (
Mbp
s)
Time (min)
Figure 4.9: Avaya RG-II throughput over a 1-hour test using Micro Cell profile and not optimal APorientation.

CHAPTER 4. CHALLENGES IN MEASURING THE APS THROUGHPUT 45
Figure 4.10: Different APs downlink throughput performance when increasing the offered load. Eachpoint represents the best throughput on 5 minutes interval over 5 independent tests.
IP packets) to be able to produce exactly the same offered load to APs using 10 or100 Mbps Ethernet interfaces. However, not all the APs could manage this amountof incoming traffic without loosing performance. Figure 4.10 shows the results weobtained running tests on several AP models. The test procedure we used for this testwas different with respect to the one proposed earlier in this chapter (see 4.1). Thepurpose of this test was to analyse the behaviour of the 802.11 APs with differentamounts of offered load. We selected 16 levels of offered load, from 50 up to 800packets per seconds using UDP over IP packets of 1472 bytes of payload each. Thedata stream was sent from an Ethernet node downlink to an 802.11b station. A completetest on an AP was made by different independent sessions, each test session was run for5 minutes using a specific level of offered load and it was repeated 5 times. The testedAP’s maximum throughput for each offered load level was the maximum value of themeasured throughput between the 5 independent measurements. Figure 4.10 shows theresult we obtained. Note that the offered load influences the performance of many APmodels. Therefore, in order to find the maximum throughput of a specific 802.11b APmodel it is necessary to identify the offered load producing the best performance.
4.2.4 ConclusionsThe different test results we presented in this chapter show three main factors thatmight influence the maximum saturation throughput of an 802.11b access points. Thesefactors are:
1. The characteristics of the AP’s radio antenna.
2. The AP’s configuration.
3. The offered load.
The first factor shows that to measure the maximum saturation throughput of an AP itis important to verify if there is an optimal orientation of the tested device with respectto the radio client. The second factor introduces an interesting kind of problem. SomeAPs, such as the Cisco Aironet 1200, allow the administrator to change a very large

CHAPTER 4. CHALLENGES IN MEASURING THE APS THROUGHPUT 46
number of 802.11 parameters making difficult to identify the optimal configurationin the test conditions. Thus, we recommend to use the default AP’s configuration aslong as the solution is WiFi certified 3 and there is not a specific configuration profilerecommended for the particular test conditions. Finally, the third factors shows thatnot all the AP models can efficiently handle an extreme saturation condition withoutloosing performance. Therefore it is necessary to verify the optimal offered load thatmaximises the AP’s saturation throughput.
4.3 Important Notes
4.3.1 Initial TransientAccess Points are not simple systems and use large internal buffers to handle inputand/or output packet queues. According to Al Khatib’s results, some APs have thecapability of adapting their buffer dimension to the actual traffic characteristics [17].Moreover, the APs can reach buffer sizes larger than 100 KBytes. Different AP modelshave different buffer dimension and apply different policies to them. Al Khatib pro-posed a procedure to estimate the buffer dimension of a specific AP [17], but it requiresrunning extra specific tests to be performed.
The results of the preliminary tests we described in the previous section also showthe initial transient behaviour of the APs. Despite the complexity of the AP system, wecould not observe any special transient time, except for the first milliseconds. Figure4.11 provides more details of the behaviour of the two APs we have examined in thefirst 200 ms of the test. To have little larger view of the first second of the test, youcan look at figures 5.1 and 5.2 in the next chapter. Note that all the previous picturesshow a little part of the same tests that we showed in figures 4.1 and 4.2 in the previoussection.
The conclusion we got from the analysis of all our preliminary tests is that thetransmission initial transient time of any AP is limited to the first milliseconds of thetest. After a few instants, the AP performance already reaches a saturation regime.
4.3.2 Measurement of the Signal and Noise LevelsIn the previous sections we show the results of many different tests on different APs.The instant throughput sample values were shown together with the correspondent sig-nal and noise levels measured at the receiver. The purpose of showing together theinstant throughput value of the AP and the signal and noise level at the receiver was topoint possible relations between the two plots. After analysing the different plots, weconcluded that it was not possible to note any general and clear relationship betweenthe signal and noise levels and the measured value of the instant AP’s throughput.There are several explanations for such a result:
� The signal and noise levels are related to the encoded and modulated signal.These values are linked to the probability of success or failure when transmittinga bit of information, not to the real radio signal level. For example: by changingthe radio transmission power of the AP, the signal and noise values at the receiverdo not change if the radio channel performance is not compromised. The signaland noise levels are the consequence of possible transmission failures, not the
3The Wireless Fidelity Alliance; http://www.wi-fi.org

CHAPTER 4. CHALLENGES IN MEASURING THE APS THROUGHPUT 47
0
2
4
6
8
10
0 0.01 0.02 0.03 0.04 0.05 0.06 0.07 0.08 0.09 0.1 0.11 0.12 0.13 0.14 0.15 0.16 0.17 0.18 0.19 0.2
Thr
ough
put (
Mbp
s)
Time (sec)
(a) Cisco AIR 1200
0
2
4
6
8
10
0 0.01 0.02 0.03 0.04 0.05 0.06 0.07 0.08 0.09 0.1 0.11 0.12 0.13 0.14 0.15 0.16 0.17 0.18 0.19 0.2
Thr
ough
put (
Mbp
s)
Time (sec)
(b) Avaya RG II
Figure 4.11: Per packet throughput relative to the first 200 ms of activity.

CHAPTER 4. CHALLENGES IN MEASURING THE APS THROUGHPUT 48
reason. Note figure 4.4, the signal level increases when the throughput decreases.One likely way to explain such a result is that the AP lowers its transmissionspeed by encoding the packet using a lower link rate (i.e. 5.5 Mbps instead of 11Mbps) when many transmission errors are detected. In the initial part of the test,the APs tries to send data at a high speed producing many transmission errors,therefore the receiver reports a low signal level. When the AP slows down thetransmission to a lower data link rate, the transmission errors decrease and thesignal level at the receiver increases.
� The signal and noise levels were sampled at the client, not at the AP. It is not al-ways possible to get the instant values of noise and signal from the AP. When thisinformation is available, you have to disturb your test environment by sending alarge number of SNMP requests to the AP for retrieving the information.
� The signal and noise levels were sampled at a different and lower frequencycompared to the AP’s throughput.
� The values of signal and noise levels are not an absolute measurement. Different802.11 cards report these values on a different scale. Only a few kinds of wirelessinterfaces allow an accurate conversion of the provided values into decibel (dB).Therefore, it is important to use the same kind of wireless card for all the tests tocompare the results.
Despite the previous problems, the screening of the signal and noise levels allows con-trolling the general status of the test environment. In this way it is possible to verifythat the general test conditions were good. Figure 4.12 shows a particular behaviourwe observed with an Avaya RG-II. The extremely low throughput performance is as-sociated with a very unstable noise level. The unusual behaviour of the noise allowedus to discard the result of this test. Most probably, external factors altered the testenvironment and made the test invalid.
Figure 4.13 shows a second example taken from a test from the Cisco Aironet 1200.Note that in this case it is also possible to identify a clear relation between throughputand noise level.
Our conclusion is that the signal and noise levels measured at the wireless clientcannot be used to justify all the possible behaviours of the AP’s throughput. However,they can give an indication about the overall test environment condition. In particular,the test results produced with levels of noise with high variance or high peaks have tobe discarded. In fact, an unstable and/or unusual noise level behaviour might indicatenot optimal test conditions.
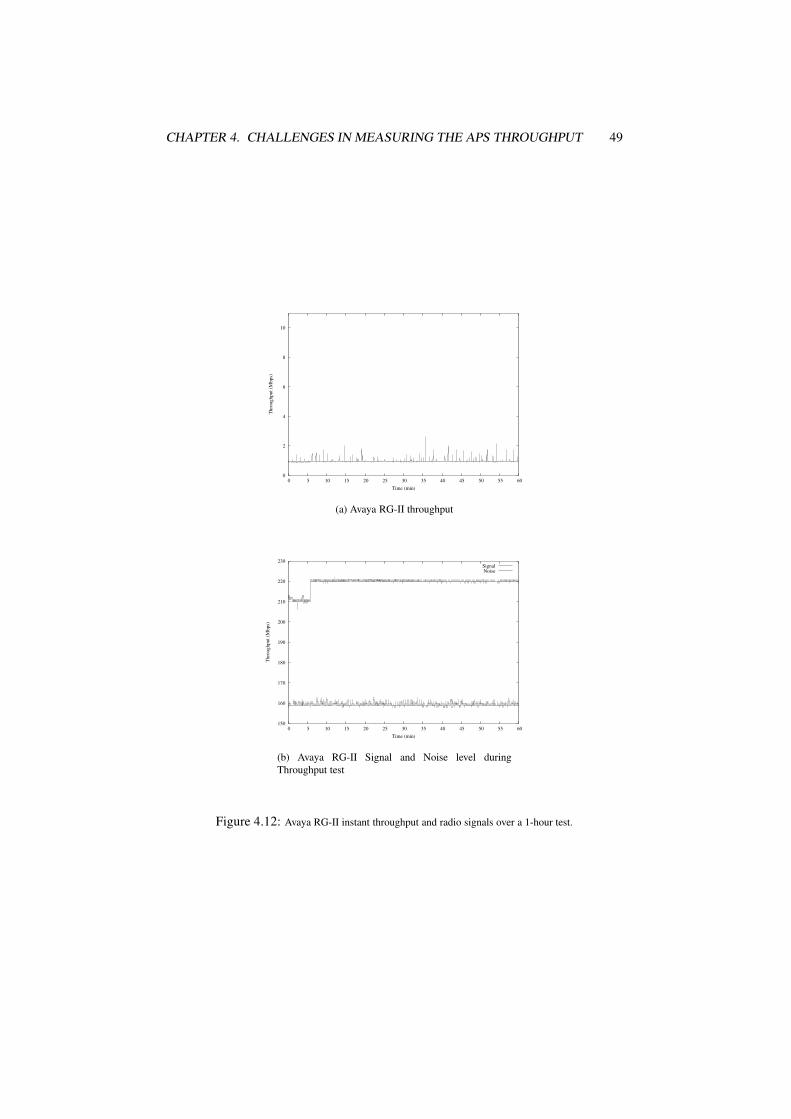
CHAPTER 4. CHALLENGES IN MEASURING THE APS THROUGHPUT 49
0
2
4
6
8
10
0 5 10 15 20 25 30 35 40 45 50 55 60
Thr
ough
put (
Mbp
s)
Time (min)
(a) Avaya RG-II throughput
150
160
170
180
190
200
210
220
230
0 5 10 15 20 25 30 35 40 45 50 55 60
Thr
ough
put (
Mbp
s)
Time (min)
SignalNoise
(b) Avaya RG-II Signal and Noise level duringThroughput test
Figure 4.12: Avaya RG-II instant throughput and radio signals over a 1-hour test.

CHAPTER 4. CHALLENGES IN MEASURING THE APS THROUGHPUT 50
0
2
4
6
8
10
36 38 40 42 44
Thr
ough
put
Time (min)
(a) AIR A1200 throughput
160
170
180
190
200
210
220
230
36 38 40 42 44
Lev
el
Time (min)
SignalNoise
(b) AIR A1200 Signal and Noise level during Through-put test
Figure 4.13: Cisco/Aironet A1200 instant throughput and radio signals. Detail of 10 minutes over aone-hour test.

Chapter 5
A Statistical Framework forThroughput Analysis
In this chapter we present a statistical framework for testing and studying the maximumthroughput of IEEE 802.11b access points.
In the first section we select the statistical indexes appropriate for summarisingthe AP’s saturation throughput performance. In the second section, we investigate theoptimal characteristics for the saturation throughput samples. In the third section, weillustrate an approach to produce saturation throughput measurements with a definedminimum accuracy.
5.1 Significant Statistical Indexes for Saturation Through-put
The target of our investigation is the maximum saturation throughput of an IEEE802.11 AP as defined in section 3.1. The adjective maximum could be interpretedas the AP’s throughput peak. The performance peaks are not relevant because they arevery short in time, therefore do not characterise the general performance of an AP. Onthe contrary, we want to focus on stable saturation throughput performance in optimalconditions, therefore maximum.
We have seen that a proper approach to measure the saturation throughput of an APis to collect and analyses a population of throughput samples (see chapter 3). There-fore, the use of some basic statistical indexes became important to produce a significantperformance analysis for the studied APs. In particular, we focus our interest on themean throughput.
Others statistical indexes are also important. The standard deviation is very usefulto quantify the performance stability of a specific system. The maximum and mini-mum values of the throughput samples provide information about the limit of the APperformance and its throughput range variation. However the maximum and minimumvalues of the AP saturation throughput samples are largely influenced by the specifictest session. Therefore, repeating the same tests it is quite possible to get differentresults despite a stable average throughput.
The conclusion is that we use as the index of the AP’s maximum saturation through-put performance its average value and we report the saturation throughput standard
51

CHAPTER 5. A STATISTICAL FRAMEWORK FOR THROUGHPUT ANALYSIS 52
deviation and range as complementary information.
5.2 Characteristics of the Saturation Throughput Sam-ples
A single throughput sample is the AP’s throughput computed at a specific and constanttime interval. In this subsection, we investigate the optimal time interval length of asingle throughput sample for an 802.11b AP.
We first investigate the general bounds for the sample time length. In general along throughput sample time length prevents to capture short time behaviours of theAPs and analyse the real range of the throughput performance. An upper limitation forthe time length of the sample can be found by studying some practical limitations forthe test, in particular:
� Necessary resources to successfully complete the test (total time to run the wholetest, amount of disk for storing the received packet information and necessarytime for the test result analysis),
� The measurement error probability of the throughput samples. We observed thatsome 802.11 frames could be dropped by the recording system during the test.When this happens, the relative sample has to be discarded. Thus, the longer isthe sample time, the higher is the probability that an error occurs and the sampleis dropped. More information can be found in section 6.2.3.
The minimum time length of an 802.11 throughput sample is related to the instanta-neous throughput measurement error. We identified two main factors that can influencethis parameter:
� General behaviour of IEEE 802.11 compliant APs.
� The maximum measurement error due to the measurement system.
The 802.11 APs send beacons at regular intervals (usually 100ms) to advertise theirpresence [4]. The beacons are always sent at a fixed and usually low speed (commonly2Mbps). After sending a beacon, the APs schedule a set of special operations, i.e. thetransmission of special data sent as multicast packets. One of the reasons of the largevariance of the very small samples is the alteration produced on the normal data flowby the beacon transmissions. Figure 5.1 shows the throughput of the Cisco AIR 1200calculated using samples of a single packet. The diagram shows the first second of thetest. In Figure 5.1 one can easily identify the beacons and understand their potentialinfluence on throughput sample values. Note that the effect of the beacon is muchlower with slower AP, i.e. Avaya RG-II. Figure 5.2 shows this case.
Observe the results of a downlink traffic test on the two APs we used for our pre-liminary tests. Table 5.1 shows different statistical indexes of the results produced bythe downlink test on the Avaya RG-II computed using different sample sizes. Table 5.2shows a similar result with the Cisco Aironet 1200.
Despite the use of different sample sizes, in both cases the resulting average value isthe same. Figure 5.3 shows the maximum, average and minimum downlink throughputfor the two AP models computed for different sample sizes (from 0.05 to 2 seconds).Note that the range of throughput samples varied largely whilst the average throughput

CHAPTER 5. A STATISTICAL FRAMEWORK FOR THROUGHPUT ANALYSIS 53
0
2
4
6
8
10
0 0.1 0.2 0.3 0.4 0.5 0.6 0.7 0.8 0.9 1
Thr
ough
put (
Mbp
s)
Time (sec)
Figure 5.1: Instantaneous throughput of the Cisco/Aironet A1200 in the first second of the test. Eachthroughput sample is made of a single packet.
0
2
4
6
8
10
0 0.1 0.2 0.3 0.4 0.5 0.6 0.7 0.8 0.9 1
Thr
ough
put (
Mbp
s)
Time (sec)
Figure 5.2: Instantaneous throughput of the Avaya RG-II in the first second of the test. Each throughputsample is made of a single packet.
Samples Size 0.05 sec 0.1 sec 0.15 sec 0.2 sec 0.3 sec 0.5 sec 1 sec 2 sec
Sample Mean (kbps) 3978 3978 3979 3978 3979 3978 3979 3977
Std. Deviation (kbps) 162 105 85 71 59 44 32 23
Maximum (kbps) 4560 4320 4240 4200 4160 4104 4068 4032
Minimum (kbps) 1440 2040 2640 2940 3320 3552 3744 3876
Range (kbps) 3120 2280 1600 1260 840 552 324 156
Table 5.1: Avaya RG-II preliminary test 1, statistical analysis with different time length samples.

CHAPTER 5. A STATISTICAL FRAMEWORK FOR THROUGHPUT ANALYSIS 54
Samples Size 0.05 sec 0.1 sec 0.15 sec 0.2 sec 0.3 sec 0.5 sec 1 sec 2 sec
Sample Mean (kbps) 7019 7019 7019 7019 7019 7019 7019 7019
Std. Deviation (kbps) 151 85 69 55 46 38 31 27
Maximum (kbps) 9840 8400 7200 7140 7120 7080 7068 7062
Minimum (kbps) 4320 5760 6560 6600 6680 6744 6816 6882
Range (kbps) 5520 2640 640 540 440 336 252 180
Table 5.2: Cisco Aironet 1200 preliminary test 1, statistical analysis with different time length samples.
0
2
4
6
8
10
0 0.2 0.4 0.6 0.8 1 1.2 1.4 1.6 1.8 2
Thr
ough
put (
Mbp
s)
Sample Size (sec)
A1200RGII
Figure 5.3: Maximum, average and minimum downlink throughput using Avaya RG-II and CiscoAIR1200 computed for different sample length.

CHAPTER 5. A STATISTICAL FRAMEWORK FOR THROUGHPUT ANALYSIS 55
20
40
60
80
100
120
140
160
180
200
220
0 0.2 0.4 0.6 0.8 1 1.2 1.4 1.6 1.8 2
Stan
dard
Dev
iatio
n (K
bps)
Sample Size (sec)
RGIIA1200
Figure 5.4: Average behaviour of the downlink standard deviation with different sample size using AvayaRG-II and Cisco AIR 1200.
remained constant. Very small samples vary in a large range and the throughout rangequickly decreases as the sample size grows.
Figure 5.4 shows the average behaviour of the downlink standard deviation withdifferent sample sizes.
The previous diagrams show that the computed average throughput does not de-pend on the sample size. However the sample size strongly influences the resultingthroughput range and the throughput sample standard deviation. In particular note thatusing very small samples (i.e. 5 ms), the packet time-stamp measurement error canproduce throughput samples with non-realistic values. For example: the Cisco Aironet1200 maximum throughput value using samples of 5ms is 9840 Kbps. This value isvery high compared to the expected 802.11b performance. Most probably extremethroughput sample values are produced by erroneous packet reception time-stamps.
Usage of very large sample times does not show short time behaviours. For exam-ple: computing the throughput on 2 seconds samples, it is not possible to note possibleinterruption in the traffic flow for periods shorter than 2 seconds. In fact, a completeAP stop produces a set of low throughput samples that looks as if the AP temporaryslows down. If large sample times are used, the effect of short time throughput be-haviours is re-distribute between more samples. Therefore, the throughput sampleshave to be small to report any kind of behaviour. However, the minimum sample timelength has to be long enough to have an acceptable measurement error and includingat least one beacon transmission. It is necessary to have at least on beacon per sample,thus to include this 802.11 protocol characteristic into each sample avoiding confusinga protocol characteristic with device instability.
The network analyser tools only report the packets completely received on a definedtime interval. An incomplete packet transmission during the interval (i.e. the packettransmission ends just after the end of the sample interval) is not reported and producesa throughput measurement error. It is not possible to avoid such an error, but it ispossible to estimate it. In the worse case, the error is equal to a single packet. Forexample: if an AP transmits packets at a constant speed, using a sample time intervalslightly larger than the transmission time of a single packet, one observes that all the

CHAPTER 5. A STATISTICAL FRAMEWORK FOR THROUGHPUT ANALYSIS 56
Bit
Rat
e
DIF
S
Con
tent
ion
win
dow PH
Y
Prea
mbl
e/H
eade
r
MA
C
Ove
rhea
d
Payl
oad
(150
0B
ytes
)
SIFS
Ack
.PH
Y
Prea
mbl
e/H
eade
r
Ack
.MA
C
over
head
Tota
l
1 Mbps 50µs 320µs 192µs 272µs 12000µs 10µs 192µs 112µs 13148µs
2Mbps 50µs 320µs 192µs 136µs 6000µs 10µs 192µs 56µs 6956µs
5.5Mbps 50µs 320µs 192µs 49µs 2182µs 10µs 192µs 56µs 3052µs
11Mbps 50µs 320µs 192µs 25µs 1091µs 10µs 192µs 56µs 1936µs
Table 5.3: IEEE802.11b maximum frame transmission cycle-time at different link rate.
samples include zero, one or two received packets, with an average of 1 packet.When the AP transmits packets at constant speed, the larger the sample time in-
terval, the lower the absolute sample’s throughput error. In the previous example youhave a maximum error equal to 100% (two or zero received packets instead of one).Using a sample time interval equal to the average time for transmitting 100 packets,you reduce the relative maximum error to 1%. Real APs do not transmit packets ata unique and constant speed. However, this approach produces an estimation of theminimum sample time per acceptable measurement error.
The packet transmission time on an 802.11 link depends on the packet dimension,the link layer transmission rate, the contention window, and the time to get the neces-sary acknowledgment packet [4]. This time is the overall 802.11 transmission cycle-time. In order to maximise the AP throughput we use a test data stream made of packetswith dimension equal to the IP packet maximum size (1472 bytes of UDP/IP payload)Table 5.3 shows the estimated transmission time at the different 802.11b link rates [4].The delay introduced by the contention windows is a stochastic value with a uniformdistribution [4]. In table 5.3 this delay is supposed to be always equal to its mean. Tayin [14] used the same approximation for his mathematical model. Note that we assumethe link to be free of collisions. Therefore, the contention window is always minimal(i.e. up to 32 slots of 20µs) and the 802.11 MAC protocol waits an average of 320 µsbefore sending a packet. In case of a single 802.11b station in a cell, a 1500 IP packetis completely transmitted in less than 13.15 ms (using the 1 Mbps link rate).
It is important to note that several kinds of control and management packets aredefined in the IEEE 802.11 standard. These packets are transmitted at regular times,or in particular situations by the AP or by the clients and can interrupt the test datastream. However, we can simplify the analysis only including the 802.11 data packetswith their acknowledgment.
The number of packets that arrived in a time interval equal to T ms depends onthe link rate in use. This number is the floor or the ceiling of T divided by the timeto transmit the packet at the link rate in use. In fact, a partially transmitted packetwill not be included in the sample. Whatever the sample time length, the maximumabsolute error is always equal to the contribution of an entire packet to the samplevalue. Therefore, if T is the throughput sample time length, the maximum throughputsample measurement error can be estimated as:
errormax � 1f loor
�T � Ttransmission � cycle � time � (5.1)

CHAPTER 5. A STATISTICAL FRAMEWORK FOR THROUGHPUT ANALYSIS 57
1 Mbps 2 Mbps 5.5 Mbps 11 Mbps1% 1315 ms 696 ms 306 ms 194 ms
3% 439 ms 233 ms 103 ms 65 ms
5% 263 ms 140 ms 62 ms 39 ms
10% 132 ms 70 ms 31 ms 20 ms
Table 5.4: Sample’s minimum time length to get a specific maximum measurement error at the different802.11b link rate.
Table 5.4 shows the different sample time to guarantee a theoretical maximum sam-ple measurement error at the different 802.11b link rates.
In order to study the maximum throughput of an 802.11b AP, we recommend usingthroughput samples of 150 ms. Under optimal conditions, we can assume the AP willnever use link rates lower than 2Mbps. In case of a lower performance, the singlethroughput error could be up to 10%.
The sample length of 150ms represents a compromise between the different pos-sibilities we examined. This length of sample is short enough to capture almost in-stantaneous behaviours of the 802.11 APs. However, it always includes at least onebeacon transmitted by the AP and produces a throughput with a maximum error thatis estimated lower than 5%. Note that different lengths of sample might be used, 150ms represents the optimal option according to our experience. In particular we ob-served that using throughput samples up to 150 ms the 802.11 traffic analyser’s packetlost probability is low enough to generate an acceptable low probability of discardingsamples.
5.3 Throughput measurement accuracy and number ofsamples
In order to measure the maximum saturation throughput of an 802.11 AP it is necessaryto collect a set of throughput samples. The AP performance is measured as the averageof the collected samples. Using simple statistical analysis, it is possible to guarantee aminimum measurement precision.
The previous section defined the characteristics of the throughput samples we rec-ommend. In this section we estimate the number of samples (i.e. the test-session time)in order to achieve a pre-defined measurement precision.
5.3.1 BackgroundStatistical analysis provides an approach to solve the 802.11 maximum throughputmeasurement problem. The confidence level gives probabilistic bounds to the through-put measurement. By fixing a confidence level, it is possible to define a symmetricinterval around the measured average (confidence interval) where the real system aver-age lies with the probability expressed by the confidence level. For example: a confi-dence level of 95% allows calculating a symmetric interval round the computed averagewhere the real average value lies within a probability of 95%.
The confidence interval can be very large, but it decreases when the number ofsamples grows. The accuracy of the measurement is the ratio between the confidence

CHAPTER 5. A STATISTICAL FRAMEWORK FOR THROUGHPUT ANALYSIS 58
interval and the average value. For example, an accuracy of 10% means that the confi-dence interval of a measurement is equal to 10% of the measured average.
The number of throughput samples one needs to collect during a test session de-pends on the desired measurement precision. Knowing the mean and standard deviationof a stochastic distribution, it is possible to estimate the necessary number of samplesto collect in order to measure the mean at a certain confidence level and with a spe-cific accuracy. The formula 5.2 from [3] allows estimating the necessary number ofsamples:
N Samples � Ceiling��� 100 � z � σ
r � x � 2 � (5.2)
Where:
� x: Distribution mean,� σ: Standard Deviation of the distribution,
� z: Quantiles of the Unit Normal Distribution (this value depends on the selectedconfidence level),
� r: Desired mean accuracy percent.
We recommend using a high accuracy level and confidence level for measuring theAP’s maximum saturation throughput. The high accuracy and confident interval arenecessary to be able to easily distinguish and compare the different performance of theAPs. The lower the accuracy, the larger the performance range where it will not bepossible to distinguish the behaviours.
We suggest using a confidence level of 95%. We chose such a confident levelbecause it represents a good compromise between provided precision and amount ofnecessary resources. The necessary accuracy is investigated in the next subsection.
5.3.2 Estimation of the number of necessary samplesThe previous sub-section introduced a statistical approach for the analyses of the through-put performance of any 802.11 AP. Unfortunately it is not possible to know in advancethe throughput’s mean and standard deviation of a specific AP under certain condi-tions. Therefore, in order to determine the necessary number of throughput sampleswe investigate the worse case. This methodology produces an over-estimation of thenecessary number samples, but it achieves a pre-defined minimum accuracy with aunique procedure for any AP without running preliminary tests on each device.
Equation 5.2 shows that the necessary number of samples is proportional to thesquare power of the ratio between standard deviation and the mean; this ratio is calledCoefficient Of Variation (C.O.V). The proportional factor depends on the desired con-fident level (through the quantiles of the Unit Normal Distribution, z) and the desiredmean accuracy. In our analyses, the worse possible case corresponds to the AP produc-ing saturation throughput with the highest C.O.V.
The throughput samples of an 802.11 AP cannot have values outside the limit of the802.11 link capacity. Thus the average throughput and its standard deviation are limitedwithin the 802.11 capacity range (i.e. from 0 to 11Mbps for IEEE 802.11b). The anal-yses of preliminary tests suggested estimating the maximum C.O.V equal to 1. This

CHAPTER 5. A STATISTICAL FRAMEWORK FOR THROUGHPUT ANALYSIS 59
Accuracy N. Samples Test time (using 150ms samples)
1% 38416 5763 sec (96 min)2% 19208 2882 sec (49 min)3% 12805 1921 sec (33 min)4% 9604 1441 sec (24 min)5% 7683 1153 sec (19 min)7% 5489 824 sec (13 min)
10% 3842 577 sec (10 min)
Table 5.5: Number of necessary samples and estimate time to complete a test session to measurethe throughput with a confidence level of 95% and different levels of accuracy.
value represents a reasonable maximum upper bound with a good margin with respectto the measured saturation throughput’s C.O.V. of the tested 802.11 APs. Moreover,a maximum C.O.V. equal to one represents a realistic scenario where the throughputsamples of the different APs have a standard deviation lower than their mean. Note thatthe theoretical maximum value of the C.O.V. for the 802.11 AP’s saturation throughputis higher. Thus, in order to validate any measurement, it will be always necessary toverify the C.O.V. Our assumption might fail when measuring the throughput of deviceswith extremely low and instable performance. However, we consider such behaviour afailure of the tested system to be treated as an exception.
Under the hypothesis that the maximum C.O.V. is equal to one, the number ofnecessary samples to pick up is equal to:
Max N � Samples � Ceiling��� 100 � z
r � 2 � (5.3)
The equation 5.3 shows that with a fixed value of the confidence level, the numberof samples grows with the accuracy. It is recommendable to achieve a high accuracy,but also keeping the number of necessary samples as low as possible (i.e. the timeto complete a test session). Table 5.5 shows the number of necessary samples fora confident level of 95% and different accuracy values. This table also reports anestimation of the time to complete a test session.
It is not possible to provide here the optimal accuracy to use for all kind of tests.The optimal value depends on the specific target of the test you want to run. Thenext chapter describes the maximum saturation throughput measurement procedurefor 802.11b APs. Different kinds of tests are recommended as part of the generalprocedure, for each specific test we recommend an appropriate accuracy.

Chapter 6
Measurement of AP MaximumThroughput
This chapter presents our recommended procedure to measure the IEEE 802.11 AP’smaximum saturation throughput. The first section details the general throughput def-inition according to the 802.11 AP’s characteristics and surveys the different options.The second section presents our recommended test procedure. The last section de-scribes the necessary testbed to successfully perform the measurements according toour recommendation.
6.1 Particularities of the IEEE 802.11 AP ThroughputIn chapter 3, we provided a general definition of the maximum saturation throughput(see 3.1). Despite the general validity, the previous definition needs to be better de-tailed. The first throughput definition does not include important aspects necessary tostudy the IEEE 802.11 APs throughput. In particular, it is necessary to consider the datastream direction and the number of nodes and/or data streams to use. The followingsubsections demonstrate that the previous points represent important issues.
A generic AP can bridge data packets into four different directions:
1. Downlink (Ethernet to wireless),
2. Uplink (wireless to Ethernet),
3. Wireless-to-Wireless, and
4. Ethernet-to-Ethernet.
The last two cases need further explanation. The wireless-to-wireless case refers todifferent wireless stations exchanging packets in the AP’s radio cell. In this scenariothe AP works as a repeater. The Ethernet-to-Ethernet case refers to stations exchangingpackets when connected to the same Ethernet link of the AP. This case is not significantfor our investigation. No actions are required to the AP.
Note that more kinds of traffic streams can be generated combining the previousfour different basic ones. Moreover, data packets can be exchange between two ormore nodes. Therefore, the previous different traffic scenarios can be further sub-divided according to the numbers of streams and/or stations involved.
60

CHAPTER 6. MEASUREMENT OF AP MAXIMUM THROUGHPUT 61
Avaya RG-II 1 Receiver 2 ReceiversTest1 Test2 Test3 Test1 Test2 Test3
Average (Kbps) 3940 3979 3977 3981 3933 3978
Maximum (Kbps) 6720 6720 4320 7200 4240 4320
Minimum (Kbps) 0 0 0 3624 2560 2240
Std. Dev. (Kbps) 223 130 126 284 73 91
Table 6.1: Avaya RG-II downlink test results. The throughput was computed on sequential samples of150 ms each. The measurements confidence level is 95% and the accuracy is 3%.
Cisco AIR1200 1 Receiver 2 ReceiversTest1 Test2 Test3 Test1 Test2 Test3
Average (Kbps) 6945 7024 7025 6956 7030 6957
Maximum (Kbps) 8320 7200 7200 7200 7200 7760
Minimum (Kbps) 0 4240 0 3840 4160 0
Std. Dev. (Kbps) 368 69 98 125 68 411
Table 6.2: Cisco AIR 1200 downlink test results. The throughput was computed on sequential samples of150 ms each. The measurements confidence level is 95% and the accuracy is 3%.
This section investigates the AP saturation throughput generated by the differentkinds of test traffic to identify the one producing the highest result. In the followingsub-sections we examine the AP general performance when handling traffic in differentdirections. All tests were performed according to the recommendations provided in theprevious chapter. The tests were made on the two AP models we used for studying thegeneral behaviour of 802.11 devices (Cisco Aironet 1200 and Avaya RG-II). The AvayaRG-II uses the default configuration (Large cell profile). The Cisco Aironet uses thestandard configuration (Aironet extension on), but enforcing back compatibility withlegacy IEEE 802.11 devices. This is necessary to explain the difference in performancewith respect to the preliminary tests.
6.1.1 AP’s downlink ThroughputDuring this test a station in the Ethernet link sent streams of UDP packets to one ormore stations in the 802.11 radio cell. According to our general test procedure, the testdata stream is made of UDP/IP packets of 1472 bytes of payload. The total amount ofoffered load to the AP is always 800 packets per second. When running tests with morereceivers, the total offered load is equally redistributed between the different streams.Note that, all tests were run up to collect 12805 consecutive samples of 150 ms each.Therefore, the shown saturation throughput measurements have a confidence level of95% and an accuracy of 3%.
Figure 6.1 shows an example of the instantaneous downlink throughput behaviourof Cisco Aironet 1200 and Avaya RG-II. The test was run with one sender and onereceiver.
The previous test was repeated 3 times per AP model using one wireless station as areceiver, and 3 times more with two wireless stations and sending an equal data streamper receiver. Table 6.1 shows the results of the test on the Avaya RG-II. Table 6.2 showsthe results of the test on the Cisco Aironet 1200. Figure 6.2 shows the downlink average

CHAPTER 6. MEASUREMENT OF AP MAXIMUM THROUGHPUT 62
0
2
4
6
8
10
0 5 10 15 20 25 30
Thr
ough
put (
Mbp
s)
Time (min)
(a) Cisco AIR 1200 Downlink Throughput
0
2
4
6
8
10
0 5 10 15 20 25 30
Thr
ough
put (
Mbp
s)
Time (min)
(b) Avaya RGII Downlink Throughput
Figure 6.1: Cisco AIR 1200 and Avaya RG-II downlink test results. The graphs show the specific APthroughput computed on sequential samples of 150 ms each. The two different tests were run the timenecessary to collect 12805 samples.

CHAPTER 6. MEASUREMENT OF AP MAXIMUM THROUGHPUT 63
3500
3600
3700
3800
3900
4000
4100
4200
4300
4400
4500
0 1 2 3 4 5 6 7
Thr
ough
put (
Kbp
s)
Test Session
1 Client2 Clients
(a) Avaya RGII
6500
6600
6700
6800
6900
7000
7100
7200
7300
7400
7500
0 1 2 3 4 5 6 7
Thr
ough
put (
Kbp
s)
Test Session
1 Client2 Clients
(b) Cisco AIR 1200
Figure 6.2: Avaya RG-II and Cisco AIR 1200 downlink test results. Average throughput and confidenceintervals for the different test sessions with 1 and 2 receivers.

CHAPTER 6. MEASUREMENT OF AP MAXIMUM THROUGHPUT 64
5000 5200 5400 5600 5800 6000 6200
6400 6600 6800 7000 7200 7400
450 500 550 600 650 700 750 800 850
Thr
ough
put (
Kbp
s)
Offered Load (pkt/sec)
Figure 6.3: Cisco AIR 1200 downlink throughput with different offered load: from 500 to 800 pkt/sec.The measurements confidence level is 95% and 5% accuracy.
3600 3750 3900 4050
4200 4350 4500
4650 4800 4950 5100 5250 5400
300 350 400 450 500 550 600 650 700 750 800 850
Thr
ough
put (
Kbp
s)
Offered Load (pkt/sec)
Figure 6.4: Avaya RG-II downlink throughput with different offered load: from 350 to 800 pkt/sec. Themeasurements confidence level is 95% and 5% accuracy.
throughput computed at each test repetition and the relative confidence interval of thedifferent measurements. Figure 6.2a shows the Avaya RG-II behaviour, Figure 6.2b theCisco Aironet 1200. Note that the saturation throughput is different for different APs,and it remains within the same confidence interval with one or two wireless stations.
In order to complete the analysis of the downlink behaviour of the APs, it is nec-essary to verify their behaviour with differing offered loads. The Cisco Aironet 1200already produces a very high throughput with the maximum offered load (800pkt/sec).Figure 6.3 shows that the downlink throughput does not change with lower offered loadas long as it is higher then the AP’s maximum downlink throughput.
Instead, the Avaya RG-II produces a lower throughput and requires further investi-gation. Figure 6.4 shows the downlink saturation throughput of the Avaya RG-II withdifferent offered loads and relative confidence intervals (accuracy 5%). The highestAvaya RG-II saturation throughput is reached with an offered load of 450 pkt/sec andits average is 5158 Kbps (confidence level 95%, 3% accuracy). The AP can bridge theentire offered load up to 350 pkt/sec, then it starts to drop packets. Up to 450 pkt/secthe throughput grows, then decreases.
The downlink test shows large performance difference between the AP models. The

CHAPTER 6. MEASUREMENT OF AP MAXIMUM THROUGHPUT 65
Avaya RG-II 1 Sender 2 SendersTest1 Test2 Test3 Test1 Test2 Test3
Average (Kbps) 6168 6161 6159 6386 6494 6442
Maximum (Kbps) 6480 6400 6400 6642 6645 6645
Minimum (Kbps) 5840 5600 5120 2640 3360 3360
Std. Dev. (Kbps) 75 80 84 272 175 224
Table 6.3: Avaya RG-II uplink test results. The throughput was computed on sequential samples of 150ms each. The measurements confidence level is 95% and 3% accuracy.
Avaya RG-II produces a maximum downlink throughput of 5158 Kbps, Cisco Aironet1200 produces 7024 Kbps. The Cisco Aironet 1200 is 36% faster than the Avaya RG-II.Moreover, Avaya RG-II degrades its performance when overloaded, thus its maximumsaturation throughput depends on the offered load.
It is important to note that in the downlink test the only active node in the 802.11radio cell is the AP itself. The wireless stations receive the packets and return thenecessary 802.11 acknowledgment frames. Since, they never send packets in the ra-dio cell, the 802.11 link throughput only depends on the AP. Therefore the aggregatethroughput does not change with the number of wireless receivers and data streams.
6.1.2 AP’s Uplink ThroughputDuring this test one or two wireless stations sent a streams of UDP/IP packets to onestation on the Ethernet link. The test data stream was made of UDP packets of 1472bytes of payload. The maximum total amount of offered load to the AP is 800 packetsper second. Note that the wireless clients sent packets as fast as they can up to a totaloffered load of 800 packets per second. Therefore, the channel load was always lower.In fact it is not possible to send such a large stream on the 802.11 link. When runningtests with more wireless stations, the total data stream is equally distributed betweenthe different senders, i.e. up to 400 packets per second per sender.
The tests were run the time to collect 12805 consecutive throughput samples of 150ms each. Therefore the uplink saturation throughput measurements have a confidencelevel of 95% and an accuracy of 3%.
Figure 6.5 shows an example of the uplink throughput behaviour on a Cisco Aironet1200 and on an Avaya RG-II. The test was run with one sender (wireless station) andone receiver (Ethernet station).
The previous test was repeated 3 times per AP model using one wireless station asa sender and 3 more times using two wireless stations. Note that the same 802.11 clientwireless interface (Orinoco Silver 802.11b PC-card) with the same driver was used forall the tests and all the wireless clients.
Table 6.3 shows the results of the test on the Avaya RG-II. Table 6.4 shows theresults of the test on the Cisco Aironet 1200. Figure 6.6 shows the uplink averagesaturation throughput computed for each test repetition and the relative confidence in-tervals. Figure 6.6a shows the Avaya RG-II behaviour, Figure 6.6b the Cisco Aironet1200. Figure 6.7 compares the uplink throughput of Cisco Aironet 1200 and AvayaRG-II when using 1 and 2 senders. Note that the two APs behave exactly in the sameway with one and with two wireless stations.
The uplink test produces different results with respect to the downlink test. Note

CHAPTER 6. MEASUREMENT OF AP MAXIMUM THROUGHPUT 66
0
2
4
6
8
10
0 5 10 15 20 25 30
Thr
ough
put (
Mbp
s)
Time (min)
(a) Cisco AIR 1200 Uplink Throughput
0
2
4
6
8
10
0 5 10 15 20 25 30
Thr
ough
put (
Mbp
s)
Time (min)
(b) Avaya RGII Uplink Throughput
Figure 6.5: Cisco AIR 1200 and Avaya RG-II uplink test results. The graphs show the AP throughputcomputed on sequential samples of 150 ms each. The two different tests were run the time necessary tocollect 12805 samples.

CHAPTER 6. MEASUREMENT OF AP MAXIMUM THROUGHPUT 67
Cisco AIR1200 1 Sender 2 SendersTest1 Test2 Test3 Test1 Test2 Test3
Average (Kbps) 6147 6145 6144 6423 6488 6373
Maximum (Kbps) 6403 6403 6403 6883 6880 6880
Minimum (Kbps) 5840 5600 5760 2720 2000 1760
Std. Dev. (Kbps) 80 80 82 293 262 328
Table 6.4: Cisco AIR 1200 uplink test results. The throughput was computed on sequential samples of150 ms each. The measurements confidence level is 95% and 3% accuracy.
6000
6100
6200
6300
6400
6500
6600
6700
6800
0 1 2 3 4 5 6 7
Thr
ough
put (
Kbp
s)
Test Session
1 Client2 Clients
(a) Avaya RGII
6000
6100
6200
6300
6400
6500
6600
6700
6800
0 1 2 3 4 5 6 7
Thr
ough
put (
Kbp
s)
Test Session
1 Client2 Clients
(b) Cisco AIR 1200
Figure 6.6: Uplink test results. Average throughput and confidence intervals for the different test sessionswith 1 and 2 senders.
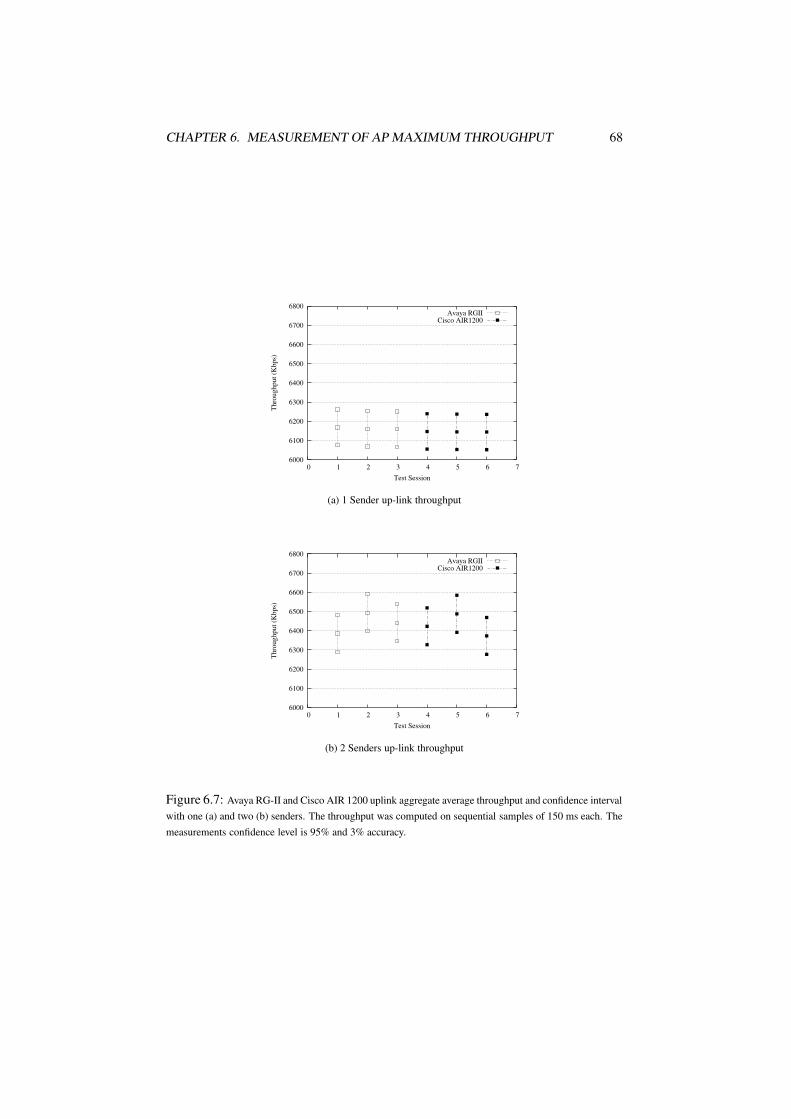
CHAPTER 6. MEASUREMENT OF AP MAXIMUM THROUGHPUT 68
6000
6100
6200
6300
6400
6500
6600
6700
6800
0 1 2 3 4 5 6 7
Thr
ough
put (
Kbp
s)
Test Session
Avaya RGIICisco AIR1200
(a) 1 Sender up-link throughput
6000
6100
6200
6300
6400
6500
6600
6700
6800
0 1 2 3 4 5 6 7
Thr
ough
put (
Kbp
s)
Test Session
Avaya RGIICisco AIR1200
(b) 2 Senders up-link throughput
Figure 6.7: Avaya RG-II and Cisco AIR 1200 uplink aggregate average throughput and confidence intervalwith one (a) and two (b) senders. The throughput was computed on sequential samples of 150 ms each. Themeasurements confidence level is 95% and 3% accuracy.

CHAPTER 6. MEASUREMENT OF AP MAXIMUM THROUGHPUT 69
that:
� Different AP models produce the same uplink saturation throughput.� The number of senders strongly influences the resulting aggregate saturation
throughput. The uplink average aggregate saturation throughput is 6237 Kbpswith one sender and 6522 Kbps with two. The increment is equal to 4.6%.
The characteristics of 802.11 Medium Access Control can explain the observed differ-ence between the uplink and the downlink throughput. The Distributed CoordinationFunction concentrates into the sender all the critical decisions that determine the speedof the packet transmission on the radio link. Generally, an 802.11 receiver is simplerthan the transmitter. The receiver station listens to the channel and when a packet isreceived, it has a well-determined time (SIFS) to return an acknowledgment frame at afixed data rate (usually 2Mbps with 802.11b).
During the downlink test the AP has to perform several operations. It manages theEthernet input queue, applies the packets-bridging algorithm to the received packets,and transmits them on the 802.11 link. The faster the AP, the higher the resultingthroughput.
During the uplink test, the AP receives packets from the 802.11 media and bridgesthem to the Ethernet. This second kind of operation is easier. All the tested APs couldmanage to bridge all the packets coming from the 802.11b media. Therefore, the uplinkthroughput is limited by the sender speed (wireless clients). When using more than onewireless sender, the 802.11 link throughput increases, thus the AP throughput increasesalso.
The uplink test allows studying the general IEEE 802.11b cell and wireless station’scharacteristics more than the behaviour of the AP. The test with one sender showsthe wireless sender’s speed. Increasing the number of wireless senders, the aggregatethroughput increases. This behaviour is coherent with the general characteristics of the802.11 link. In fact, the throughput of an 802.11 link increases with the number ofsenders up to the maximum 802.11 capacity. According to the related work, furtherincrements to the number of senders decreases the aggregate throughput [13].
6.1.3 Wireless-to-Wireless ThroughputAccording to the IEEE 802.11 standard [4] when two wireless stations are in the sameAP cell, they always exchange packets through the AP. The AP works as a repeater inorder to guarantee that the two wireless stations can communicate even if they are atopposite edges of its radio cell.
We run the wireless-to-wireless test in order to verify the 802.11 AP behaviourwhen acting as a repeater. In this case the AP must forward to the destination thepackets just received from the sender. Note that all the packets are transmitted on thesame radio channel. Thus the wireless sender and the AP have to compete to obtainaccess to the same medium. However, the offered load to the AP is limited by thewireless station speed and the 802.11 link capacity with two senders. Only the datastream that reaches the destination contributes to the real test throughput.
Figure 6.8 shows the 802.11 throughput when one wireless station sends to a sec-ond one a stream of 800 UDP packets per second (packet size equal to 1472 bytes ofUDP/IP payload). The test was conduct using the Avaya RG-II. Table 6.5 shows thestatistical indexes for the aggregate throughput and the throughput of each stream. Fig-ure 6.9 and Table 6.6 show the result of the same test on a Cisco AIR 1200. All the

CHAPTER 6. MEASUREMENT OF AP MAXIMUM THROUGHPUT 70
0
2
4
6
8
10
0 10 20 30 40 50 60 70 80 90 100 110 120 130 140
Thr
ough
put (
Mbp
s)
Time (min)
(a) Avaya RGII wireless-to-wireless aggregate throughput onthe 802.11 link
0
2
4
6
8
10
0 10 20 30 40 50 60 70 80 90 100 110 120 130 140
Thr
ough
put (
Mbp
s)
Time (min)
(b) Sender to AP throughput
0
2
4
6
8
10
0 10 20 30 40 50 60 70 80 90 100 110 120 130 140
Thr
ough
put (
Mbp
s)
Time (min)
(c) AP to receiver throughput
Figure 6.8: Avaya RG-II throughput for wireless-to-wireless communications. The test was run up tocollect 7683 consecutive throughput samples of 150 ms.
WS1 to AP AP to WS2 AggregateAverage (Kbps) 2895 2882 5776
Maximum (Kbps) 6240 3520 6800
Minimum (Kbps) 0 0 0
Std. Dev. (Kbps) 1059 1065 2109
Table 6.5: Avaya RG-II Wireless-to-Wireless test result. The throughput was computed on sequentialsamples of 150 ms packets each. The measurement confidence level is 95% with 5% accuracy.

CHAPTER 6. MEASUREMENT OF AP MAXIMUM THROUGHPUT 71
0
2
4
6
8
10
0 10 20 30 40 50 60 70 80 90
Thr
ough
put (
Mbp
s)
Time (min)
(a) Avaya RGII wireless-to-wireless aggregate throughput onthe 802.11 link
0
2
4
6
8
10
0 10 20 30 40 50 60 70 80 90
Thr
ough
put (
Mbp
s)
Time (min)
(b) Sender to AP throughput
0
2
4
6
8
10
0 10 20 30 40 50 60 70 80 90
Thr
ough
put (
Mbp
s)
Time (min)
(c) AP to receiver throughput
Figure 6.9: Cisco AIR 1200 throughput for wireless-to-wireless communications. The test was run up tocollect 7683 consecutive throughput samples of 150 ms.
WS1 to AP AP to WS2 AggregateAverage (Kbps) 3265 3264 6529
Maximum (Kbps) 3680 3680 7280
Minimum (Kbps) 0 0 0
Std. Dev. (Kbps) 176 180 346
Table 6.6: Cisco AIR-1200 Wireless-to-Wireless test result. The throughput was computed on sequentialsamples of 150 ms packets each. The measurement confidence level is 95% with 5% accuracy.

CHAPTER 6. MEASUREMENT OF AP MAXIMUM THROUGHPUT 72
Avaya RG-II Cisco AIR 1200Uplink Downlink 802.11 Uplink Downlink 802.11
Average (Kbps) 4610 579 5791 1975 4806 6920
Maximum (Kbps) 6720 5920 6640 2480 6000 7200
Minimum (Kbps) 0 0 0 400 0 0
Std. Dev. (Kbps) 1173 832 128 163 218 293
Table 6.7: Uplink/downlink test results. The throughput was computed on sequential samples of 150 mseach. The measurements confidence level is 95% and 5% accuracy.
measurements have a confidence level of 95% and 5% accuracy.
6.1.4 Uplink/downlink ThroughputThe previous sub-sections illustrate the behaviours of different APs when bridgingpackets into one of the three directions: downlink, uplink, wireless-to-wireless. Inthis section we examine the behaviour of the same APs when simultaneously bridgingtraffic in different directions.
We only examine the case of simultaneous uplink/downlink traffic. For simplicity,we limit our investigation to only two nodes: one Ethernet station and a wireless station.Each node sends to the correspondent node a stream of 400 UDP packets per second(total AP offered load is 800 pkt/sec). More nodes on the Ethernet link do not changethe traffic characteristics in both directions. On the wireless side, more nodes implyslightly higher uplink traffic, there is no change in the downlink stream. The fact thatthe AP has to handle a few more MAC addresses for different destinations should nothave a significant impact on performance.
Figure 6.10 shows the behaviour of the Avaya RG-II. Figure 6.11 shows the be-haviour of the Cisco Aironet 1200. Table 6.7 shows the average uplink and downlinkthroughputs of the two APs. The average values are calculated with a confidence levelof 95% and an accuracy of 5%. Note that the downlink throughput average of AvayaRG-II has a coefficient of variation larger than 1! The specific result most probably hasa lower confidence level and accuracy than the other ones. We did not consider impor-tant to repeat the measurement taking more samples. in this section t is more importantto underline the anomalous low performance of the downlink throughput more than itsabsolute correct value.
The result of this test quotes the results of the previous ones with some peculiarities.Table 6.7 shows the aggregate throughput of the 802.11 cell. The Avaya RG-II 802.11throughput is much higher than the sum of the uplink and downlink average throughput.The downlink throughput is measured on the radio link and is low. Thus, a large part ofthe 802.11 throughput is enforced by the wireless client transmitting data. However, apart of this traffic is not bridged in the Ethernet link, but dropped by the AP (the AP wasconnected to the Ethernet node with a cross-over cable using Ethernet in full-duplexmode).
The Avaya RG-II has limited downlink capacity. Therefore, when different stationstransmit on the 802.11 medium together with the AP, they take a larger bandwidth par-tially compensating for the low AP performance. Note that the Avaya RG-II uplinkthroughput with one sender was 6162 Kbps, higher than the 802.11 throughput mea-sured in this test. This result is partially explained by the several 802.11 data flow

CHAPTER 6. MEASUREMENT OF AP MAXIMUM THROUGHPUT 73
0
2
4
6
8
10
0 10 20 30 40 50 60
Thr
ough
put (
Mbp
s)
Time (min)
(a) 802.11 aggregate link throughput
0
2
4
6
8
10
0 10 20 30 40 50 60
Thr
ough
put (
Mbp
s)
Time (min)
(b) Down-link Throughput
0
2
4
6
8
10
0 10 20 30 40 50 60
Thr
ough
put (
Mbp
s)
Time (min)
(c) Up-Link Throughput
Figure 6.10: Avaya RG-II uplink/downlink throughput behaviour. The test was run the necessary time tomeasure the throughput with a confidence level of 95% and with 5% accuracy.

CHAPTER 6. MEASUREMENT OF AP MAXIMUM THROUGHPUT 74
0
2
4
6
8
10
0 10 20 30 40 50 60 70 80 90
Thr
ough
put (
Mbp
s)
Time (min)
(a) 802.11 aggregate link throughput
0
2
4
6
8
10
0 10 20 30 40 50 60 70 80 90
Thr
ough
put (
Mbp
s)
Time (min)
(b) Down-link Throughput
0
2
4
6
8
10
0 10 20 30 40 50 60 70 80 90
Thr
ough
put (
Mbp
s)
Time (min)
(c) Up-Link Throughput
Figure 6.11: Cisco AIR 1200 uplink/downlink throughput behaviour. The test was run the necessary timeto measure the throughput with a confidence level of 95% and with 5% accuracy.

CHAPTER 6. MEASUREMENT OF AP MAXIMUM THROUGHPUT 75
interruptions (2.5% of samples have a null throughput value). A second factor mightbe the different data link rate used to transmit the packets by the client and by the AP.
The Cisco Aironet 1200 has a different behaviour. Uplink and downlink streamsshare the available 802.11 bandwidth in almost fair way. Moreover, almost all thetransmitted uplink packets reach the destination Ethernet node.
The 802.11 throughput (6920 Kbps) is higher than the highest measured in the up-link test (6488 Kbps), and lower than the throughput of the downlink test (7000 Kbps).By default, Cisco Aironet 1200 uses a non IEEE 802.11 compliant contention window.The use of a smaller contention window allows improving the downlink throughputreducing the average idle time between two consecutive packets sent by the AP. Thisspecial configuration produces the highest throughput when only the AP is transmitting(see Cisco AIR 1200 downlink test). Instead, it does not give any benefit when the APis only receiving data (Cisco AIR 1200 has the same uplink performance as the AvayaRG-II). The uplink/downlink test produces an intermediate result. However, note thatthe downlink throughput in this test is higher than the uplink test.
6.1.5 ConclusionsThe aim of this work is to measure the maximum saturation throughput of different802.11 APs. In the previous sub-sections we examined a set of tests and we underlinedthe general results. Now, it is possible to identify which test or tests combination canbe used to measure the maximum saturation throughput of any 802.11 AP model.
Figure 6.12 shows the average aggregate throughput and confidence interval result-ing from the previous tests on Avaya RG-II and Cisco Aironet 1200. Note that theuplink test result is for the 2 wireless senders case. The aggregate throughput reportedfor the uplink/downlink test is the aggregate throughput of the 802.11 cell. This valueis an approximation of the up/down link aggregate throughput value.
Figure 6.12 shows that there is not a unique test that always produces the maximumsaturation throughput with any AP model. For example, the Avaya RG-II producesthe highest throughput when performing the uplink test. Instead, Cisco Aironet 1200produces the highest throughput with the downlink test.
We showed that the uplink test throughput is linked to the wireless station transmis-sion speed (see section 6.1.4). In fact, different AP models produce the same uplinkthroughput when using the same clients. It is very important to note that the uplink testproduces an aggregate throughput that is close to the maximum capacity of the 802.11medium (in optimal condition and with the proper number of wireless stations). Theconsequence of this is that the maximum throughput of any AP model is the maximumcapacity of the 802.11 link.
Our first conclusion is supported by all our test results. However, it cannot begenerally extended to any given AP model. It is always necessary to verify the uplinkcapacity of any AP model that will not reach the 802.11 link capacity with other kindsof tests. However, an AP that never reaches the maximum 802.11 link throughput isclearly an example of a broken or not properly designed device.
Two important issues still need to be solved:
� The Cisco Aironet 1200 has downlink throughput higher than uplink one.
� Different AP models have different performance despite the fact that they pro-duce the same maximum throughput.
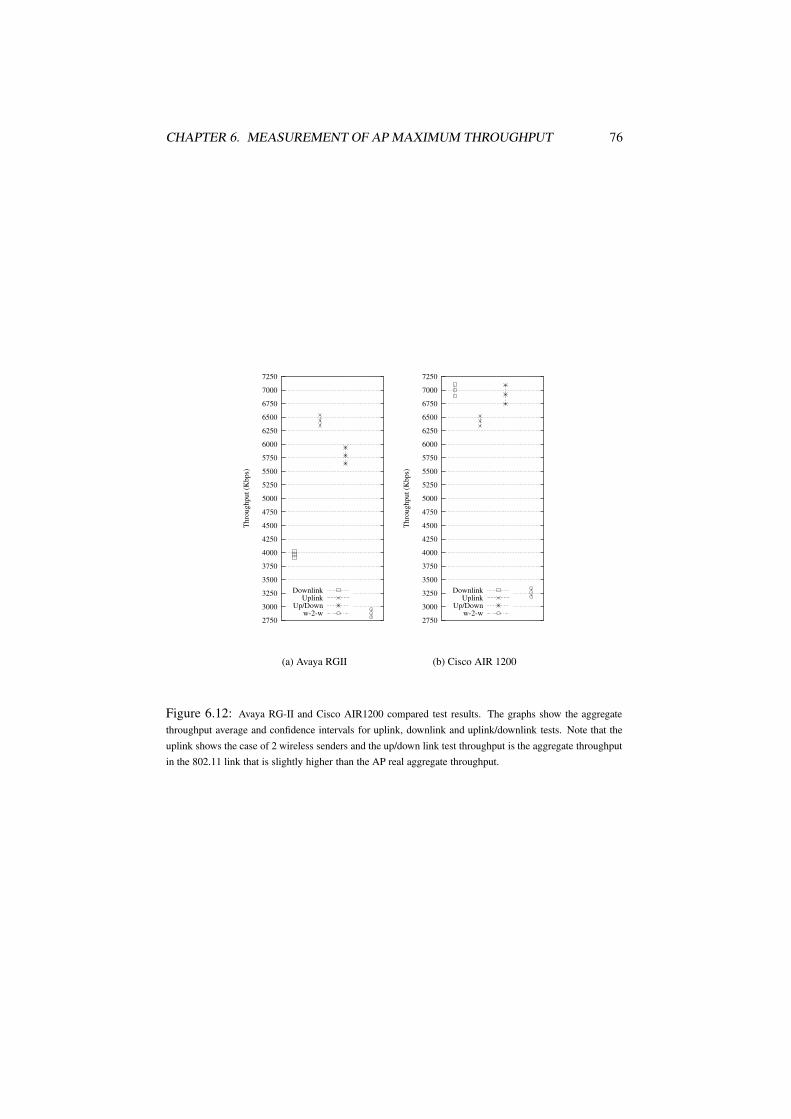
CHAPTER 6. MEASUREMENT OF AP MAXIMUM THROUGHPUT 76
2750
3000
3250
3500
3750
4000
4250
4500
4750
5000
5250
5500
5750
6000
6250
6500
6750
7000
7250
Thr
ough
put (
Kbp
s)
DownlinkUplink
Up/Downw-2-w
(a) Avaya RGII
2750
3000
3250
3500
3750
4000
4250
4500
4750
5000
5250
5500
5750
6000
6250
6500
6750
7000
7250
Thr
ough
put (
Kbp
s)
DownlinkUplink
Up/Downw-2-w
(b) Cisco AIR 1200
Figure 6.12: Avaya RG-II and Cisco AIR1200 compared test results. The graphs show the aggregatethroughput average and confidence intervals for uplink, downlink and uplink/downlink tests. Note that theuplink shows the case of 2 wireless senders and the up/down link test throughput is the aggregate throughputin the 802.11 link that is slightly higher than the AP real aggregate throughput.

CHAPTER 6. MEASUREMENT OF AP MAXIMUM THROUGHPUT 77
The first point is related with the fact that the Cisco Aironet 1200 does not use an IEEE802.11 compliant contention window. See the uplink/downlink test result explanation(section 6.1.4). Access Points using this kind of solution will not meet our generalconclusion, but they are exceptions.
The second point shows the fact that the generic maximum saturation throughputis not a figure of merit for the 802.11 APs. In fact, we already concluded that all theAP models should be able to get the same maximum performance level. The results ofall our previous tests show that the AP’s key performance index is the downlink max-imum saturation throughput. Different AP models have different downlink maximumsaturation throughput.
For the rest of this document we focus on the downlink maximum saturation through-put. However, if an AP model does not provide an appropriate maximum downlinksaturation throughput, we verify the maximum AP uplink throughput as well. Thisoperation is necessary in order to validate our general conclusions that the maximumsaturation throughput of any given AP is however equal to the maximum 802.11 ca-pacity.
6.2 Maximum Saturation Throughput Measurement Pro-cedure
This section describes our recommend procedure for measuring the IEEE 802.11 APmaximum saturation throughput.
Chapter 3 presented the general definition of saturation throughput and the differentconditions necessary to maximise it when working with 802.11 devices. In the samechapter, we presented a set of 802.11 AP behaviours that can make difficult to deter-mine the real maximum throughput. Chapter 5 defined the statistical framework forperforming the measurement. In the section above different kinds of AP’s throughputwere examined and a set of necessary tests were defined.
In this section we describe a throughput measurement procedure that allows testingany kind of 802.11 APs. The first sub-section presents the necessary steps to performa complete test on an AP. The second sub-section describes the recommended testbedfor performing the test.
6.2.1 Test ProcedureAccording to the conclusion of section 6.1, two kind of analysis are necessary on eachIEEE 802.11 AP model:
� Measurement of the AP performance, and
� Validation of the AP maximum saturation throughput.
The first step is performed with the downlink throughput test. The second step is per-formed running the uplink test. The expected test result of the last test is that the uplinkmaximum saturation throughput is equal the 802.11 link maximum capacity. The sec-ond step will be performed only when the AP cannot reach the maximum 802.11 linkcapacity when downloading data.
We can describe the entire procedure as a sequence of four steps:
1. Set up of the test environment

CHAPTER 6. MEASUREMENT OF AP MAXIMUM THROUGHPUT 78
2. Identification of the optimal AP orientation
3. Measurement of the AP throughput performance (downlink test)
(a) Optimal offered load measurement
(b) Maximum downlink throughput measurement
4. (Optional) Verification of the maximum AP throughput (uplink test)
Our recommended testbed, described in the section 6.2.2 covers the first step. Thefollowing sub-sections describe the other steps.
6.2.1.1 Optimal AP orientation
The goal of this specific test is to discover the AP radio interface characteristics. Ifan AP performs differently depending on the antenna orientation, the best orientationneeds to be identified. Unfortunately, an exhaustive and accurate investigation needs avery large amount of time and resources.
An AP can be turned in an almost infinite number of ways. However, any APmodel has always a clear top and bottom. Many times the vendor recommends anoptimal mounting direction for the AP. Therefore it is always possible to restrict theinvestigation to the AP rotation around its vertical axis.
The most appropriate test to perform is the downlink one. In fact we need to stressthe radio interface and verify the AP performance with different orientations.
We recommend to run at least 4 tests turning the AP 90 degrees around the verticalaxis after each test, without moving the wireless clients. Note that this procedure doesnot allow exactly measuring the optimal AP orientation, but only allows discoveringthe main antenna characteristics and selecting a proper AP orientation.
The downlink throughput measurements still require a confidence level of 95%, butwe use an accuracy of 5% instead of 3%. In this way the number of necessary samplesis 7683 saving 60% of the test time per session with respect to the time for achievingan accuracy of 3%.
It is important to note that this kind of test often does not produce clear uniqueresults. The effect of the antenna’s orientation is not always clear because it is relatedwith unpredictable and not controllable environmental conditions. For example: theAvaya RG-II often has unstable performance with instant throughput changing arounddifferent levels (See the result of preliminary tests, figures: 4.2, 4.3, 4.5). It was ob-served that tests performed with a non-optimal orientation produced the highest levelof throughput also. Therefore, the antenna orientation produces measurable effect onlyin combination with other not reproducible environmental conditions. In general a notoptimal orientation increase the performance instability.
We recommend to run this kind of test and to use the resulting best AP’s orientation.In case no specific orientation is found, any can be used. In this case it might bepossible that performing other tests, a result instability will be observed. In this case,it necessary to run again the antenna orientation test to verify if it is possible to find anoptimal orientation in the current environmental conditions.
6.2.1.2 Measurement of the AP throughput performance
This test is performed in two separate steps:

CHAPTER 6. MEASUREMENT OF AP MAXIMUM THROUGHPUT 79
� Optimal offered load measurement� Maximum downlink saturation throughput measurement
Some APs experience performance degradation when the offered load is higher thanthe AP bridging capacity. For example, the Avaya RG-II produces the highest down-link throughput with an offered load of around 450 packets per second and then thethroughput decreases.
In order to find the optimal offered load, the AP should be tested with all the pos-sible loads. Because the test data stream is made of UDP packets of a fixed dimension(1472 bytes of UDP payload), the only possibility is to change the packet transmissionrate from 1 to 900 packets per second (about 11 Mbps).
An exhaustive investigation requires a long time and many resources. Therefore werecommend restricting the offered load test range in order to make practically possiblethe measurement of the optimal offered load. This is possible by defining appropriatetest granularity and optimising the test procedure.
In order to minimise the number of necessary test sessions, we recommend startingthe test from the highest possible offered load supported by the Ethernet link and thendecreasing it. Using IEEE 802.11b, the APs may have legacy Ethernet (10Mbps) orFast Ethernet (100Mbps) interfaces. In order to have a fair test condition, it is necessaryto run the test with offered loads up to 10Mbps (800 packet per second using packet sizeequal to the standard Ethernet MTU of 1500 bytes). After a first test session with anoffered load of 800 packets per second, the test is repeated several times decreasing theoffered load by 100 packets per second each session. The procedure is repeated as longas the measured AP throughput increases or up to the offered load that is completelybridged. In the first case, when the AP throughput decreases, a final test with an offeredload of 50 packets per second more and less than the last tested offered load should beconducted. We recommend measuring the AP throughput with a confidence level of95% and an accuracy of 5%. The approximation used for determining the optimaloffered load suggests the opportunity of using a lower accuracy.
The optimal offered load is the one producing the highest saturation throughputwithin the performed tests. In the case of different offered loads producing the sameAP throughput, the highest of those values is selected as the optimal one for performingthe following test.
The result of this test already produces a measurement of the downlink maximumsaturation throughput but with an accuracy of 5%. We recommend repeating the down-link test with the optimal offered load, but achieving a confidence level of 95% and 3%accuracy.
6.2.1.3 Maximum AP throughput verification
If the previous tests produce a maximum AP’s throughput lower then the 802.11 linkcapacity, the uplink test is necessary. The aim of this test is to validate our conclu-sion that the maximum saturation throughput of any given 802.11 AP is equal to themaximum 802.11 link capacity.
The uplink test may be performed with one or more wireless clients sending UDP/IPstreams to an Ethernet node. In order to reach the maximum 802.11 link capacity sev-eral wireless client are necessary. An acceptable approximation can be reached byusing two clients, but even a single one is significant if the downlink maximum sat-uration throughput of the AP was low. During this test, we recommend achieving ameasurement confidence level of 95% with 3% accuracy.

CHAPTER 6. MEASUREMENT OF AP MAXIMUM THROUGHPUT 80
IEEE 802.11BSS
Ethernet Node
WirelessNode
MonitorNode
100MbpsHub
EthernetSwitch
Figure 6.13: Testbed for IEEE802.11 AP throughput Measurements.
6.2.2 Testbed for Maximum Throughput measurementsThis section describes our recommended testbed for measuring the IEEE 802.11 APthroughput.
Several times we recommended measuring the 802.11 APs throughput in an opti-mal environment. The general recommendations of section3.2 can be practically im-plemented in the following way:
� The test area has to be a small room, such as an office. All the wireless stationsare placed in a close range without any obstacles in between.
� The distance between the different radio stations (AP and wireless clients) haveto be small and must be constant during the test session. Note that the wirelessstations distance must be larger than one meter to respect the vendor’s recom-mendations.
� No other APs and/or BSS (i.e. peer-to-peer cells) should be active in the area toavoid radio interferences. In case other 802.11 channel are in use, they must notoverlap the channel in use for the test.
The last point is not always easy to verify. The radio spectrum can be scanned usingspecific tools designed for this purpose and usually distributed with IEEE 802.11 clientinterfaces. For example: we used the Orinoco Client Manager1. Unfortunately, thiskind of tool reports the presence of different APs in the area, but they do not alwaysshow the presence of IEEE 802.11 peer-to-peer (Ad-Hoc) cells. Moreover, softwaretools cannot produce a complete scan of the radio spectrum to identify different radionoise sources. For example: it is not possible to find non IEEE 802.11 devices usingan overlapped radio spectrum.
The presence of a different radio noise source might be discovered by analysing theperformance of a well-known AP and with a screening of the signal and noise levels asreported by the 802.11 client cards.
Figure 6.13 shows our basic testbed.In order to perform the test, at least three different computers are necessary:
� Ethernet Node. This machine is used to generate and/or receive the test packetstream on the Ethernet link
1Orinoco Wireless, Proxim Inc.: http://www.orinocowireless.com

CHAPTER 6. MEASUREMENT OF AP MAXIMUM THROUGHPUT 81
� Wireless Node. This machine is used to generate and/or receive the test packetstream on the wireless link. Multiple machines are optional
� Monitor Node. This machine listens both links: Fast Ethernet and 802.11. Thetraffic on both networks is recorded for a later traffic analysis
One Ethernet link is used to transport the test packet stream to the AP and a secondindependent one for distributing test management information, for example time syn-chronization between all the nodes. The Monitor node records the traffic on both inter-faces. This is a completely passive node in both tested links. Using a separate machinefor recording the traffic, we completely separate the measurement system from themeasured one. Moreover, we can minimise the time synchronization problems. In fact,the reception time stamps of the packets on the two networks in the monitor machineare always relative to the same system clock. Note that not all the tests need to dumptraffic on both sides of the AP.
The packet stream was generated using an open source tool called MGEN2. Thistool allows generating and/or receiving UDP/IP streams of packets with a configurabledimension and transmission rate.
For our 802.11b AP tests, we used Linux on the different stations and the followingset of wireless cards:
� Wireless Sender/Receiver. Orinoco 802.11b Silver card with orinoco_cs Linuxdriver distributed with the 2.4.x kernel
� Wireless recorder. Symbol LA 2141 or ZoomAir 4100 with host-AP3 driver
In order to record the network traffic on both 802.11 link and the Ethernet, we usedtcpdump4. Note that only the packet header and size need to be recorded.
The throughput calculation and traffic analysis were done using special tools wecreated for parsing the packet-dumped files generated with tcpdump. Three differentprograms were made. The first program parses the 802.11 packet dump. The sec-ond tool parses the Ethernet packet dump. These two programs extract the differentthroughput sample set from the trace files discarding the initial transient (first secondof the test) and reporting general statistical information (i.e. number of parsed packets,and for 802.11 the number of frame retransmission, beacons, etc...). The third pro-gram parses the sample set produced by the previous tools and computes the differentstatistical indexes (i.e. average, maximum, minimum and standard deviation).
Two different programs are necessary for parsing the trace files. In fact, tcpdumpproduces different packet traces for the two different mediums: 802.11 and Ethernet.In particular, the 802.11 traffic was dumped using the 802.11 monitoring mode thatshows management frames not available on the Ethernet link (i.e. acknowledgments,probing, beacons, etc...). Note that different tcpdump versions may produce differenttrace files. Moreover, different 802.11 cards in monitoring mode may show more orless frame details. For all these reasons, our tools cannot be used in different testbed,but they need to be adapted to the specific case.
It is important to note that the proposed testbed potentially introduces some mea-surement errors. A systematic error may be introduced because of the different delaysdue the packet propagation times. Building our testbed, we assumed that the hub was
2MGEN: The Multi-Generator Toolset. http://manimac.itd.nrl.navy.mil/MGEN/3Host AP driver for Intersil Prism2/2.5/3. http://hostap.epitest.fi/4http://www.tcpdump.org/

CHAPTER 6. MEASUREMENT OF AP MAXIMUM THROUGHPUT 82
able to transmit the packets on the different ports simultaneously. Similarly, we as-sumed that the packets arrived at the same time to the monitor and to the destinationnode. These errors are relatively very small and did not influence our measurement. Infact, we measured the throughput, not the delay of the packets.
We measure the throughput using software tools running on standard Linux in-stallations. Thus, the measurement errors are related with the software and systemperformance. In particular, the precision of the packet time stamp can be critical withrespect to the measurement precision. In Chapter 3, section 5, we already analysed thisproblem. The single packet reception time-stamp can be influenced by a relatively largeerror. However, by using throughput samples made of several packets and collecting alarge sample size we can reduce this kind of error to an acceptable range.
A different problem is due to the usage of an Ethernet Hub to connect the Ethernetnode with the AP and the Monitor node. The hub may leak packets affecting thecorrect execution of the tests. Only the packets that actually reach the destination areconsidered in our system. However, changes to the offered load, or problems in theEthernet packets transmission can influence the measured results. Preliminary testswere run to verify the correct behaviour of the hub when handling the load producedby the test streams and the general correct behaviour of the device. However, weobserved several problems when using multi-directional streams. Therefore, we used acrossover cable connection between Ethernet node and the AP during such a test. Thusthe Ethernet node recorded the data stream in the Ethernet link during these kinds oftests.
6.2.3 Important NotesAccording to the throughput definition provided in section 3.1, we computed the APsthroughput at network level (level 3). All the network protocol packets transmitted onthe wireless link are accounted for the throughput computation, but not the 802.11 linkcontrol and management frames.
It is possible to perform different levels of investigation:
� Throughput Analysis: basic throughput performance analysis to calculate theperformance of a specific AP
� Behavioural Analysis: the purpose is not only to calculate the APs throughputperformance, but also to investigate the reasons for the resulting performance
These two kinds of analysis are performed in a similar way using the same testbed andprocedure. The key difference is how deeply the 802.11 link is analysed.
In order to provide a simple throughput analysis, it is only necessary to dump thepackets transmitted on the 802.11 link using a tool such as tcpdump and a standard802.11 client card with is normal driver. All the transmitted packets are visible ascoming from a standard Ethernet link; no information is available about the 802.11link.
In order to perform a deeper AP performance analysis, it is necessary to collectmore information about the 802.11 link. Using particular wireless interfaces and withspecific drivers is it possible to dump all the 802.11 link layer frames including theAP’s beacons, 802.11 link acknowledgment frames and all management and control802.11 frames. This deeper kind of analysis requires more resources in terms of timeto set up the necessary drivers and tools and complexity of the traffic analysis comparedto the standard one.

CHAPTER 6. MEASUREMENT OF AP MAXIMUM THROUGHPUT 83
It is important to note that both approaches have some important drawbacks:
� Current 802.11b client interfaces and/or their drivers seem to not efficientlydump all 802.11b link frames in monitoring mode. Several 802.11 frames aredropped along a test. In order to avoid erroneous throughput measurements it isnecessary to carefully analyse the traffic dump to identify possible errors. Forexample: the analysis of the traffic dump often shows consecutive 802.11 ac-knowledgment frames. This happens because some frames were dropped (atleast one data frame). In order to avoid measurement errors, samples includingpossible errors have to be discarded.
� In order to make correct throughput measurement, the monitor node must becompletely passive. This condition can be only achieved setting the 802.11 wire-less client to monitoring mode, but this mode make many wireless card driversreturning 802.11 link frames. A possible compromise could be to use the wire-less monitor interface in infrastructure (managed) mode but without assigningany IP address to it and avoiding generating any packet on the wireless link.However, some AP models deassociate the wireless client if it does not transmitpackets for more than a few minutes. When the client is deassociated tcpdumpdoes not dump any more packets and the test fails.
A solution is to set the sniffer wireless card to monitoring mode, but without forcingto dump 802.11 link frames information. This kind of configuration is only possiblewith some specific 802.11b cards. Moreover, using this configuration one collects aminimal set of information and it is impossible to verify if (and when) the monitorsystem drops packets (i.e. miss-behaviours of the wireless card in monitoring mode oreven temporary radio reception failures).
We suggest to set the sniffer wireless interface to monitoring mode and to dump allthe 802.11 link frames. In this way it is possible to get as much information about theAP behaviour as possible. Moreover, 802.11 frames lost can be identified during thetraffic analysis and the resulting measurement errors limited.
It is important to note that the procedure to minimize the sample errors impliesenlarging the different test sessions times. Because the possible invalid samples thathave to be discarded, it is not possible to exactly estimate the total test session time.Therefore, it is necessary to run each test sessions for a longer time in order to collectenough data for the throughput computation.
Chapter 7
IEEE 802.11 AP’s SaturationThroughput
This chapter presents the results of the tests we performed on several different APmodels according to our procedure, and it has two aims. The first one is to validate ourrecommended test procedure. The second one is to verify the general conclusions wepresent in the previous chapter. In particular:
� The maximum downlink saturation throughput is the key throughput perfor-mance index of any 802.11 APs
� The maximum saturation throughput of all 802.11 APs is equal to the maximum802.11 link capacity. Some APs reach the highest performance bridging trafficdownlink and uplink, other APs only on the uplink
7.1 Former Lucent productsIn this section we analyse the performance of a set of 802.11b APs with different char-acteristics distributed by different vendors. The common aspect of all these devices isthe fact that they are different evolutions of the former Lucent Inc. WaveLAN 802.11products.
All the APs we examine in this subsection are based on exactly the same radioimplementation. All devices are made of a main unit that changes depending on theAP model, and a PCMCIA wireless card that includes the 802.11 specific hardware(MAC protocol implementation chipset, radio modem and radio antenna). The PC-Card used by the different APs is exactly the same and it can be exchanged betweendifferent units. Note that this PCMCIA wireless card is a regular former Lucent, nowProxim/Orinoco or Avaya 802.11b client card. One can take the wireless interface fromthe AP and plug into your notebook and vice-versa.
We examine all these APs together in order to analyse and compare the differentAPs behaviours knowing that all the devices use the same radio implementation.
7.1.1 Avaya RG-IIThe RG-II is a low-price device for home usage. The AP is made of an electronic boardwith a PCMCIA interface placed on one of the sides. The radio module is an Avaya
84

CHAPTER 7. IEEE 802.11 AP’S SATURATION THROUGHPUT 85
3000
3200
3400
3600
3800
4000
4200
4400
4600
4800
5000
0 90 180 270
Thr
ough
put (
Kbp
s)
Orientation
Figure 7.1: Avaya RG-II downlink throughput versus AP/Client orientation. The diagram shows theaverage throughput value and its confidence interval (confidence level 95%, 5% accuracy).
0 Degrees 90 Degrees 180 Degrees 270 DegreesAverage 3984 3991 3982 3981
Maximum 4320 4320 6880 6480
Minimum 3760 3680 3040 3760
Sdt. Dev. 77 82 107 84
Table 7.1: Avaya RG-II downlink throughput versus orientation (average confidence level 95%, accuracy5%).
PCMCIA wireless client.In the previous chapter, we already examined the behaviour of the RG-II, here
we briefly summarize the main characteristics adding extra details. Figure 7.1 showsthe downlink saturation throughput with different AP’s orientations. The 0 degreesposition corresponds to the AP front side facing the client. Table 7.1 compares thestatistical indexes of the different test-session results. Note that it is not possible toidentify any particular orientation. During the preliminary tests, we observed a clearantenna orientation effect (see figure 4.5) with an optimal orientation of 180 degrees.There are two non-mutually exclusive possible explanations for such a result:
� The different tests were performed at the same place, in the same general condi-tions, but at different times. Despite all measurable parameters showing the sameenvironment conditions, we still cannot be sure that the overall environmentalconditions were exactly the same. It is possible that at the time we performedthe tests there were different conditions than when we run the preliminary ones.
� Unfortunately, the AP we used for the preliminary test was accidentally broken.To perform this last test we used a second identical station (i.e. exactly samehardware and firmware). However, it could be that there was small but importantdifferences in the two units that may explain the different antenna performance.
According to the current AP’s orientation test results and our previous experience, we

CHAPTER 7. IEEE 802.11 AP’S SATURATION THROUGHPUT 86
3600
3750 3900
4050
4200 4350
4500
4650 4800
4950
5100 5250
5400
300 350 400 450 500 550 600 650 700 750 800 850
Thr
ough
put (
Kbp
s)
Offered Load (pkt/sec)
Figure 7.2: Avaya RG-II downlink throughput versus offered load. The diagram shows the averagethroughput value and its confidence interval (confidence level 95%, 5% accuracy).
350pkt/sec 400pkt/sec 450pkt/sec 500pkt/sec 600pkt/sec 700pkt/sec 800pkt/sec
Average (Kbps) 4200 4779 5158 4780 3821 3825 3982
Maximum(Kbps) 5600 5840 6560 4960 3920 4000 6880
Minimum(Kbps) 2560 3440 4960 4560 3680 3604 3040
Sdt. Dev. (Kbps) 59 174 69 65 38 60 107
Table 7.2: Avaya RG-II downlink throughput versus offered load.
decided to use an AP’s orientation of 180 degrees, an optimal orientation according tothe preliminary tests.
Figure 7.2 shows the downlink throughput versus the offered load. Table 7.2 com-pares the statistical indexes of the different test-session results. The Avaya RG-II pro-duces the highest saturation throughput with an offered load of 450 pkt/sec. Note thatthe performance degrades 22% with respect to the maximum value when offering aload equal to the full Ethernet link capacity (800 pkt/sec).
Figure 7.3 shows the instant saturation throughput of the Avaya RG-II in optimalconditions (180 degrees AP orientation, 450 pkt/sec offered load) and the Table 7.3reports the relative statistical indexes. This test was run in order to collect 12805 con-secutive samples of 150ms each. Therefore the average value has a confidence level of95% and 3% accuracy.
Average (Kbps) 5158
Maximum (Kbps) 6560
Minimum (Kbps) 4960
Sdt. Dev. (Kbps) 69
Table 7.3: Avaya RG-II downlink maximum saturation throughput significant statistical indexes (confi-dence level 95%, 3% accuracy).

CHAPTER 7. IEEE 802.11 AP’S SATURATION THROUGHPUT 87
0
2
4
6
8
10
0 5 10 15 20 25 30
Thr
ough
put (
Mbp
s)
0
100
200
300
400
0 5 10 15 20 25 30
N. R
tx
Time (min)
Figure 7.3: Avaya RG-II downlink instant saturation throughput in optimal conditions (180 degrees APorientation, 450 pkt/sec offered load) and cumulate number of packet retransmissions.
Note that the Avaya RG-II downlink maximum saturation throughput is lower thanthe IEEE 802.11b link capacity. However, the 802.11 data link traffic analysis does notshow any abnormal behaviour during the test that may explain such a result. The APsends the beacons at regular intervals (102 ms average beacon transmission interval,no detected missing beacon). The 802.11 link packet retransmission rate is fairly low:0.04% of 802.11 data frames were retransmitted (358 retransmissions over 834165 totalpackets). No 802.11 management packets were sent. Thus, no RTS/CTS messages,association request/reply, authentication request/reply or probing request/reply weresent.
A likely conclusion is that the AP cannot simply transmit packets faster, thereforethe channel is not used for a large fraction of the time. The number and distribution ofthe 802.11 data frame retransmission events and the value of the maximum throughputcould suggest the alternative possibility that this AP only sends data at 5.5 Mbps. Toverify this hypothesis, we performed a short downlink test where we captured even theradio header of the 802.11 frames. This test showed that all data frames are sent at11Mbps, so the first hypothesis was the correct one.
On the other hand, it is important to note that the Avaya RG-II uplink traffic isequal to the maximum IEEE 802.11b link, as was demonstrated in section 6.1. Thus,the Avaya RG-II confirms the hypothesis that the maximum saturation throughput ofany AP model is equal to the 802.11 link capacity. However, this AP reaches themaximum link capacity only when bridging the traffic uplink.
7.1.2 Proxim/Orinoco AP1000This device was originally developed by Lucent Inc. and distributed as WaveLANAP1000, and then it was distributed as Orinoco AP1000 (this is the version we tested),Avaya AP1, and with different names by different OEMs. This product was recently

CHAPTER 7. IEEE 802.11 AP’S SATURATION THROUGHPUT 88
5600
5800
6000
6200
6400
6600
6800
7000
0 90 180 270
Thr
ough
put (
Kbp
s)
Orientation
Figure 7.4: Orinoco AP1000 downlink saturation throughput versus AP/Client orientation. The diagramshows the average throughput value and its confidence interval (confidence level 95%, 5% accuracy).
0 Degrees 90 Degrees 180 Degrees 270 DegreesAverage 6424 6622 6611 5859
Maximum 7040 6960 6960 6960
Minimum 0 5920 4000 3920
Sdt. Dev. 695 145 221 113
Table 7.4: Orinoco AP1000 downlink saturation throughput versus AP/Client orientation (average confi-dence level 95%, accuracy 5%).
discontinued from the market.Figure 7.4 shows the downlink saturation throughput with different AP’s orienta-
tions with respect to the client. The 0 degrees position corresponds to the AP front sidefacing the client. Table 7.4 compares the statistical indexes of the different test-sessionsresults. Note that the AP’s orientation has a significant impact on the performance. Thetest showed that with some AP orientation ranges, the antenna performs better produc-ing more stable throughput levels. Figure 7.5 shows the instant saturation throughputproduced by the Orinoco AP1000 with the best and worse AP’s orientations. Note thelarge different number of retransmitted packets in the two cases.
Figure 7.6 shows the AP1000 downlink throughput versus offered load. Table 7.5
500pkt/sec 600pkt/sec 700pkt/sec 800pkt/sec
Average (Kbps) 5989 6622 6621 6622
Maximum(Kbps) 6880 6960 7040 6960
Minimum(Kbps) 880 6080 6000 5920
Sdt. Dev. (Kbps) 201 143 144 145
Table 7.5: Orinoco AP1000 downlink saturation throughput versus offered load (confidence level 95%,accuracy 5%).

CHAPTER 7. IEEE 802.11 AP’S SATURATION THROUGHPUT 89
0
2
4
6
8
10
0 1 2 3 4 5 6 7 8 9 10 11 12 13 14 15 16 17 18 19
Thr
ough
put (
Mbp
s)
0 10 20 30 40 50 60 70 80
0 1 2 3 4 5 6 7 8 9 10 11 12 13 14 15 16 17 18 19
N. R
tx
Time (min)
(a) 90 degrees orientation
0
2
4
6
8
10
0 1 2 3 4 5 6 7 8 9 10 11 12 13 14 15 16 17 18 19
Thr
ough
put (
Mbp
s)
0 500
1000 1500 2000 2500 3000 3500 4000 4500 5000
0 1 2 3 4 5 6 7 8 9 10 11 12 13 14 15 16 17 18 19
N. R
txTime (min)
(b) 270 degrees orientation
Figure 7.5: Orinoco AP1000 downlink instant saturation throughput versus AP/Client orientation andcumulative number of packet retransmissions.
5500 5600 5700 5800 5900 6000 6100 6200 6300 6400 6500 6600 6700 6800 6900 7000
400 500 600 700 800 900
Thr
ough
put (
Kbp
s)
Offered Load (pkt/sec)
Figure 7.6: Orinoco AP1000 downlink saturation throughput versus offered load. The diagram shows theaverage throughput value and its confidence interval (confidence level 95%, 5% accuracy).

CHAPTER 7. IEEE 802.11 AP’S SATURATION THROUGHPUT 90
0
2
4
6
8
10
0 5 10 15 20 25 30
Thr
ough
put (
Mbp
s)
0
50
100
150
200
250
0 5 10 15 20 25 30
N. R
tx
Time (min)
Figure 7.7: Orinoco AP1000 downlink instant saturation throughput under optimal conditions (90 degreesAP orientation, 800 pkt/sec offered load) and cumulative number of packet retransmissions.
Average (Kbps) 6609
Maximum (Kbps) 6960
Minimum (Kbps) 5520
Sdt. Dev. (Kbps) 145
Table 7.6: Orinoco AP1000 downlink maximum saturation throughput significant statistical indexes (av-erage confidence level 95%, 3% accuracy).
compares the statistical indexes of the different test-session results. The saturationthroughput of the Orinoco AP1000 is independent from the offered load.
Figure 7.7 shows the instant throughput of the Orinoco AP1000 in optimal con-ditions (90 degree AP orientation, 800 pkt/sec offered load) and Table 7.6 reports therelative statistical indexes. This test was run in order to collect 12805 consecutive sam-ples of 150ms each. Therefore, the average value has a confidence level of 95% and3% accuracy.
The Orinoco AP1000 saturates the full IEEE 802.11b link capacity when bridgingthe traffic form the Ethernet to the wireless link (downlink). Therefore, it was not nec-essary to run the uplink test to verify our conclusion that any AP’s maximum saturationthroughput is equal to the 802.11 link capacity.
7.1.3 Proxim/Orinoco AP2000The Proxim/Orinoco AP2000 is the evolution of the previous model and it still avail-able on the market. This AP uses the same radio interface (the Orinoco/Lucent wirelessclient) and the same device chassis as the previous model. Instead, the AP2000’s inter-nal implementation and its firmware are completely different from the AP1000 ones.According to the vendor brochures, the newer AP model has a much faster CPU and

CHAPTER 7. IEEE 802.11 AP’S SATURATION THROUGHPUT 91
3000
3200
3400
3600
3800
4000
4200
4400
4600
0 90 180 270
Thr
ough
put (
Kbp
s)
Orientation
Figure 7.8: Orinoco AP2000 downlink saturation throughput versus AP/Client orientation. The diagramshows the average throughput value and its confidence interval (confidence level 95%, 5% accuracy).
0 Degrees 90 Degrees 180 Degrees 270 DegreesAverage 3724 3781 3610 3610
Maximum 7280 7280 7280 7280
Minimum 0 0 0 0
Sdt. Dev. 1633 1650 1621 1621
Table 7.7: Orinoco AP2000 downlink saturation throughput versus AP/Client orientation (average confi-dence level 95%, accuracy 5%).
much more internal memory compared to the AP1000. Moreover, more features wereadded to the AP2000 including the support for IEEE 802.11a and IEEE 802.11g (usingdifferent radio modules). Nevertheless, we only tested the Proxim/Orinoco AP2000with an 802.11b interface.
Figure 7.8 shows the downlink saturation throughput with different AP/Client ori-entations. The 0 degrees position corresponds to the AP front side facing the client.Table 7.7 compares the statistical indexes of the different test sessions. As it wasobserved with the AP1000, the AP2000’s orientation has a significant impact on thethroughput performance.
The measured AP2000 downlink throughput is quite low and the behaviour of theinstant throughput is different with respect to the AP1000. Figure 7.9 shows the instantsaturation throughput produced by the Orinoco AP2000 with the best and worse APorientations. Note the large difference of the current case compared to the AP1000case (see Figure 7.5).
Figure 7.10 shows the AP2000’s downlink saturation throughput versus the of-fered load. Table 7.8 compares the statistical indexes of the different test sessions.The Orinoco AP2000 performance degrades when overloaded. Moreover, despite theeffort of optimizing the test environment, the AP still shows unstable throughput per-formance. Figure 7.11 shows the instant throughput of the test-sessions with an offeredload of 550 (Figure 7.11a), 600 (Figure 7.11b) and 650 (Figure 7.11c) pkt/sec. Note

CHAPTER 7. IEEE 802.11 AP’S SATURATION THROUGHPUT 92
0
2
4
6
8
10
0 1 2 3 4 5 6 7 8 9 10 11 12 13 14 15 16 17 18 19
Thr
ough
put (
Mbp
s)
Time (min)
(a) 90 degree orientation
0
2
4
6
8
10
0 1 2 3 4 5 6 7 8 9 10 11 12 13 14 15 16 17 18 19
Thr
ough
put (
Mbp
s)
Time (min)
(b) 270 degree orientation
Figure 7.9: Orinoco AP2000 downlink instant saturation throughput versus AP/Client orientation.
3600 3800 4000 4200 4400 4600 4800 5000 5200 5400 5600 5800 6000 6200 6400
400 500 600 700 800 900
Thr
ough
put (
Kbp
s)
Offered Load (pkt/sec)
Figure 7.10: Orinoco AP2000 downlink saturation throughput versus offered load. The diagram showsthe average throughput value and its confidence interval (confidence level 95%, 5% accuracy).
500pkt/sec 550pkt/sec 600pkt/sec 650pkt/sec 700pkt/sec 800pkt/sec
Average (Kbps) 5616 5901 6104 5317 3988 3781
Maximum(Kbps) 6800 7120 7360 7040 7360 7280
Minimum(Kbps) 800 0 0 0 0 0
Sdt. Dev. (Kbps) 807 1147 1179 1138 1571 1650
Table 7.8: Orinoco AP2000 downlink saturation throughput versus offered load (average confidence level95%, accuracy 5%).

CHAPTER 7. IEEE 802.11 AP’S SATURATION THROUGHPUT 93
0
2
4
6
8
10
0 1 2 3 4 5 6 7 8 9 10 11 12 13 14 15 16 17 18 19
Thr
ough
put (
Mbp
s)
0
5
10
15
20
25
0 1 2 3 4 5 6 7 8 9 10 11 12 13 14 15 16 17 18 19
N. R
tx
Time (min)
(a) 550 pkt/sec offered load instantthroughput
0
2
4
6
8
10
0 1 2 3 4 5 6 7 8 9 10 11 12 13 14 15 16 17 18 19
Thr
ough
put (
Mbp
s)
0 2 4 6 8
10 12
0 1 2 3 4 5 6 7 8 9 10 11 12 13 14 15 16 17 18 19
N. R
tx
Time (min)
(b) 600 pkt/sec offered load instantthroughput
0
2
4
6
8
10
0 1 2 3 4 5 6 7 8 9 10 11 12 13 14 15 16 17 18 19
Thr
ough
put (
Mbp
s)
0 2 4 6 8
10 12 14 16
0 1 2 3 4 5 6 7 8 9 10 11 12 13 14 15 16 17 18 19
N. R
tx
Time (min)
(c) 650 pkt/sec offered load instantthroughput
Figure 7.11: Orinoco AP2000 downlink instant saturation throughput in an optimal environment and withoptimal orientation and different offered loads. The diagrams show the throughput samples and cumulativenumber of packet retransmissions.
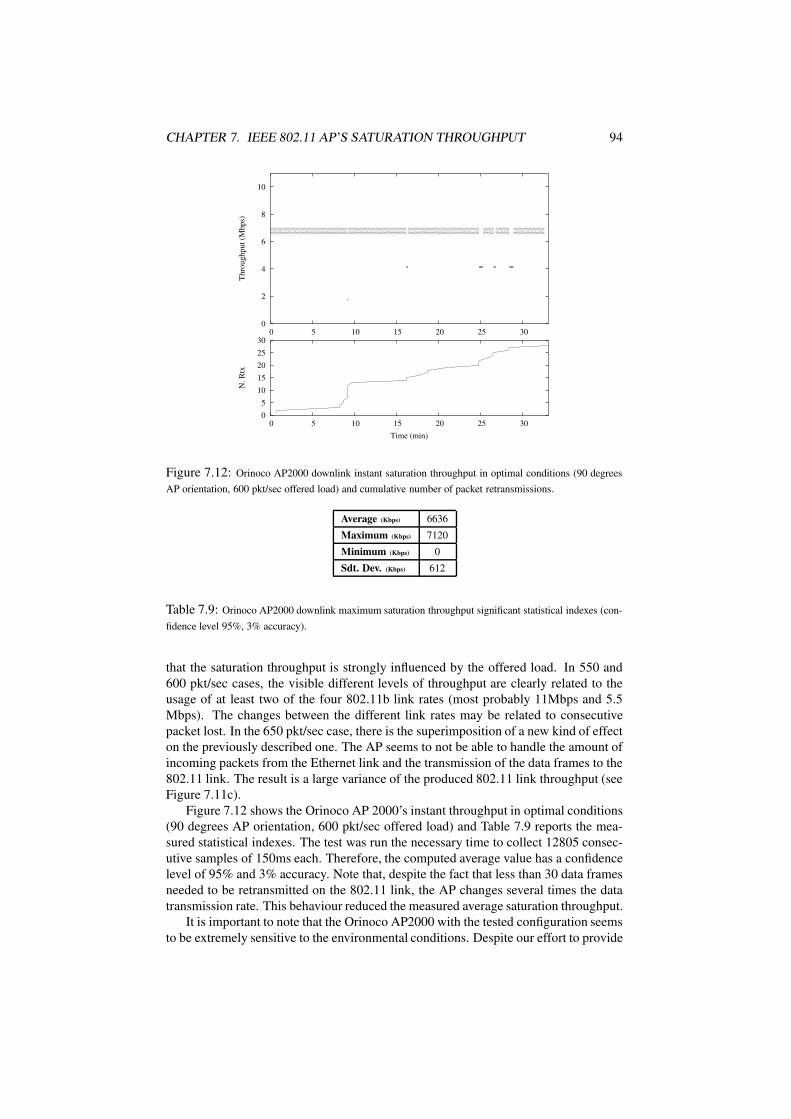
CHAPTER 7. IEEE 802.11 AP’S SATURATION THROUGHPUT 94
0
2
4
6
8
10
0 5 10 15 20 25 30
Thr
ough
put (
Mbp
s)
0
5
10
15
20
25
30
0 5 10 15 20 25 30
N. R
tx
Time (min)
Figure 7.12: Orinoco AP2000 downlink instant saturation throughput in optimal conditions (90 degreesAP orientation, 600 pkt/sec offered load) and cumulative number of packet retransmissions.
Average (Kbps) 6636
Maximum (Kbps) 7120
Minimum (Kbps) 0
Sdt. Dev. (Kbps) 612
Table 7.9: Orinoco AP2000 downlink maximum saturation throughput significant statistical indexes (con-fidence level 95%, 3% accuracy).
that the saturation throughput is strongly influenced by the offered load. In 550 and600 pkt/sec cases, the visible different levels of throughput are clearly related to theusage of at least two of the four 802.11b link rates (most probably 11Mbps and 5.5Mbps). The changes between the different link rates may be related to consecutivepacket lost. In the 650 pkt/sec case, there is the superimposition of a new kind of effecton the previously described one. The AP seems to not be able to handle the amount ofincoming packets from the Ethernet link and the transmission of the data frames to the802.11 link. The result is a large variance of the produced 802.11 link throughput (seeFigure 7.11c).
Figure 7.12 shows the Orinoco AP 2000’s instant throughput in optimal conditions(90 degrees AP orientation, 600 pkt/sec offered load) and Table 7.9 reports the mea-sured statistical indexes. The test was run the necessary time to collect 12805 consec-utive samples of 150ms each. Therefore, the computed average value has a confidencelevel of 95% and 3% accuracy. Note that, despite the fact that less than 30 data framesneeded to be retransmitted on the 802.11 link, the AP changes several times the datatransmission rate. This behaviour reduced the measured average saturation throughput.
It is important to note that the Orinoco AP2000 with the tested configuration seemsto be extremely sensitive to the environmental conditions. Despite our effort to provide

CHAPTER 7. IEEE 802.11 AP’S SATURATION THROUGHPUT 95
an optimal environment and to optimize the AP test conditions (i.e. optimal orientationand offered load), it was not possible to make the device work with completely stableperformance over long time intervals. This behaviour could impact our measurementaccuracy, but it seems to be a specific characteristic of this model.
The Orinoco AP2000 saturates the full IEEE 802.11b link capacity when bridgingthe traffic form Ethernet to wireless link. It was not necessary to run the uplink testto verify our assumption that any AP maximum saturation throughput is equal to the802.11 link capacity.
7.1.4 Notes on former Lucent 802.11b APsThe analysis of the maximum saturation throughput of Avaya RG-II, Orinoco AP1000,and Orinoco AP2000 showed some common and non-common characteristics.
All the different APs use the same kind of 802.11 radio interface: the former Lucentwireless PCMCIA client. As a consequence, all the APs show a relation betweenperformance and the device orientation. Orinoco AP1000 and AP2000 have exactly thesame behaviour, since they use an identical chassis. The Avaya RG-II has a differentbehaviour, probably because the wireless card is mounted in a different position.
The different APs maximum downlink saturation throughput seems to be boundedby the maximum radio performance. All former Lucent products use the same radiointerface, but different AP implementations may limit the performance in specific con-ditions. The Orinoco AP1000 and AP2000 produce the same downlink maximum sat-uration throughput, but they have opposite behaviours in response to increasing offeredloads. Despite the fact that the AP2000 has the best hardware (CPU and Memory), theformer AP1000 is clearly the most efficient AP of the tested ones. The Avaya RG-IIhas a similar behaviour to the previous APs, in particular to the AP2000, but with muchlower maximum downlink saturation throughput. However, this last AP model has thesimplest hardware implementation.
All the three different APs run different software. Specific firmware might imple-ment different policies or offer different possible configurations. As a consequence,they produce different results under the same test conditions. In particular, the APsresponses to radio link errors were very different. Note that the AP2000 seems to bemuch more sensitive to radio transmission errors than the other AP models. The per-formance degradation that was observed when increasing the offered load might berelated to a non-efficient firmware implementation too.
7.2 Cisco Aironet 1200The Cisco AIR 1200 was extensively studied in the previous chapter. In this section weapply to our complete test procedure using the same “extreme” AP’s configuration weused in the first preliminary test (see section 4), but not in chapter 6. To perform thetest showed in chapter 6 we used a safe configuration that enforces backward compati-bility to legacy 802.11 devices. In this section we show how the performance changeswithout this last constraint. Note that in both cases we activated the offered “Aironetextensions” option.
Figure 7.13 shows the downlink saturation throughput with different AP orienta-tions with respect to the client. The 0 degrees position corresponds to the AP facingclient. Table 7.10 compares the statistical indexes of the different test session results.Figure 7.14 shows the instant saturation throughput and 802.11 link data frame retrans-

CHAPTER 7. IEEE 802.11 AP’S SATURATION THROUGHPUT 96
6600
6800
7000
7200
7400
7600
7800
8000
0 90 180 270
Thr
ough
put (
Kbp
s)
Orientation
Figure 7.13: Cisco AIR 1200 downlink saturation throughput versus AP/Client orientation. The diagramshows the average throughput value and its confidence interval (confidence level 95%, 5% accuracy).
0 Degrees 90 Degrees 180 Degrees 270 DegreesAverage 7225 7126 6080 7213
Maximum 7840 7760 7600 7760
Minimum 6640 6400 4720 6160
Sdt. Dev. 243 214 515 270
Table 7.10: Cisco AIR 1200 downlink saturation throughput versus AP/Client orientation (average confi-dence level 95%, accuracy 5%).
0
2
4
6
8
10
0 1 2 3 4 5 6 7 8 9 10 11 12 13 14 15 16 17 18 19
Thr
ough
put (
Mbp
s)
0 200 400 600 800
1000 1200 1400
0 1 2 3 4 5 6 7 8 9 10 11 12 13 14 15 16 17 18 19
N. R
tx
Time (min)
(a) 0 degrees orientation
0
2
4
6
8
10
0 1 2 3 4 5 6 7 8 9 10 11 12 13 14 15 16 17 18 19
Thr
ough
put (
Mbp
s)
0 5000
10000 15000 20000 25000 30000 35000 40000
0 1 2 3 4 5 6 7 8 9 10 11 12 13 14 15 16 17 18 19
N. R
tx
Time (min)
(b) 180 degrees orientation
Figure 7.14: Cisco AIR 1200 downlink instant saturation throughput versus AP/Client orientation. Thediagrams show the throughput samples (top) and cumulative number of packet retransmissions (bottom).

CHAPTER 7. IEEE 802.11 AP’S SATURATION THROUGHPUT 97
5000 5200 5400 5600 5800 6000 6200 6400 6600 6800 7000 7200 7400 7600
500 600 700 800
Thr
ough
put (
Kbp
s)
Offered Load (pkt/sec)
Figure 7.15: Cisco AIR 1200 downlink saturation throughput versus offered load. The diagram showsthe average throughput value and its confidence interval (confidence level 95%, 5% accuracy).
500pkt/sec 600pkt/sec 700pkt/sec 800pkt/sec
Average (Kbps) 5999 7198 7235 7225
Maximum(Kbps) 6240 7760 7760 7840
Minimum(Kbps) 5760 3520 6720 6640
Sdt. Dev. (Kbps) 74 253 254 243
Table 7.11: Cisco AIR 1200 downlink saturation throughput versus offered load (confidence level 95%,accuracy 5%).
mission produced by the Cisco Aironet 1200 with the best and worse AP orientations.Note the extremely high number of packet retransmissions during the 270 degrees test.
The previous test showed that there is an influence of the AP’s orientation on theaverage saturation throughput. No relation between orientation and throughout wasobserved during the previous sets of tests. The reason for such a different result couldbe some unpredictable different test conditions, or the effects of the missing backward802.11 compatibility. More details are given at the end of this subsection.
Figure 7.15 shows the Cisco AIR 1200 downlink throughput versus offered load.Table 7.11 compares the statistical indexes of the different test sessions. The CiscoAironet 1200 does not degrade the saturation throughput performance when over-loaded.
Figure 7.16 shows the instant throughput of the Cisco AIR 1200 in optimal condi-tions (0 degrees AP orientation, 800 pkt/sec offered load) and Table 7.12 reports thecomputed statistical indexes. This test was run in order to collect 12805 consecutivesamples of 150ms each. Therefore, the average value has a confidence level of 95%and 3% accuracy.
In order to understand the different maximum saturation throughput values we mea-sured with the Cisco Aironet 1200 running alternative configurations, we ran someshort downlink tests capturing the 802.11 radio frame headers. Using “Aironet Exten-sion” and no legacy 802.11 compatibility mode the AP transmits all the data, acknowl-

CHAPTER 7. IEEE 802.11 AP’S SATURATION THROUGHPUT 98
0
2
4
6
8
10
0 5 10 15 20 25 30
Thr
ough
put (
Mbp
s)
0
200
400
600
800
1000
1200
0 5 10 15 20 25 30
N. R
tx
Time (min)
Figure 7.16: Cisco AIR 1200 downlink instant saturation throughput in optimal conditions (0 degrees APorientation, 800 pkt/sec offered load) and cumulate number of packet retransmissions.
Average (Kbps) 7233
Maximum (Kbps) 8480
Minimum (Kbps) 5520
Sdt. Dev. (Kbps) 251
Table 7.12: Cisco AIR 1200 downlink maximum saturation throughput significant statistical indexes(confidence level 95%, 3% accuracy).

CHAPTER 7. IEEE 802.11 AP’S SATURATION THROUGHPUT 99
3000
3200
3400
3600
3800
4000
4200
4400
4600
0 90 180 270
Thr
ough
put (
Kbp
s)
Test Session
Figure 7.17: Ericsson A11d downlink saturation throughput versus AP/Client orientation. The diagramshows the average throughput value and its confidence interval (confidence level 95%, 5% accuracy).
edgment and control frames at 11 Mbps, but the beacons are always sent at 1Mbps. Thisconfiguration produces the highest and the most unstable downlink saturation through-put. In fact the acknowledgments frames are sent at 11Mbps, increasing the probabilityof 802.11 link data frame transmission errors. By forcing the legacy 802.11 client sup-port, the AP starts to transmit all acknowledgment and control/management frames at2 Mbps, but the beacons are still transmitted at 1 Mbps. It is interesting to note thatin this case the maximum downlink saturation throughput decreases around 3% com-pared to the previous one. No difference was noticed in the 802.11 link between theprevious cases and the configuration without the Aironet Extension, but a much lowerthroughput around 6.3 Mbps was observed (see Figure 4.7). This result supports ourhypothesis that the “Aironet Extension” reduces the contention window with respect tothe IEEE 802.11 standard dimension. Unfortunately, we could not completely verify itvia measurements.
7.3 Ericsson A11d (Symbol AP-4121)Ericsson distributed with its own brand a set of OEM 802.11 wireless LAN products.We had the opportunity to test the Ericsson A11d, equivalent to a Symbol AP-4121,but with an Ericsson customized firmware. This kind of AP was designed for of-fice/business applications and is discontinued now.
Figure 7.17 shows the downlink saturation throughput with different AP orienta-tions with respect to the client. The 0 degrees position corresponds to the AP facingthe client. Table 7.13 compares the statistical indexes of the different test sessions.Note that it was not possible to observe any influence of the AP’s orientation on thesaturation downlink throughput. We select the orientation 0 degrees as the optimal onefor continuing the test.
Figure 7.18 shows the Ericsson A11d downlink saturation throughput versus theoffered load. Table 7.14 compares the different statistical indexes of the test sessions.Note the very large influence of the offered load on the saturation downlink throughput.

CHAPTER 7. IEEE 802.11 AP’S SATURATION THROUGHPUT 100
0 Degrees 90 Degrees 180 Degrees 270 DegreesAverage 4140 4129 4141 4140
Maximum 5280 4497 4720 4480
Minimum 322 3840 3120 3920
Sdt. Dev. 79 40 63 63
Table 7.13: Ericsson A11d downlink saturation throughput versus AP/Client orientation (confidence level95%, accuracy 5%).
3800
4000 4200
4400
4600 4800
5000
5200 5400
5600
5800 6000 6200
400 500 600 700 800
Thr
ough
put (
Kbp
s)
Offered Load (pkt/sec)
Figure 7.18: Ericsson A11d downlink saturation throughput versus offered load. The diagram shows theaverage throughput value and its confidence interval (confidence level 95%, 5% accuracy).
450pkt/sec 500pkt/sec 550pkt/sec 600pkt/sec 700pkt/sec 800pkt/sec
Average (Kbps) 5399 5838 5419 5031 4403 4141
Maximum(Kbps) 5600 6160 5764 1248 4804 4720
Minimum(Kbps) 5040 5440 4720 4320 4080 3120
Sdt. Dev. (Kbps) 50 110 105 123 99 63
Table 7.14: Ericsson A11d downlink saturation throughput versus offered load (confidence level 95%,accuracy 5%).

CHAPTER 7. IEEE 802.11 AP’S SATURATION THROUGHPUT 101
0
2
4
6
8
10
0 5 10 15 20 25 30
Thr
ough
put (
Mbp
s)
0 500
1000 1500 2000 2500 3000 3500 4000 4500
0 5 10 15 20 25 30
N. R
tx
Time (min)
Figure 7.19: Ericsson A11d downlink instant saturation throughput in optimal conditions (0 degrees APorientation, 500 pkt/sec offered load) and cumulate number of packet retransmissions.
Average (Kbps) 5801
Maximum (Kbps) 6720
Minimum (Kbps) 4480
Sdt. Dev. (Kbps) 132
Table 7.15: Ericsson A11d downlink maximum saturation throughput significant statistical indexes (con-fidence level 95%, 3% accuracy).
The maximum saturation throughput is reached with an offered load of 500 pkt/sec andis little lower than 6 Mbps.
Figure 7.19 shows the instant throughput of the Ericsson A11d in optimal condi-tions (0 degree AP orientation, 500 pkt/sec offered load) and Table 7.15 reports thestatistical indexes of the measurement. The last test was run in order to collect 12805consecutive samples of 150ms each. Therefore, the computed average value has a con-fidence level of 95% and 3% accuracy. Note that the maximum downlink saturationthroughout is lower than the maximum capacity of the 802.11b link.
Figure 7.20 shows the instant uplink saturation throughput of the Ericsson A11din optimal conditions (0 degrees AP orientation, 800 pkt/sec offered load) and Table7.16 reports the measured statistical indexes. Note that the Ericsson A11d’s maximumsaturation uplink throughput with a single sender is much lower than the 802.11 linkcapacity.
In the previous chapter we concluded that the maximum saturation throughput ofany 802.11 AP model is equal to the 802.11 link capacity. Some APs reach the max-imum saturation throughput when bridging data downlink or uplink, other APs onlywhen bridging data uplink. Despite the Ericsson A11d performance, we still considerour general conclusion valid. In fact, the analysis of the Ericsson A11d uplink satura-

CHAPTER 7. IEEE 802.11 AP’S SATURATION THROUGHPUT 102
0
2
4
6
8
10
0 5 10 15 20 25 30
Thr
ough
put (
Mbp
s)
Time (min)
Figure 7.20: Ericsson A11d uplink instant saturation throughput in optimal conditions (0 degrees APorientation, 800 pkt/sec offered load).
Average (Kbps) 4055
Maximum (Kbps) 6800
Minimum (Kbps) 0
Sdt. Dev. (Kbps) 3011
Table 7.16: Ericsson A11d uplink maximum saturation throughput significant statistical indexes (confi-dence level 95%, 3% accuracy).

CHAPTER 7. IEEE 802.11 AP’S SATURATION THROUGHPUT 103
0
2
4
6
8
10
15 15.1 15.2 15.3 15.4 15.5 15.6 15.7 15.8 15.9 16
Thr
ough
put (
Mbp
s)
Time (min)
(a) uplink throughput in the Ethernet link
0
2
4
6
8
10
15 15.1 15.2 15.3 15.4 15.5 15.6 15.7 15.8 15.9 16
Thr
ough
put (
Mbp
s)
Time (min)
Throughput SampleRetransmitted Packet
(b) 802.11b throughput and packet retransmis-sion events
Figure 7.21: Ericsson A11d uplink instant saturation throughput in optimal conditions. The diagramsshow a single minute of the uplink test. The complete test is shown in Figure 7.20.
tion throughput explains the reason of its low uplink performance.Figure 7.21 shows the instant uplink saturation throughput of the Ericsson A11d
over a single minute of the previous test. Figure 7.21a shows the throughput mea-sured on the Ethernet link. Figure 7.21b shows the simultaneous traffic in the 802.11bcell. Despite the large number of necessary 802.11 packet retransmissions (see Figure7.21b), the 802.11 link throughput is almost equal to the link capacity (the test was runwith a single sender). The 802.11 link behaviour is close to the ones we observed withother AP uplink tests (see 6.1.2). Note that the Ericsson A11d is not able to bridge allthe 802.11 incoming packets to the Ethernet link. Figure 7.21a shows that the Ethernetthroughput level is not stable as the 802.11 one. The AP produces high throughput fora short time then it stops. The result is an almost regular Ethernet traffic pattern wherethe Ethernet link remains idle for almost 30% of the time!
During the test, we noticed that the link status LED of the AP’s Ethernet interfacewas always blinking. At a regular times the Ethernet link went up and then down again.Most probably, the Ericsson A11d’s Ethernet driver continuously reset the networkinterface producing the transmission stops.
Our conclusion is that the limited uplink capacity of the Ericsson A11d is due toa failure of the AP’s Ethernet interface and/or a general misbehaviour of the system.Note that the instant uplink saturation throughput when the AP transmits is approx-imately 6.1 Mbps according to the expected throughput level. This AP has a clearimplementation error and therefore its performance cannot be compared to the others.
7.4 ConclusionsIn the previous sections we presented the results of our recommended test procedureon several different AP models. Despite the large set of different performance andcharacteristics of the analysed APs, our procedure always produced positive results.Therefore, we can conclude that our recommended test procedure was successfullyvalidated.
The analysis of the test results on the AP models we studied allowed explaining

CHAPTER 7. IEEE 802.11 AP’S SATURATION THROUGHPUT 104
Avay
aR
G-I
I
Ori
noco
AP1
000
Ori
noco
AP2
000
Cis
coA
IR-1
200
Eri
csso
nA
11d
Max. Down. Stat. Thr. 5158 kbps 6609 kbps 6636 kbps 7233 kbps 5801 kbps
Opt. Orientation 180 degrees 90 degrees 90 degrees 0 degrees Any
Opt. Offered Load 450 pkt/sec 800 pkt/sec 600 pkt/sec 800 pkt/sec 500 pkt/sec
Notes - - unstable performance Non 802.11 Cont. Window Broken Ethernet Int.
Table 7.17: Summary table of the downlink saturation throughput performance of the AP models testedin chapter 7.
several abnormal behaviours of the different devices. Moreover, the comparison of theAPs results allows us formulating some general conclusions. In particular, we couldverify the hypothesis we formulated in section 6.1.5:
� The downlink maximum saturation throughput represent the key throughput per-formance index of 802.11 APs, and
� The maximum saturation throughput of any 802.11 AP is equal to the maximum802.11 link capacity. Some APs produce the maximum saturation throughputbridging traffic uplink and downlink, whilst other APs only the uplink.
According to the first point, we can compare the performance of different APs by themaximum downlink saturation throughput and the necessary condition for producingit. Table 7.17 summarizes the different performance of the AP models we tested.

Chapter 8
Conclusions
The performance of the access points is a key factor for the design and analysis of anywireless LAN. We have focused our work on IEEE 802.11 devices. Nowadays, thistechnology is largely the dominant one for general-purpose broadband wireless accessnetworks.
Throughput is the main service that a generic wireless LAN user requires fromAPs. Different environmental and/or traffic conditions produce different AP throughputperformance. Therefore, throughput can generally have a very large variance. Wedecided to limit the scope of our investigation to the AP’s throughput produced inwell-defined and repeatable conditions. This kind of approach simplifies the generaltest procedure and allows reproducing the tests results. Moreover, the performance ofdifferent APs in the same conditions can be compared in order to identify commonor specific characteristics and to evaluate the performance. We also decided to focusour work only on the IEEE 802.11b technology. All different standards that are partof the 802.11 family (legacy 802.11, 802.11b, 802.11a and 802.11g) share the samelink layer, i.e. they share the same network protocol mechanisms. Any standard differsfrom the others only in the physical/radio layer. For this reason, our final methodologycan be successfully applied to any kind of 802.11 AP.
We identified the maximum saturation throughout as the key figure of merit ofthe 802.11 APs. The saturation throughput is the throughput produced by an AP insaturation conditions, i.e. when the AP has always a packet ready to transmit. In orderto maximize the saturation throughput it is necessary to optimize:
� The environmental and test conditions (no radio interferences, small close testenvironment, no obstacles between the radio stations, maximum packet size forthe test stream)
� The AP’s orientation with respect to the client� The offered load
The first optimization is achieved with a correct setup of the testbed. Note that theoptimal environmental and test conditions are the same for any 802.11b AP. In orderto achieve the other two optimal conditions, it is necessary to run some preliminarytests on the studied AP. In fact, the optimal orientation and offered load are peculiarcharacteristics of any specific AP model. Note that no technical brochure or user guidereported these behaviours for the tested APs. In particular, all the tested APs claim tohave omni-directional antennas.
105

CHAPTER 8. CONCLUSIONS 106
Our main contribution in this work is our recommended test procedure. The pro-cedure goal is to measure the maximum saturation throughput of any 802.11b APswith a defined confidence level and accuracy. The test procedure includes a detaileddescription of the testbed and the set of tests to perform per AP. It also includes differ-ent recommendations on how to sample the APs instant saturation throughput and theduration of each test session.
The analysis performed on a limited set of APs to formulate the test procedureproduced two conclusions:
� Any 802.11b AP reaches a maximum saturation throughput equal to the maxi-mum capacity of the IEEE 802.11b link. Some AP can reach the highest through-put level when bridging the traffic both downlink and uplink. Some other APsreach the highest performance only in uplink.
� The key figure of merit of the 802.11 APs is the downlink maximum saturationthroughput. On the contrary, the wireless clients mainly drive the uplink maxi-mum saturation throughput.
The validation of our test and a practical verification of our general conclusions weredone by measuring the maximum saturation throughput for a set of 802.11b APs. Wetested 5 different models from 4 different vendors. These tests showed a large varia-tion in results. Any part of the AP system has an important influence on the overallperformance. In particular:
� Radio modem and antenna implementation
� Firmware efficiency
� Specific configuration options
Characteristics such as the CPU speed, memory and other hardware performance seemnot to be critical compared to the previously presented ones. Vendors do not alwaysrelease the hardware implementation details of their APs. However, we found an ex-ample of two 802.11b APs with exactly the same radio interface, but different hardwarewhere the AP with more limited hardware had better performance.
The tests we ran validated our general conclusions regarding the maximum satu-ration throughput of any 802.11b APs. Moreover, it is important to note that our testsallow estimating the maximum saturation throughput of IEEE 802.11b as 6.6 Mbps.We also found two exceptions. First, the Cisco Aironet 1200 had a maximum down-link saturation throughput of 7.2 Mbps, but only when using a special configuration.It seems that this AP model can be configured to use non-compliant 802.11 parametervalues that improve its performance. Second, the Ericsson A11d features a misbehav-ing implementation of the Ethernet interface that limits the uplink maximum saturationthroughput. This AP model was the only one with a maximum saturation throughputlower than the 802.11b maximum capacity.

Chapter 9
Future Work
The work described in this document is complete for what it concerns to the IEEE802.11b devices. The test procedure has been described with details, and validated bytesting a set of different devices. Additionally, our conclusions were verified on thetested devices. More tests on different devices might show distinct behaviours of other802.11 AP models. In fact, our experience shows that many characteristics depend onthe specific AP implementation. However, we expect that all our general conclusionswill hold for all access points.
The main task not completed in this work is the validation of our test procedurefor other IEEE physical interfaces, namely IEEE 802.11a and IEEE 802.11g. Themain structure of the test procedure needs no change. However, some details aboutthe testbed environmental conditions, throughput sample size and number might needsome tuning for different technologies.
An extension to this work could be to investigate how different access point’s con-figuration could affect the saturation throughput. For example, to compare the perfor-mance of an 802.11 AP when using the basic access protocol and RTS/CTS, and/orwhen using different packet sizes for the offered load. Nevertheless, in these cases themeasured throughput will not be the maximum possible one.
107

Bibliography
[1] A. Escudero, B. Pehrson, E. Pelletta, J.O. Vatn, P. Wiatr: ”Wireless Access inthe Kista IT-University”, 11th IEEE Workshop on Local and Metropolitan AreaNetworks, March 2001, Boulder Co. USA.
[2] E. Pelletta, F Lilieblad, M. Hedenfalk, B. Pehrson: “The design and implemen-tation of an Operator Neutral Open Wireless Access Network at the Kista IT-University”, 12th IEEE Workshop on Local and Metropolitan Area Networks,August 2002, Stockhom Sweden.
[3] Raj Jain, “The Art of Computer Systems Performance Analysis. Techniques forexperimental design, measurement, simulation, and modelling”, John Wiley &Son Inc., 1991
[4] IEEE, “802 Part 11: Wireless LAN Medium Access Control (MAC) and PhysicalLayer (PHY) Specifications”, June 1997
[5] IEEE ,“802 Part 11: Wireless LAN Medium Access Control (MAC) and Phys-ical Layer (PHY) Specifications. Higher Speed Physical Layer Extension in the2.4GHz Band”. Supplement to the IEEE std 802.11, 1999. (IEEE 802.11b)
[6] IEEE ,“802 Part 11: Wireless LAN Medium Access Control (MAC) and PhysicalLayer (PHY) Specifications. Higher Speed Physical Layer Extension in the 5GHzBand”. Supplement to the IEEE std 802.11, 1999. (IEEE802.11a)
[7] IEEE, “802 Part 11: Wireless LAN Medium Access Control (MAC) and PhysicalLayer (PHY) Specifications. Amendment 4: Further Higher Data Rate Extensionin the 2.4 GHz Band” (IEEE802.11g), June 2003
[8] Proxim Inc., “ORINOCO/IEEE 802.11 reviewer’s giude”, Orinoco Techni-cal Bulletin 018/A, October 1998. http://www.proxim.com/support/techbulletins.Last visit March 2003.
[9] J. C. Chen, J. M. Gilbert, “Measured Performance of 5GHz 802.11aWireless LAN Systems”, Atheros Communication, Inc. 2001.http://www.atheros.com/AtherosRangeCapacityPaper.pdf, last visited March2003.
[10] J. Zyren, E. Enders, T. Edmondson, “IEEE802.11g Offers Higher Data Ratesand Longer Range”, Intersil. http://www.intersil.com/data/wp/WP0555.pdf, lastvisited March 2003.
[11] Atheros Communications Inc., “Methodology for Testing Wireless LAN Perfor-mance”, http://www.atheros.com, September 2003.
108

BIBLIOGRAPHY 109
[12] Atheros Communications Inc., “802.11 Wireless LAN Performance”,http://www.atheros.com, September 2003
[13] G. Bianchi, “Performance Analysis of the IEEE 802.11 Distributed CoordinatorFunction”, IEEE Journal on Selected Areas in Communications. Vol 18 no. 3,March 2000.
[14] Y.C. Tay, K.C. Chua, “A capacity Analysis for the IEEE 802.11 MAC Protocol”,Wireless Networks 7, 159-171, 2001
[15] A. Kamerman, G. Aben, “Throughput Performance of Wireless LANs Operatingat 2.4 and 5GHz”, 11th IEEE International Symposium on Personal Indoor andMobile Radio Communications (PIMRC 2000), London Set. 2000.
[16] G. Xylomenos, G.C. Polyzos, “TCP and UDP Performance over a WirelessLAN”, INFOCOM 1999.
[17] I. Al Khatib, “Performance Analysis of Wireless LAN Access Points”, Depart-ment of Microelectronics and Information Technology, Royal Institute of Tech-nology, Stockholm (Sweden), May 2003.


