20
May 2007 vegetation Kevin E Trenberth NCAR Weather and climate in the 21 st Century: What do we know? What don’t we know?
| Date post: | 22-Dec-2015 |
| Category: |
Documents |
| View: | 214 times |
| Download: | 0 times |
May 2007 vegetation
Kevin E TrenberthNCAR
Kevin E TrenberthNCAR
Weather and climate in the 21st Century:
What do we know? What don’t we know?
Weather and climate in the 21st Century:
What do we know? What don’t we know?
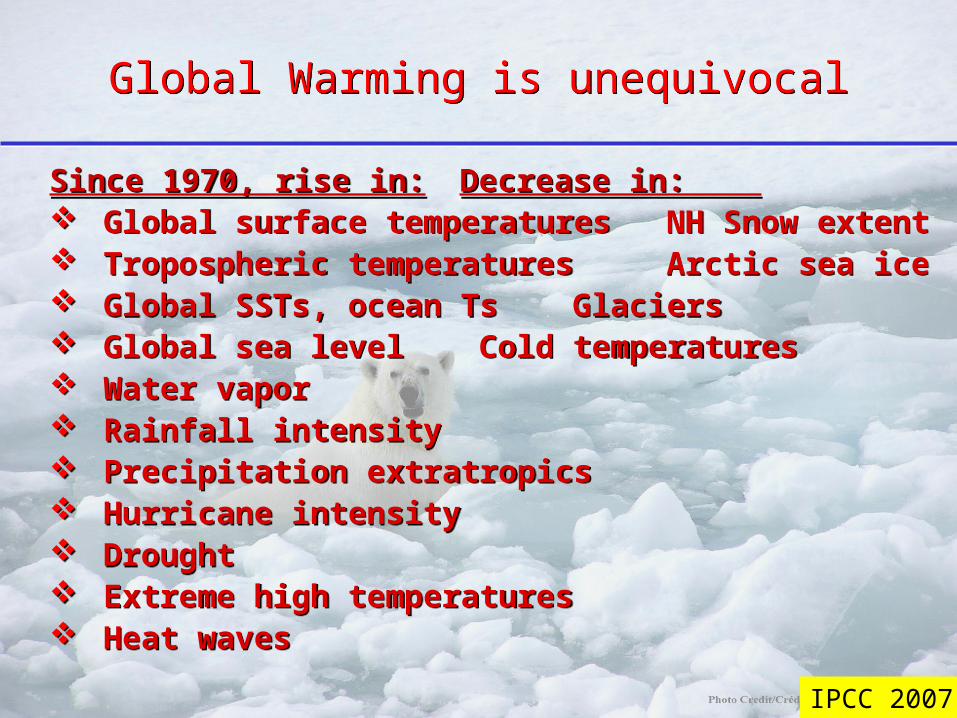
Global Warming is unequivocalGlobal Warming is unequivocal
Since 1970, rise in: Decrease in: Global surface temperatures NH Snow extent Tropospheric temperatures Arctic sea ice Global SSTs, ocean Ts Glaciers Global sea level Cold temperatures Water vapor Rainfall intensity Precipitation extratropics Hurricane intensity Drought Extreme high temperatures Heat waves
Since 1970, rise in: Decrease in: Global surface temperatures NH Snow extent Tropospheric temperatures Arctic sea ice Global SSTs, ocean Ts Glaciers Global sea level Cold temperatures Water vapor Rainfall intensity Precipitation extratropics Hurricane intensity Drought Extreme high temperatures Heat waves
IPCC 2007
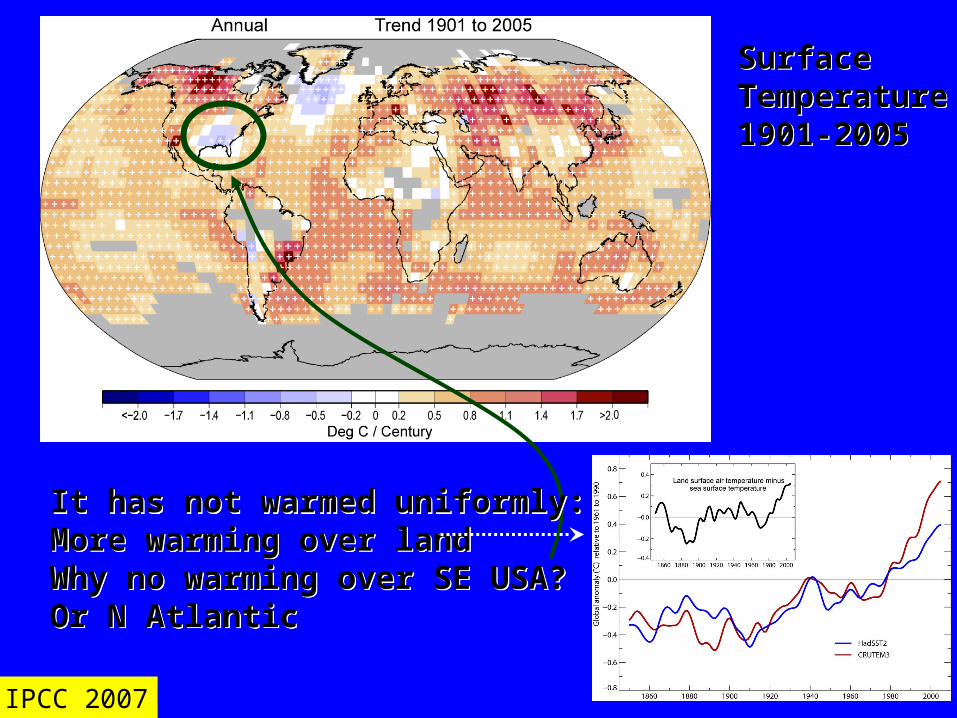
Surface Temperature1901-2005
Surface Temperature1901-2005
It has not warmed uniformly:More warming over landWhy no warming over SE USA?Or N Atlantic
It has not warmed uniformly:More warming over landWhy no warming over SE USA?Or N Atlantic
IPCC 2007
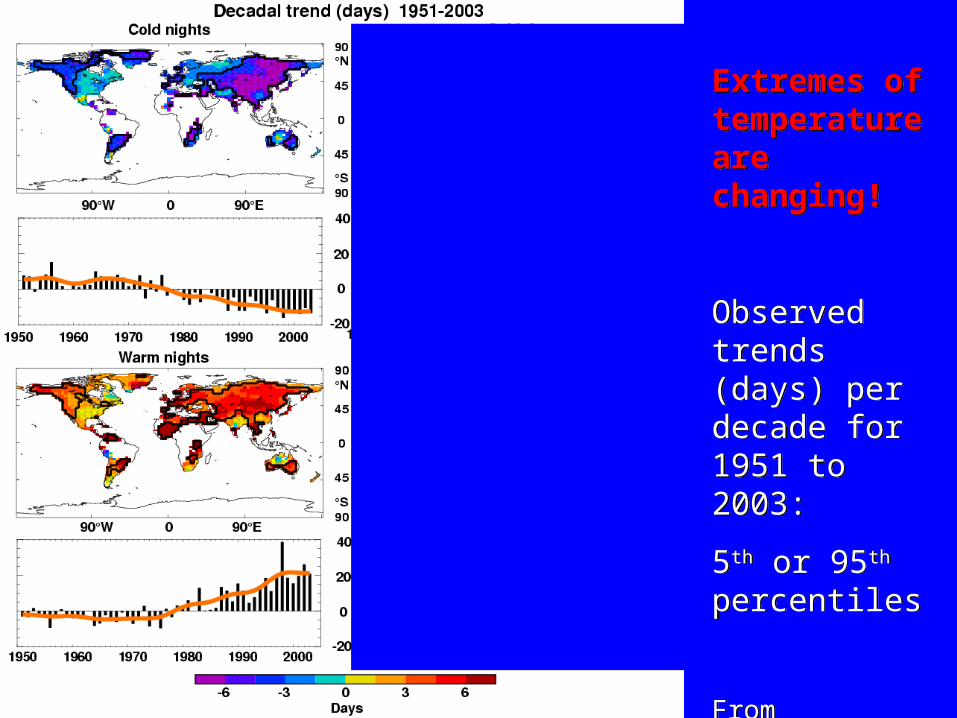
Extremes of temperature are changing!
Observed trends (days) per decade for 1951 to 2003:
5th or 95th percentiles
From Alexander et al. (2006) and IPCC
Extremes of temperature are changing!
Observed trends (days) per decade for 1951 to 2003:
5th or 95th percentiles
From Alexander et al. (2006) and IPCC
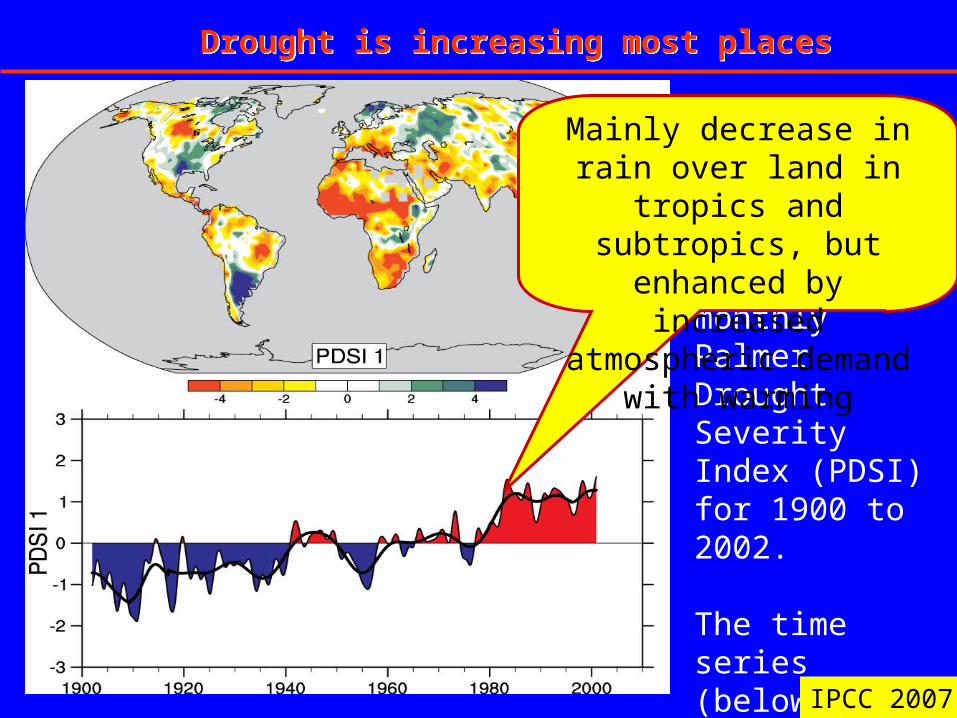
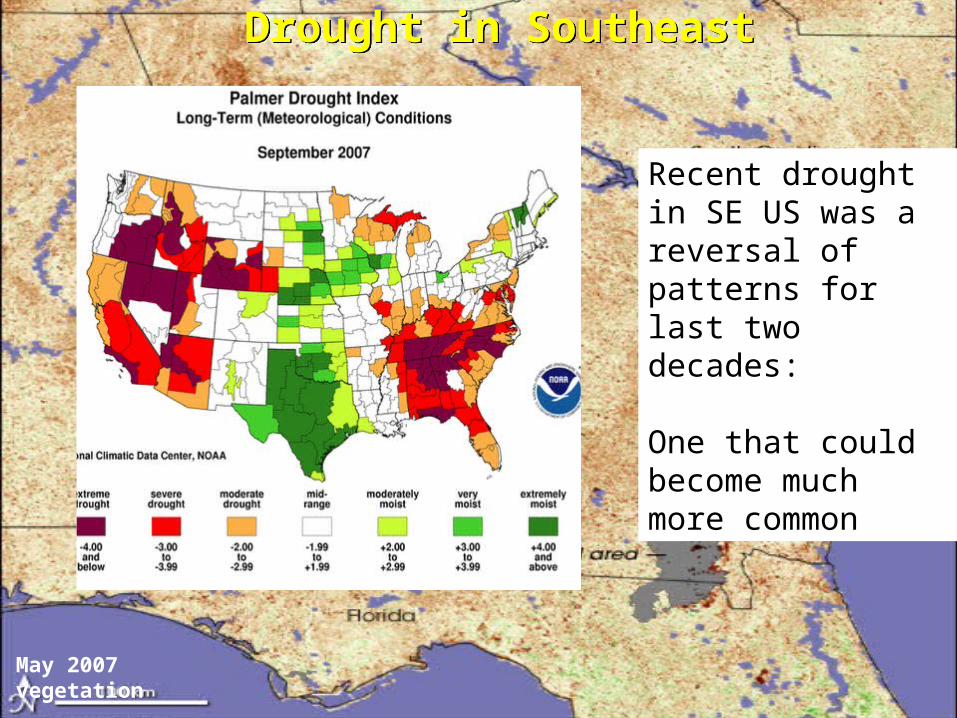
The most important spatial pattern (top) of the monthly Palmer Drought Severity Index (PDSI) for 1900 to 2002.
The time series (below) accounts for most of the trend in PDSI.
Drought is increasing most placesDrought is increasing most places
Mainly decrease in rain over land in tropics and
subtropics, but enhanced by increased atmospheric demand
with warming
IPCC 2007
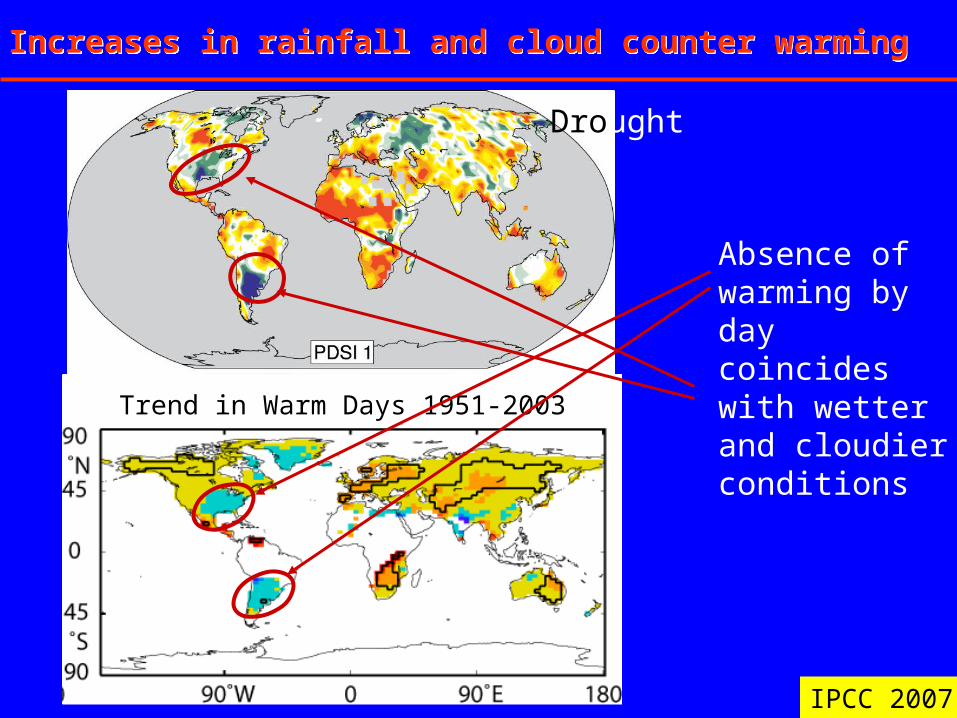
Absence of warming by day coincides with wetter and cloudier conditions
Drought
Increases in rainfall and cloud counter warmingIncreases in rainfall and cloud counter warming
Trend in Warm Days 1951-2003
IPCC 2007
May 2007 vegetation
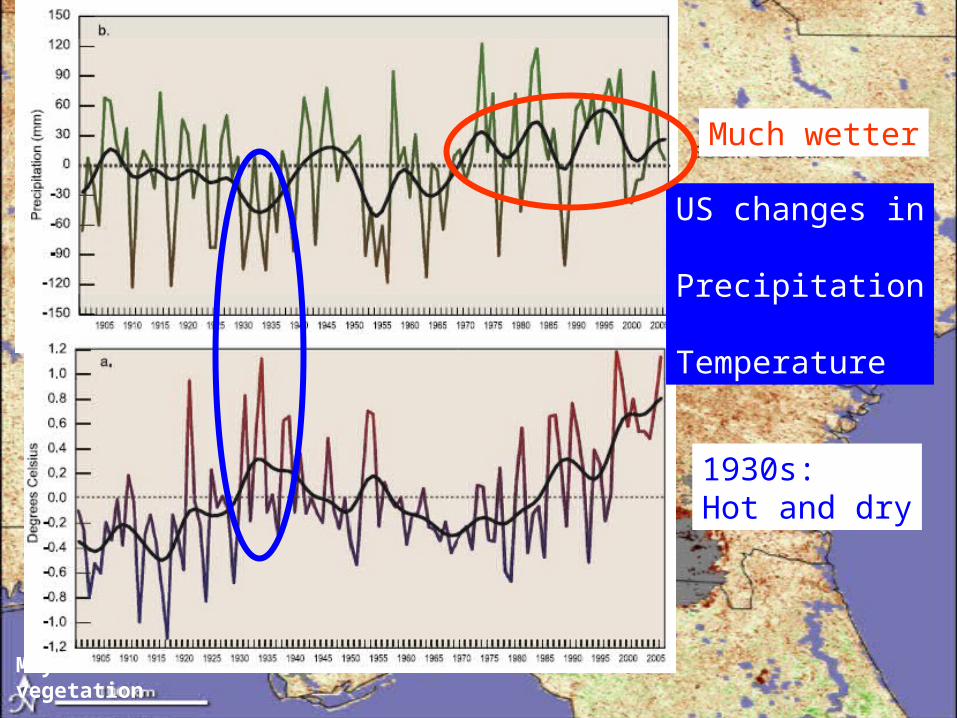
US changes in
Precipitation
Temperature
Much wetter
1930s:Hot and dry
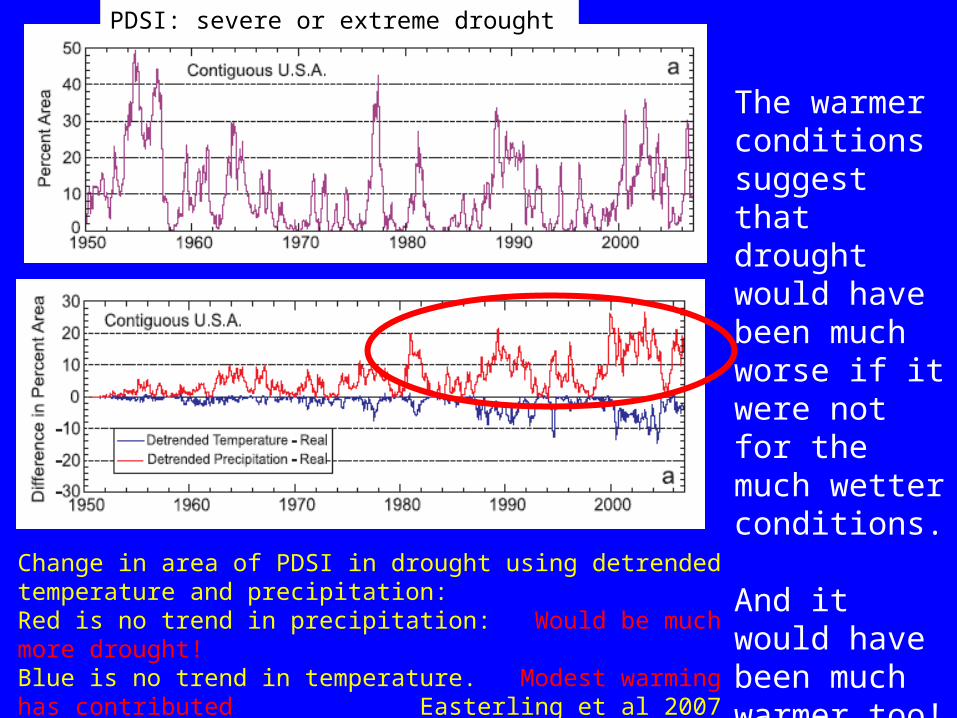
PDSI: severe or extreme drought
Change in area of PDSI in drought using detrended temperature and precipitation: Red is no trend in precipitation: Would be much more drought!Blue is no trend in temperature. Modest warming has contributed Easterling et al 2007
The warmer conditions suggest that drought would have been much worse if it were not for the much wetter conditions.
And it would have been much warmer too!
May 2007 vegetation
Recent drought in SE US was a reversal of patterns for last two decades:
One that could become much more common
Drought in SoutheastDrought in Southeast
Regional climate change
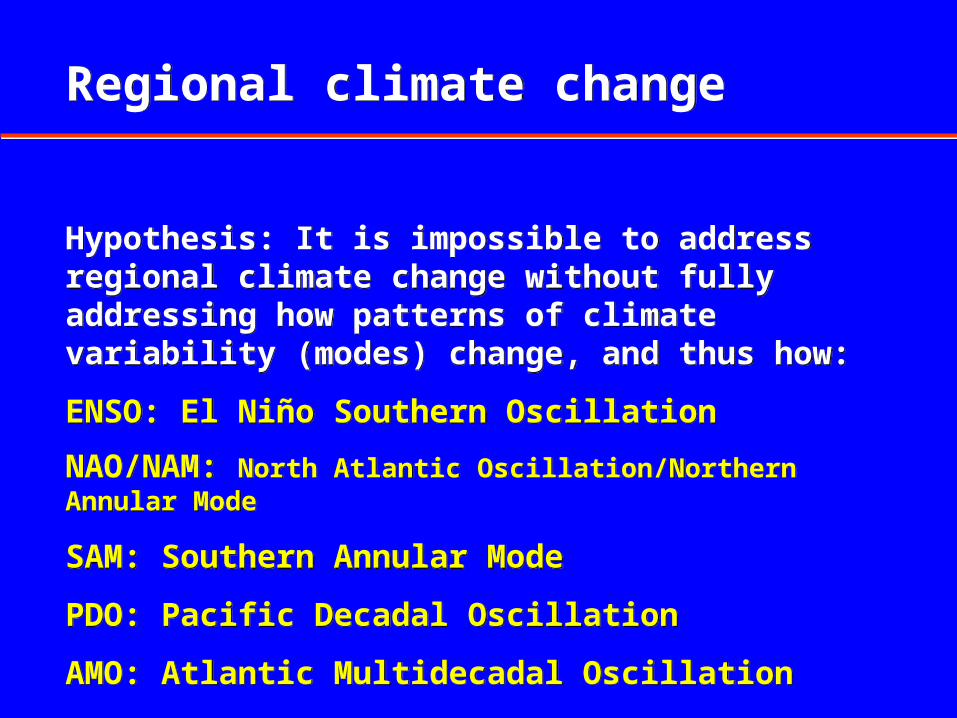
Hypothesis: It is impossible to address regional climate change without fully addressing how patterns of climate variability (modes) change, and thus how:
ENSO: El Niño Southern Oscillation
NAO/NAM: North Atlantic Oscillation/Northern Annular Mode
SAM: Southern Annular Mode
PDO: Pacific Decadal Oscillation
AMO: Atlantic Multidecadal Oscillation
change!
Regional climate change
Hypothesis: It is impossible to address regional climate change without fully addressing how patterns of climate variability (modes) change, and thus how:
ENSO: El Niño Southern Oscillation
NAO/NAM: North Atlantic Oscillation/Northern Annular Mode
SAM: Southern Annular Mode
PDO: Pacific Decadal Oscillation
AMO: Atlantic Multidecadal Oscillation
change!
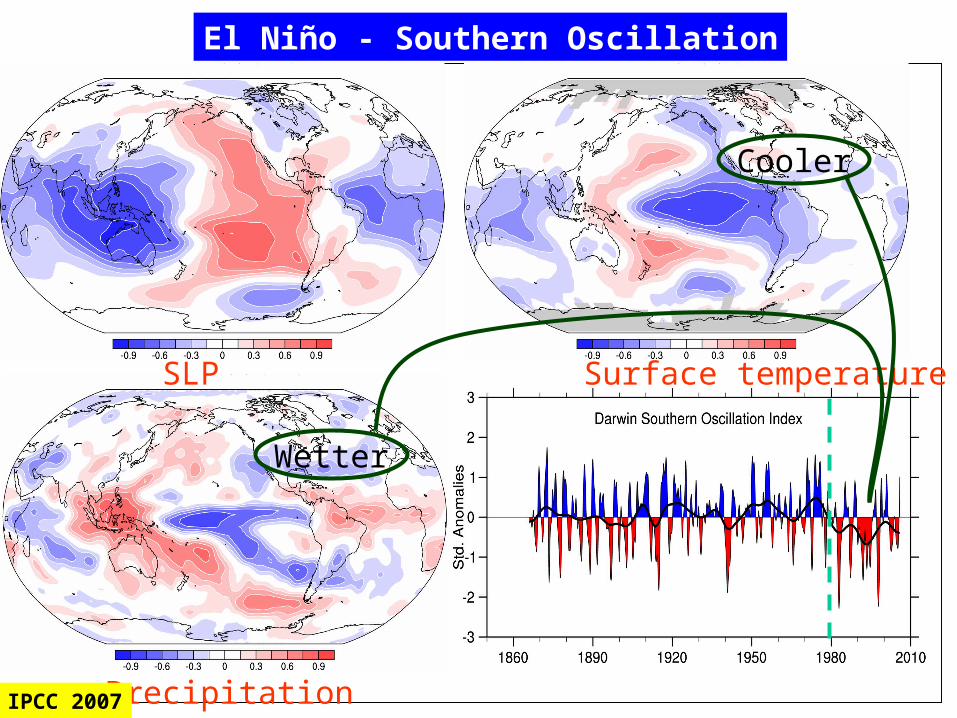
El Niño - Southern Oscillation
SLP Surface temperature
PrecipitationIPCC 2007
Cooler
Wetter
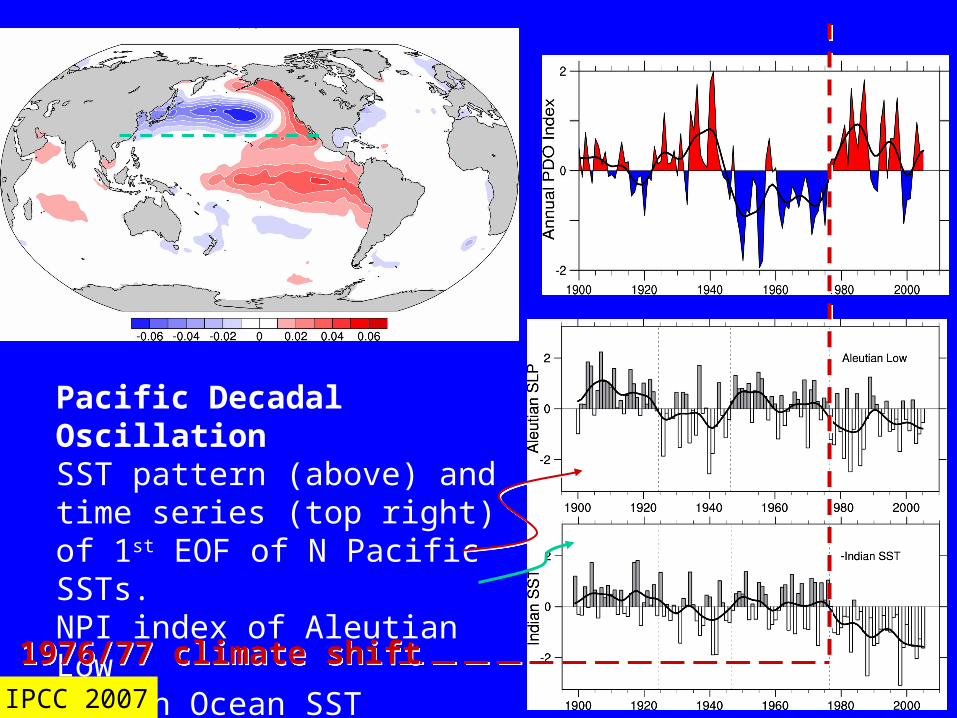
Pacific Decadal OscillationSST pattern (above) and time series (top right) of 1st EOF of N Pacific SSTs.NPI index of Aleutian LowIndian Ocean SST (tropics)
1976/77 climate shift1976/77 climate shiftIPCC 2007
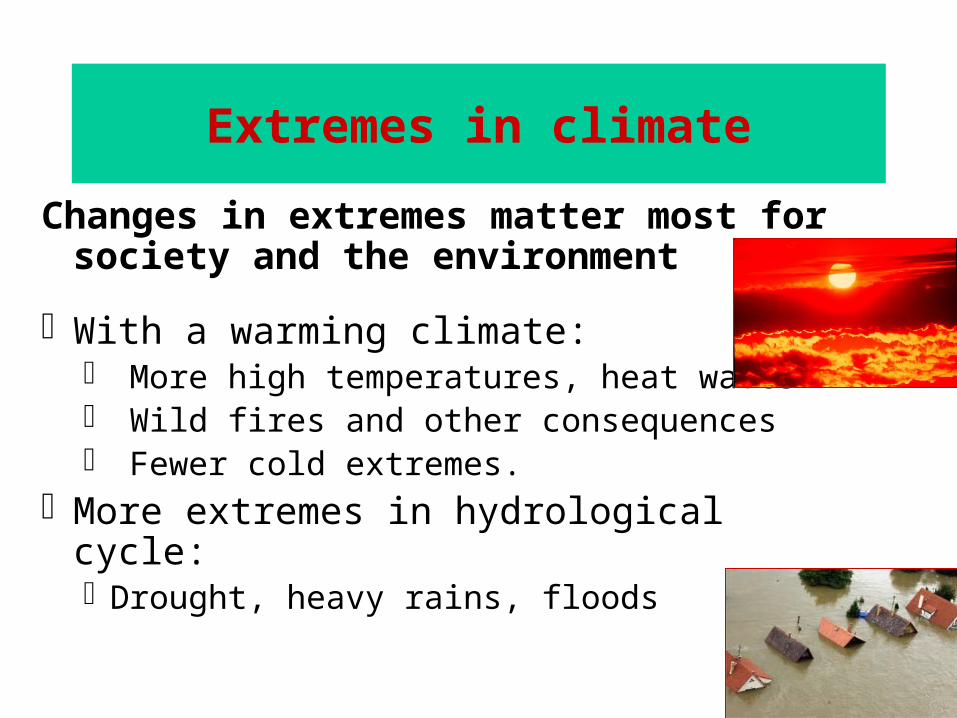
Extremes in climate
Changes in extremes matter most for society and the environment
With a warming climate: More high temperatures, heat waves Wild fires and other consequences Fewer cold extremes.
More extremes in hydrological cycle: Drought, heavy rains, floods
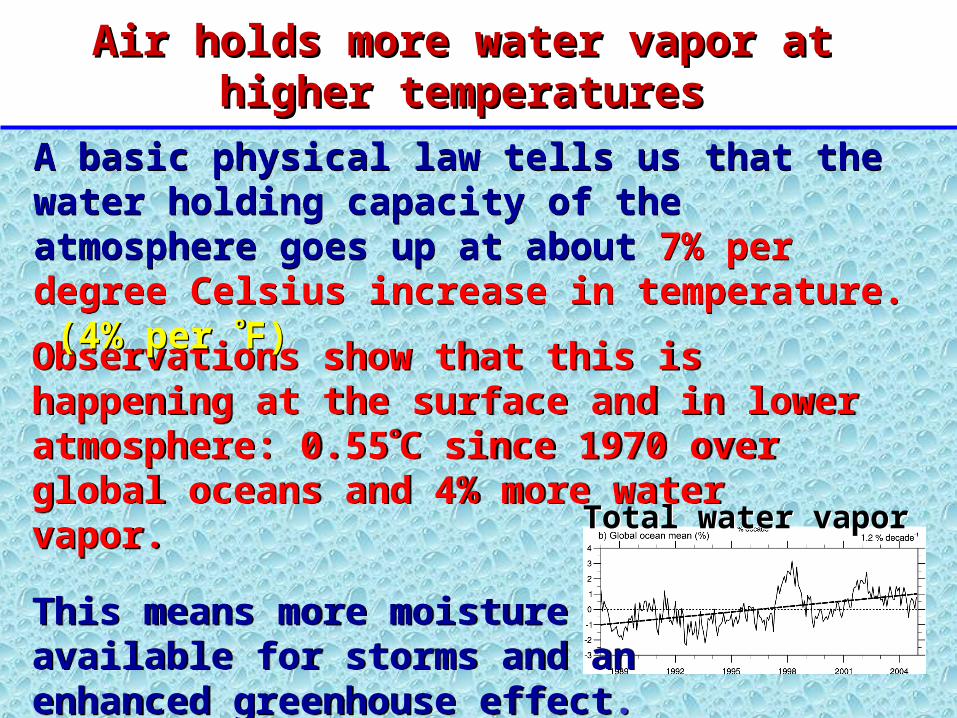
Air holds more water vapor at Air holds more water vapor at higher temperatureshigher temperatures
Total water vaporTotal water vapor
Observations show that this is happening at the surface and in lower atmosphere: 0.55C since 1970 over global oceans and 4% more water vapor.
This means more moisture available for storms and an enhanced greenhouse effect.
Observations show that this is happening at the surface and in lower atmosphere: 0.55C since 1970 over global oceans and 4% more water vapor.
This means more moisture available for storms and an enhanced greenhouse effect.
A basic physical law tells us that the water holding capacity of the atmosphere goes up at about 7% per degree Celsius increase in temperature. (4% per F)
A basic physical law tells us that the water holding capacity of the atmosphere goes up at about 7% per degree Celsius increase in temperature. (4% per F)
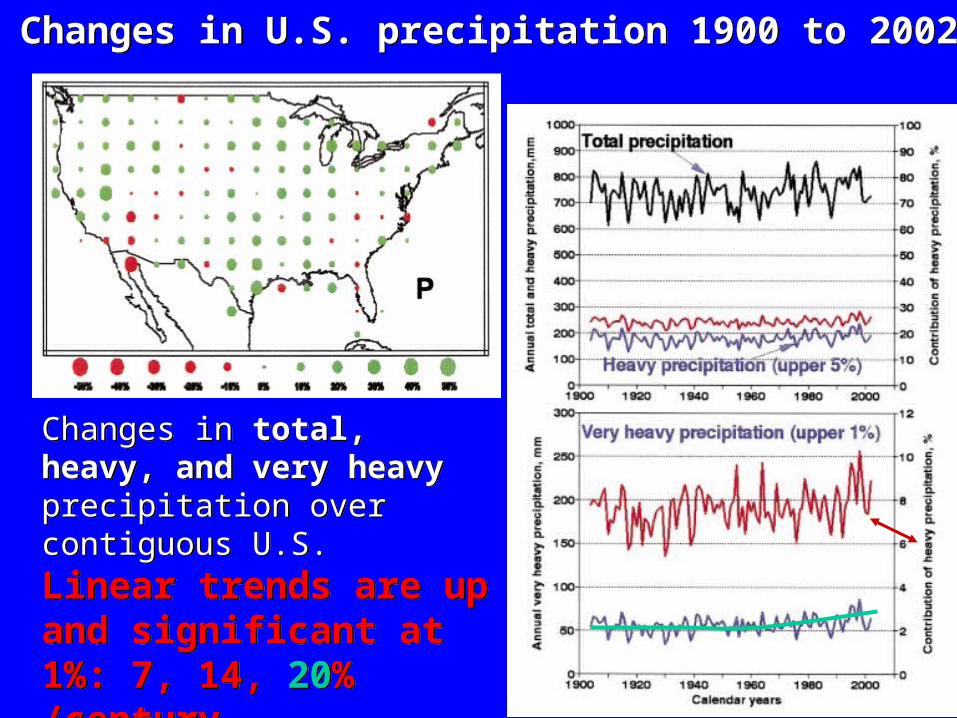
Changes in total, heavy, and very heavy precipitation over contiguous U.S.Linear trends are up and significant at 1%: 7, 14, 20% /century
Groisman et al 2004
Changes in total, heavy, and very heavy precipitation over contiguous U.S.Linear trends are up and significant at 1%: 7, 14, 20% /century
Groisman et al 2004
Changes in U.S. precipitation 1900 to 2002Changes in U.S. precipitation 1900 to 2002
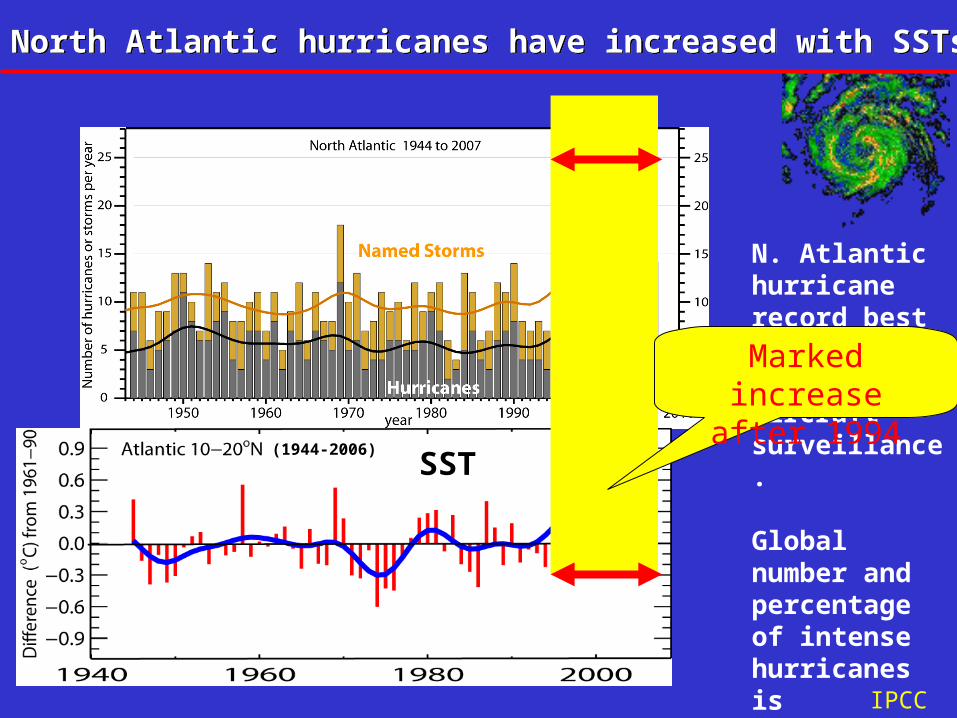
N. Atlantic hurricane record best after 1944 with aircraft surveillance.
Global number and percentage of intense hurricanes is increasing
North Atlantic hurricanes have increased with SSTsNorth Atlantic hurricanes have increased with SSTs
SST(1944-2006)
Marked increase after
1994
IPCC
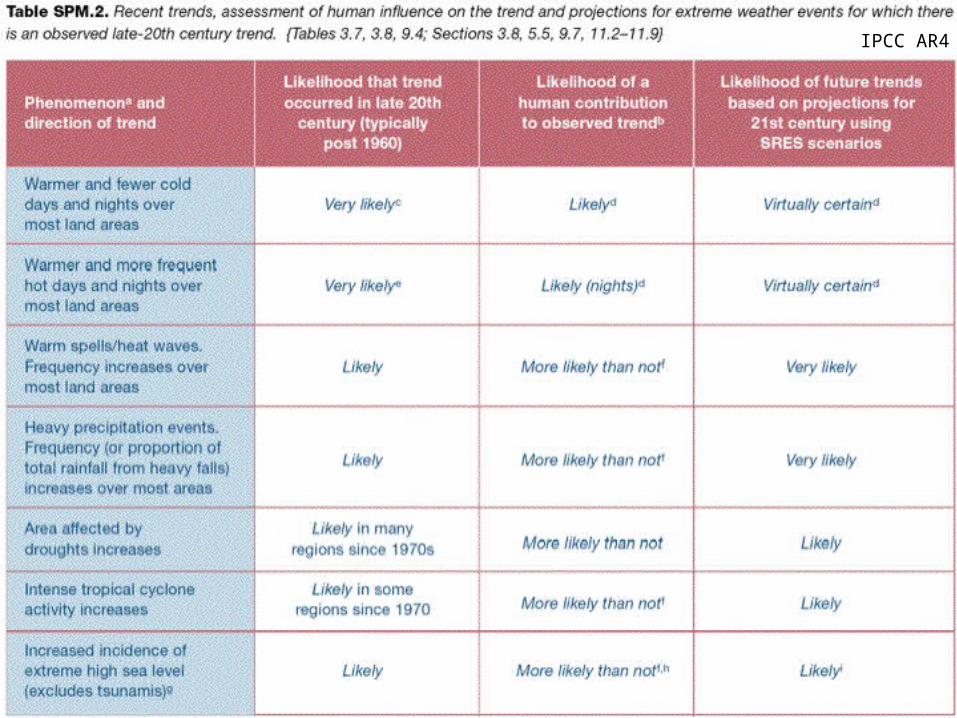
IPCC AR4
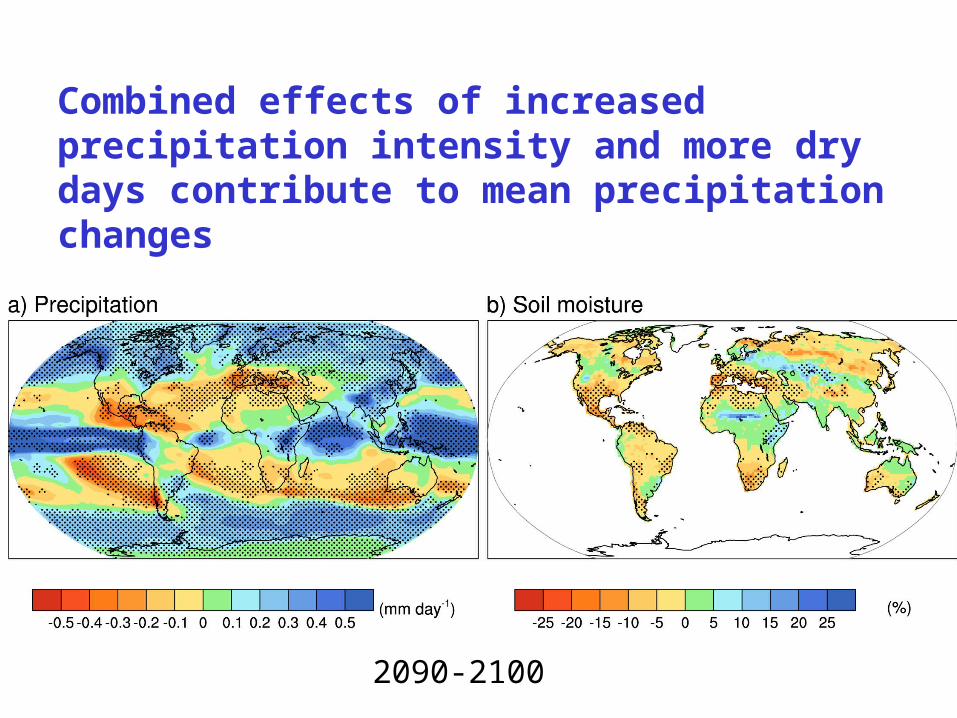
Combined effects of increased precipitation intensity and more dry days contribute to mean precipitation changes
2090-2100
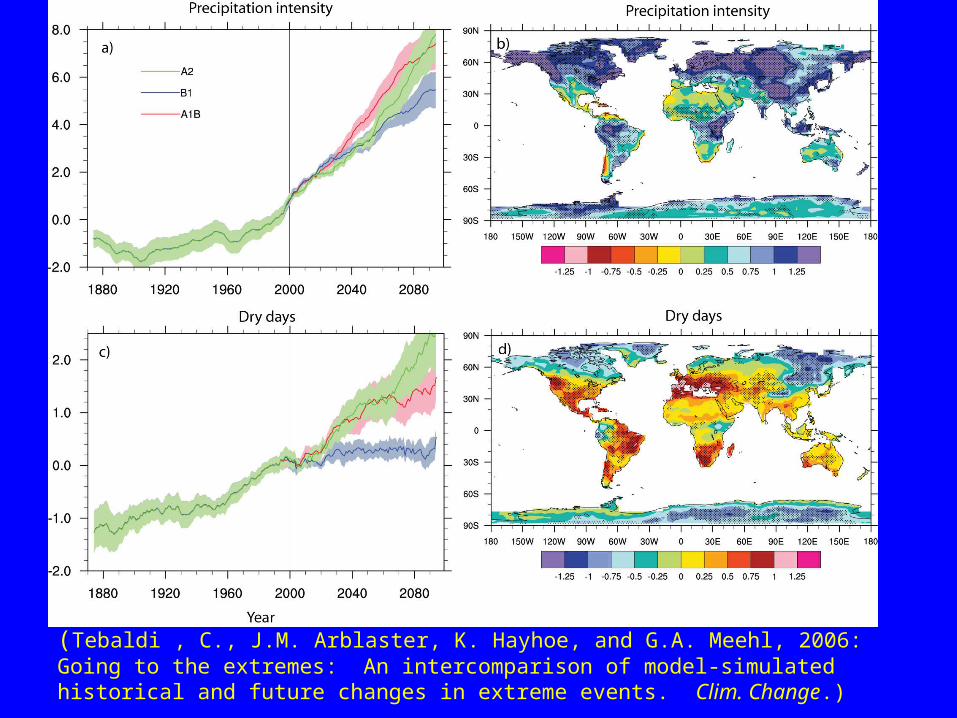
(Tebaldi , C., J.M. Arblaster, K. Hayhoe, and G.A. Meehl, 2006: Going to the extremes: An intercomparison of model-simulated historical and future changes in extreme events. Clim. Change.)
May 2007 vegetation
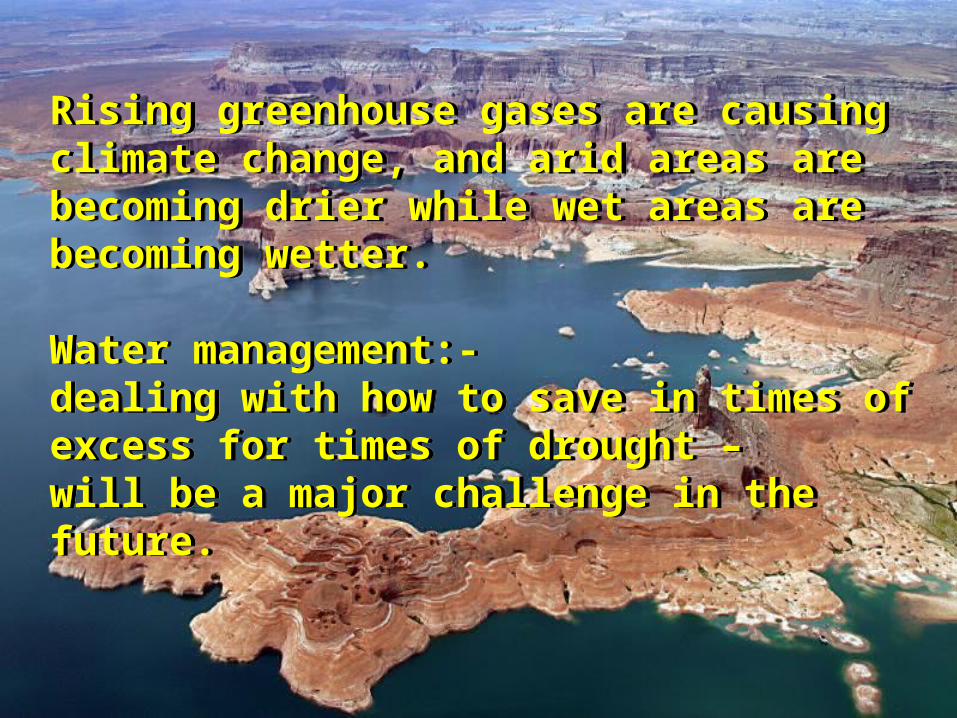
Rising greenhouse gases are causing climate change, and arid areas are becoming drier while wet areas are becoming wetter.
Water management:- dealing with how to save in times of excess for times of drought –will be a major challenge in the future.
Rising greenhouse gases are causing climate change, and arid areas are becoming drier while wet areas are becoming wetter.
Water management:- dealing with how to save in times of excess for times of drought –will be a major challenge in the future.


