MAY 2015 1 Automatic Detection of Epileptogenic Video Content Nelson Rodrigues N o 63152 Instituto Superior T´ ecnico Av. Rovisco Pais, 1049-001 Lisboa, Portugal E-mail: [email protected]Abstract —Epilepsy is a disease that affects around 50 million people worldwide, 3-5% of which had seizures triggered by luminance flashes or spatial patterns on images or videos. Visual contents with notorious varia- tions of luminance in short time intervals enhance the occurrence of seizures on viewers. Symmetrical pat- terns, including striped patterns or concentric circles, with sharp variations of luminance in its components, are also enhancers of seizures. Given the fact that often patients with photosensitive epilepsy are not aware of their condition until the triggering of an attack, it is necessary to make a risk analysis to digital content before it is distributed or displayed. Based on studies carried out by experts, studies that later led to the elaboration of international standards, we purpose two algorithms for automatic detection of epileptogenic visual contents: one for flash detection compliance with ITU-R BT. 17702; and a second one to detect and estimate the risk related to the presence of simple geometric patterns (stripes, circular, chess, etc.). To complement the risk analysis, a graphical in- terface was developed allowing the user to graphically verify the parts of the video that may endanger the viewers. A careful review of the literature was made, in- cluding clinical studies and international regulations, intending to demonstrate the importance of developing evaluation tools for epileptogenic visual contents. Index Terms—Photosensitive Epilepsy, Image Qual- ity Assessment, Flash Detection, Pattern Detection, Automatic Video Analysis. I. Introduction P HOTOSENSITIVE Epilepsy (PSE) is a form of epilepsy where seizures are triggered by visual stim- uli, such as flashing lights, contrasting light or geometric patterns that vary in time or space [6]. Both natural and artificial light may trigger seizures. Flashing lights or fast changing images (as in clubs, around emergency vehicles, in action movies or television programs, com- puter games, etc.) are the most common triggers. The seizure is generated by excessive electrical activity in the brain, that can be the a result of irregularities in the wiring of the brain and/or imbalance of neurotransmitters (chemical messengers in the brain). Individuals affected by PSE, experience what is called a generalized tonic-clonic seizure. A generalized tonic-clonic seizure is one type of seizure that involves the entire body and usually happens at the time of, or shortly after, looking at the trigger. The main symptoms of a seizure include: • loss of conscience and fall to the ground; • muscle contract and body stiffens; • breathing pattern changes; • tongue biting; • loss of bladder control. When the seizure finally ends, the muscles relax and the person slowly regains consciousness. It is usual that the person feels confused, tired, sore and memoryless for a short time. Around 50 million people worldwide have epilepsy, 3-5% of which had seizures triggered by luminance flashes or spatial patterns on images or videos. People with photosensitive epilepsy usually develop the condition before the age of 20, mainly between the ages of 9 and 15 years old. This condition is more likely in females than in males. Stimulus avoidance and stimulus modification can be an effective treatment in some pa- tients and can sometimes be combined with antiepileptic drug treatment. In the last decades, several television material was directly related to the occurrence of paroxysmal incidents: • 1993 - A broadcast advertisement Golden Wonder Pot Noddles [7] precipitated epileptic seizures in 3 viewers in the United Kingdom. • 1997 - The 25th episode of the anime YAT Anshin! UchuRyok¨o [8] was related to seizures in 4 children that were taken to the hospital. • 1997 - The 38th episode of the 1st season of Poke- mon [9] was broadcasted in Japan and caused 685 direct seizures. • 2012 - The London Olympic Games promotional film [10] was blamed for triggering seizures in 4 people. In a study made by the Spanish Society of Neurology (SEN), it was reported that in 180 hours of Spanish TV shows analysed, 1001 images where considered dangerous to susceptible viewers [11]. These incidents have led to medical studies on PSE [1]– [6] and to the formulation of national guidelines in the U.K. [11] and Japan [11], extended internationally by the International Telecommunications Union in recommenda- tion ITU-R BT. - 1702 [12]. With the emergence of dedicated video equipment and with the improvement of viewer’s immersion, the risk is more real than ever; therefore, the implementation of guidelines preventing PSE triggers on media content production and broadcasting is mandatory. However, it is no feasible to detect images that can trigger PSE seizures using a manual quality control in real time. Hence, it is mandatory to develop automatic tools that prevent that type of visual phenomena, or at least signalize its occurrence. This paper is organized as follows: • section II - Photosensitive epilepsy; • section III - Flashy Video Detection; • section IV - Red Transitions Detection; • section V - Patterned Images Detection; • section VI - Graphical User Interface; • section VII - Conclusions.
Transcript
MAY 2015 1
Automatic Detection ofEpileptogenic Video Content
Nelson Rodrigues No63152Instituto Superior Tecnico
Av. Rovisco Pais, 1049-001 Lisboa, PortugalE-mail: [email protected]
Abstract—Epilepsy is a disease that affects around 50million people worldwide, 3-5% of which had seizurestriggered by luminance flashes or spatial patterns onimages or videos. Visual contents with notorious varia-tions of luminance in short time intervals enhance theoccurrence of seizures on viewers. Symmetrical pat-terns, including striped patterns or concentric circles,with sharp variations of luminance in its components,are also enhancers of seizures. Given the fact that oftenpatients with photosensitive epilepsy are not aware oftheir condition until the triggering of an attack, it isnecessary to make a risk analysis to digital contentbefore it is distributed or displayed.
Based on studies carried out by experts, studies thatlater led to the elaboration of international standards,we purpose two algorithms for automatic detection ofepileptogenic visual contents: one for flash detectioncompliance with ITU-R BT. 17702; and a second oneto detect and estimate the risk related to the presenceof simple geometric patterns (stripes, circular, chess,etc.). To complement the risk analysis, a graphical in-terface was developed allowing the user to graphicallyverify the parts of the video that may endanger theviewers.
A careful review of the literature was made, in-cluding clinical studies and international regulations,intending to demonstrate the importance of developingevaluation tools for epileptogenic visual contents.
Index Terms—Photosensitive Epilepsy, Image Qual-ity Assessment, Flash Detection, Pattern Detection,Automatic Video Analysis.
I. Introduction
PHOTOSENSITIVE Epilepsy (PSE) is a form ofepilepsy where seizures are triggered by visual stim-
uli, such as flashing lights, contrasting light or geometricpatterns that vary in time or space [6]. Both naturaland artificial light may trigger seizures. Flashing lightsor fast changing images (as in clubs, around emergencyvehicles, in action movies or television programs, com-puter games, etc.) are the most common triggers. Theseizure is generated by excessive electrical activity in thebrain, that can be the a result of irregularities in thewiring of the brain and/or imbalance of neurotransmitters(chemical messengers in the brain). Individuals affected byPSE, experience what is called a generalized tonic-clonicseizure. A generalized tonic-clonic seizure is one type ofseizure that involves the entire body and usually happensat the time of, or shortly after, looking at the trigger. Themain symptoms of a seizure include:• loss of conscience and fall to the ground;• muscle contract and body stiffens;• breathing pattern changes;• tongue biting;• loss of bladder control.
When the seizure finally ends, the muscles relax andthe person slowly regains consciousness. It is usual thatthe person feels confused, tired, sore and memorylessfor a short time. Around 50 million people worldwidehave epilepsy, 3-5% of which had seizures triggered byluminance flashes or spatial patterns on images or videos.People with photosensitive epilepsy usually develop thecondition before the age of 20, mainly between the agesof 9 and 15 years old. This condition is more likely infemales than in males. Stimulus avoidance and stimulusmodification can be an effective treatment in some pa-tients and can sometimes be combined with antiepilepticdrug treatment.
In the last decades, several television material wasdirectly related to the occurrence of paroxysmal incidents:• 1993 - A broadcast advertisement Golden Wonder
Pot Noddles [7] precipitated epileptic seizures in 3viewers in the United Kingdom.
• 1997 - The 25th episode of the anime YAT Anshin!Uchu Ryoko [8] was related to seizures in 4 childrenthat were taken to the hospital.
• 1997 - The 38th episode of the 1st season of Poke-mon [9] was broadcasted in Japan and caused 685direct seizures.
• 2012 - The London Olympic Games promotionalfilm [10] was blamed for triggering seizures in 4people.
In a study made by the Spanish Society of Neurology(SEN), it was reported that in 180 hours of Spanish TVshows analysed, 1001 images where considered dangerousto susceptible viewers [11].
These incidents have led to medical studies on PSE [1]–[6] and to the formulation of national guidelines in theU.K. [11] and Japan [11], extended internationally by theInternational Telecommunications Union in recommenda-tion ITU-R BT. - 1702 [12].
With the emergence of dedicated video equipment andwith the improvement of viewer’s immersion, the riskis more real than ever; therefore, the implementationof guidelines preventing PSE triggers on media contentproduction and broadcasting is mandatory. However, it isno feasible to detect images that can trigger PSE seizuresusing a manual quality control in real time. Hence, itis mandatory to develop automatic tools that preventthat type of visual phenomena, or at least signalize itsoccurrence. This paper is organized as follows:• section II - Photosensitive epilepsy;• section III - Flashy Video Detection;• section IV - Red Transitions Detection;• section V - Patterned Images Detection;• section VI - Graphical User Interface;• section VII - Conclusions.
MAY 2015 2
II. Photosensitive EpilepsyThe first guidance notes in this scope were developed
between 1993 and 2001 by UK’s Independent Televi-sion Commission, ITC, further Ofcom. The final version,released in 2001 [11], was a consensus statement of aCommittee set up by the ITC consisting of three medicalexperts: Prof G F A Harding, Prof C Binnie, and ProfA Wilkins. The Ofcom guidelines on potential harmfulflashes have been adopted by ITU in 2005, in recommen-dation ITU-R BT. 1702 [12].
The main difference between Ofcom’s regulatory andITU’s relies on patterned pictures characterization. Al-though ITU refers that regular patterns clearly discerniblein normal domestic viewing conditions [13] should beavoided, the patterns’ characteristics are not described.Both Ofcom and ITU-R also state that a sequence offlashing images lasting more than 5 seconds might con-stitute a risk even when it complies with the guidelines.This assumption is made considering medical opinion,that considers that the risk of seizures increases with theduration of flashing.
The presented regulations will be considered along thiswork. The developed algorithms are prepared to evaluateif videos comply the demanded restrictions of both or-ganizations, and even to adapt evaluation parameters iffurther updates arise.
A. Related WorkHarding Flash and Pattern Analyser or HFPA [21], is
a tool developed in accordance to the Ofcom [11] andITU [12] guidelines. It is capable to detect patterns, flashsequences and evaluate the corresponding risk. It displaysa graphically interpretation of the video safety. The devel-oped tools is also used by other commercial solutions, suchas Cerify [23], by Tektronix and Aurora [22], by Digimet-rics (which offer quality control capability on many otheraspects, such as encoding errors, buffer analysis, syntaxerrors, etc.).
Hitachi’s Flicker Check solution detects flashing, con-trast change, patterned and subliminal images. It alsogives relevant information about the characteristics of thedetected stimuli.
III. Flashy Video DetectionThis section describes the algorithm developed for the
detection of flashy video content that can precipitateseizures, taking in account the guidelines in ITU recom-mendation BT.1702 [12]. The algorithm is able to detectthe occurrence of luminance flashes and red flashes.
A. Screen LuminanceAlthough the ITU recommendation BT.1702 [12] stan-
dard is relative to brightness values of the display, ex-pressed in cd/m2, in digital video the picture elementsare represented in terms of the digital values, usuallyluminance and chrominances. To convert from luminance(expressed in mV) to screen brightness, ITU-R suggeststhe use of the graph shown in Appendix 2 of [12], whichcan be considered as representative of the gamma charac-teristic, γ, for most domestic TV screens [12].The valuesof Appendix 2 of [12] can be analytical related by equation(1):
L(v) = 413.435 ×( v
1000 + 0.0189623)2.2
(1)
where v represents the screen voltage in mV and L is theluminance expressed in cd/m2.
In order to use equation (1), it is necessary to convertthe digital values to luminance voltage. ITU stipulates,through recommendation BT.601 [14], quantization levelsfor the black level and the peak white level correspondingto 16.00d and 235.00d, respectively. However, it happensthat in several cases these limits are not respected, and theblack and white levels are represented with digital valuesbelow 16.00d (in the limit, 0d) and above 235.00d (in thelimit, 255.00d), respectively.
Let YW and YB represent the digital values correspond-ing to peak white and black levels, respectively. Assuminga linear relation between digital values and the luminancein volts, it can be written that:
v(mV) =(
700YW − YB
)× (Yd − YB) (2)
where v represents the luminance in mV and Yd theluminance expressed in digital values.
Combining equations (1) and (2), considering that YBand YW are 0 and 255, respectively, results:
Y (cd/m2) = 413.435(0.002745 × Yd + 0.0189623)2.2 (3)
Equation (3) is implemented in the algorithm through alook-up table procedure, in order to reduce the associatedprocessing time.
B. Algorithm for Flashy Video DetectionA flash occurs when there is a pair of opposing changes
in luminance (i.e. an increase in luminance followed bya decrease, or a decrease followed by an increase) of 20cd/m2 or more [12]. This applies only when the screenluminance of the brighter image is below 160 cd/m2 andwhen the luminance of the darker image is above 20cd/m2. Concerning the previous definition it is necessaryto isolate the region of the image where the refereedtransition occurs. The flash evaluation will be performedonly when a pre-defined fraction of the image area, Avar,varies. When the area of variation satisfies the giventhreshold, several operations area made to isolate thetransition area.
Initially, the frame difference between each pair ofconsecutive frames is computed:
fdiff = fN+1 − fN (4)
From this difference, one of the following situations canbe identified for each pixel:• positive variation: the transition is an increase of
luminance;• negative variation: the transition is a decrease of
luminance;• null variation: no change in luminance.To evaluate the type of the transition – positive, neg-
ative or null – a thresholding operation is applied to theresulting frame difference, through conditions (5) and (6):
(6)Applying conditions (5) and (6), results in two images
with the isolated region of the image where pixels havechanged their value.
Once fdiffPOS and fdiffNEG were obtained, the av-erage luminance difference of the transition, ∆y, is com-puted.
C. Luminance Variation EvaluationConsider that histo is the histogram of the positive
or negative frame differences, and that avg is the differ-ence average value computed using the highest bins ofhistogram that, when summed, equals the minimum flasharea, Avar × M × N , where M and N defines the framewidth and height, in pixels. The following steps explainhow avg is computed, for both fdiffPOS and fdiffNEG:
1: Generate the histogram, histo.2: Scan histo from right to left until the number of
elements in the bins equals Avar×M×N elements.3: Computes the average value of the elements scanned,
∆y, according to (7)
∆y =
∑i∈B
histo(i) × i∑i∈B
histo(i) (7)
where B is the set of bins scanned in step 2.This algorithm evaluates the histograms of fdiffPOS
and fdiffNEG, and returns the average values of lumi-nance difference, ∆YPOS and ∆YNEG, respectively. Thehigher absolute value is then stored in an array, andthe procedure is continuously applied along the videosequence.
D. Flash Sequence DetectionThe average luminance difference between each pair of
consecutive frames, computed as described in the precioussection, is stored in an array, ∆Y. Analysing the signal ofthe elements of ∆Y, in an sequential scan, it is possibleto identify the variation trend; if ∆Y has the same signalalong consecutive positions, it is assumed that the trendof variation is constant (a constant increase or decreaseof luminance) and the differences are accumulated in anarray ∆Yacc; if during the scan of ∆Y the value in positioni has a different signal of the value in position i+ 1, it isconsidered that the trend has changed (the difference isnot accumulated).
Analysing table I it is observed that during the 25frames (a time interval of 1 second) there are 4 sectionswith increases of luminance followed by decreases, andthe accumulated variations are, in each section, above 20cd/m2. The sequence shows the occurrence of 4 flashesin 1 second. According to the guidelines [12], this videosequence does not complies with the maximum number of3 flashes per second.
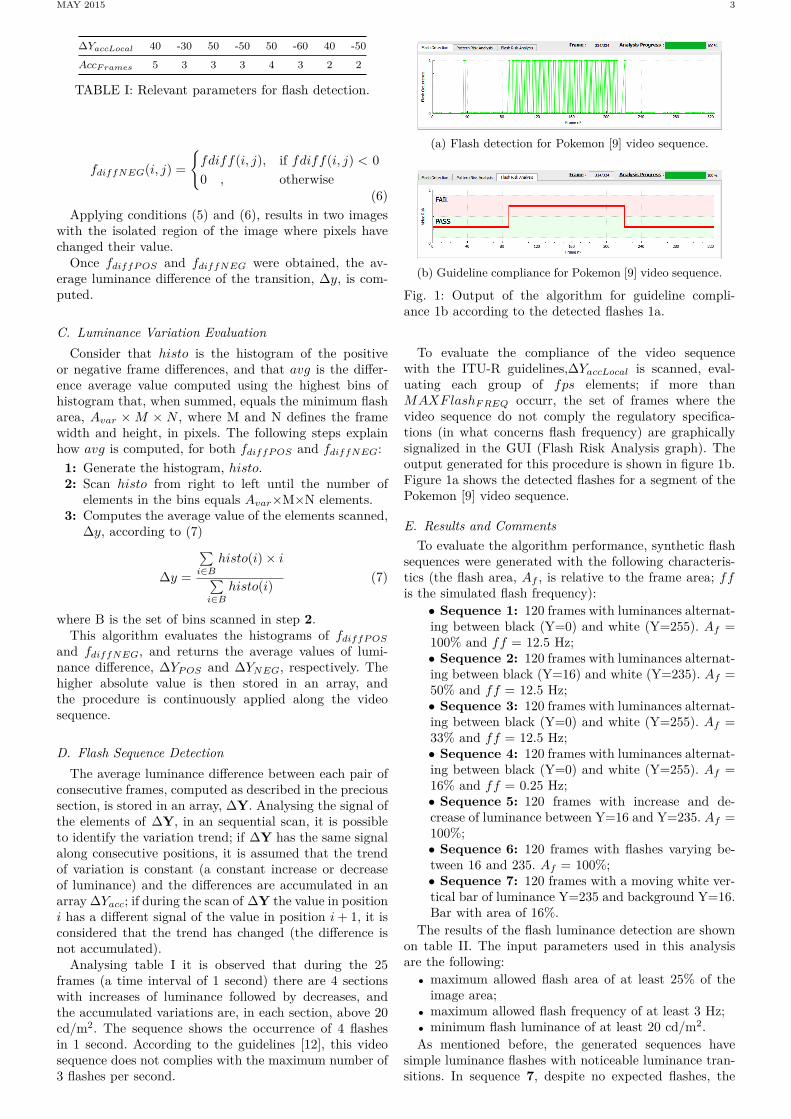
(a) Flash detection for Pokemon [9] video sequence.
(b) Guideline compliance for Pokemon [9] video sequence.
Fig. 1: Output of the algorithm for guideline compli-ance 1b according to the detected flashes 1a.
To evaluate the compliance of the video sequencewith the ITU-R guidelines,∆YaccLocal is scanned, eval-uating each group of fps elements; if more thanMAXFlashFREQ occurr, the set of frames where thevideo sequence do not comply the regulatory specifica-tions (in what concerns flash frequency) are graphicallysignalized in the GUI (Flash Risk Analysis graph). Theoutput generated for this procedure is shown in figure 1b.Figure 1a shows the detected flashes for a segment of thePokemon [9] video sequence.
E. Results and CommentsTo evaluate the algorithm performance, synthetic flash
sequences were generated with the following characteris-tics (the flash area, Af , is relative to the frame area; ffis the simulated flash frequency):
• Sequence 1: 120 frames with luminances alternat-ing between black (Y=0) and white (Y=255). Af =100% and ff = 12.5 Hz;• Sequence 2: 120 frames with luminances alternat-ing between black (Y=16) and white (Y=235). Af =50% and ff = 12.5 Hz;• Sequence 3: 120 frames with luminances alternat-ing between black (Y=0) and white (Y=255). Af =33% and ff = 12.5 Hz;• Sequence 4: 120 frames with luminances alternat-ing between black (Y=0) and white (Y=255). Af =16% and ff = 0.25 Hz;• Sequence 5: 120 frames with increase and de-crease of luminance between Y=16 and Y=235. Af =100%;• Sequence 6: 120 frames with flashes varying be-tween 16 and 235. Af = 100%;• Sequence 7: 120 frames with a moving white ver-tical bar of luminance Y=235 and background Y=16.Bar with area of 16%.
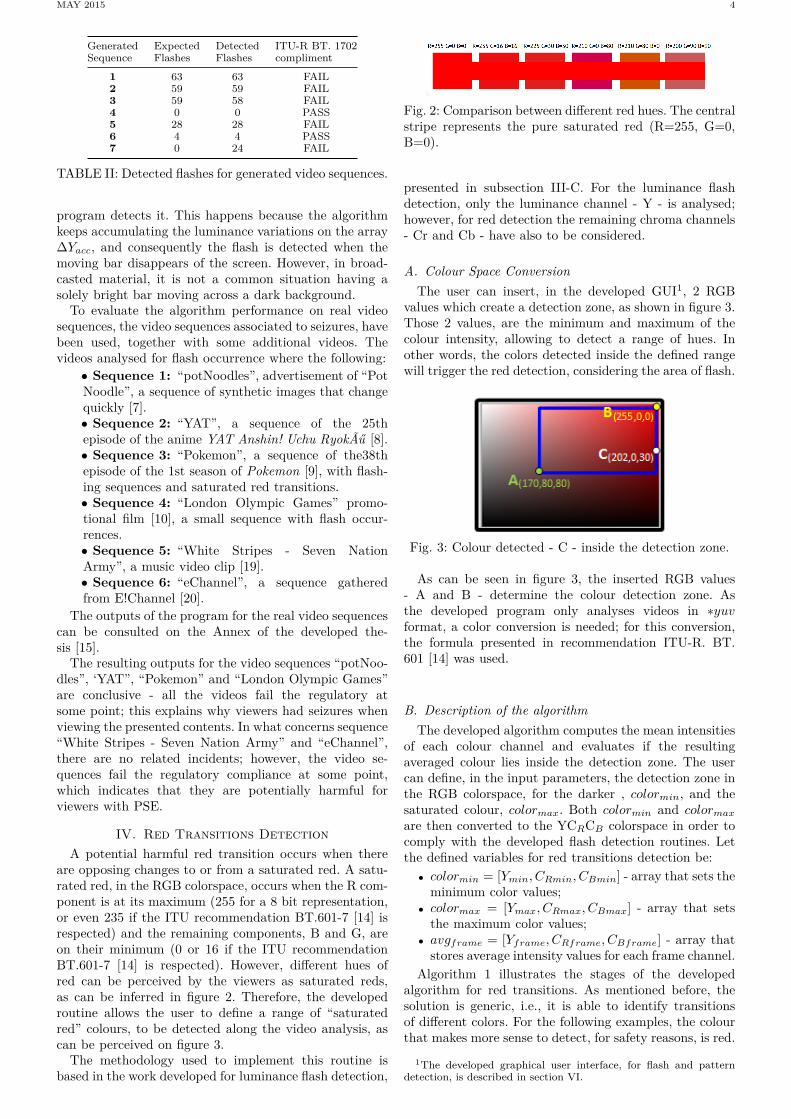
The results of the flash luminance detection are shownon table II. The input parameters used in this analysisare the following:• maximum allowed flash area of at least 25% of the
image area;• maximum allowed flash frequency of at least 3 Hz;• minimum flash luminance of at least 20 cd/m2.As mentioned before, the generated sequences have
simple luminance flashes with noticeable luminance tran-sitions. In sequence 7, despite no expected flashes, the
TABLE II: Detected flashes for generated video sequences.
program detects it. This happens because the algorithmkeeps accumulating the luminance variations on the array∆Yacc, and consequently the flash is detected when themoving bar disappears of the screen. However, in broad-casted material, it is not a common situation having asolely bright bar moving across a dark background.
To evaluate the algorithm performance on real videosequences, the video sequences associated to seizures, havebeen used, together with some additional videos. Thevideos analysed for flash occurrence where the following:
• Sequence 1: “potNoodles”, advertisement of “PotNoodle”, a sequence of synthetic images that changequickly [7].• Sequence 2: “YAT”, a sequence of the 25thepisode of the anime YAT Anshin! Uchu RyokÃű [8].• Sequence 3: “Pokemon”, a sequence of the38thepisode of the 1st season of Pokemon [9], with flash-ing sequences and saturated red transitions.• Sequence 4: “London Olympic Games” promo-tional film [10], a small sequence with flash occur-rences.• Sequence 5: “White Stripes - Seven NationArmy”, a music video clip [19].• Sequence 6: “eChannel”, a sequence gatheredfrom E!Channel [20].
The outputs of the program for the real video sequencescan be consulted on the Annex of the developed the-sis [15].
The resulting outputs for the video sequences “potNoo-dles”, ‘YAT”, “Pokemon” and “London Olympic Games”are conclusive - all the videos fail the regulatory atsome point; this explains why viewers had seizures whenviewing the presented contents. In what concerns sequence“White Stripes - Seven Nation Army” and “eChannel”,there are no related incidents; however, the video se-quences fail the regulatory compliance at some point,which indicates that they are potentially harmful forviewers with PSE.
IV. Red Transitions DetectionA potential harmful red transition occurs when there
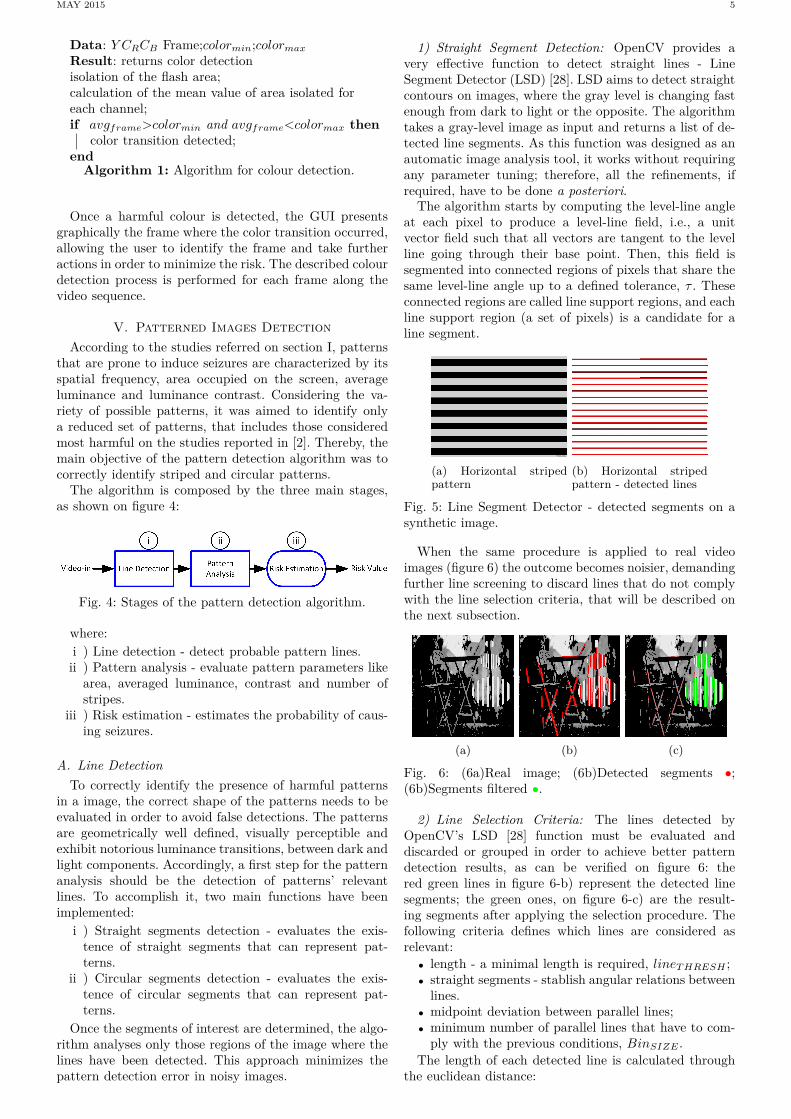
are opposing changes to or from a saturated red. A satu-rated red, in the RGB colorspace, occurs when the R com-ponent is at its maximum (255 for a 8 bit representation,or even 235 if the ITU recommendation BT.601-7 [14] isrespected) and the remaining components, B and G, areon their minimum (0 or 16 if the ITU recommendationBT.601-7 [14] is respected). However, different hues ofred can be perceived by the viewers as saturated reds,as can be inferred in figure 2. Therefore, the developedroutine allows the user to define a range of “saturatedred” colours, to be detected along the video analysis, ascan be perceived on figure 3.
The methodology used to implement this routine isbased in the work developed for luminance flash detection,
Fig. 2: Comparison between different red hues. The centralstripe represents the pure saturated red (R=255, G=0,B=0).
presented in subsection III-C. For the luminance flashdetection, only the luminance channel - Y - is analysed;however, for red detection the remaining chroma channels- Cr and Cb - have also to be considered.
A. Colour Space ConversionThe user can insert, in the developed GUI1, 2 RGB
values which create a detection zone, as shown in figure 3.Those 2 values, are the minimum and maximum of thecolour intensity, allowing to detect a range of hues. Inother words, the colors detected inside the defined rangewill trigger the red detection, considering the area of flash.
Fig. 3: Colour detected - C - inside the detection zone.
As can be seen in figure 3, the inserted RGB values- A and B - determine the colour detection zone. Asthe developed program only analyses videos in ∗yuvformat, a color conversion is needed; for this conversion,the formula presented in recommendation ITU-R. BT.601 [14] was used.
B. Description of the algorithmThe developed algorithm computes the mean intensities
of each colour channel and evaluates if the resultingaveraged colour lies inside the detection zone. The usercan define, in the input parameters, the detection zone inthe RGB colorspace, for the darker , colormin, and thesaturated colour, colormax. Both colormin and colormaxare then converted to the YCRCB colorspace in order tocomply with the developed flash detection routines. Letthe defined variables for red transitions detection be:• colormin = [Ymin, CRmin, CBmin] - array that sets the
minimum color values;• colormax = [Ymax, CRmax, CBmax] - array that sets
the maximum color values;• avgframe = [Yframe, CRframe, CBframe] - array that
stores average intensity values for each frame channel.Algorithm 1 illustrates the stages of the developed
algorithm for red transitions. As mentioned before, thesolution is generic, i.e., it is able to identify transitionsof different colors. For the following examples, the colourthat makes more sense to detect, for safety reasons, is red.
1The developed graphical user interface, for flash and patterndetection, is described in section VI.
MAY 2015 5
Data: Y CRCB Frame;colormin;colormaxResult: returns color detectionisolation of the flash area;calculation of the mean value of area isolated foreach channel;if avgframe>colormin and avgframe<colormax then
color transition detected;end
Algorithm 1: Algorithm for colour detection.
Once a harmful colour is detected, the GUI presentsgraphically the frame where the color transition occurred,allowing the user to identify the frame and take furtheractions in order to minimize the risk. The described colourdetection process is performed for each frame along thevideo sequence.
V. Patterned Images DetectionAccording to the studies referred on section I, patterns
that are prone to induce seizures are characterized by itsspatial frequency, area occupied on the screen, averageluminance and luminance contrast. Considering the va-riety of possible patterns, it was aimed to identify onlya reduced set of patterns, that includes those consideredmost harmful on the studies reported in [2]. Thereby, themain objective of the pattern detection algorithm was tocorrectly identify striped and circular patterns.
The algorithm is composed by the three main stages,as shown on figure 4:
Fig. 4: Stages of the pattern detection algorithm.
where:i ) Line detection - detect probable pattern lines.ii ) Pattern analysis - evaluate pattern parameters like
area, averaged luminance, contrast and number ofstripes.
iii ) Risk estimation - estimates the probability of caus-ing seizures.
A. Line DetectionTo correctly identify the presence of harmful patterns
in a image, the correct shape of the patterns needs to beevaluated in order to avoid false detections. The patternsare geometrically well defined, visually perceptible andexhibit notorious luminance transitions, between dark andlight components. Accordingly, a first step for the patternanalysis should be the detection of patterns’ relevantlines. To accomplish it, two main functions have beenimplemented:
i ) Straight segments detection - evaluates the exis-tence of straight segments that can represent pat-terns.
ii ) Circular segments detection - evaluates the exis-tence of circular segments that can represent pat-terns.
Once the segments of interest are determined, the algo-rithm analyses only those regions of the image where thelines have been detected. This approach minimizes thepattern detection error in noisy images.
1) Straight Segment Detection: OpenCV provides avery effective function to detect straight lines - LineSegment Detector (LSD) [28]. LSD aims to detect straightcontours on images, where the gray level is changing fastenough from dark to light or the opposite. The algorithmtakes a gray-level image as input and returns a list of de-tected line segments. As this function was designed as anautomatic image analysis tool, it works without requiringany parameter tuning; therefore, all the refinements, ifrequired, have to be done a posteriori.
The algorithm starts by computing the level-line angleat each pixel to produce a level-line field, i.e., a unitvector field such that all vectors are tangent to the levelline going through their base point. Then, this field issegmented into connected regions of pixels that share thesame level-line angle up to a defined tolerance, τ . Theseconnected regions are called line support regions, and eachline support region (a set of pixels) is a candidate for aline segment.
(a) Horizontal stripedpattern
(b) Horizontal stripedpattern - detected lines
Fig. 5: Line Segment Detector - detected segments on asynthetic image.
When the same procedure is applied to real videoimages (figure 6) the outcome becomes noisier, demandingfurther line screening to discard lines that do not complywith the line selection criteria, that will be described onthe next subsection.
2) Line Selection Criteria: The lines detected byOpenCV’s LSD [28] function must be evaluated anddiscarded or grouped in order to achieve better patterndetection results, as can be verified on figure 6: thered green lines in figure 6-b) represent the detected linesegments; the green ones, on figure 6-c) are the result-ing segments after applying the selection procedure. Thefollowing criteria defines which lines are considered asrelevant:• length - a minimal length is required, lineTHRESH ;• straight segments - stablish angular relations between
lines.• midpoint deviation between parallel lines;• minimum number of parallel lines that have to com-
ply with the previous conditions, BinSIZE .The length of each detected line is calculated through
the euclidean distance:
MAY 2015 6
d(p, q) = d(q, p) =√
(x1 − x2)2 + (y1 − y2)2 (8)
where p = (x1, y1) and q = (x2, y2) represent the terminalpoints of the line segment, retrieved by the LSD function.
After discarding the line segments that do not satisfythe minimum length, the next step relies on finding setsof line segments that share the same orientation, lineα,in the image. The orientation of each line segment can becalculated through equation (9):
lineα = arctan(y2 − y1
x2 − x1
)(9)
Grouping all the segments with similar orientations inangular bins, allows to discard angular bins that do nothave a pre-defined binSIZE . Each bin has a resolution ofφbin.
The last screening operation decides which line seg-ments are related according to the deviation lines’ mid-point. This is done by computing the deviation of themidpoint in each bin group. The deviation is calculatedthrough the distance that the midpoint of each line seg-ment has to a perpendicular line defined from a specificpivot line. Figure 7 presents, graphically, the consideredmethod.
Fig. 7: Line selection by midpoint deviation.
Figure 7 aims to explain how line segments are dis-carded by showing an evaluation round with line L1 aspivot. In each verification, all the lines have the sameorientation, as all the lines are on the same angular bin.A perpendicular line to the midpoint of L1 is consideredand all the remaining lines are evaluated relatively toit. The perpendicular line - P1 - has intersection pointswith all the represented lines, which are computed tomeasure the distance to the midpoint of each one of theremaining lines. If the intersection point is outside theselection region, selectionregion, the line in question willbe discarded from the sub group defined with L1 as pivot.In this case, lines L3 and L5 are discarded. The procedureis repeated, having each line as a pivot. The subgroupconstituted by L3 and L5 is also stored in another datastructure, another line subgroup, since both comply withthe described considerations. When all the stored lineshave their midpoint inside the selection zone, for each linesubgroup, the final set of segments is encountered.
After evaluating the lines in every single orientation,one final verification has to be performed. Each bin ofretained lines has to be equal or greater than BinSIZE ,otherwise the set is discarded. The minimum number ofsegments - BinSIZE - is an input parameter and it isrelevant to correctly identify a harmful striped pattern.If each subgroup set of segments satisfy the minimum
number of segments, it is probable that there is morethan one pattern, or a more complex one. However, allthe screened subgroups are stored in order to estimatepattern risk. Concerning the information inferred fromthe literature [2], a five-stripe pair pattern represents asubstantial increase of risk. Therefore, BinSIZE shouldbe not less than 9 line segments.
3) Circular Segments Detection: Concentric circularpatterns are prone to induce seizures, depending of thepattern’s spatial frequency and luminance contrast, asshown in the literature [2]. To identify circular patterns onnoiseless synthetic images may be a simple task. However,in a noisy environment false positive/negative detectionsmay arise.
The method used to detect the shape contours is theOpenCV’s Findcontours [29] function, which performscontours detection through the Suzuki algorithm [36];each detected contour is stored as a vector of points. Thefunction receives as input a grayscale or a binary image.
Once all the contours are defined and stored, screeningoperations are performed in order to select the correct cir-cular shapes. The first operation is to detect the momentsof the shape, trough the OpenCV Moments [30] function.Moments of order (i,j) are computed using equation (10)
mi,j =∑x,y
contour(x, y) · xi · yj (10)
where (x,y) are the image coordinates of the contourpoints.
x = m10
m00, y = m01
m00(11)
Equation (11) allows to determine the position of eachcontour mass center. This information allows to discardshapes were the center of mass is not inside the shape arediscarded.
As it is well known, the mass center of a circularshape lies inside the shape and it also corresponds toits center. Accordingly, shapes where the center of massis not inside the shape, are discarded. Figure 8 showsa circular pattern, its contours, and the center of massfor each contour. To verify if the mass center pointsare inside the shape, OpenCV’s pointPolygonTest [31]function determines whether the point is inside a contour,outside, or if it lies on an edge. It returns +1 if inside, −1if outside, or 0 if on an edge. Considering figure 8a anddiscarding the contours whose center of mass if outsidethe contour, the outcome is shown in figure 8b.
(a) Circular pattern (b) Screened circles
Fig. 8: Detection of center of mass and circle screening ina circular patterned image.
Despite of losing the external circles of the originalimage 8a, and consequently decreasing the expectableinduced risk, this approach aims to avoid contours thatcould trigger false circle detections, even at the cost oflosing some accuracy in the risk estimation.
MAY 2015 7
Another characteristic of circular shapes is the ab-sence of vertices. Polygonal shapes of specific geometriescan deteriorate a satisfactory circle detection. OpenCV’sapproxPolyDP [32] function approximates a curve or apolygon with another curve/polygon with less verticesso that the distance between vertices is less or equalto an specified precision, ε - parameter specifying theapproximation accuracy that is the maximum distancebetween the original curve and the approximation madeby the function. ApproxPolyDP uses the Douglas-Peuckeralgorithm [33]. If the found contour is circular it it willhave a huge number of edges. This verification will discardonly contours with a small number of edges, as a circularshape, according to the precision of the approxPolyDPwill have, for sure, a considerable amount of edges. There-fore, after testing, it was considered that the shapes shouldhave more than 10 edges; the precision value that, alongthe course of simulations, achieved the best results wasε = 0.02.
B. Isolation of Pattern RegionsThe line screening, performed in section V-A, is not
enough by itself to define a pattern. With all the linegroups gathered, each line group is a probable structureof a pattern. In order to apply the connected componentsfunction to each line group, OpenCV provides the Con-vexHull [34] function, that gathers a point set and findsits convex hull.
The convex hull of a polygon P is the smallest-areaconvex polygon which encloses P. Informally, it is theshape of a rubber-band stretched around P. The convexhull of a convex polygon P is P itself. Figure 9 shows theoutput generated by the OpenCV ConvexHull function,when applied to an image with 2 striped patterns.
(a) Original image (b) Detected segments
(c) Isolated region of big-ger pattern
(d) Isolated region ofsmaller pattern
Fig. 9: Isolation of pattern region through convexHullfunction.
With the pattern’s regions determined according toeach set of lines, the region is extracted from the originalimage. In the defined region, the mask will preserve theimage original pixel values.
C. Extracted Pattern AnalysisHaving the pattern area isolated, its risk is then evalu-
ated. Since the patterns have periodic variations of lumi-nance - components of bright luminance and components
of dark luminance - along the stripes or circles, OpenCV’sconnectedComponents [26] function isolates componentswith the same luminance and retrieves data about thecomponents: number, area and average luminance. Thisdata will allow to estimate the risk of the detected pattern.
Fig. 10: Diagram of the procedures applied to achieve theconnected components a pattern.
OpenCV’s connectedComponents [26] function analysesthe image pixel-by-pixel (from top to bottom and left toright) in order to identify connected pixel regions, i.e.,regions of adjacent pixels which share the same set ofintensity values. The function receives as input a binaryor graylevel image and a measure of connectivity. For thefollowing explanation, a binary image is assumed with 8way connectivity.
Connected components labeling works by scanning animage, pixel-by-pixel (from top to bottom and left toright) in order to identify connected pixel regions, i.e.,regions of adjacent pixels which share the same set ofintensity values V. For a binary image V=0 or 1; for agraylevel image, V may take a range of values. For thecase of binary images, the connected components labelingoperator scans the image by moving along a row untilit comes to a point P (where P denotes the pixel to belabeled at any stage in the scanning process) for whichV=1. Then, it examines the four neighbours of P whichhave already been scanned. The labelling of P occurs asfollows:
1) if all four neighbours are 0, assign a new label to P,2) if only one neighbour has V=1, assign its label to P,
else3) if more than one of the neighbours have V=1, and
they have different labels, assign one of the labels toP and make a note of the equivalences.
After completing the scan, the equivalent label pairsare sorted into equivalence classes and a unique label is as-signed to each class. As a final step, a second scan is madethrough the image, during which each label is replacedby the label assigned to its equivalence classes.With con-nectedComponents function it is possible to easily obtainrelevant information of the component, such as:• area of the component, areaCOMP ;• averaged luminance of the component,averageYCOMP .
The first step is to generate a binary image of the ex-tracted region derived from section V-B. Considering thatthis works aims to detect patterns with bright and darkstripes (2 opposed luminance values), i.e., patterns thathave notorious luminance transitions, two binary imagesare generated. One represents the components with highpixel values or positive components, positivecomp, andthe other the low pixel values or negative components,negativecomp. The generation of 2 images permits that theconnectedComponents function is used without any mod-ification to the source code of the function provided byOpenCV. In order to create the referred binary images anOtsu’s [27] thresholding operation is performed. ThroughOtsu’s method, a threshold th is computed, which is
MAY 2015 8
the value of luminance that maximizes the separabilitybetween higher and lower values of luminance on theregion of interest:• Positive Components - pixel with luminance val-
ues above th.• Negative Components - pixel with luminance val-
ues below th.Each one of the resulting images is then eroded in order
to smooth transitions between pixels borders. Erosion canbe applied several times. In case of multi-channel images,each channel is processed independently. The erosion isdone by using a structuring element that determines theshape of a pixel neighbourhood over which the minimumis taken.
The structuring element used for erosion has a shape ofa cross, with a kernel of size 3. This option was the onethat achieved better results.
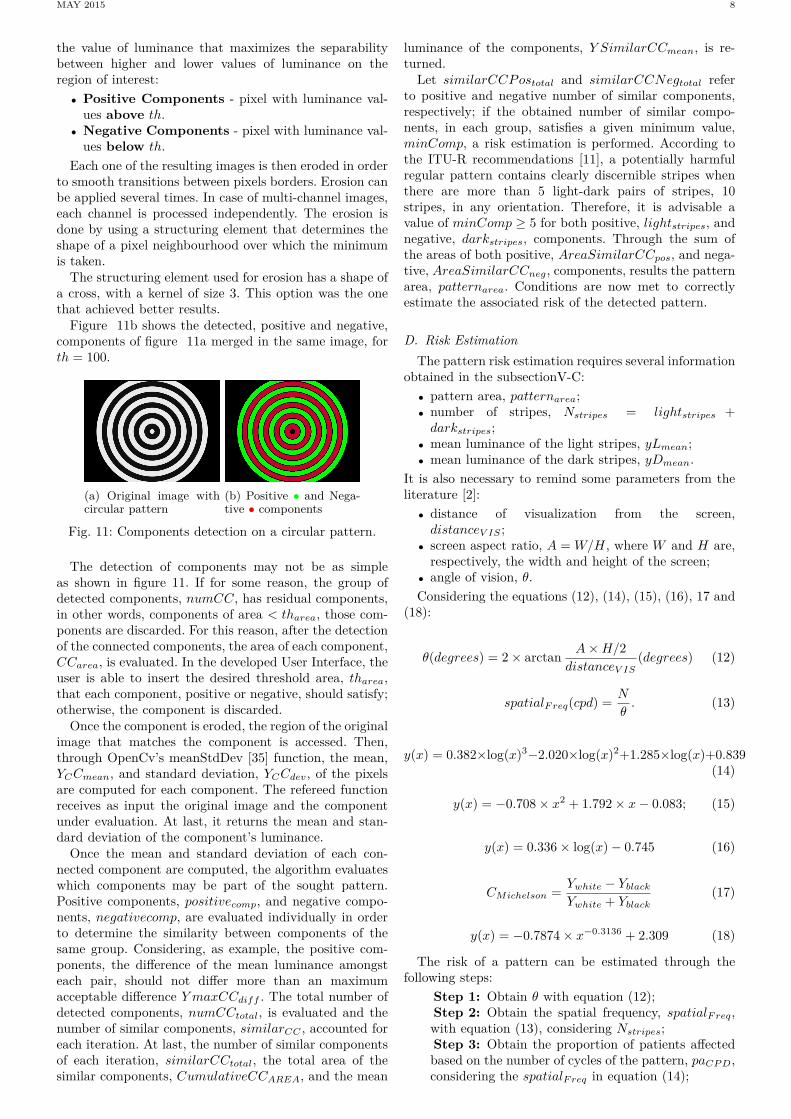
Figure 11b shows the detected, positive and negative,components of figure 11a merged in the same image, forth = 100.
(a) Original image withcircular pattern
(b) Positive • and Nega-tive • components
Fig. 11: Components detection on a circular pattern.
The detection of components may not be as simpleas shown in figure 11. If for some reason, the group ofdetected components, numCC, has residual components,in other words, components of area < tharea, those com-ponents are discarded. For this reason, after the detectionof the connected components, the area of each component,CCarea, is evaluated. In the developed User Interface, theuser is able to insert the desired threshold area, tharea,that each component, positive or negative, should satisfy;otherwise, the component is discarded.
Once the component is eroded, the region of the originalimage that matches the component is accessed. Then,through OpenCv’s meanStdDev [35] function, the mean,YCCmean, and standard deviation, YCCdev, of the pixelsare computed for each component. The refereed functionreceives as input the original image and the componentunder evaluation. At last, it returns the mean and stan-dard deviation of the component’s luminance.
Once the mean and standard deviation of each con-nected component are computed, the algorithm evaluateswhich components may be part of the sought pattern.Positive components, positivecomp, and negative compo-nents, negativecomp, are evaluated individually in orderto determine the similarity between components of thesame group. Considering, as example, the positive com-ponents, the difference of the mean luminance amongsteach pair, should not differ more than an maximumacceptable difference Y maxCCdiff . The total number ofdetected components, numCCtotal, is evaluated and thenumber of similar components, similarCC , accounted foreach iteration. At last, the number of similar componentsof each iteration, similarCCtotal, the total area of thesimilar components, CumulativeCCAREA, and the mean
luminance of the components, Y SimilarCCmean, is re-turned.
Let similarCCPostotal and similarCCNegtotal referto positive and negative number of similar components,respectively; if the obtained number of similar compo-nents, in each group, satisfies a given minimum value,minComp, a risk estimation is performed. According tothe ITU-R recommendations [11], a potentially harmfulregular pattern contains clearly discernible stripes whenthere are more than 5 light-dark pairs of stripes, 10stripes, in any orientation. Therefore, it is advisable avalue of minComp ≥ 5 for both positive, lightstripes, andnegative, darkstripes, components. Through the sum ofthe areas of both positive, AreaSimilarCCpos, and nega-tive, AreaSimilarCCneg, components, results the patternarea, patternarea. Conditions are now met to correctlyestimate the associated risk of the detected pattern.
D. Risk EstimationThe pattern risk estimation requires several information
obtained in the subsectionV-C:• pattern area, patternarea;• number of stripes, Nstripes = lightstripes +darkstripes;
• mean luminance of the light stripes, yLmean;• mean luminance of the dark stripes, yDmean.
It is also necessary to remind some parameters from theliterature [2]:• distance of visualization from the screen,distanceV IS ;
• screen aspect ratio, A = W/H, where W and H are,respectively, the width and height of the screen;
• angle of vision, θ.Considering the equations (12), (14), (15), (16), 17 and
The risk of a pattern can be estimated through thefollowing steps:
Step 1: Obtain θ with equation (12);Step 2: Obtain the spatial frequency, spatialFreq,with equation (13), considering Nstripes;Step 3: Obtain the proportion of patients affectedbased on the number of cycles of the pattern, paCPD,considering the spatialFreq in equation (14);
MAY 2015 9
Step 4: Obtain the proportion of patients affectedas function of the area of the pattern, paAREA,considering patternarea in equation (15);Step 5: Combining Steps 3 and 4, by multiplica-tion, the risk associated to the pattern area is givenby, riskAREA = paCPD × paAREA;Step 6: Considering yLmean and yDmean, theMichelson contrast is computed with equation (17),and the associated risk is estimated with equation(18), riskMICHELSON ;Step 7: Obtain the risk associated to the spaceaveraged luminance of the pattern, riskY avg, withequation (16;Step 8: Combining the proportion at risk, result-ing from the average luminance and contrast, ofthe pattern results in the following risk estimation:riskLumaContrast = riskMICHELSON × riskY avg;Step 9: Assuming that all the computed risks areindependent, the final risk is obtained by combining,by multiplication, riskAREA and riskLumaContrast :RiskFINAL = riskAREA × riskLumaContrast.
Once the characteristics of the patterns are independentin what concerns risk estimation, the independent risksare combined by multiplication in to final global risk.
E. Results and CommentsThe algorithm for pattern detection was tested with two
generated and one real, video sequences:Pattern Sequence 1: Generated video sequence,
with 5 striped patterns and 2 circular patterns.Pattern Sequence 2: Generated video sequence,
with 3 striped patterns inserted in a noisybackground and 2 circular patterns.
Pattern Sequence 3: Real video sequence with 22seconds, with striped patterns inserted in the middleof the video sequence.
More detailed information about the tested video se-quences is presented on table III.
PatternSequence #Frames Striped
PatternsCircularPatterns
Area of thePatterns
1 7 1 to 5 6 to 7 100%2 200 1 to 129 130 to 200 25% to 100%3 669 121 to 133 none 100%
TABLE III: Detailed information about the tested pat-terned video sequences.
The comparison between the estimated risk and thealgorithm’s computed risk for specific frames can be ob-served on table IV.
TABLE IV: Comparison between the estimated risk andthe algorithm’s computed risk for some frames of thetested video sequences.
The values of the computed risk for the different frames,shown in table IV, present small differences when com-pared to the estimated risk values (calculated concerning
pattern properties). The program is able to correctly iden-tify the different patterns displayed in the video sequences,since the patterns are not inserted in a noisy environment(as shown in the discrepancy of the computed risk of frame87 from video sequence 2).
VI. Graphical User InterfaceThe GUI was developed on Qt Creator 5.3 framework,
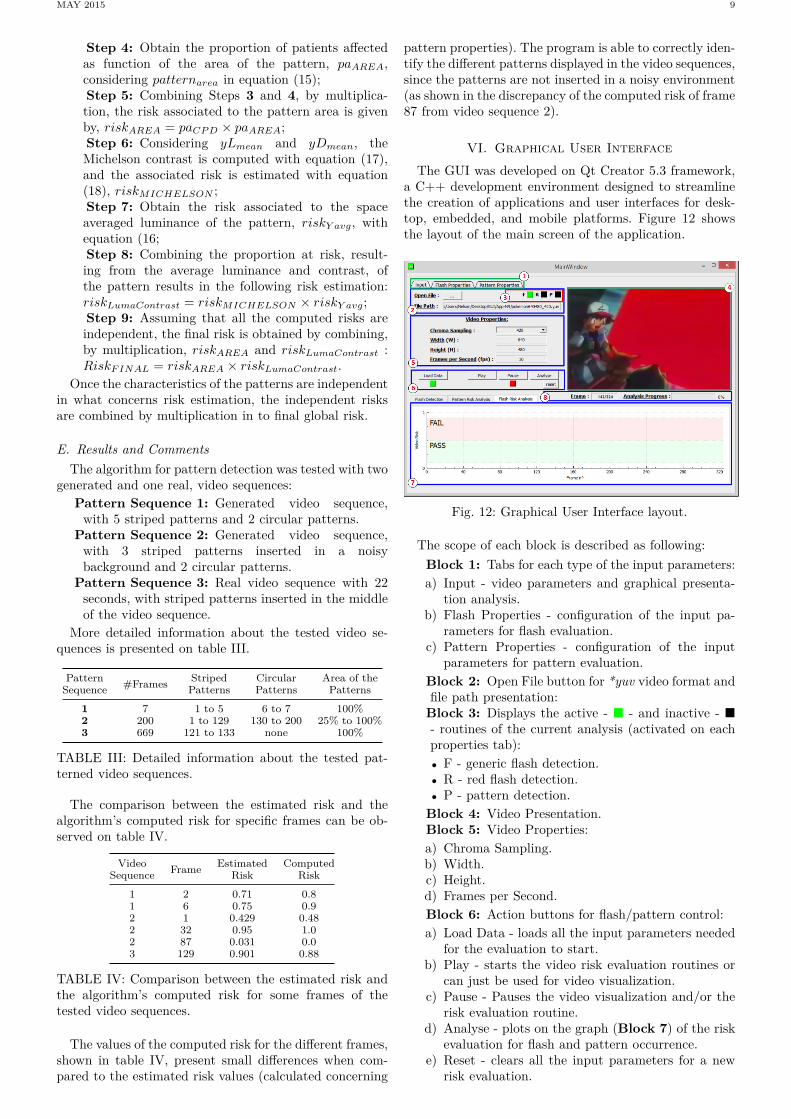
a C++ development environment designed to streamlinethe creation of applications and user interfaces for desk-top, embedded, and mobile platforms. Figure 12 showsthe layout of the main screen of the application.
Fig. 12: Graphical User Interface layout.
The scope of each block is described as following:Block 1: Tabs for each type of the input parameters:a) Input - video parameters and graphical presenta-
tion analysis.b) Flash Properties - configuration of the input pa-
rameters for flash evaluation.c) Pattern Properties - configuration of the input
parameters for pattern evaluation.Block 2: Open File button for *yuv video format andfile path presentation:
Block 3: Displays the active - � - and inactive - �- routines of the current analysis (activated on eachproperties tab):• F - generic flash detection.• R - red flash detection.• P - pattern detection.
Block 4: Video Presentation.Block 5: Video Properties:a) Chroma Sampling.b) Width.c) Height.d) Frames per Second.Block 6: Action buttons for flash/pattern control:a) Load Data - loads all the input parameters needed
for the evaluation to start.b) Play - starts the video risk evaluation routines or
can just be used for video visualization.c) Pause - Pauses the video visualization and/or the
risk evaluation routine.d) Analyse - plots on the graph (Block 7) of the risk
evaluation for flash and pattern occurrence.e) Reset - clears all the input parameters for a new
risk evaluation.
MAY 2015 10
Block 7: Graphical presentation of the estimatedrisk and regulatory compliance:
a) Flash Detection - displays generic flash and redflash occurrence.
b) Pattern Risk Analysis - displays the risk of thedetected patterns: stripped � or circular �.
c) Flash Risk Analysis - displays the flash risk anal-ysis in compliance with the input flash propertiesparameters.
Block 8: Displays the current visualized frame andthe analysis progress (if activated).
Besides the input parameters for a correct video decod-ing (Block 5), the parameters of the Flash Properties andPattern Properties tabs have extreme importance for anaccurate the video analysis.
VII. ConclusionsThis paper purposes an automatic system to detect
video content potentially harmful to people who are proneto Photosensitive Epilepsy.
The developed algorithm for flash detection, detectsflash sequences concerning the changes in luminance alongthe video sequence and the flash frequency. It was also im-plemented a routine to identify the occurrence of harmfulcolors in the image, such as saturated red. The solutionshowed credible results for the tested video sequences;the main noticed constraint relies on the fact that thealgorithm does not analyse the video in real-time, whichis a factor that needs future improvements.
The developed algorithm for pattern detection hasnotorious constraints in the detection. Since there arenumerous types of patterned images, it was aimed todetect only a few set of striped and circular patterns,which are considered the most harmful patterns type.The whole procedure was developed in accordance to theexisting recommendations [11], which resulted from theclinical studies described in section II. The algorithm canevaluate videos in real time, a improvement in comparisonwith the flash detection algorithm.
The graphical user interface, described in section VI,presents a friendly interface that allows the user to defineall the required input parameters. The GUI is able toevaluate videos of different dimensions, chroma samplingsand frame rates. However, there is a need of improvementin what concerns memory efficiency.
Photosensitive epilepsy is a disease that requires atten-tion and should not be neglected. Although in Portugalthere are no reported PSE related incidents, the factthat none of the international guidelines [12] [11] areapplied, should be alarming. The release of the developedapplication, like others with a similar scope, would enablebroadcasters and content providers to evaluate the riskof the digital video content that people (and in particu-lar, children) watch. This will provide, in what concernsharmful video content, awareness and the improvement ofthe quality of the broadcasted video content, and of theviewers quality of experience (QoE).
References[1] Binnie CD., Emmett J., Gardiner P., “Characterising the flash-
ing television images that precipitate seizures”, SMPTE, vol.111, pp. 32-39, 2002.
[2] Wilkins AJ., Emmett J., Harding GFA., “Characterizing thePatterned Images That Precipitate Seizures and OptimizingGuidelines To Prevent Them”, Epilepsia, vol. 46, pp. 1212-1218,2005.
[3] Harding GFA., Fylan F., “Two visual mechanisms of Photosen-sitivity”, Epilepsia, vol. 40, pp. 1446-1451, 1999.
[4] Fisher R., Harding GFA, Erba G, Barkley GL, Wilkins AJ,“Photic- and pattern-induced seizures: a Review for the EpilepsyFoundation of America Working Group”, Epilepsia, vol. 46(9),pp. 1426-1441, 2005.
[11] “Harm and Offence”, Ofcom Broadcasting Code, pp. 14-15,2012.
[12] “Guidance for the reduction of photosensitive epilepticseizures caused by television”, Recommendation ITU-R BT.1702Geneva, International Telecommunication Union, 2005.
[13] Methodology for the subjective assessment of the quality oftelevision pictures, In: Recommendation ITU-R BT. 500 Geneva,International Telecommunication Union: 2002.
[14] “Studio encoding parameters of digital television for standard4:3 and wide-screen 16:9 aspect ratios”, Recommendation ITU-RBT. 601 Geneva, International Telecommunication Union, 2011.
[15] Rodrigues N., Queluz MP.,“Automatic Detection of Epilepto-genic Video Content”, Instituto Superior Tecnico, 2015.
[28] Rafael Grompone von Gioi, Jeremie Jakubowicz, Jean-MichelMorel, and Gregory Randall, “LSD: a Line Segment Detec-tor - Image Processing On Line”, vol. 2, pp. 35-55, 2012,URL: http://dx.doi.org/10.5201/ipol.2012.gjmr-lsd visited on10/2014.
[29] FindContours, OpenCV, URL:http://tinyurl.com/bwzf2o9,visited on 10/2014.