33
May 2015 – August 2015 Brady Corporation Investor Presentation
| Date post: | 26-Dec-2015 |
| Category: |
Documents |
| Upload: | merryl-chapman |
| View: | 215 times |
| Download: | 2 times |
May 2015 – August 2015
Brady CorporationInvestor Presentation
2Forward-Looking StatementsIn this presentation, statements that are not reported financial results or other historic information are “forward-looking statements.” These forward-looking statements relate to, among other things, the Company's future financial position, business strategy, targets, projected sales, costs, earnings, capital expenditures, debt levels and cash flows, and plans and objectives of management for future operations.
The use of words such as “may,” “will,” “expect,” “intend,” “estimate,” “anticipate,” “believe,” “should,” “project” or “plan” or similar terminology are generally intended to identify forward-looking statements. These forward-looking statements by their nature address matters that are, to different degrees, uncertain and are subject to risks, assumptions, and other factors, some of which are beyond Brady's control, that could cause actual results to differ materially from those expressed or implied by such forward-looking statements. For Brady, uncertainties arise from: implementation of the healthcare strategy; implementation of the Workplace Safety strategy; future competition; risks associated with restructuring plans; future financial performance of major markets Brady serves, which include, without limitation, telecommunications, hard disk drive, manufacturing, electrical, construction, laboratory, education, governmental, public utility, computer, healthcare and transportation; technology changes and potential security violations to the Company's information technology system; fluctuations in currency rates versus the U.S. dollar; risks associated with international operations; difficulties associated with exports; Brady's ability to develop and successfully market new products; risks associated with identifying, completing, and integrating acquisitions; changes in the supply of, or price for, parts and components; increased price pressure from suppliers and customers; Brady's ability to retain significant contracts and customers; risk associated with loss of key talent; risks associated with divestitures and businesses held for sale; risks associated with obtaining governmental approvals and maintaining regulatory compliance; risk associated with product liability claims; environmental, health and safety compliance costs and liabilities; potential write-offs of Brady's substantial intangible assets; risks associated with our ownership structure; unforeseen tax consequences; Brady's ability to maintain compliance with its debt covenants; increase in our level of debt; and numerous other matters of national, regional and global scale, including those of a political, economic, business, competitive, and regulatory nature contained from time to time in Brady's U.S. Securities and Exchange Commission filings, including, but not limited to, those factors listed in the “Risk Factors” section within Item 1A of Part I of Brady’s Form 10-K for the year ended July 31, 2014.
These uncertainties may cause Brady's actual future results to be materially different than those expressed in its forward-looking statements. Brady does not undertake to update its forward-looking statements except as required by law.
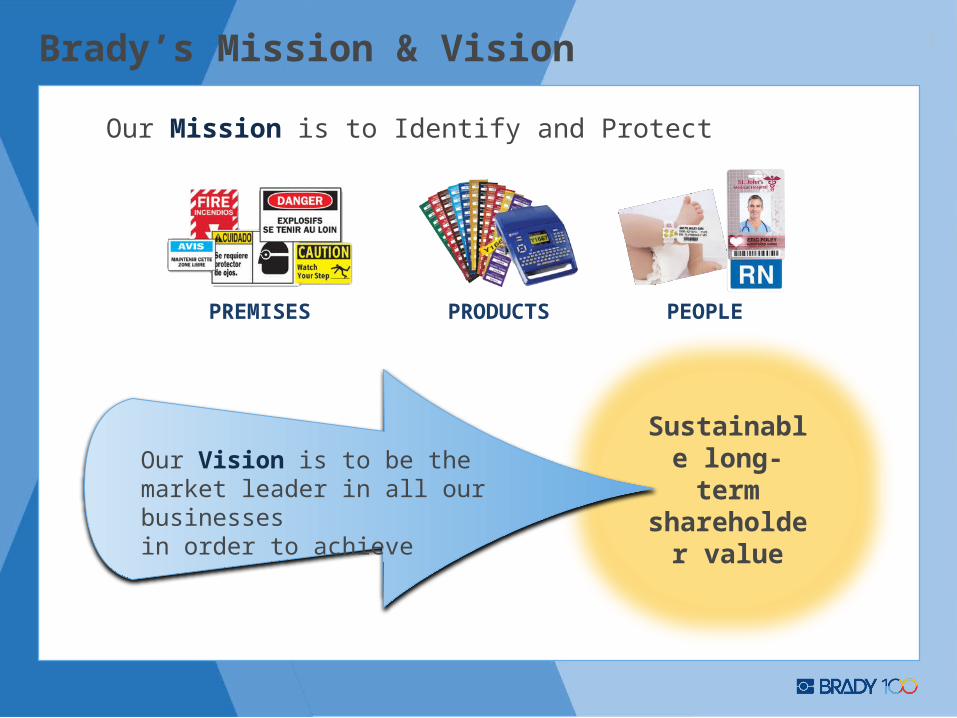
3Brady’s Mission & Vision
Sustainable long-term
shareholder value
Our Mission is to Identify and Protect
Our Vision is to be the market leader in all our businessesin order to achieve
PREMISES PRODUCTS PEOPLE
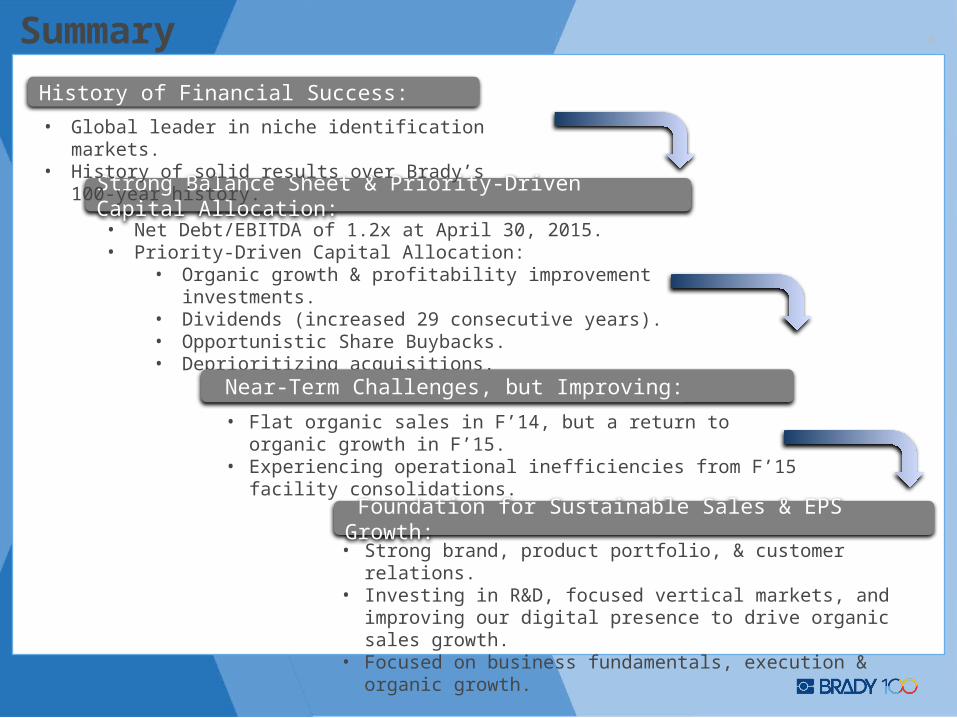
4Summary
Strong Balance Sheet & Priority-Driven Capital Allocation:
• Global leader in niche identification markets.• History of solid results over Brady’s 100-year history.
• Net Debt/EBITDA of 1.2x at April 30, 2015.• Priority-Driven Capital Allocation:
• Organic growth & profitability improvement investments.• Dividends (increased 29 consecutive years).• Opportunistic Share Buybacks. • Deprioritizing acquisitions.
• Flat organic sales in F’14, but a return to organic growth in F’15.• Experiencing operational inefficiencies from F’15 facility
consolidations.
History of Financial Success:
• Strong brand, product portfolio, & customer relations.• Investing in R&D, focused vertical markets, and improving our
digital presence to drive organic sales growth.• Focused on business fundamentals, execution & organic growth.
Foundation for Sustainable Sales & EPS Growth:
Near-Term Challenges, but Improving:

5
Products:• Vast offering of workplace safety
products (signs, tags, labels, safety equip, etc.).
Primary Brands:• Seton, Emed, Signals,
Securimed, Transposafe.
Primary Channels:• Primarily direct through Catalog,
Internet, Telesales.
Geographic Presence: • Approx. 2/3 of sales
in Western Europe &
Australia.
Workplace Safety (approx. 1/3 of sales)
Products:• Safety & Facility ID• Wire ID• Product ID• People ID• Healthcare ID.
Primary Brands: • Brady and PDC.
Primary Channels: • Distrib. & GPOs. = 70%,
remainder = Direct.
Geographic Presence: • Approx. 2/3 of sales
in U.S. and Canada.
Identification Solutions (approx. 2/3 of sales)
Brady’s Global Platforms
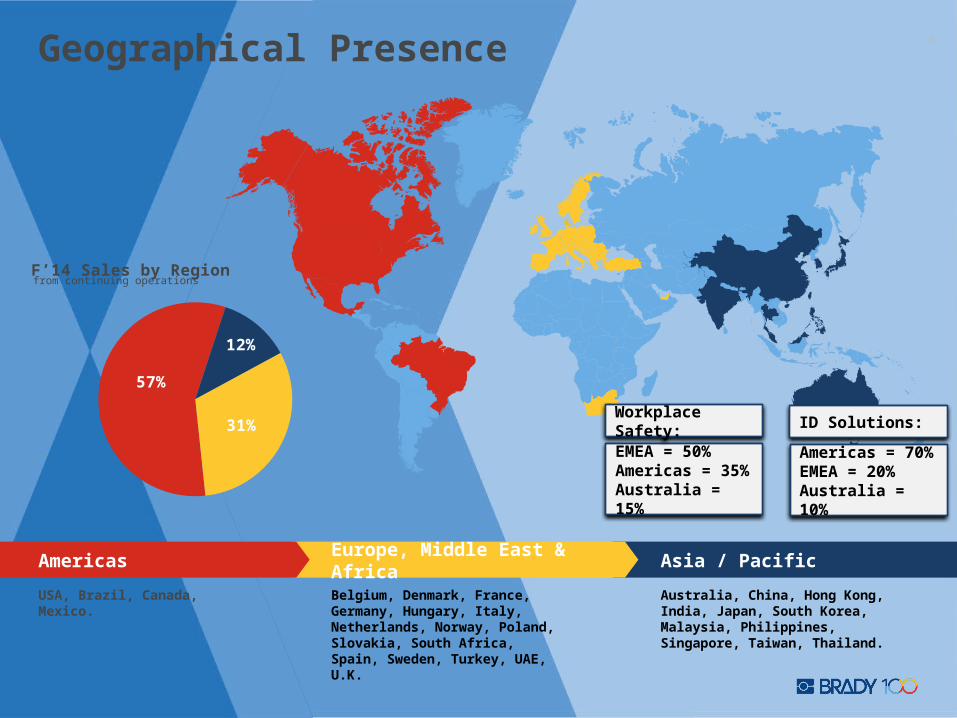
6Geographical Presence
Asia / Pacific
Australia, China, Hong Kong, India, Japan, South Korea, Malaysia, Philippines, Singapore, Taiwan, Thailand.
Europe, Middle East & Africa
Belgium, Denmark, France, Germany, Hungary, Italy, Netherlands, Norway, Poland, Slovakia, South Africa, Spain, Sweden, Turkey, UAE, U.K.
USA, Brazil, Canada, Mexico.
Americas
57%
12%
31%
F’14 Sales by Regionfrom continuing operations
EMEA = 50%Americas = 35%Australia = 15%
Workplace Safety:
Americas = 70%EMEA = 20%Australia = 10%
ID Solutions:

7
• Digital Capabilities to drive On-line growth.
• Enhance Industry and Compliance Expertise for Workplace Safety critical Industries
• Product Expansion focused on Customized Proprietary Products
• Pricing & Analytics.
Workplace Safety
• Focused Market Expansion
• Strategic Accounts
• Emerging Geographies
• Increased Investments in Innovative New Products.
Identification Solutions
Investing for Organic Growth
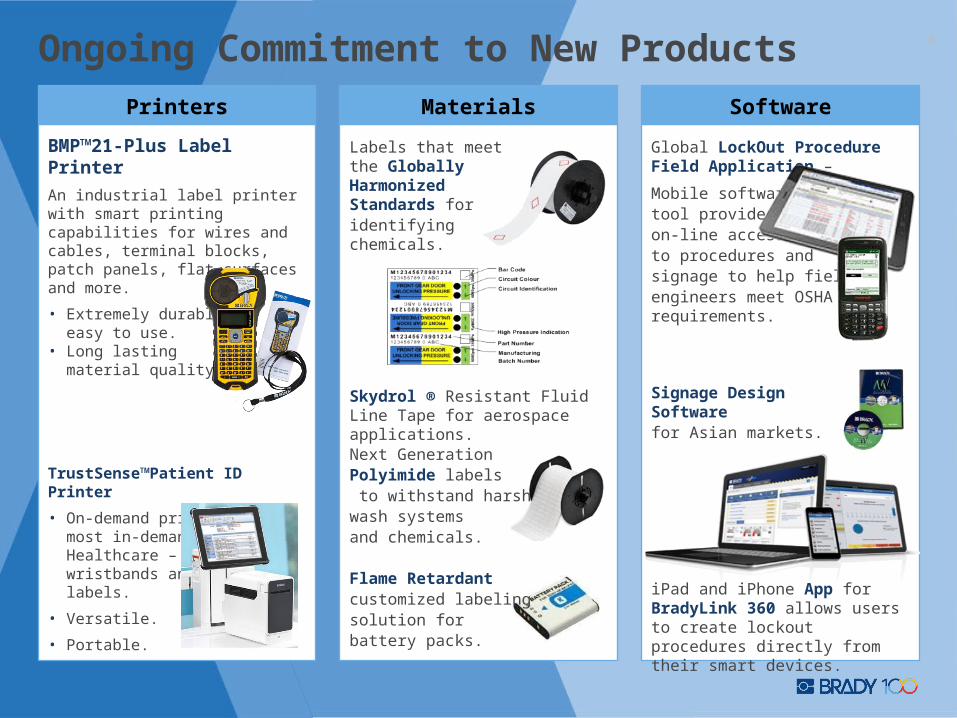
8Ongoing Commitment to New Products
SoftwareMaterials
BMP™21-Plus Label Printer
An industrial label printer with smart printing capabilities for wires and cables, terminal blocks, patch panels, flat surfaces and more.
• Extremely durable & easy to use.
• Long lasting material quality.
TrustSense™Patient ID Printer
• On-demand printing of the most in-demand media in Healthcare – patient wristbands and medical labels.
• Versatile.
• Portable.
Printers
Labels that meet the Globally Harmonized Standards foridentifying chemicals.
Skydrol ® Resistant Fluid Line Tape for aerospace applications.
Next Generation Polyimide labels to withstand harshwash systems and chemicals.
Flame Retardant customized labeling solution for battery packs.
Global LockOut Procedure Field Application –
Mobile software tool provides on-line accessto procedures andsignage to help field engineers meet OSHA requirements.
Signage Design Software for Asian markets.
iPad and iPhone App for BradyLink 360 allows users to create lockout procedures directly from their smart devices.
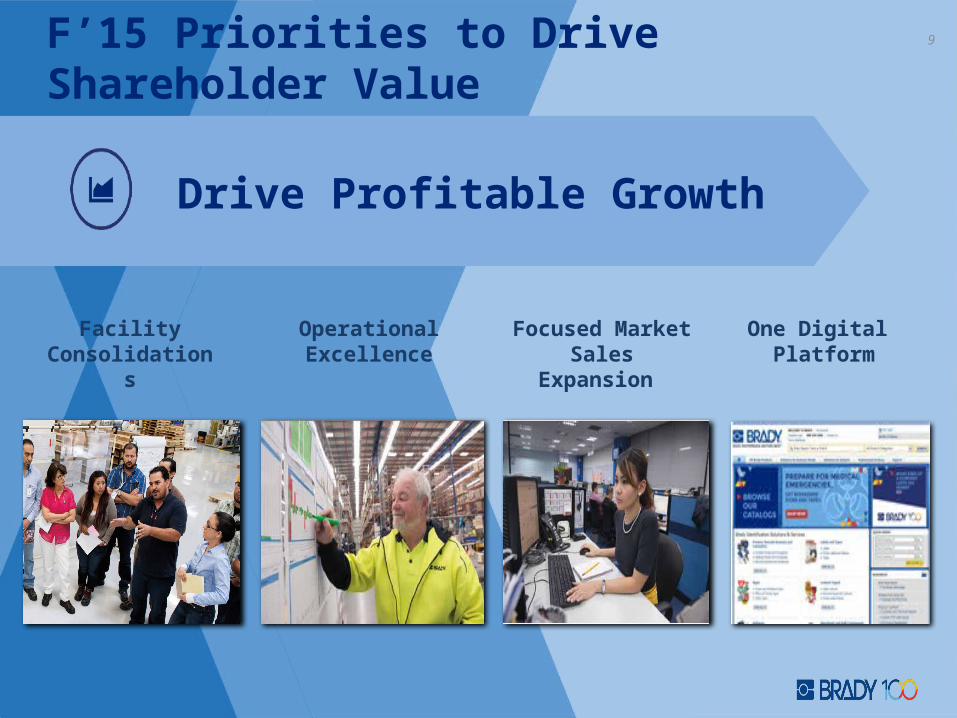
F’15 Priorities to Drive Shareholder Value
Drive Profitable Growth
One Digital Platform
Facility Consolidations
Operational Excellence
Focused Market Sales Expansion
9
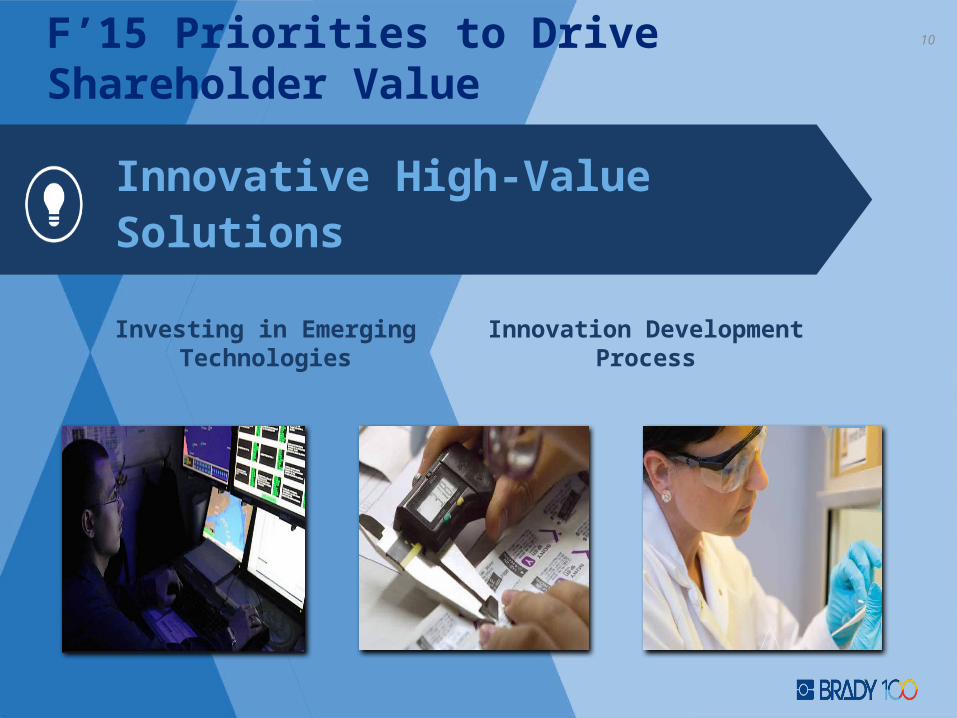
F’15 Priorities to Drive Shareholder Value
Innovative High-Value Solutions
Investing in Emerging Technologies
Innovation Development Process
10

11Priority-Driven Capital Allocation
1st Reinvest in the Business:• Drive sustainable growth.
• Develop innovative new products that create value for our customers.
• Deliver unrivaled customer service and operational excellence.
2nd Dividends:• Committed to consistently returning capital to
shareholders.
• 29 consecutive years of dividend increases.
3rd Share Buybacks & Acquisitions:• Opportunistic/nimble share buybacks as a return of
cash to our shareholders.
• Acquisitions that fit strategically. We do not anticipate significant acquisitions in the near-term.
• Invested $180M in R&D over last 5 years
• Investing an incremental $10M in R&D and focused market sales expansions in F’15 compared to F’14.
• Paid $193M in dividends over last 5 years
• Approx. $40M to be paid in dividends for F’15.
Last 5 years:
• Purchased $88M of stock.
• Acquired companies for $377M.

12
Financial Overview
13Q3 F’15 Financial Summary
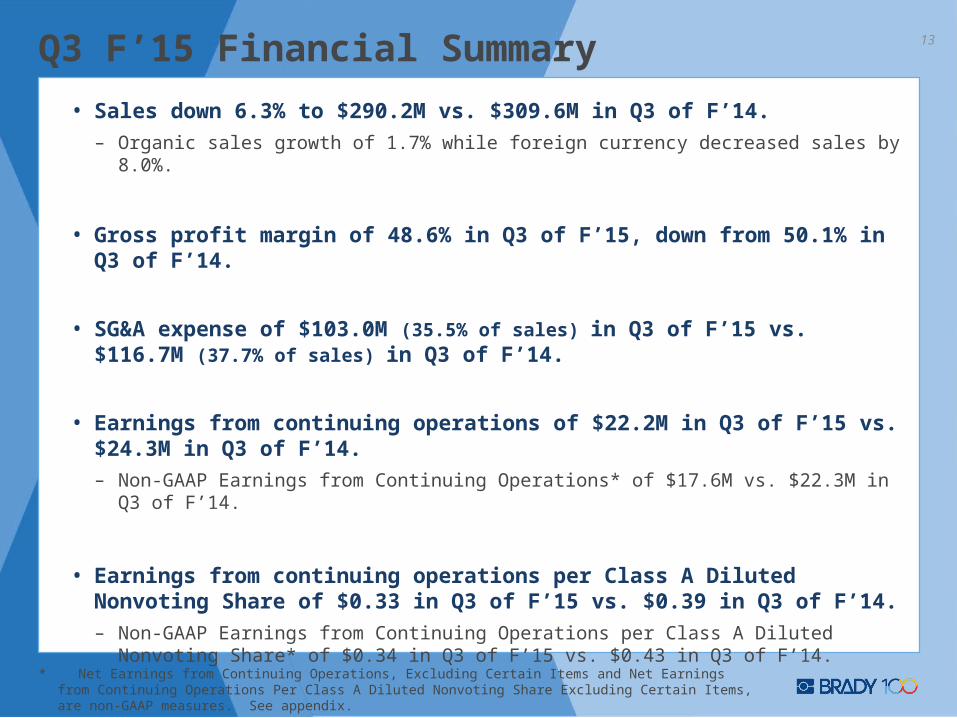
• Sales down 6.3% to $290.2M vs. $309.6M in Q3 of F’14.
– Organic sales growth of 1.7% while foreign currency decreased sales by 8.0%.
• Gross profit margin of 48.6% in Q3 of F’15, down from 50.1% in Q3 of F’14.
• SG&A expense of $103.0M (35.5% of sales) in Q3 of F’15 vs. $116.7M (37.7% of sales) in Q3 of F’14.
• Earnings from continuing operations of $22.2M in Q3 of F’15 vs. $24.3M in Q3 of F’14.
– Non-GAAP Earnings from Continuing Operations* of $17.6M vs. $22.3M in Q3 of F’14.
• Earnings from continuing operations per Class A Diluted Nonvoting Share of $0.33 in Q3 of F’15 vs. $0.39 in Q3 of F’14.
– Non-GAAP Earnings from Continuing Operations per Class A Diluted Nonvoting Share* of $0.34 in Q3 of F’15 vs. $0.43 in Q3 of F’14.
* Net Earnings from Continuing Operations, Excluding Certain Items and Net Earnings from Continuing Operations Per Class A Diluted Nonvoting Share Excluding Certain Items, are non-GAAP measures. See appendix.

14Quarterly Sales
• 1.7% organic sales growth:
• ID Solutions – Organic sales growth of 3.0%.
• Workplace Safety – Organic sales decline of 1.1%.
• 8.0% decrease due to currency translation.
Q3 F’15 SALES:
• Organic growth continues in the IDS platform while there was a slight decline in the WPS platform.
• The strengthening of the U.S. dollar is having a significant impact on reported sales.
Q3 F’15 SALES COMMENTARY:
Q4 F'12 Q1 F'13 Q2 F'13 Q3 F'13 Q4 F'13 Q1 F'14 Q2 F'14 Q3 F'14 Q4 F'14 Q1 F'15 Q2 F'15 Q3 F'15
1.9% (0.8%) (1.8%) (4.8%) (2.1%) (2.1%) (1.1%) 2.5% 1.1% 2.4%1.4% 1.7%
$200
$225
$250
$275
$300
$325
Organic Sales Growth
SALES (millions of USD)
Quarterly GPM & SG&A Expense 15
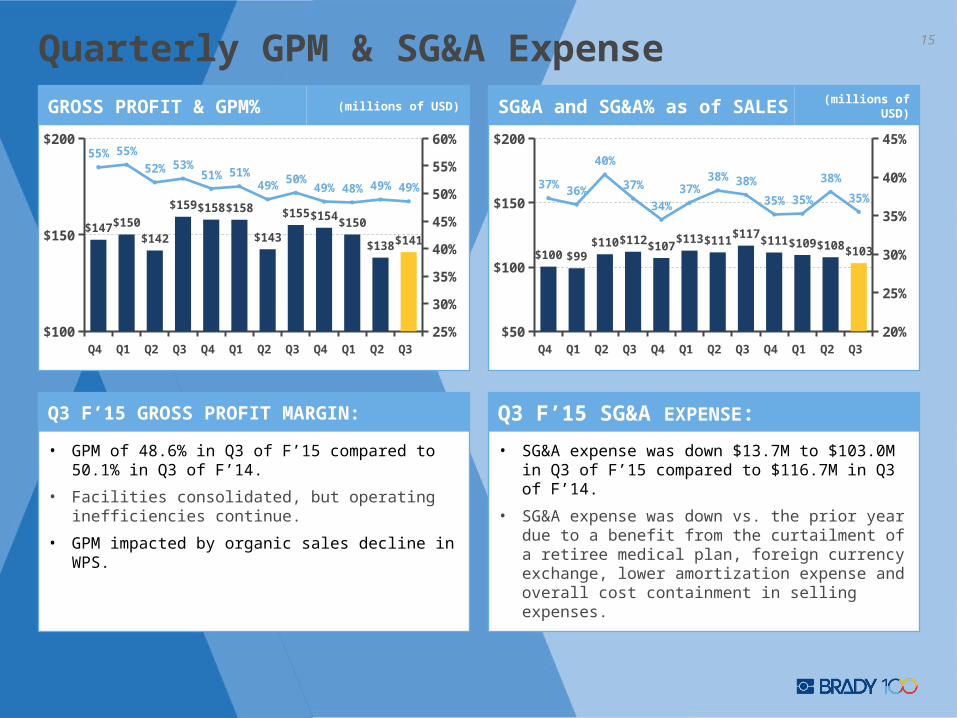
• GPM of 48.6% in Q3 of F’15 compared to 50.1% in Q3 of F’14.
• Facilities consolidated, but operating inefficiencies continue.
• GPM impacted by organic sales decline in WPS.
Q3 F’15 GROSS PROFIT MARGIN:
• SG&A expense was down $13.7M to $103.0M in Q3 of F’15 compared to $116.7M in Q3 of F’14.
• SG&A expense was down vs. the prior year due to a benefit from the curtailment of a retiree medical plan, foreign currency exchange, lower amortization expense and overall cost containment in selling expenses.
Q3 F’15 SG&A EXPENSE:
Q4 F'12
Q1 F'13
Q2 F'13
Q3 F'13
Q4 F'13
Q1 F'14
Q2 F'14
Q3 F'14
Q4 F'14
Q1 F'15
Q2 F'15
Q3 F'15
$100
$150
$200
25%
30%
35%
40%
45%
50%
55%
60%
$147 $150$142
$159 $158 $158
$143
$155 $154$150
$138 $141
55% 55%
52% 53%51% 51%
49% 50%49% 48% 49% 49%
GROSS PROFIT & GPM% (millions of USD)
Q4 F'12
Q1 F'13
Q2 F'13
Q3 F'13
Q4 F'13
Q1 F'14
Q2 F'14
Q3 F'14
Q4 F'14
Q1 F'15
Q2 F'15
Q3 F'15
$50
$100
$150
$200
20%
25%
30%
35%
40%
45%
$100 $99$110 $112 $107
$113 $111$117
$111 $109 $108 $103
37% 36%
40%
37%
34%
37%38% 38%
35% 35%
38%
35%
SG&A and SG&A% as of SALES (millions of USD)

16Quarterly Net Earnings and EPS
* Non-GAAP Net Earnings from Continuing Operations and Non-GAAP Net Earnings from Continuing Operations Per Class A Diluted Nonvoting Share are non-GAAP measures. See appendix.
• Q3 F’15 Non-GAAP net earnings from continuing operations* were $17.6M compared to $22.3M in Q3 of F’14.
• Decrease in earnings driven by reduced gross profit margins in IDS, lack of organic growth in WPS, and foreign currency translation.
Q3 F’15 – Non-GAAP Earnings*
• Q3 F’15 Non-GAAP diluted EPS from continuing operations* was $0.34 compared to $0.43 in Q3 of F’14.
Q3 F’15 – Non-GAAP EPS*
Q4 F'12
Q1 F'13
Q2 F'13
Q3 F'13
Q4 F'13
Q1 F'14
Q2 F'14
Q3 F'14
Q4 F'14
Q1 F'15
Q2 F'15
Q3 F'15
$0.00
$0.20
$0.40
$0.60 $0.57$0.51
$0.38
$0.55 $0.55
$0.44
$0.25
$0.43 $0.41$0.36
$0.29$0.34
NET EARNINGS FROM CONTINUING OPERATIONS PER CLASS A DILUTED NONVOTING SHARE, EXCLUDING CERTAIN ITEMS*
Q4 F'12
Q1 F'13
Q2 F'13
Q3 F'13
Q4 F'13
Q1 F'14
Q2 F'14
Q3 F'14
Q4 F'14
Q1 F'15
Q2 F'15
Q3 F'15
$0
$10
$20
$30
$40
$30$26
$20
$29 $29
$23
$13
$22 $21$18
$15$18
NET EARNINGS FROM CONTINUING OPERATIONS, EXCLUDING CERTAIN ITEMS* (millions of USD)
17Global Platform Results (Sales & Segment Profit %)• Q 3 F ’15 organ ic sa les grow th o f 3 .0% .
• Facility conso lidation activ ities com pressed
segm ent m arg ins in F ’14 and F ’15.
• Experiencing operationa l ine ffic iencies in
recently conso lidated facilities.
• Increasing investm ents in R &D and focusing on
certa in m arkets to fue l grow th.
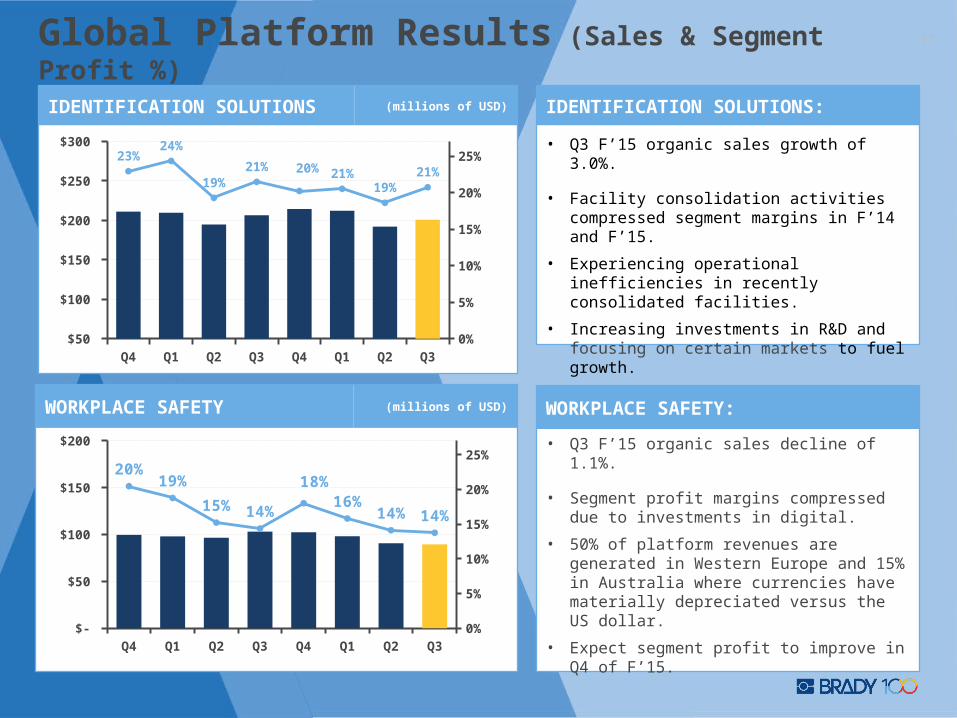
• Q3 F’15 organic sales growth of 3.0%.
• Facility consolidation activities compressed segment margins in F’14 and F’15.
• Experiencing operational inefficiencies in recently consolidated facilities.
• Increasing investments in R&D and focusing on certain markets to fuel growth.
IDENTIFICATION SOLUTIONS:
• Q 3 F ’15 organ ic sa les decline o f 1 .1% .
• Segm ent pro fit m arg ins com pressed due to
investm ents in d ig ita l.
• 50% of p la tform revenues are generated in
W estern Europe and 15% in Austra lia w here
currencies have m ateria lly deprecia ted versus
the U S do lla r.
• Expect segm ent pro fit to im prove in Q 4 o f F ’15.
• Q3 F’15 organic sales decline of 1.1%.
• Segment profit margins compressed due to investments in digital.
• 50% of platform revenues are generated in Western Europe and 15% in Australia where currencies have materially depreciated versus the US dollar.
• Expect segment profit to improve in Q4 of F’15.
WORKPLACE SAFETY:
IDENTIFICATION SOLUTIONS (millions of USD)
WORKPLACE SAFETY (millions of USD)
Q4F'13
Q1F'14
Q2F'14
Q3F'14
Q4F'14
Q1F'15
Q2F'15
Q3F'15
$50
$100
$150
$200
$250
$300
0%
5%
10%
15%
20%
25%23%24%
19%21% 20% 21%
19%21%
Q4F'13
Q1F'14
Q2F'14
Q3F'14
Q4F'14
Q1F'15
Q2F'15
Q3F'15
$-
$50
$100
$150
$200
0%
5%
10%
15%
20%
25%20%
19%
15% 14%
18%16%
14% 14%
18Cash Generation
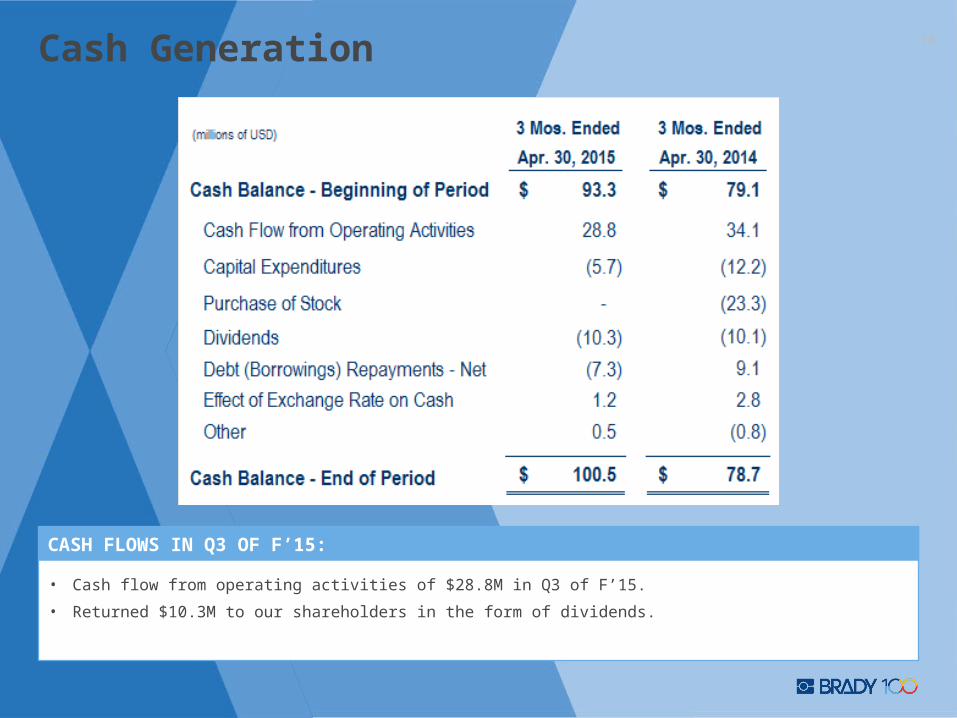
• Cash flow from operating activities of $28.8M in Q3 of F’15.
• Returned $10.3M to our shareholders in the form of dividends.
CASH FLOWS IN Q3 OF F’15:

Net Debt & EBITDA 19
Q4 F'12
Q1 F'13
Q2 F'13
Q3 F'13
Q4 F'13
Q1 F'14
Q2 F'14
Q3 F'14
Q4 F'14
Q1 F'15
Q2 F'15
Q3 F'15
0.0x
0.5x
1.0x
1.5x
0.10.0
1.41.3
1.2 1.2
1.3
1.5
1.2 1.21.2
1.2
NET DEBT / TTM EBITDA*
• April 30, 2015 Cash = $100.5M, Debt = $268.4M (net debt = $167.9M), and TTM EBITDA (continuing operations) = $144.4M.
• Net Debt/EBITDA* = 1.2:1.
• Balance sheet continues to improve and provides flexibility for future cash uses.
STRONG BALANCE SHEET:
* EBITDA is a non-GAAP measure. See appendix for the reconciliation of net income to EBITDA.
Q4 F'12
Q1 F'13
Q2 F'13
Q3 F'13
Q4 F'13
Q1 F'14
Q2 F'14
Q3 F'14
Q4 F'14
Q1 F'15
Q2 F'15
Q3 F'15
$0
$50
$100
$150
$200
$250
$300
$10$0
$297
$261
$222$210 $209
$221
$181 $174$184
$168
NET DEBT (millions of USD)

20Summary
Brady has underperformed, but we are setting the stage for improvement over the longer-term.
Near-Term Challenges, but Improving:• Flat organic sales in F’14, but a return to organic sales growth in F’15.
• Operational inefficiencies stemming from certain facilities that were consolidated in F’15.
Financial Position:• Global leader in niche identification markets.
• 100 year history of solid financial results.
• Solid balance sheet.
Focused on Driving Value:• Focused on business fundamentals and execution. Deprioritizing acquisitions.
• Priorities to Drive Shareholder Value:• Complete Facility Consolidation Activities.• Drive Operational Excellence.• Focused Market Sales Expansion.• Drive to One Digital Platform.• Investments in emerging technologies in R&D to drive innovative new products.

21Investor Relations
Brady Contact:
Ann Thornton
414-438-6887
See our web site at
www.investor.bradycorp.com

22
Appendix

23Revenue & Earnings Trends
* See appendix for reconciliation of non-GAAP measures.
F'10 F'11 F'12 F'13 F'14$500
$750
$1,000
$1,250
$996
$1,059 $1,072
$1,158
$1,225
SALES (millions of USD)
F'10 F'11 F'12 F'13 F'14$50
$75
$100
$125
$85
$111 $113
$102
$80
NON-GAAP NET EARNINGS FROM CONTINUING OPERATIONS* (millions of USD)

24GPM & SG&A Expense
F'10 F'11 F'12 F'13 F'1445.0%
50.0%
55.0%
60.0%
56.6%55.5% 55.2%
52.6%
49.8%
GROSS PROFIT MARGIN
F'10 F'11 F'12 F'13 F'1435.0%
36.0%
37.0%
38.0%
39.0%
40.0%39.4%
37.5%
36.7%37.1% 36.9%
SG&A as % of SALES
• Mix shift with full year of PDC acquisition results in F’14.
• Excess costs related to Facility Consolidations providing near-term challenges.
STRONG GPM:
• Opportunity for improvement.
• Facility consolidation and portfolio actions to streamline business and reduce SG&A.
SG&A EXPENSE:
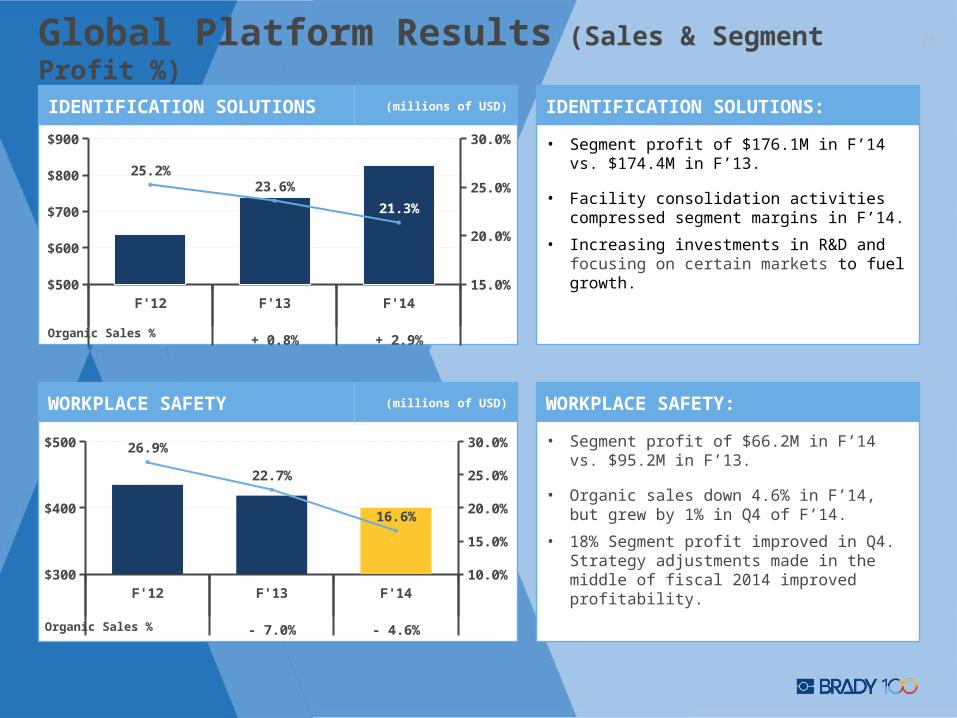
25Global Platform Results (Sales & Segment Profit %)• Segm ent pro fit o f $176.1M in F ’14 vs. $174.4M
in F ’13.
• Facility conso lidation activ ities com pressed
segm ent m arg ins in F ’14.
• Increasing investm ents in R &D and focusing on
certa in m arkets to fue l grow th.
• Segment profit of $176.1M in F’14 vs. $174.4M in F’13.
• Facility consolidation activities compressed segment margins in F’14.
• Increasing investments in R&D and focusing on certain markets to fuel growth.
IDENTIFICATION SOLUTIONS:
• Segm ent pro fit o f $66.2M in F ’14 vs. $95.2M in
F ’13 .
• O rgan ic sa les dow n 4.6% in F ’14, bu t grew by
1% in Q 4 o f F ’14 .
• 18% Segm ent pro fit im proved in Q 4. S tra tegy
ad justm ents m ade in the m idd le o f fisca l 2014
im proved pro fitab ility.
• Segment profit of $66.2M in F’14 vs. $95.2M in F’13.
• Organic sales down 4.6% in F’14, but grew by 1% in Q4 of F’14.
• 18% Segment profit improved in Q4. Strategy adjustments made in the middle of fiscal 2014 improved profitability.
WORKPLACE SAFETY:
F'12 F'13 F'14
+ 0.8% + 2.9%
$500
$600
$700
$800
$900
15.0%
20.0%
25.0%
30.0%
25.2%23.6%
21.3%
Organic Sales %
IDENTIFICATION SOLUTIONS (millions of USD)
F'12 F'13 F'14
- 7.0% - 4.6%
$300
$400
$500
10.0%
15.0%
20.0%
25.0%
30.0%26.9%
22.7%
16.6%
Organic Sales %
WORKPLACE SAFETY (millions of USD)
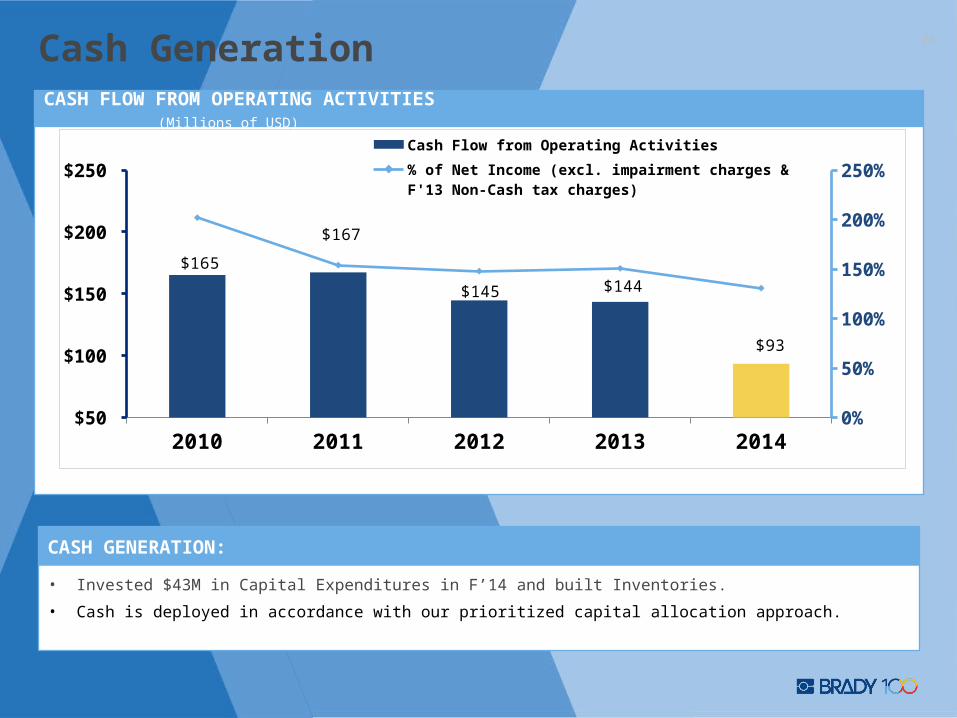
26Cash Generation
• Invested $43M in Capital Expenditures in F’14 and built Inventories.
• Cash is deployed in accordance with our prioritized capital allocation approach.
CASH GENERATION:
2010 2011 2012 2013 2014 $50
$100
$150
$200
$250
0%
50%
100%
150%
200%
250%
$165
$167
$145 $144
$93
Cash Flow from Operating Activities
% of Net Income (excl. impairment charges & F'13 Non-Cash tax charges)
CASH FLOW FROM OPERATING ACTIVITIES (Millions of USD)

27
(‘000s of USD)
Debt Structure
28
Appendix -Non-GAAP Reconciliations
29
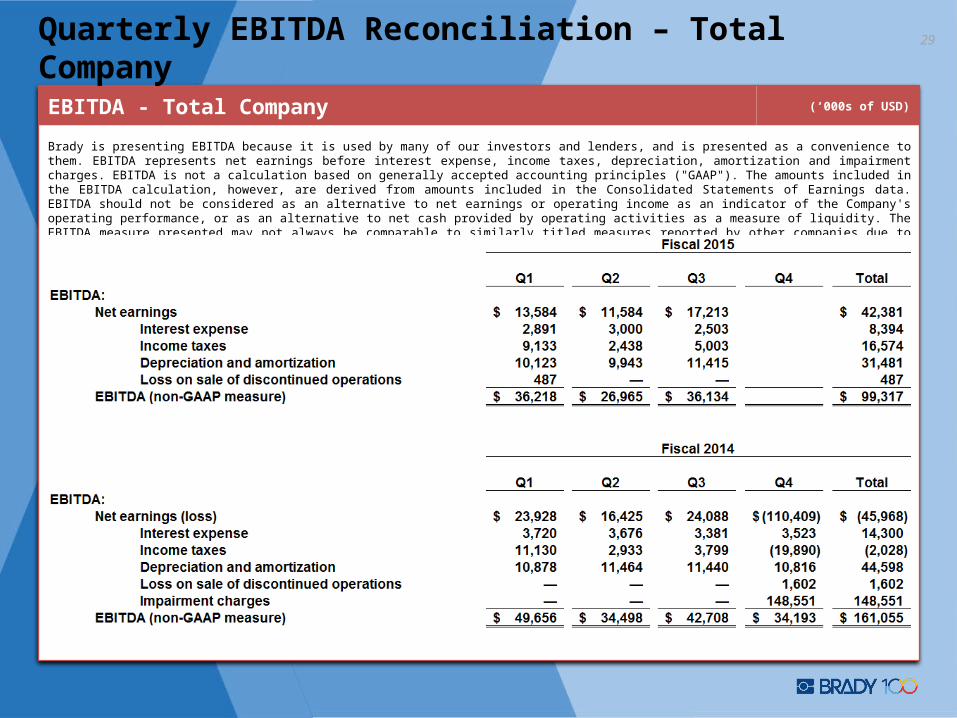
Brady is presenting EBITDA because it is used by many of our investors and lenders, and is presented as a convenience to them. EBITDA represents net earnings before interest expense, income taxes, depreciation, amortization and impairment charges. EBITDA is not a calculation based on generally accepted accounting principles ("GAAP"). The amounts included in the EBITDA calculation, however, are derived from amounts included in the Consolidated Statements of Earnings data. EBITDA should not be considered as an alternative to net earnings or operating income as an indicator of the Company's operating performance, or as an alternative to net cash provided by operating activities as a measure of liquidity. The EBITDA measure presented may not always be comparable to similarly titled measures reported by other companies due to differences in the components of the calculation.
EBITDA - Total Company (‘000s of USD)
Quarterly EBITDA Reconciliation – Total Company

30
Brady is presenting EBITDA because it is used by many of our investors and lenders, and is presented as a convenience to them. EBITDA represents net earnings before interest expense, income taxes, depreciation, amortization and impairment charges. EBITDA is not a calculation based on generally accepted accounting principles ("GAAP"). The amounts included in the EBITDA calculation, however, are derived from amounts included in the Consolidated Statements of Earnings data. EBITDA should not be considered as an alternative to net earnings or operating income as an indicator of the Company's operating performance, or as an alternative to net cash provided by operating activities as a measure of liquidity. The EBITDA measure presented may not always be comparable to similarly titled measures reported by other companies due to differences in the components of the calculation.
EBITDA - Total Company (‘000s of USD)
Annual EBITDA Reconciliation – Total Company

31
Brady is presenting the Non-GAAP measure "Net Earnings from Continuing Operations Excluding Certain Items." This is not a calculation based upon GAAP. The amounts included in this Non-GAAP measure are derived from amounts included in the Consolidated Financial Statements and supporting footnote disclosures. We do not view these items to be part of our sustainable results. We believe this measure provides an important perspective of underlying business trends and results and provides a more comparable measure from year to year. The table below provides a reconciliation of Net Earnings from Continuing Operations to Net Earnings from Continuing Operations Excluding Certain Items:
Reconciliation of Non-GAAP Net Earnings from Continuing Operations (‘000s of USD)
Q3’15 Non-GAAP Earnings from Continuing Operations
32
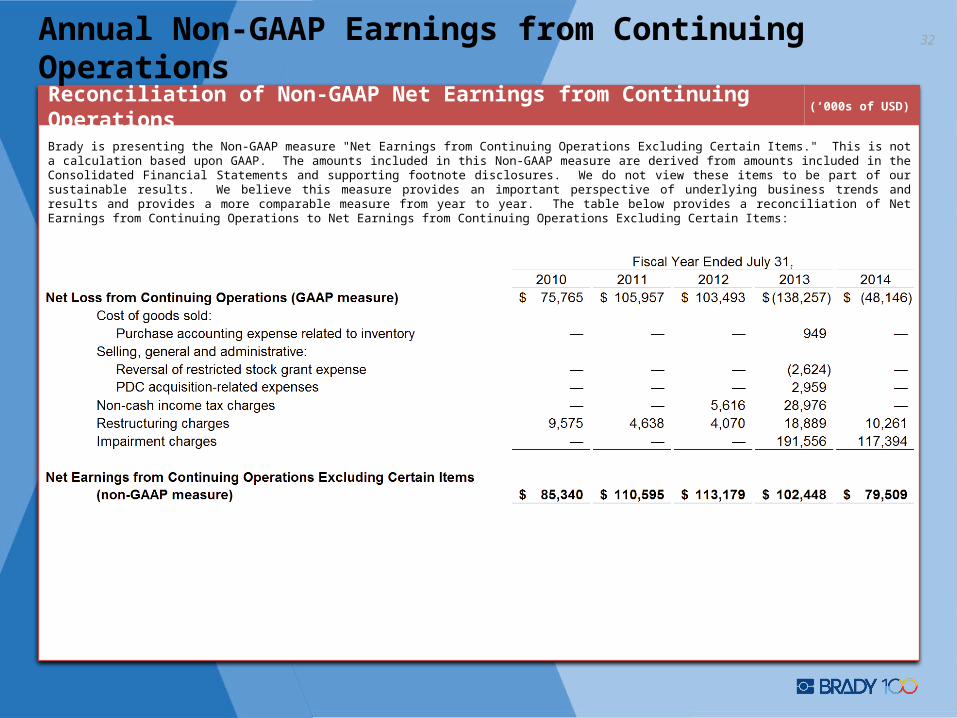
Brady is presenting the Non-GAAP measure "Net Earnings from Continuing Operations Excluding Certain Items." This is not a calculation based upon GAAP. The amounts included in this Non-GAAP measure are derived from amounts included in the Consolidated Financial Statements and supporting footnote disclosures. We do not view these items to be part of our sustainable results. We believe this measure provides an important perspective of underlying business trends and results and provides a more comparable measure from year to year. The table below provides a reconciliation of Net Earnings from Continuing Operations to Net Earnings from Continuing Operations Excluding Certain Items:
Reconciliation of Non-GAAP Net Earnings from Continuing Operations (‘000s of USD)
Annual Non-GAAP Earnings from Continuing Operations
33
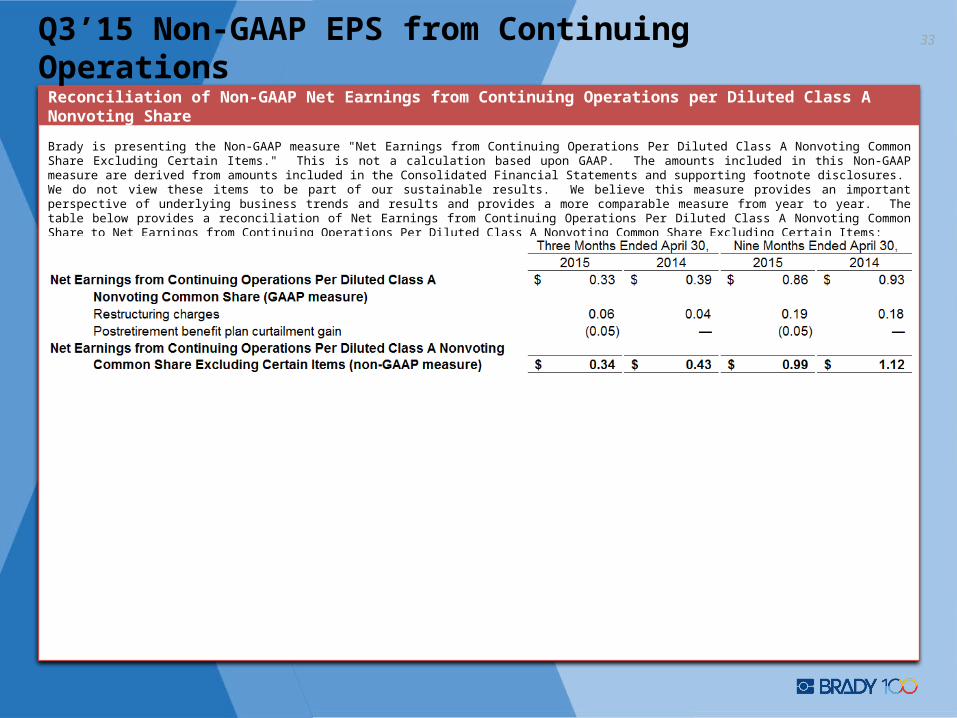
Brady is presenting the Non-GAAP measure "Net Earnings from Continuing Operations Per Diluted Class A Nonvoting Common Share Excluding Certain Items." This is not a calculation based upon GAAP. The amounts included in this Non-GAAP measure are derived from amounts included in the Consolidated Financial Statements and supporting footnote disclosures. We do not view these items to be part of our sustainable results. We believe this measure provides an important perspective of underlying business trends and results and provides a more comparable measure from year to year. The table below provides a reconciliation of Net Earnings from Continuing Operations Per Diluted Class A Nonvoting Common Share to Net Earnings from Continuing Operations Per Diluted Class A Nonvoting Common Share Excluding Certain Items:
Reconciliation of Non-GAAP Net Earnings from Continuing Operations per Diluted Class A Nonvoting Share
Q3’15 Non-GAAP EPS from Continuing Operations


