68
May 2019

May 2019

2 May 2019
Fund ManagerAn employee of the asset management company such as a mutual fund or life insurer, who manages investments of the scheme. He is usually part of a larger team of fund managers and research analysts.
Application Amount for Fresh SubscriptionThis is the minimum investment amount for a new investor in a mutual fund scheme.
Minimum Additional AmountThis is the minimum investment amount for an existing investor in a mutual fund scheme.
Yield to MaturityThe Yield to Maturity or the YTM is the rate of return anticipated on a bond if held until maturity. YTM is expressed as an annual rate. The YTM factors in the bond’s current market price, par value, coupon interest rate and time to maturity.
SIPSIP or systematic investment plan works on the principle of making periodic investments of a fixed sum. It works similar to a recurring bank deposit. For instance, an investor may opt for an SIP that invests Rs 500 every 15th of the month in an equity fund for a period of three years.
NAVThe NAV or the net asset value is the total asset value per unit of the mutual fund after deducting all related and permissible expenses. The NAV is calculated at the end of every business day. It is the value at which the investor enters or exits the mutual fund.
BenchmarkA group of securities, usually a market index, whose performance is used as a standard or benchmark to measure investment performance of mutual funds, among other investments. Some typical benchmarks include the NIFTY, SeNSex, BSe200, BSe500, 10-Year Gsec.
Entry LoadA mutual fund may have a sales charge or load at the time of entry and/or exit to compensate the distributor/agent. entry load is charged at the time an investor purchases the units of a mutual fund.
The entry load is added to the prevailing NAV at the time of investment. For instance, if the NAV is Rs. 100 and the entry load is 1 %, the investor will enter the fund at Rs. 101. (Note: SeBI, vide circular dated June 30, 2009 has abolished entry load and mandated that the upfront commission to distributors will be paid by the investor directly to the distributor, based on his assessment of various factors including the service rendered by the distributor).
Exit Loadexit load is charged at the time an investor redeems the units of a mutual fund. The exit load is reduced from the prevailing NAV at the time of redemption. The investor will receive redemption proceed at net value of NAV less Exit Load. For instance if the NAV is Rs. 100 and the exit load is 1%, the investor will receive Rs. 99.
Modified DurationModified duration is the price sensitivity and the percentage change in price for a unit change in yield.
Standard Deviation
Standard deviation is a statistical measure of the range of an investment’s performance. When a mutual fund has a high standard deviation, its means its range of performance is wide, implying greater volatility.
Sharpe Ratio
The Sharpe Ratio, named after its founder, the Nobel Laureate William Sharpe, is a measure of risk-adjusted returns. It is calculated using standard deviation and excess return to determine reward per unit of risk.
Beta Ratio (Portfolio Beta)
Beta is a measure of an investment’s volatility vis-a-vis the market. Beta of less than 1 means that the security will be less volatile than the market. A beta of greater than 1 implies that the security’s price will be more volatile than the market.
Average portfolio PE (Average P/E)
It is price to earnings ratio of the stocks calculated for the entire portfolio on a weighted average basis.
Average portfolio price to book ratio (Average P/BV)
It is price to book value of the stocks calculated for the entire portfolio on a weighted average basis.
Average portfolio dividend yield (Average Dividend Yield)
It is dividend yield of the stocks calculated for the entire portfolio on a weighted average basis.
Net Equity
Net equity level is the net equity exposure percentage adjusted for any derivative positions in stocks or index for hedging or rebalancing purpose.
R Squared
It is a statistical measure of how closely the portfolio returns are correlated with its benchmark.
AUM
AUM or assets under management refers to the recent / updated cumulative market value of investments managed by a mutual fund or any investment firm.
Holdings
The holdings or the portfolio is a mutual fund’s latest or updated reported statement of investments/securities. These are usually displayed in terms of percentage to net assets or the rupee value or both. The objective is to give investors an idea of where their money is being invested by the fund manager.
Nature of Scheme
The investment objective and underlying investments determine the nature of the mutual fund scheme. For instance, a mutual fund that aims at generating capital appreciation by investing in stock markets is an equity fund or growth fund. Likewise, a mutual fund that aims at capital preservation by investing in debt markets is a debt fund or income fund. each of these categories may have sub-categories.
Rating Profile
Mutual funds invest in securities after evaluating their creditworthiness as disclosed by the ratings. A depiction of the mutual fund in various investments based on their ratings becomes the rating profile of the fund. Typically, this is a feature of debt funds.
HOW TO READ FACTSHEET
Sharpe RatioSharpe Ratio is a risk to reward ratio, it measures portfolio returns generated in excess to the investment in risk-free asset, for per unit of total risk taken. While, positive Sharpe ratio indicates, portfolio compensating investors with excess returns (over risk-free rate) for the commensurate risk taken; negative Sharpe ratio indicates, investors are better off investing in risk-free assets.
BetaBeta (ß) of a portfolio is a number indicating the relation between portfolio returns with that of the market index i.e. it measure the volatility, or systematic risk, of a portfolio in comparison to the market as a whole.
Modified DurationA formula that expresses the measurable change in the value of a security in response to a change in interest rates. Modified duration of portfolio can be used to anticipate the change in market value of portfolio for every change in portfolio yield.
Standard DeviationA statistical measure that defines expected volatility/risk associated with a portfolio. This explains the variation/deviation from the average returns delivered by the portfolio. A higher standard deviation means higher volatility (risk) and a lower standard deviation means lower volatility.
Risk Free ReturnThe theoretical rate of return of an investment with safest (zero risk) investment in a country.
Total Expense RatioTotal expenses charged to scheme for the month expressed as a percentage to average monthly net assets.
Tracking ErrorTracking error indicates how closely the portfolio return is tracking the benchmark Index return. It measures the deviation between portfolio return and benchmark index return. A lower tracking error indicates portfolio closely tracking benchmark index and higher tracking error indicates portfolio returns with higher deviation from benchmark index returns.
Average MaturityWeighted average maturity of the securities in scheme.
Portfolio Yield (Yield To Maturity)Weighted average yield of the securities in scheme portfolio.
Portfolio Turnover RatioPortfolio Turnover Ratio is the percentage of a fund’s holdings that have changed in a given year. This ratio measures the fund’s trading activity, which is computed by taking the lesser of purchases or sales and dividing by average monthly net assets.
Macaulay Duration (Duration)Macaulay Duration (Duration) measures the price volatility of fixed income securities. It is often used in the comparison of interest rate risk between securities with different coupons and different maturities. It is defined as the weighted average time to cash flows of a bond where the weights are nothing but the present value of the cash flows themselves. It is expressed in years. The duration of a fixed income security is always shorter than its term to maturity, except in the case of zero coupon securities where they are the same.
GLOSSARY

May 2019 3
Equity Market Update
In May 2019, Indian equity markets performed strongly. S&P BSE SENSEX / NIFTY 50 rose by nearly 1.5% driven by robust FII flows, fall in US treasury yields and general election results to markets liking. The markets ignored the escalation of trade war tension between US and China and concerns over global growth. With elections behind, midcaps and smallcaps indices registered strong gains during the month. Sectoral indices performance was mixed with capital goods, Banks and Oil & Gas being the best performing sector whereas healthcare, metals and IT underperformed.
Performance of global equity markets was weak. All major indices in US, Europe and major Asian markets delivered significant negative returns in the month. This was primarily on account of escalation of trade war tension between US and China with US raising the tariff on goods worth $ 200 billion from 10% to 25%. China also countered the move by raising the tariff on US imports worth $ 60 billion.
The table below gives the details of performance of key domestic and global indices.
% Change in Indices FY 2019 1M FYTD 2020
S&P BSE India Auto (21.7) (2.1) (2.0)S&P BSE India Bankex 25.5 5.8 3.3S&P BSE India Capital Goods (0.0) 10.6 7.9S&P BSE India FMCG 14.1 (2.1) (1.9)S&P BSE India Healthcare 9.5 (7.4) (7.7)S&P BSE India Metal (14.8) (6.6) (5.3)S&P BSE India Power (4.3) 2.1 (1.2)S&P BSE India Oil & Gas 4.5 2.5 3.0S&P BSE India IT 26.3 (3.0) 3.3S&P BSE SENSEX 17.3 1.7 2.7NIFTY 50 14.9 1.5 2.6NIFTY Midcap 100 (2.7) 2.2 (1.6)NIFTY Smallcap (14.4) 1.2 (1.9)
% Change in Indices
FY 2019 1M FYTD
2020S&P 500 7.3 (6.6) (2.9)FTSE 3.2 (3.5) (1.6)DAX (4.7) (5.0) 1.7CAC 3.5 (6.8) (2.7)Nikkei (1.2) (7.4) (2.9)Hang Seng (3.5) (9.4) (7.4)KOSPI (12.5) (7.3) (4.6)Shanghai (2.5) (5.8) (6.2)MSCI Emerging Market Index (9.6) (7.5) (5.7)
During the month, Brent crude prices corrected sharply by ~11.4% and closed the month at $ 64.5 per barrel. Most major commodities prices also fell in the month. This was primarily driven by concerns over global growth due to rising trade tension between US and China.
% Change FY 2019 1MBrent Crude (2.7) (11.4)Gold (2.5) 1.7Steel 1.2 (2.7)Zinc (10.0) (8.5)Copper (3.0) (10.3)Aluminium (4.7) (0.6)Lead (16.1) (8.2)
Most other currencies depreciated against USD in the month. INR, however, ended the month at 69.7 vs USD, largely stable in the month supported by recovery in FII flows and fall in oil prices.
FPIs were net buyers for four months in a row and bought equity worth $ 1.1 billion in May 2019. Total FPI’s Equity inflows in CY19YTD till May 2019 have been close to $ 10.9 billion. Equity oriented mutual funds inflows moderated during the month of April. Net inflows in domestic equity oriented mutual funds in April 2019 and CYTD19 were ~Rs 15 billion and ~Rs 193 billion respectively.
Q4FY19 results of Cement, Chemicals, Oil & gas and Corporate banks were better than expectation whereas for retail banks, power and metals were largely in line with expectations. Results for Auto, consumer staples, IT and capital goods were below expectations.
NIFTY 50 is trading near 19.5x FY20 (e) and 16.5x FY21 (e). These are reasonable multiples especially in view of improving profit growth outlook. Markets thus hold promise over the medium to long term in our opinion. With the sharp decline in midcaps and smallcaps stocks over the past 15 months, significant divergence with large caps is not likely going forward. Adverse global events, rise in crude oil prices, sharp moderation in equity oriented mutual funds flows, delays in NPA (Non Performing Assets) resolution under NCLT (National Company Law Tribunal) are key risks in the near term.
Outlook
In view of the above and expected recovery in earnings, there is merit in increasing allocation to equities in a phased manner or in staying invested as the case may be (for those with a medium to long term view and in line with individual risk appetite).
Debt Market Update
The yield on 10-year benchmark Gsec (7.26 GoI 2029) ended the month of May at 7.03%, down by 38 bps over the previous month end. The table below gives a summary view of movement of key rates & liquidity.
Apr-19 May-19 Change (%)10Yr G-Sec Yield (%, 7.26 GoI 2029) 7.41 7.03 -0.38AAA 10Yr Corporate Bond Yields (%) 8.42 8.04 -0.38AAA 10Y corporate bond spread against 7.26 GS 2029 Yield# (bps) 87 88 0.01Average liquidity absorbed/(infused) by RBI* (INR billion) (approx.) -726 -361MIBOR Overnight Rate (%) 6.20 6.00 -0.20
*Average daily liquidity infused / absorbed through Liquidity Adjustment Facility, exports refinance, marginal standing facility and term repos/reverse repos# annualised yields.
To support liquidity, RBI conducted purchases under open market operations of INR 250
Market Review
Source for various data points: Bloomberg, NSDL, CMIE, RBI, Kotak Institutional Research
billion in May 2019 and announced to do additional purchases of INR 150 billion in June 2019. Average liquidity was negative for most part of the month primarily due to lower government spending on account of general elections.
Net FII debt flows turned marginally positive with net inflows of $ 0.2 billion during the month as against net outflows of $ 0.7 billion in April 2019. In first five months of CY19, aggregate net FII debt flows were close to $ 0.1 billion as against outflows of $ 4.5 billion in the corresponding period a year ago. INR ended the month at 69.7, a m-o-m depreciation of 0.2% against USD primarily due to higher oil prices, which was offset by positive FII flows.
The annual rate of retail inflation, CPI increased marginally to 2.92%, up by only ~6 bps m-o-m led by sequential rise in food (mainly vegetables, meat & eggs) and fuel prices. Core CPI (CPI excluding food, fuel, transportation & housing) moderated significantly on m-o-m basis to 4.9% (down from 5.7% a month ago) mainly on account of moderation in inflation in clothing & footwear, household services and personal care.
For the month (%) Mar-19 Apr-19 Change in %CPI 2.86 2.92 0.06Food & beverages 0.66 1.38 0.73Fuel and Light 2.34 2.56 0.22Housing 4.93 4.76 -0.17Core CPI 5.70 4.89 -0.81
India’s trade deficit for April 2019 increased to $ 15.3 billion from $ 10.8 billion a month ago, primarily led by lower exports of engineering goods, leather goods, textiles and gems & jewellery. The aforesaid impact was partly offset by lower net oil imports.
Amount in USD million Mar-19 Apr-19 Change (%)Trade Deficit 10,845 15,330 41.3%Net Oil imports 8,216 7,703 -6.2%Net Gold imports* 2,970 3,500 17.8%Trade deficit ex oil & gold -340 4,128 NM^
* includes net imports of gold, silver & precious stones adjusted for gems & jewellery exports; ^NM-Not meaningful.
GST collection for the month of May 2019 (for the month of April 2019) rose to INR 1,003 billion, ~2.2% higher than FY19 average monthly collection and up ~7% YoY. The average monthly collection required to meet the budgeted target for FY20 is estimated to be around INR 1,200 billion per month.
India’s GDP growth slowed down to 5.8% YoY in Q4FY19 from 6.6% in Q3FY19 led by slowdown in investment activity and private consumption expenditures. Growth in gross capital formation declined to 3.6% from 11.2% a quarter ago. Growth in GVA moderated to 5.7% in Q4FY19 from 6.3% a quarter ago primarily led by slowdown in agriculture and industry, especially in manufacturing segment. A brief summary of YoY growth of major components of GDP and GVA is given in table below.
Quarter ended 31-12-2018 31-03-2019 Quarter ended 31-12-2018 31-03-2019Overall GVA 6.3% 5.7% Overall GDP 6.6% 5.8%Agriculture, forestry and fishing 2.8% -0.1%
Private Consumption 8.1% 7.2%
Industry 7.0% 4.2%Government Consumption 6.5% 13.1%
Construction 9.7% 7.1%Gross Capital Formation 11.2% 3.6%
Services 7.2% 8.4% Exports 16.7% 10.6%PADO* 7.5% 10.7% Imports 14.5% 13.3%
Monetary Policy Committee (MPC) in its bi-monthly meeting held in June 2019, reduced the policy repo rate by 25bps to 5.75% and also changed its policy stance to “accommodative” from “neutral”. The reverse repo rate now stands at 5.50% and the cash reserve ratio (CRR) remains unchanged at 4.0%. In other measures, RBI announced that it will reduce the minimum leverage ratio required to be maintained by banks from 4.5% to 4% for Domestic systematically Important banks and 3.5% for other banks. In simple terms, leverage ratio is ratio between bank’s Tier I capital to its total assets (including derivative exposure, off balance sheet items etc.). In addition, RBI has set up a committee to comprehensively review the existing liquidity management framework.
Outlook
The Monetary Policy Committee’s (MPC) decision to reduce policy rate by 25bps was largely in line with market expectations but change in stance to accommodative came in as a positive surprise. RBI also indicated that it will maintain adequate liquidity, which is likely to result in better transmission of rate cuts, in our opinion.
This was the third consecutive rate cut by RBI and it has reduced the policy rate by 75 bps in aggregate in 2019. Given the near term inflation outlook remains benign and growth is moderating, it could provide some space for further policy easing. However, any future action by RBI is likely to be data dependent and we maintain that this rate cut cycle is likely to be a shallow one, in our opinion.
Large increase in gross market borrowings in FY20 over FY19 along with low demand for government bonds due to excess Statutory Liquidity Ratio (SLR) in the banking system could put upward pressure on yields at longer end. Even though the near term inflation outlook remains benign due to low food prices and range bound oil prices, we prefer to maintain a cautious stance. This is due to a modest uptick in growth expected in FY20, uncertainty regarding the monsoon, credit growth outpacing deposit growth and likely fiscal pressures.
In view of the above, the short to medium end of the yield curve continues to offer better risk adjusted returns than the long end. Hence, we continue to recommend investment in short to medium duration debt funds.

4 May 2019
CONTENTS
PAGE NO.
WEAlTH CREATiON
HDFc Equity Fund ............................................................................. 05
HDFc capital Builder Value Fund ........................................................ 06
HDFc Top 100 Fund ........................................................................... 07
HDFc Mid-cap Opportunities Fund ..................................................... 08
HDFc Small cap Fund ........................................................................ 09
HDFc Growth Opportunities Fund ...................................................... 10
HDFc Focused 30 Fund ...................................................................... 11
HDFc Infrastructure Fund .................................................................. 12
HDFc Balanced Advantage Fund ........................................................ 1 3 - 1 4
HDFc Hybrid Equity Fund ................................................................... 15-16
HDFc Multi-Asset Fund ...................................................................... 17-18
HDFc NIFTY 50 ETF ............................................................................ 19
HDFc Index Fund - NIFTY 50 Plan ....................................................... 20
HDFc SENSEx ETF .............................................................................. 21
HDFc Index Fund - SeNSex Plan ......................................................... 22
TAx SAVINGS
HDFc Taxsaver .................................................................................. 23
CHilDREN'S FUTURE
HDFc children’s Gift Fund ................................................................. 24-25
RETIREMENT PLANNING
HDFc Retirement Savings Fund - Equity Plan ....................................... 26
HDFc Retirement Savings Fund - Hybrid Equity Plan ............................ 27-28
HDFc Retirement Savings Fund - Hybrid Debt Plan .............................. 29
PAGE NO.
REgUlAR iNCOME
HDFc Equity Savings Fund ................................................................. 30-31
HDFc Hybrid Debt Fund ..................................................................... 32-33
HDFc Arbitrage Fund ......................................................................... 34-35
HDFc corporate Bond Fund ............................................................... 36
HDFc credit Risk Debt Fund ............................................................... 37-38
HDFc Banking and PSU Debt Fund ..................................................... 39
HDFc Gilt Fund.................................................................................. 40
HDFc Dynamic Debt Fund .................................................................. 41
HDFc Income Fund ........................................................................... 42
HDFc Medium Term Debt Fund .......................................................... 43
HDFc Short Term Debt Fund .............................................................. 44
HDFc Low Duration Fund ................................................................... 45
HDFc Money Market Fund ................................................................. 46
HDFc Floating Rate Debt Fund ........................................................... 47
HDFc Ultra Short Term Fund .............................................................. 48
HDFc Liquid Fund .............................................................................. 49-50
HDFc Overnight Fund ........................................................................ 51
Performance details of schemes managed by respective fund managers ............................................. 52
Scheme performance summary - Regular Plans ................................. 53-57
Scheme performance summary - Direct Plans .................................... 58-65
Performance of category I - FPI Portfolio ........................................... 65
Dividend History ............................................................................... 66-67
Disclaimer ....................................................................................... 68
gOAl BASED SOlUTiONS
WEAlTH CREATiON These schemes aim to increase wealth over the long term by investing predominantly in equity instruments and are suitable for investors with high risk appetite and relatively higher investment horizon.
TAx SAVINGS This scheme is eligible to provide tax deduction under Section 80c and also aims to increase wealth over the long term. This is an ideal solution for investors who would like to create wealth and save tax.
CHilDREN'S FUTURE This scheme aims to help you achieve your specific financial goal of planning for child’s future expenses like higher education, etc.
RETIREMENT PLANNING These schemes aim to help you achieve your specific financial goal of retirement planning.
REgUlAR iNCOME These schemes aim to provide stable income and are ideal for investors with low to medium risk appetite who wish to receive regular income to meet their periodic expenses.
Disclaimer: Investors are requested to note that the above goal based solutions should not be construed as financial planning solution/recommendation by the Fund/AMc. It does not in any manner, indicate or imply either the quality of any particular Scheme or guarantee any specific performance/returns. Such solutions must be tailored to investor’s individual situation and objectives and therefore, investors should consult their financial advisors to ascertain whether a product is suitable for them.

May 2019 5
SiP PERFORMANCE ^ - Regular plan - growth OptionSince Inception
SIP15 year
SIP10 year
SIP5 year
SIP3 year
SIP1 year
SIPTotal Amount Invested (` ‘000) 2,930.00 1,800.00 1,200.00 600.00 360.00 120.00 Mkt Value As on May 31, 2019 (` ‘000) 75,841.05 6,540.41 2,442.92 811.56 436.49 132.56 Returns (%) 21.85 15.68 13.63 12.04 12.95 20.06 Benchmark Returns (%) # 14.79 12.74 12.23 11.24 10.91 11.44 Additional Benchmark Returns (%) ## N.A. 12.84 12.18 12.37 14.19 16.44
Assuming ` 10,000 invested systematically on the first Business Day of every month over a period of time. cAGR returns are computed after accounting for the cash flow by using xIRR method (investment internal rate of return) for Regular Plan - Growth Option. The above investment simulation is for illustrative purposes only and should not be construed as a promise on minimum returns and safeguard of capital.
Face Value per Unit: ` 10 unless otherwise specified, + Industry classification as recommended by AMFI, Data is as of May 31, 2019 unless otherwise specified.
PERFORMANCE ^ - Regular plan - growth OptionDate Period Scheme
Returns (%)
Benchmark Returns
(%)#
Additional Benchmark
Returns (%) ##
Value of ` 10,000 investedScheme (`) Benchmark
(`)#Additional
Benchmark (`)##
May 31, 18 Last 1 Year 13.74 6.46 12.43 11,374 10,646 11,243May 31, 16 Last 3 Years 15.89 14.35 14.99 15,563 14,954 15,203May 30, 14 Last 5 Years 12.23 12.35 11.92 17,818 17,910 17,571Jan 01, 95 Since Inception 18.97 11.60 N.A. 696,471 145,910 N.A.
Returns greater than 1 year period are compounded annualized (cAGR). N.A. Not Available. For performance of other schemes managed by Prashant Jain, please refer page 52. Different plans viz. Regular Plan and Direct Plan have a different expense structure. The expenses of the Direct Plan under the Scheme will be lower to the extent of the distribution expenses / commission charged in the Regular Plan. For Performance of Direct Plan, refer page no. 58. For FPI Portfolio, refer page no. 65.
This product is suitable for investors who are seeking ~
l to generate long-term capital appreciation / income
l investment predominantly in equity & equity related instruments
Riskometer
Investors understand that their principal will be at moderately high risk
~ Investors should consult their financial advisers if in doubt about whether the product is suitable for them. ^Past performance may or may not be sustained in the future. Load is not taken into consideration for computation of performance.
(An open ended equity scheme investing across large cap, mid cap & small cap stocks)HDFC Equity Fund
Company Industry+ % to NAV
EqUiTY & EqUiTY RElATED
• State Bank of India Banks 9.94
• IcIcI Bank Ltd. Banks 9.71
• Larsen and Toubro Ltd. construction Project 8.65
• Infosys Ltd. Software 8.47
• Reliance Industries Ltd. Petroleum Products 5.27
• NTPc Ltd. Power 4.41
• HDFc Bank Ltd. Banks 4.38
• ITc Ltd. consumer Non Durables 3.38
• Tata consultancy Services Ltd. Software 3.14
• Bharat Petroleum corporation Ltd. Petroleum Products 2.92
Axis Bank Ltd. Banks 2.88
Power Finance corporation Ltd. Finance 2.84
coal India Ltd. Minerals/Mining 2.68
Bank of Baroda Banks 2.63
GAIL (India) Ltd. Gas 2.50
Rural electrification corporation Ltd. Finance 2.27
Tata Steel Ltd. Ferrous Metals 2.01
cESc Ltd. Power 1.87
Aurobindo Pharma Ltd. Pharmaceuticals 1.58
Housing Development Finance corporation Ltd. £ Finance 1.53
Kalpataru Power Transmission Ltd. Power 1.51
Power Grid corporation of India Ltd. Power 1.30
Vedanta Ltd. Non - Ferrous Metals 1.23
cipla Ltd. Pharmaceuticals 1.21
Tata chemicals Ltd. chemicals 1.20
canara Bank Banks 1.09
Siemens Ltd. Industrial capital Goods 0.96
Oracle Financial Services Software Ltd. Software 0.93
Praj Industries Ltd. Industrial capital Goods 0.92
L&T Technology Services Ltd. Software 0.91
Bharat Heavy electricals Ltd. Industrial capital Goods 0.85
Punjab National Bank Banks 0.83BeML Ltd. Industrial capital Goods 0.77Bharat Dynamics Ltd. Aerospace & Defence 0.53cG Power and Industrial Solutions Ltd. Industrial capital Goods 0.53
Company Industry+ % to NAV
Time Technoplast Ltd. Industrial Products 0.42Oriental Bank of commerce Banks 0.35InterGlobe Aviation Ltd. Transportation 0.33Simplex Infrastructures Ltd. construction 0.30Hindustan construction company Ltd. construction Project 0.21Ramco Systems Ltd. Software 0.13UPL Ltd. Pesticides 0.02Sub Total 99.59Preference SharesZee entertainment enterprises Ltd. Media & entertainment 0.01Sub Total 0.01Total 99.60cash margin 0.08cash, cash Equivalents and Net current Assets 0.32
Grand Total 100.00
• Top Ten Holdings, £ co-sponsor
PORTFOLIO
Industry Allocation of Equity Holding (% of Net Assets)
0.010.020.300.330.420.531.201.232.012.502.682.793.384.03
6.648.198.869.09
13.5831.81
0 5 10 15 20 25 30 35
Media & EntertainmentPesticides
ConstructionTransportation
Industrial ProductsAerospace & Defence
ChemicalsNon - Ferrous Metals
Ferrous MetalsGas
Minerals/MiningPharmaceuticals
Consumer Non DurablesIndustrial Capital Goods
FinancePetroleum Products
Construction ProjectPower
SoftwareBanks
KEY FACTS
iNVESTMENT OBjECTiVE
To generate capital appreciation / income from a portfolio, predominantly invested in equity & equity related instruments.There is no assurance that the investment objective of the Scheme will be realized.
FUND MANAgER § ¥
Prashant Jain (since June 20, 03)
Total Experience: Over 27 years
iNCEPTiON DATE (Date of Allotment)
January 1, 1995
NAV (AS ON MAY 31, 2019) NAV PER UNIT (`)
Regular Plan - Growth Option 696.471Regular Plan - Dividend Option 52.622Direct Plan - Growth Option 732.811Direct Plan - Dividend Option 56.582
ASSETS UNDER MANAgEMENT (`) iN CRORE
As on May 31, 2019 23,230.66Average for Month of May, 2019 22,225.09
qUANTiTATiVE DATA
Portfolio Turnover Ratio (Last 1 year) 20.05%
Risk Ration Standard Deviation 4.285%n Beta 1.026n Sharpe Ratio* 0.192
computed for the 3-yr period ended May 31, 2019. Based on month-end NAV. * Risk free rate: 6.00%(Source: FIMMDA MIBOR)
TOTAL ExPENSE RATIO (As on May 31, 2019)Including Additional expenses and Goods and Service Tax on Management Fees
Regular: 1.87% Direct: 1.27%
#BENCHMARK iNDEX: NIFTY 500 (Total Returns Index)
##ADDl. BENCHMARK iNDEX: NIFTY 50 (Total Returns Index)
EXiT lOAD
l In respect of each purchase / switch-in of Units, an exit Load of 1.00% is payable if Units are redeemed / switched-out within 1 year from the date of allotment.
l No exit Load is payable if Units are redeemed / switched-out after 1 year from the date of allotment.
For further details, please refer to para ‘Exit Load’ on Pg 52.
PLANS & OPTIONS
Regular Plan, Direct Plan. Under each Plan : Growth & Dividend. The Dividend Option offers Dividend Payout and Reinvestment facility.
MiNiMUM APPliCATiON AMOUNT
Purchase : ` 5,000 and any amount thereafter.Additional Purchase : ` 1,000 and any amount thereafter.
§ Date of migration from Zurich India Mutual Fund (close of business hours - June 19, 03).¥ Dedicated Fund Manager for Overseas Investments: Mr. Amar Kalkundrikar (Total Experience: Over 16 years).
CATEgORY OF SCHEME: MULTI-cAP FUND
6 May 2019
SiP PERFORMANCE ^ - Regular plan - growth Option
Since Inception SIP
15 year SIP
10 year SIP
5 year SIP
3 year SIP
1 year SIP
Total Amount Invested (` ‘000) 3,040.00 1,800.00 1,200.00 600.00 360.00 120.00 Mkt Value As on May 31, 2019 (` ‘000) 44,994.15 6,240.57 2,525.84 793.10 415.55 125.26 Returns (%) 17.65 15.14 14.25 11.11 9.56 8.27 Benchmark Returns (%) # N.A. 12.74 12.23 11.24 10.91 11.44 Additional Benchmark Returns (%) ## N.A. 12.84 12.18 12.37 14.19 16.44
Assuming ` 10,000 invested systematically on the first Business Day of every month over a period of time. cAGR returns are computed after accounting for the cash flow by using xIRR method (investment internal rate of return). The above investment simulation is for illustrative purposes only and should not be construed as a promise on minimum returns and safeguard of capital.
PERFORMANCE ^ - Regular plan - growth OptionDate Period Scheme
Returns (%)
Benchmark Returns
(%)#
Additional Benchmark
Returns (%) ##
Value of ` 10,000 invested
Scheme (`) Benchmark (`)#
Additional Benchmark
(`)##May 31, 18 Last 1 Year 2.66 6.46 12.43 10,266 10,646 11,243May 31, 16 Last 3 Years 14.10 14.35 14.99 14,854 14,954 15,203May 30, 14 Last 5 Years 13.84 12.35 11.92 19,137 17,910 17,571Feb 01, 94 Since Inception 14.39 N.A. N.A. 301,458 N.A. N.A.
Returns greater than 1 year period are compounded annualized (cAGR). N.A. Not Available. For performance of other schemes managed by Miten Lathia, please refer page 52. Different plans viz. Regular Plan and Direct Plan have a different expense structure. The expenses of the Direct Plan under the Scheme will be lower to the extent of the distribution expenses / commission charged in the Regular Plan. For Performance of Direct Plan, refer page no. 64.
Face Value per Unit: ` 10 unless otherwise specified, + Industry classification as recommended by AMFI, Data is as of May 31, 2019 unless otherwise specified.
This product is suitable for investors who are seeking ~
l to generate long-term capital appreciation / income in the long term
l investment primarily in undervalued stocks
Riskometer
Investors understand that their principal will be at moderately high risk
~ Investors should consult their financial advisers if in doubt about whether the product is suitable for them. ^Past performance may or may not be sustained in the future. Load is not taken into consideration for computation of performance.
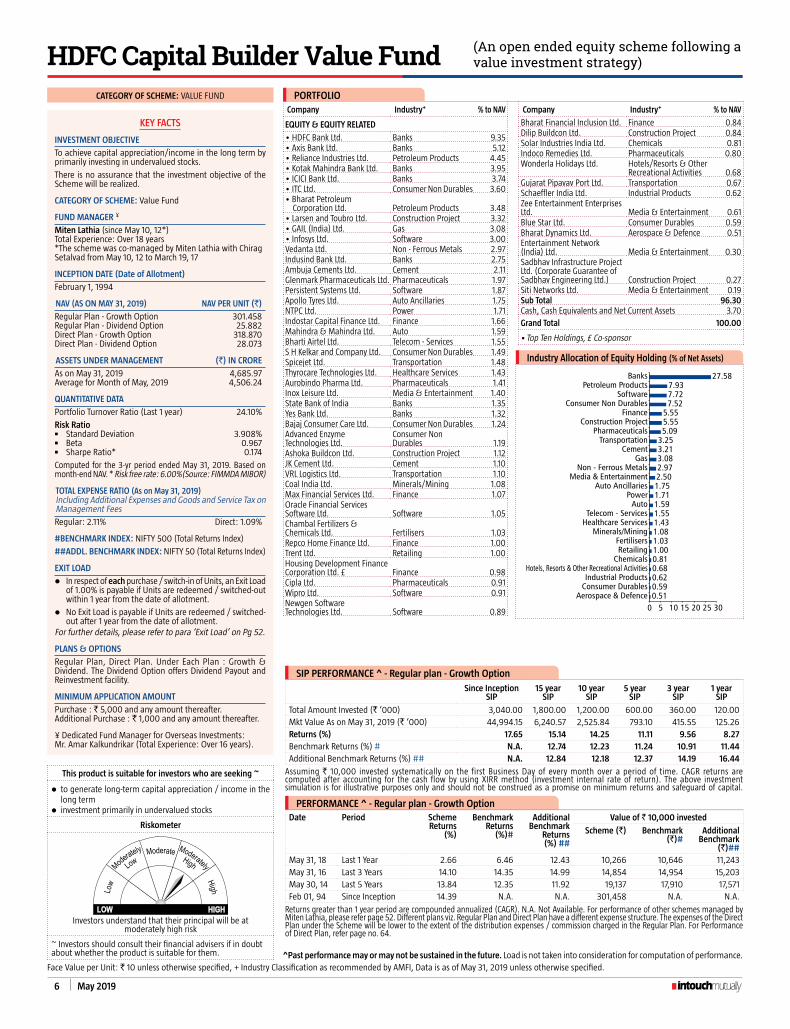
(An open ended equity scheme following a value investment strategy)HDFC Capital Builder Value Fund
Company Industry+ % to NAV
EqUiTY & EqUiTY RElATED
• HDFc Bank Ltd. Banks 9.35• Axis Bank Ltd. Banks 5.12• Reliance Industries Ltd. Petroleum Products 4.45• Kotak Mahindra Bank Ltd. Banks 3.95• IcIcI Bank Ltd. Banks 3.74• ITc Ltd. consumer Non Durables 3.60• Bharat Petroleum
corporation Ltd. Petroleum Products 3.48• Larsen and Toubro Ltd. construction Project 3.32• GAIL (India) Ltd. Gas 3.08• Infosys Ltd. Software 3.00Vedanta Ltd. Non - Ferrous Metals 2.97Indusind Bank Ltd. Banks 2.75Ambuja cements Ltd. cement 2.11Glenmark Pharmaceuticals Ltd. Pharmaceuticals 1.97Persistent Systems Ltd. Software 1.87Apollo Tyres Ltd. Auto Ancillaries 1.75NTPc Ltd. Power 1.71Indostar capital Finance Ltd. Finance 1.66Mahindra & Mahindra Ltd. Auto 1.59Bharti Airtel Ltd. Telecom - Services 1.55S H Kelkar and company Ltd. consumer Non Durables 1.49Spicejet Ltd. Transportation 1.48Thyrocare Technologies Ltd. Healthcare Services 1.43Aurobindo Pharma Ltd. Pharmaceuticals 1.41Inox Leisure Ltd. Media & entertainment 1.40State Bank of India Banks 1.35Yes Bank Ltd. Banks 1.32Bajaj consumer care Ltd. consumer Non Durables 1.24Advanced enzyme Technologies Ltd.
consumer Non Durables 1.19
Ashoka Buildcon Ltd. construction Project 1.12JK cement Ltd. cement 1.10VRL Logistics Ltd. Transportation 1.10coal India Ltd. Minerals/Mining 1.08Max Financial Services Ltd. Finance 1.07Oracle Financial Services Software Ltd. Software 1.05chambal Fertilizers & chemicals Ltd. Fertilisers 1.03Repco Home Finance Ltd. Finance 1.00Trent Ltd. Retailing 1.00Housing Development Finance corporation Ltd. £ Finance 0.98cipla Ltd. Pharmaceuticals 0.91Wipro Ltd. Software 0.91Newgen Software Technologies Ltd. Software 0.89
Company Industry+ % to NAV
Bharat Financial Inclusion Ltd. Finance 0.84Dilip Buildcon Ltd. construction Project 0.84Solar Industries India Ltd. chemicals 0.81Indoco Remedies Ltd. Pharmaceuticals 0.80Wonderla Holidays Ltd. Hotels/Resorts & Other
Recreational Activities 0.68Gujarat Pipavav Port Ltd. Transportation 0.67Schaeffler India Ltd. Industrial Products 0.62Zee entertainment enterprises Ltd. Media & entertainment 0.61Blue Star Ltd. consumer Durables 0.59Bharat Dynamics Ltd. Aerospace & Defence 0.51entertainment Network (India) Ltd. Media & entertainment 0.30Sadbhav Infrastructure Project Ltd. (corporate Guarantee of Sadbhav engineering Ltd.) construction Project 0.27Siti Networks Ltd. Media & entertainment 0.19Sub Total 96.30cash, cash Equivalents and Net current Assets 3.70
Grand Total 100.00
• Top Ten Holdings, £ co-sponsor
PORTFOLIO
Industry Allocation of Equity Holding (% of Net Assets)
0.510.590.620.680.811.001.031.081.431.551.591.711.752.502.973.083.213.255.095.555.55
7.527.727.93
27.58
0 5 10 15 20 25 30Aerospace & Defence
Consumer DurablesIndustrial Products
Hotels, Resorts & Other Recreational ActivitiesChemicalsRetailingFertilisers
Minerals/MiningHealthcare ServicesTelecom - Services
AutoPower
Auto AncillariesMedia & Entertainment
Non - Ferrous MetalsGas
CementTransportation
PharmaceuticalsConstruction Project
FinanceConsumer Non Durables
SoftwarePetroleum Products
Banks
KEY FACTS
iNVESTMENT OBjECTiVE
To achieve capital appreciation/income in the long term by primarily investing in undervalued stocks.
There is no assurance that the investment objective of the Scheme will be realized.
CATEgORY OF SCHEME: Value Fund
FUND MANAgER ¥
Miten Lathia (since May 10, 12*)
Total Experience: Over 18 years*The scheme was co-managed by Miten Lathia with chirag Setalvad from May 10, 12 to March 19, 17
iNCEPTiON DATE (Date of Allotment)
February 1, 1994
NAV (AS ON MAY 31, 2019) NAV PER UNIT (`)
Regular Plan - Growth Option 301.458Regular Plan - Dividend Option 25.882Direct Plan - Growth Option 318.870Direct Plan - Dividend Option 28.073
ASSETS UNDER MANAgEMENT (`) iN CRORE
As on May 31, 2019 4,685.97Average for Month of May, 2019 4,506.24
qUANTiTATiVE DATA
Portfolio Turnover Ratio (Last 1 year) 24.10%
Risk Ration Standard Deviation 3.908%n Beta 0.967n Sharpe Ratio* 0.174
computed for the 3-yr period ended May 31, 2019. Based on month-end NAV. * Risk free rate: 6.00%(Source: FIMMDA MIBOR)
TOTAL ExPENSE RATIO (As on May 31, 2019)Including Additional expenses and Goods and Service Tax on Management Fees
Regular: 2.11% Direct: 1.09%
#BENCHMARK iNDEX: NIFTY 500 (Total Returns Index)
##ADDl. BENCHMARK iNDEX: NIFTY 50 (Total Returns Index)
EXiT lOAD
l In respect of each purchase / switch-in of Units, an exit Load of 1.00% is payable if Units are redeemed / switched-out within 1 year from the date of allotment.
l No exit Load is payable if Units are redeemed / switched-out after 1 year from the date of allotment.
For further details, please refer to para ‘Exit Load’ on Pg 52.
PLANS & OPTIONS
Regular Plan, Direct Plan. Under each Plan : Growth & Dividend. The Dividend Option offers Dividend Payout and Reinvestment facility.
MiNiMUM APPliCATiON AMOUNT
Purchase : ` 5,000 and any amount thereafter.Additional Purchase : ` 1,000 and any amount thereafter.
¥ Dedicated Fund Manager for Overseas Investments: Mr. Amar Kalkundrikar (Total Experience: Over 16 years).
CATEgORY OF SCHEME: VALUE FUND

May 2019 7
CATEgORY OF SCHEME: LARGE-cAP FUND
Face Value per Unit: ` 10 unless otherwise specified, + Industry classification as recommended by AMFI, Data is as of May 31, 2019 unless otherwise specified.
KEY FACTS
iNVESTMENT OBjECTiVETo provide long-term capital appreciation/income by investing predominantly in Large-cap companies.There is no assurance that the investment objective of the Scheme will be realized.
CATEgORY OF SCHEME: Large-cap Fund
FUND MANAgER § ¥
Prashant Jain (since June 20, 03)
Total Experience: Over 27 years
iNCEPTiON DATE (Date of Allotment)October 11, 1996
NAV (AS ON MAY 31, 2019) NAV PER UNIT (`)
Regular Plan - Growth Option 515.750Regular Plan - Dividend Option 50.220Direct Plan - Growth Option 538.186Direct Plan - Dividend Option 53.391
ASSETS UNDER MANAgEMENT (`) iN CROREAs on May 31, 2019 17,475.32Average for Month of May, 2019 16,669.41
qUANTiTATiVE DATAPortfolio Turnover Ratio (Last 1 year) 17.16%Risk Ration Standard Deviation 3.946%n Beta 0.983n Sharpe Ratio* 0.205computed for the 3-yr period ended May 31, 2019. Based on month-end NAV. * Risk free rate: 6.00%(Source: FIMMDA MIBOR)
TOTAL ExPENSE RATIO (As on May 31, 2019)Including Additional expenses and Goods and Service Tax on Management FeesRegular: 2.02% Direct: 1.38%
#BENCHMARK iNDEX: NIFTY 100 (Total Returns Index)
##ADDl. BENCHMARK iNDEX: S&P BSe SeNSex (Total Returns Index)
EXiT lOADl In respect of each purchase / switch-in of Units, an exit Load
of 1.00% is payable if Units are redeemed / switched-out within 1 year from the date of allotment.
l No exit Load is payable if Units are redeemed / switched-out after 1 year from the date of allotment.
For further details, please refer to para ‘Exit Load’ on Pg 52.
PLANS & OPTIONSRegular Plan, Direct Plan. Under each Plan : Growth & Dividend. The Dividend Option offers Dividend Payout and Reinvestment facility.
MiNiMUM APPliCATiON AMOUNTPurchase : ` 5,000 and any amount thereafter.Additional Purchase : ` 1,000 and any amount thereafter.
SEgMENT-WiSE BREAK-UP OF EqUiTY HOlDiNg (% OF NET ASSETS)Large cap 88.69%Mid cap 10.55%
§ Date of migration from Zurich India Mutual Fund (close of business hours - June 19, 03).¥ Dedicated Fund Manager for Overseas Investments: Mr. Amar Kalkundrikar (Total Experience: Over 16 years).
This product is suitable for investors who are seeking ~
l to generate long-term capital appreciation / income
l investment predominantly in Large-cap companies
Riskometer
Investors understand that their principal will be at moderately high risk
~ Investors should consult their financial advisers if in doubt about whether the product is suitable for them.
SiP PERFORMANCE ^ - Regular plan - growth OptionSince Inception
SIP15 year
SIP10 year
SIP5 year
SIP3 year
SIP1 year
SIPTotal Amount Invested (` ‘000) 2,720.00 1,800.00 1,200.00 600.00 360.00 120.00 Mkt Value As on May 31, 2019 (` ‘000) $$ 40,283.81 6,286.30 2,374.83 818.94 440.58 132.90 Returns (%) $$ 19.93 15.23 13.10 12.41 13.60 20.62 Benchmark Returns (%) # N.A. 13.24 12.51 12.05 12.88 14.00 Additional Benchmark Returns (%) ## 14.60 13.13 12.44 12.93 15.53 17.11
Assuming ` 10,000 invested systematically on the first Business Day of every month over a period of time. cAGR returns are computed after accounting for the cash flow by using xIRR method (investment internal rate of return) for Regular Plan - Growth Option. The above investment simulation is for illustrative purposes only and should not be construed as a promise on minimum returns and safeguard of capital.
PERFORMANCE ^ - Regular plan - growth OptionDate Period Scheme
Returns (%) $$
Benchmark Returns
(%)#
Additional Benchmark
Returns (%) ##
Value of ` 10,000 investedScheme (`)
$$Benchmark
(`)#Additional
Benchmark (`)##
May 31, 18 Last 1 Year 15.55 10.03 13.70 11,555 11,003 11,370May 31, 16 Last 3 Years 15.85 14.91 15.65 15,549 15,171 15,470May 30, 14 Last 5 Years 11.99 12.32 11.91 17,626 17,888 17,566Oct 11, 96 Since Inception 20.06 N.A. 12.65 628,858 N.A. 148,631
Returns greater than 1 year period are compounded annualized (cAGR). N.A. Not Available. $$ All dividends declared prior to the splitting of the Scheme into Dividend & Growth Options are assumed to be reinvested in the units of the Scheme at the then prevailing NAV (ex-dividend NAV). For performance of other schemes managed by Prashant Jain, please refer page 52. Different plans viz. Regular Plan and Direct Plan have a different expense structure. The expenses of the Direct Plan under the Scheme will be lower to the extent of the distribution expenses / commission charged in the Regular Plan. For Performance of Direct Plan, refer page no. 58. For FPI Portfolio, refer page no. 65.
^Past performance may or may not be sustained in the future. Load is not taken into consideration for computation of performance.
(An open ended equity scheme predominantly investing in large cap stocks)HDFC Top 100 Fund
Company Industry+ % to NAV
EqUiTY & EqUiTY RElATED• IcIcI Bank Ltd. Banks 8.04• State Bank of India Banks 7.96• Reliance Industries Ltd. Petroleum Products 7.78• Infosys Ltd. Software 6.86• HDFc Bank Ltd. Banks 6.74• Larsen and Toubro Ltd. construction Project 6.47• ITc Ltd. consumer Non Durables 4.27• NTPc Ltd. Power 4.21• Tata consultancy Services Ltd. Software 4.07• Axis Bank Ltd. Banks 3.86coal India Ltd. Minerals/Mining 2.86Housing Development Finance corporation Ltd. £ Finance 2.56Hindustan Petroleum corporation Ltd. Petroleum Products 2.35Power Finance corporation Ltd. Finance 2.06Tata Steel Ltd. Ferrous Metals 1.97GAIL (India) Ltd. Gas 1.81Bank of Baroda Banks 1.72Power Grid corporation of India Ltd. Power 1.62Bharat Petroleum corporation Ltd. Petroleum Products 1.51Aurobindo Pharma Ltd. Pharmaceuticals 1.40Rural electrification corporation Ltd. Finance 1.29cESc Ltd. Power 1.20Tata chemicals Ltd. chemicals 1.17canara Bank Banks 1.00Vedanta Ltd. Non - Ferrous Metals 0.95Oil & Natural Gas corporation Ltd. Oil 0.92UPL Ltd. Pesticides 0.83Tech Mahindra Ltd. Software 0.82Bharat electronics Ltd. Industrial capital Goods 0.79cipla Ltd. Pharmaceuticals 0.77ABB India Ltd. Industrial capital Goods 0.72Sun Pharmaceutical Industries Ltd. Pharmaceuticals 0.70Bank of India Banks 0.69HcL Technologies Ltd. Software 0.64InterGlobe Aviation Ltd. Transportation 0.61Wipro Ltd. Software 0.60Siemens Ltd. Industrial capital Goods 0.59Oracle Financial Services Software Ltd. Software 0.56Indian Oil corporation Ltd. Petroleum Products 0.54Hindalco Industries Ltd. Non - Ferrous Metals 0.50
Company Industry+ % to NAV
Punjab National Bank Banks 0.49Ambuja cements Ltd. cement 0.47Bharat Heavy electricals Ltd. Industrial capital Goods 0.43Lupin Ltd. Pharmaceuticals 0.43Union Bank of India Banks 0.42Steel Authority of India Ltd. Ferrous Metals 0.33Grasim Industries Ltd. cement 0.32NHPc Ltd. Power 0.25LIc Housing Finance Ltd. Finance 0.04container corporation of India Ltd. Transportation 0.03Sub Total 99.22Preference SharesZee entertainment enterprises Ltd. Media & entertainment 0.01Sub Total 0.01Total 99.23cash, cash Equivalents and Net current Assets 0.77Grand Total 100.00
• Top Ten Holdings, £ co-sponsor
PORTFOLIO
Industry Allocation of Equity Holding (% of Net Assets)
0.010.640.790.830.921.171.451.812.302.532.863.304.27
5.956.477.28
12.1813.55
30.92
0 5 10 15 20 25 30 35
Media & EntertainmentTransportation
CementPesticides
OilChemicals
Non - Ferrous MetalsGas
Ferrous MetalsIndustrial Capital Goods
Minerals/MiningPharmaceuticals
Consumer Non DurablesFinance
Construction ProjectPower
Petroleum ProductsSoftware
Banks

8 May 2019
CATEgORY OF SCHEME: MID cAP FUND
KEY FACTS
iNVESTMENT OBjECTiVETo provide long-term capital appreciation/income by investing predominantly in Mid-cap companies.There is no assurance that the investment objective of the Scheme will be realized.
CATEgORY OF SCHEME: Mid cap Fund
FUND MANAgER ¥
Chirag Setalvad (since June 25, 07)
Total Experience: Over 21 years
iNCEPTiON DATE (Date of Allotment)June 25, 2007
NAV (AS ON MAY 31, 2019) NAV PER UNIT (`)Regular Plan - Growth Option 55.321Regular Plan - Dividend Option 27.980Direct Plan - Growth Option 58.467Direct Plan - Dividend Option 34.561
ASSETS UNDER MANAgEMENT (`) iN CROREAs on May 31, 2019 22,825.43Average for Month of May, 2019 21,986.22
qUANTiTATiVE DATAPortfolio Turnover Ratio (Last 1 year) 4.11%Risk Ration Standard Deviation 4.667%n Beta 0.841n Sharpe Ratio* 0.135computed for the 3-yr period ended May 31, 2019. Based on month-end NAV. * Risk free rate: 6.00%(Source: FIMMDA MIBOR)
TOTAL ExPENSE RATIO (As on May 31, 2019)Including Additional expenses and Goods and Service Tax on Management FeesRegular: 1.84% Direct: 1.15%
#BENCHMARK iNDEX: NIFTY Midcap 100 (Total Returns Index) ##ADDl. BENCHMARK iNDEX: NIFTY 50 (Total Returns Index)
EXiT lOADl In respect of each purchase / switch-in of Units, an exit Load
of 1.00% is payable if Units are redeemed / switched-out within 1 year from the date of allotment.
l No exit Load is payable if Units are redeemed / switched-out after 1 year from the date of allotment.
For further details, please refer to para ‘Exit Load’ on Pg 52.
PLANS & OPTIONSRegular Plan, Direct Plan. Under each Plan : Growth & Dividend. The Dividend Option offers Dividend Payout and Reinvestment facility.
MiNiMUM APPliCATiON AMOUNTPurchase : ` 5,000 and any amount thereafter.Additional Purchase : ` 1,000 and any amount thereafter.
SEgMENT-WiSE BREAK-UP OF EqUiTY HOlDiNg (% OF NET ASSETS)Large cap 4.41%Mid cap 67.77%Small cap 20.02%¥ Dedicated Fund Manager for Overseas Investments: Mr. Amar Kalkundrikar (Total Experience: Over 16 years).
SiP PERFORMANCE ^ - Regular plan - growth Option
Since Inception SIP
10 year SIP
5 year SIP
3 year SIP
1 year SIP
Total Amount Invested (` ‘000) 1,440.00 1,200.00 600.00 360.00 120.00 Mkt Value As on May 31, 2019 (` ‘000) 4,542.09 2,971.11 770.01 390.02 122.75 Returns (%) 17.85 17.27 9.93 5.28 4.30 Benchmark Returns (%) # 12.94 12.60 8.28 3.25 1.10 Additional Benchmark Returns (%) ## 11.95 12.18 12.37 14.19 16.44
Assuming ` 10,000 invested systematically on the first Business Day of every month over a period of time. cAGR returns are computed after accounting for the cash flow by using xIRR method (investment internal rate of return) for Regular Plan - Growth Option. The above investment simulation is for illustrative purposes only and should not be construed as a promise on minimum returns and safeguard of capital.
PERFORMANCE ^ - Regular plan - growth Option
Date Period Scheme Returns
(%)
Benchmark Returns
(%)#
Additional Benchmark
Returns (%) ##
Value of ` 10,000 invested
Scheme (`) Benchmark (`)#
Additional Benchmark
(`)##
May 31, 18 Last 1 Year -3.24 -4.19 12.43 9,676 9,581 11,243May 31, 16 Last 3 Years 12.98 11.71 14.99 14,421 13,940 15,203May 30, 14 Last 5 Years 15.91 13.33 11.92 20,937 18,705 17,571Jun 25, 07 Since Inception 15.40 11.28 10.29 55,321 35,840 32,193
Returns greater than 1 year period are compounded annualized (cAGR). For performance of other schemes managed by chirag Setalvad, please refer page 52. Different plans viz. Regular Plan and Direct Plan have a different expense structure. The expenses of the Direct Plan under the Scheme will be lower to the extent of the distribution expenses / commission charged in the Regular Plan. For Performance of Direct Plan, refer page no. 58.
Face Value per Unit: ` 10 unless otherwise specified, + Industry classification as recommended by AMFI, Data is as of May 31, 2019 unless otherwise specified.
This product is suitable for investors who are seeking ~
l to generate long-term capital appreciation / income
l investment predominantly in Mid-cap companies
Riskometer
Investors understand that their principal will be at moderately high risk
~ Investors should consult their financial advisers if in doubt about whether the product is suitable for them.
^Past performance may or may not be sustained in the future. Load is not taken into consideration for computation of performance.
(An open ended equity scheme predominantly investing in mid cap stocks)HDFC Mid Cap Opportunities Fund
Company Industry+ / Rating % to NAV
EqUiTY & EqUiTY RElATED• cholamandalam Investment
and Financial company Ltd. Finance 4.39• Aarti Industries Ltd. chemicals 3.84• Sundram Fasteners Ltd. Auto Ancillaries 3.54• city Union Bank Ltd. Banks 3.03• RBL Bank Ltd. Banks 2.99• Balkrishna Industries Ltd. Auto Ancillaries 2.85• Voltas Ltd. consumer Durables 2.71• Indian Hotels company Ltd. Hotels/Resorts & Other
Recreational Activities 2.64• Torrent Pharmaceuticals Ltd. Pharmaceuticals 2.33• Hexaware Technologies Ltd. Software 2.19Trent Ltd. Retailing 2.13Tata chemicals Ltd. chemicals 2.08crompton Greaves consumer elec. Ltd. consumer Durables 1.97AIA engineering Ltd. Industrial Products 1.89The Federal Bank Ltd. Banks 1.89exide Industries Ltd. Auto Ancillaries 1.84Max Financial Services Ltd. Finance 1.75carborundum Universal Ltd. Industrial Products 1.68VST Industries Ltd. consumer Non Durables 1.65cholamandalam Financial Holdings Ltd. Finance 1.62Indian Bank Banks 1.61SKF India Ltd. Industrial Products 1.60Apollo Tyres Ltd. Auto Ancillaries 1.58Edelweiss Financial Services Ltd. Finance 1.54Ipca Laboratories Ltd. Pharmaceuticals 1.53Atul Ltd. chemicals 1.52Divis Laboratories Ltd. Pharmaceuticals 1.49Supreme Industries Ltd. Industrial Products 1.38Glenmark Pharmaceuticals Ltd. Pharmaceuticals 1.36KEc International Ltd. construction Project 1.27Tube Investments of India Ltd. Auto Ancillaries 1.23Whirlpool of India Ltd. consumer Durables 1.20Reliance Nippon Life Asset Management Ltd. Finance 1.19Blue Star Ltd. consumer Durables 1.15Larsen & Toubro Infotech Ltd. Software 1.13NIIT Technologies Ltd. Software 1.13KNR construction Ltd.. construction 1.10Dilip Buildcon Ltd. construction Project 1.09Karur Vysya Bank Ltd. Banks 1.07Power Finance corporation Ltd. Finance 1.07Aurobindo Pharma Ltd. Pharmaceuticals 1.03Solar Industries India Ltd. chemicals 1.01Arvind Fashions Ltd. Retailing 1.00Union Bank of India Banks 0.99Rural electrification corporation Ltd. Finance 0.97Gujarat Fluorochemicals Ltd. chemicals 0.91Jagran Prakashan Ltd. Media & entertainment 0.84Schaeffler India Ltd. Industrial Products 0.80
Company Industry+ / Rating % to NAV
Redington (India) Ltd. Transportation 0.78MRF Ltd. Auto Ancillaries 0.76Navneet education Ltd. Media & entertainment 0.76Punjab National Bank Banks 0.69Greenlam Industries Ltd. consumer Durables 0.68Symphony Ltd. consumer Durables 0.67Bata India Ltd. consumer Durables 0.58cummins India Ltd. Industrial Products 0.55Greenply Industries Ltd. consumer Durables 0.54Delta corp Ltd. Hotels/Resorts & Other
Recreational Activities 0.53Grindwell Norton Ltd. Industrial Products 0.49Vesuvius India Ltd. Industrial Products 0.44Arvind Ltd. Textile Products 0.39Mahindra Holidays & Resorts India Ltd.
Hotels/Resorts & Other Recreational Activities 0.37
Vardhman Textiles Ltd. Textiles - cotton 0.34Persistent Systems Ltd. Software 0.33Strides Pharma Science Ltd. Pharmaceuticals 0.21Dhanuka Agritech Ltd. Pesticides 0.17The Anup engineering Ltd. Industrial capital Goods 0.11Sub Total 92.19Preference SharesZee entertainment enterprises Ltd. Media & entertainment 0.01Sub Total 0.01Total 92.20cash, cash Equivalents and Net current Assets 7.80Grand Total 100.00• Top Ten Holdings
PORTFOLIO
Industry Allocation of Equity Holding (% of Net Assets)
0.110.170.340.390.781.101.611.652.363.133.54
4.787.95
8.839.369.50
11.8012.2712.53
0 2 4 6 8 10 12 14
Industrial Capital GoodsPesticides
Textiles - CottonTextile ProductsTransportation
ConstructionMedia & Entertainment
Consumer Non DurablesConstruction Project
RetailingHotels, Resorts & Other Recreational Activities
SoftwarePharmaceuticals
Industrial ProductsChemicals
Consumer DurablesAuto Ancillaries
BanksFinance
May 2019 9
CATEgORY OF SCHEME: SMALL cAP FUND
KEY FACTS
iNVESTMENT OBjECTiVETo provide long-term capital appreciation /income by investing predominantly in Small-cap companies.There is no assurance that the investment objective of the Scheme will be realized.
CATEgORY OF SCHEME: Small cap Fund
FUND MANAgER § ¥
Chirag Setalvad (since June 28, 14)
Total Experience: Over 21 years
iNCEPTiON DATE (Date of Allotment)April 3, 2008
NAV (AS ON MAY 31, 2019) NAV PER UNIT (`)Regular Plan - Growth Option 44.091Regular Plan - Dividend Option 23.211Direct Plan - Growth Option 47.276Direct Plan - Dividend Option 29.155
ASSETS UNDER MANAgEMENT (`) iN CROREAs on May 31, 2019 8,402.65Average for Month of May, 2019 7,815.10
qUANTiTATiVE DATAPortfolio Turnover Ratio (Last 1 year) 3.93%Risk Ration Standard Deviation 4.490%n Beta 0.596n Sharpe Ratio* 0.221computed for the 3-yr period ended May 31, 2019. Based on month-end NAV. * Risk free rate: 6.00%(Source: FIMMDA MIBOR)
TOTAL ExPENSE RATIO (As on May 31, 2019)Including Additional expenses and Goods and Service Tax on Management FeesRegular: 1.94% Direct: 0.84%
#BENCHMARK iNDEX: NIFTY Smallcap 100 (Total Returns Index)##ADDl. BENCHMARK iNDEX: NIFTY 50 (Total Returns Index)
EXiT lOADl In respect of each purchase / switch-in of Units, an exit Load
of 1.00% is payable if Units are redeemed / switched-out within 1 year from the date of allotment.
l No exit Load is payable if Units are redeemed / switched-out after 1 year from the date of allotment.
For further details, please refer to para ‘Exit Load’ on Pg 52.
PLANS & OPTIONSRegular Plan, Direct Plan. Under each Plan : Growth & Dividend. The Dividend Option offers Dividend Payout and Reinvestment facility.
MiNiMUM APPliCATiON AMOUNTPurchase : ` 5,000 and any amount thereafter.Additional Purchase : ` 1,000 and any amount thereafter.
SEgMENT-WiSE BREAK-UP OF EqUiTY HOlDiNg (% OF NET ASSETS)Large cap 5.45%Mid cap 17.22%Small cap 65.95%§ Date of migration from Morgan Stanley Mutual Fund
(close of business hours - June 27, 14)¥ Dedicated Fund Manager for Overseas Investments:
Mr. Amar Kalkundrikar (Total Experience: Over 16 years).
SiP PERFORMANCE ^ - Regular plan - growth Option
Since Inception SIP
10 year SIP
5 year SIP
3 year SIP
1 year SIP
Total Amount Invested (` ‘000) 1,340.00 1,200.00 600.00 360.00 120.00 Mkt Value As on May 31, 2019 (` ‘000) 3,562.74 2,738.16 851.32 422.89 122.54 Returns (%) 16.51 15.75 13.98 10.76 3.97 Benchmark Returns (%) # 9.99 9.16 3.44 -2.64 -2.39 Additional Benchmark Returns (%) ## 12.53 12.18 12.37 14.19 16.44
Assuming ` 10,000 invested systematically on the first Business Day of every month over a period of time. cAGR returns are computed after accounting for the cash flow by using xIRR method (investment internal rate of return) for Regular Plan - Growth Option. The above investment simulation is for illustrative purposes only and should not be construed as a promise on minimum returns and safeguard of capital.
PERFORMANCE ^ - Regular plan - growth Option
Date Period Scheme Returns
(%)
Benchmark Returns
(%)#
Additional Benchmark
Returns (%) ##
Value of ` 10,000 invested
Scheme (`) Benchmark (`)#
Additional Benchmark
(`)##
May 31, 18 Last 1 Year -4.37 -15.50 12.43 9,563 8,450 11,243May 31, 16 Last 3 Years 18.10 8.81 14.99 16,473 12,884 15,203May 30, 14 Last 5 Years 17.40 7.39 11.92 22,318 14,291 17,571Apr 03, 08 Since Inception 14.21 6.58 9.85 44,091 20,362 28,553
Returns greater than 1 year period are compounded annualized (cAGR). For performance of other schemes managed by chirag Setalvad, please refer page 52. Different plans viz. Regular Plan and Direct Plan have a different expense structure. The expenses of the Direct Plan under the Scheme will be lower to the extent of the distribution expenses / commission charged in the Regular Plan. For Performance of Direct Plan, refer page no. 58.
Face Value per Unit: ` 10 unless otherwise specified, + Industry classification as recommended by AMFI, Data is as of May 31, 2019 unless otherwise specified.
This product is suitable for investors who are seeking ~
l to generate long-term capital appreciation / income
l investment predominantly in Small-cap companies
Riskometer
Investors understand that their principal will be at moderately high risk
~ Investors should consult their financial advisers if in doubt about whether the product is suitable for them.
^Past performance may or may not be sustained in the future. Load is not taken into consideration for computation of performance.
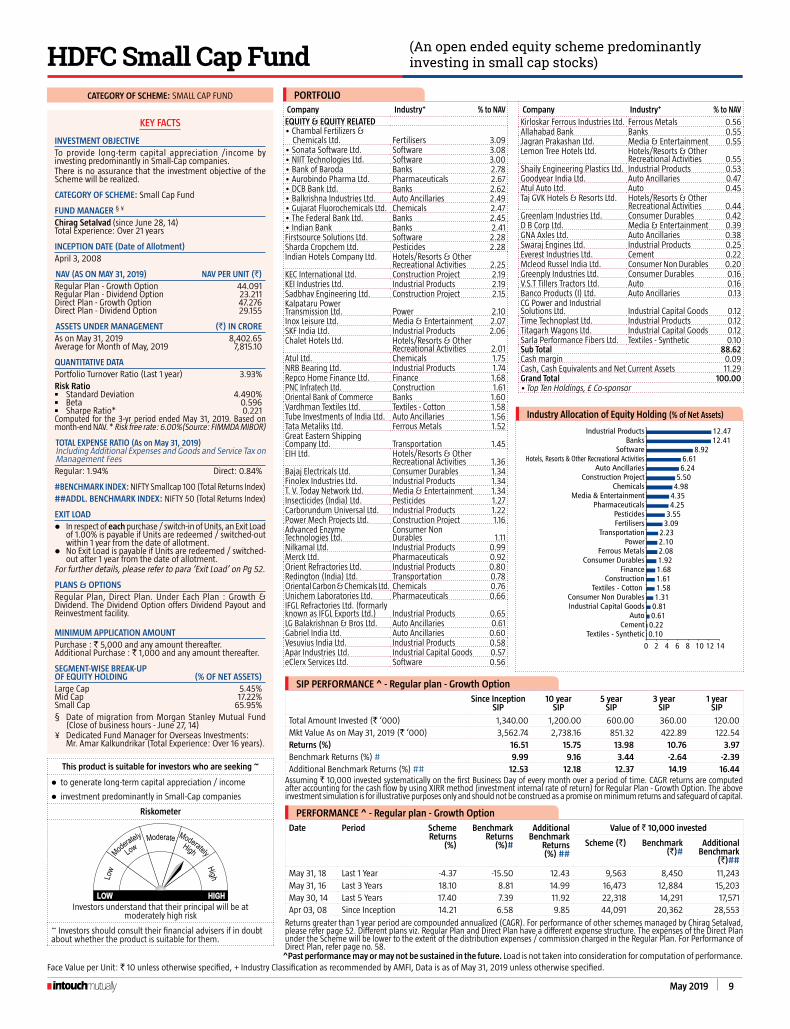
(An open ended equity scheme predominantly investing in small cap stocks)HDFC Small Cap Fund
Company Industry+ % to NAVEqUiTY & EqUiTY RElATED• chambal Fertilizers &
chemicals Ltd. Fertilisers 3.09• Sonata Software Ltd. Software 3.08• NIIT Technologies Ltd. Software 3.00• Bank of Baroda Banks 2.78• Aurobindo Pharma Ltd. Pharmaceuticals 2.67• DcB Bank Ltd. Banks 2.62• Balkrishna Industries Ltd. Auto Ancillaries 2.49• Gujarat Fluorochemicals Ltd. chemicals 2.47• The Federal Bank Ltd. Banks 2.45• Indian Bank Banks 2.41Firstsource Solutions Ltd. Software 2.28Sharda cropchem Ltd. Pesticides 2.28Indian Hotels company Ltd. Hotels/Resorts & Other
Recreational Activities 2.25KEc International Ltd. construction Project 2.19KeI Industries Ltd. Industrial Products 2.19Sadbhav engineering Ltd. construction Project 2.15Kalpataru Power Transmission Ltd. Power 2.10Inox Leisure Ltd. Media & entertainment 2.07SKF India Ltd. Industrial Products 2.06chalet Hotels Ltd. Hotels/Resorts & Other
Recreational Activities 2.01Atul Ltd. chemicals 1.75NRB Bearing Ltd. Industrial Products 1.74Repco Home Finance Ltd. Finance 1.68PNc Infratech Ltd. construction 1.61Oriental Bank of commerce Banks 1.60Vardhman Textiles Ltd. Textiles - cotton 1.58Tube Investments of India Ltd. Auto Ancillaries 1.56Tata Metaliks Ltd. Ferrous Metals 1.52Great eastern Shipping company Ltd. Transportation 1.45eIH Ltd. Hotels/Resorts & Other
Recreational Activities 1.36Bajaj electricals Ltd. consumer Durables 1.34Finolex Industries Ltd. Industrial Products 1.34T. V. Today Network Ltd. Media & entertainment 1.34Insecticides (India) Ltd. Pesticides 1.27carborundum Universal Ltd. Industrial Products 1.22Power Mech Projects Ltd. construction Project 1.16Advanced enzyme Technologies Ltd.
consumer Non Durables 1.11
Nilkamal Ltd. Industrial Products 0.99Merck Ltd. Pharmaceuticals 0.92Orient Refractories Ltd. Industrial Products 0.80Redington (India) Ltd. Transportation 0.78Oriental carbon & chemicals Ltd. chemicals 0.76Unichem Laboratories Ltd. Pharmaceuticals 0.66IFGL Refractories Ltd. (formarly known as IFGL Exports Ltd.) Industrial Products 0.65LG Balakrishnan & Bros Ltd. Auto Ancillaries 0.61Gabriel India Ltd. Auto Ancillaries 0.60Vesuvius India Ltd. Industrial Products 0.58Apar Industries Ltd. Industrial capital Goods 0.57eclerx Services Ltd. Software 0.56
Company Industry+ % to NAVKirloskar Ferrous Industries Ltd. Ferrous Metals 0.56Allahabad Bank Banks 0.55Jagran Prakashan Ltd. Media & entertainment 0.55Lemon Tree Hotels Ltd. Hotels/Resorts & Other
Recreational Activities 0.55Shaily engineering Plastics Ltd. Industrial Products 0.53Goodyear India Ltd. Auto Ancillaries 0.47Atul Auto Ltd. Auto 0.45Taj GVK Hotels & Resorts Ltd. Hotels/Resorts & Other
Recreational Activities 0.44Greenlam Industries Ltd. consumer Durables 0.42D B corp Ltd. Media & entertainment 0.39GNA Axles Ltd. Auto Ancillaries 0.38Swaraj engines Ltd. Industrial Products 0.25everest Industries Ltd. cement 0.22Mcleod Russel India Ltd. consumer Non Durables 0.20Greenply Industries Ltd. consumer Durables 0.16V.S.T Tillers Tractors Ltd. Auto 0.16Banco Products (I) Ltd. Auto Ancillaries 0.13cG Power and Industrial Solutions Ltd. Industrial capital Goods 0.12Time Technoplast Ltd. Industrial Products 0.12Titagarh Wagons Ltd. Industrial capital Goods 0.12Sarla Performance Fibers Ltd. Textiles - Synthetic 0.10Sub Total 88.62cash margin 0.09cash, cash Equivalents and Net current Assets 11.29Grand Total 100.00• Top Ten Holdings, £ co-sponsor
PORTFOLIO
Industry Allocation of Equity Holding (% of Net Assets)
0.100.220.610.811.311.581.611.681.922.082.102.23
3.093.554.254.354.985.506.246.61
8.9212.4112.47
0 2 4 6 8 10 12 14
Textiles - SyntheticCement
AutoIndustrial Capital GoodsConsumer Non Durables
Textiles - Cotton Construction
FinanceConsumer Durables
Ferrous MetalsPower
TransportationFertilisersPesticides
PharmaceuticalsMedia & Entertainment
ChemicalsConstruction Project
Auto AncillariesHotels, Resorts & Other Recreational Activities
SoftwareBanks
Industrial Products

10 May 2019
CATEgORY OF SCHEME: LARGE & MID cAP FUND
KEY FACTS
iNVESTMENT OBjECTiVETo generate long term capital appreciation/income from a portfolio, predominantly invested in equity and equity related instruments. There is no assurance that the investment objective of the Scheme will be realized.
CATEgORY OF SCHEME: Large & Mid cap Fund
FUND MANAgER § ¥
Vinay Kulkarni (since June 28, 14)
Total Experience: Over 29 years
iNCEPTiON DATE (Date of Allotment)February 18, 1994
NAV (AS ON MAY 31, 2019) NAV PER UNIT (`)Regular Plan - Growth Option 115.897Regular Plan - Dividend Option 19.468Direct Plan - Growth Option 117.140Direct Plan - Dividend Option 22.641
ASSETS UNDER MANAgEMENT (`) iN CROREAs on May 31, 2019 1,326.49Average for Month of May, 2019 1,281.03
qUANTiTATiVE DATAPortfolio Turnover Ratio (Last 1 year) 40.08%Risk Ration Standard Deviation 3.861%n Beta 0.971n Sharpe Ratio* 0.104computed for the 3-yr period ended May 31, 2019. Based on month-end NAV. * Risk free rate: 6.00%(Source: FIMMDA MIBOR)
TOTAL ExPENSE RATIO (As on May 31, 2019)Including Additional expenses and Goods and Service Tax on Management FeesRegular: 2.61% Direct: 2.21%
#BENCHMARK iNDEX: NIFTY Large Midcap 250 (Total Returns Index)##ADDl. BENCHMARK iNDEX: S&P BSe SeNSex (Total Returns Index)
EXiT lOADl In respect of each purchase / switch-in of Units, an exit Load
of 1.00% is payable if Units are redeemed / switched-out within 1 year from the date of allotment.
l No exit Load is payable if Units are redeemed / switched-out after 1 year from the date of allotment.
For further details, please refer to para ‘Exit Load’ on Pg 52.
PLANS & OPTIONSRegular Plan, Direct Plan. Under each Plan : Growth & Dividend. The Dividend Option offers Dividend Payout and Reinvestment facility.
MiNiMUM APPliCATiON AMOUNTPurchase : ` 5,000 and any amount thereafter.Additional Purchase : ` 1,000 and any amount thereafter.
SEgMENT-WiSE BREAK-UP OF EqUiTY HOlDiNg (% OF NET ASSETS)Large cap 60.18%Mid cap 35.75%Small cap 3.52%§ Date of migration from Morgan Stanley Mutual Fund (close of business hours - June 27, 14)¥ Dedicated Fund Manager for Overseas Investments: Mr. Amar Kalkundrikar (Total Experience: Over 16 years).
PERFORMANCE ^ - Regular plan - growth Option
Date Period Scheme Returns
(%) $$
Benchmark Returns
(%)#
Additional Benchmark
Returns (%) ##
Value of ` 10,000 invested
Scheme (`) $$
Benchmark (`)#
Additional Benchmark
(`)##
May 31, 18 Last 1 Year 5.06 3.46 13.70 10,506 10,346 11,370May 31, 16 Last 3 Years 10.41 14.72 15.65 13,459 15,096 15,470May 30, 14 Last 5 Years 11.78 14.03 11.91 17,460 19,298 17,566Feb 18, 94 Since Inception 11.34 N.A. 11.21 151,517 N.A. 146,876
Returns greater than 1 year period are compounded annualized (cAGR). N.A. Not Available. The Scheme, formerly a large cap fund, has undergone change in Fundamental attributes w.e.f. May 23, 2018 and become a Large and Mid-cap Fund. Accordingly, the Scheme’s benchmark has also changed. Hence, the past performance of the Scheme may not strictly be comparable with that of the new benchmark. $$ All dividends declared prior to the splitting of the Scheme into Dividend & Growth Options are assumed to be reinvested in the units of the Scheme at the then prevailing NAV. For performance of other schemes managed by Vinay Kulkarni, please refer page 52. Different plans viz. Regular Plan and Direct Plan have a different expense structure. The expenses of the Direct Plan under the Scheme will be lower to the extent of the distribution expenses / commission charged in the Regular Plan. For Performance of Direct Plan, refer page no. 58. As TRI data is not available since inception of the scheme, additional benchmark performance is calculated using composite cAGR of S&P BSe SeNSex PRI values from Feb 18, 94 to Aug 18, 96 and TRI values since Aug 19, 96.
Face Value per Unit: ` 10 unless otherwise specified, + Industry classification as recommended by AMFI, Data is as of May 31, 2019 unless otherwise specified.
This product is suitable for investors who are seeking ~
l to generate long-term capital appreciation/income
l investment predominantly in Large cap and Mid cap companies
Riskometer
Investors understand that their principal will be at moderately high risk
~ Investors should consult their financial advisers if in doubt about whether the product is suitable for them. ^Past performance may or may not be sustained in the future. Load is not taken into consideration for computation of performance.
(An open ended equity scheme investing in both large cap and mid cap stocks)HDFC Growth Opportunities Fund
Company Industry+ % to NAV
EqUiTY & EqUiTY RElATED
• State Bank of India Banks 9.29• NTPc Ltd. Power 7.81• IcIcI Bank Ltd. Banks 7.60• Infosys Ltd. Software 6.49• Reliance Industries Ltd. Petroleum Products 5.51• ITc Ltd. consumer Non Durables 5.04• HDFc Bank Ltd. Banks 4.30• GAIL (India) Ltd. Gas 3.64• Bharat Petroleum
corporation Ltd. Petroleum Products 3.36• Indian Hotels company Ltd. Hotels/Resorts & Other
Recreational Activities 2.66Prestige estates Projects Ltd. construction 2.19Trent Ltd. Retailing 2.15Apollo Tyres Ltd. Auto Ancillaries 2.05Max Financial Services Ltd. Finance 1.89Tata Global Beverages Ltd. consumer Non Durables 1.84NHPc Ltd. Power 1.80Gujarat State Petronet Ltd. Gas 1.77Bharat Heavy electricals Ltd. Industrial capital Goods 1.75Hindustan Petroleum corporation Ltd. Petroleum Products 1.66Tata chemicals Ltd. chemicals 1.62Info edge (India) Ltd. Software 1.55Divis Laboratories Ltd. Pharmaceuticals 1.50Mindtree consulting Ltd. Software 1.47Tata Motors Ltd. DVR Auto 1.47castrol India Ltd. Petroleum Products 1.32exide Industries Ltd. Auto Ancillaries 1.28Glenmark Pharmaceuticals Ltd. Pharmaceuticals 1.28Indraprastha Gas Ltd. Gas 1.27Vedanta Ltd. Non - Ferrous Metals 1.26Solar Industries India Ltd. chemicals 1.21Torrent Pharmaceuticals Ltd. Pharmaceuticals 1.17canara Bank Banks 1.16Oil India Ltd. Oil 1.16Shriram Transport Finance company Ltd. Finance 0.88Reliance Nippon Life Asset Management Ltd. Finance 0.87cESc Ltd. Power 0.79
Company Industry+ % to NAV
emami Ltd. consumer Non Durables 0.72Dilip Buildcon Ltd. construction Project 0.71Power Grid corporation of India Ltd. Power 0.71Mahanagar Gas Ltd. Gas 0.62NBcc (India) Ltd. construction 0.60Indian Bank Banks 0.48Union Bank of India Banks 0.41NLc India Ltd. Power 0.37Tata Steel Ltd. Ferrous Metals 0.37Reliance Power Ltd. Power 0.23Larsen and Toubro Ltd. construction Project 0.18Sub Total 99.46cash, cash Equivalents and Net current Assets 0.54
Grand Total 100.00
• Top Ten Holdings
PORTFOLIO
Industry Allocation of Equity Holding (% of Net Assets)
0.370.891.161.261.471.752.152.662.792.833.333.643.95
7.307.60
9.5111.7111.85
23.24
0 5 10 15 20 25
Ferrous MetalsConstruction Project
OilNon - Ferrous Metals
AutoIndustrial Capital Goods
RetailingHotels, Resorts & Other Recreational Activities
ConstructionChemicals
Auto AncillariesFinance
PharmaceuticalsGas
Consumer Non DurablesSoftware
PowerPetroleum Products
Banks
SiP PERFORMANCE ^ - Regular plan - growth OptionSince Inception
SIP15 year
SIP10 year
SIP5 year
SIP3 year
SIP1 year
SIPTotal Amount Invested (` ‘000) 3,040.00 1,800.00 1,200.00 600.00 360.00 120.00 Mkt Value As on May 31, 2019 (` ‘000) $$ 20,560.62 4,266.25 2,097.34 747.10 407.18 126.85 Returns (%) $$ 12.91 10.71 10.76 8.71 8.18 10.80 Benchmark Returns (%) # N.A. N.A. 13.68 11.50 9.64 8.34 Additional Benchmark Returns (%) ## 13.77 13.13 12.44 12.93 15.53 17.11
Assuming ` 10,000 invested systematically on the first Business Day of every month over a period of time. cAGR returns are computed after accounting for the cash flow by using xIRR method (investment internal rate of return) for Regular Plan - Growth Option. The above investment simulation is for illustrative purposes only and should not be construed as a promise on minimum returns and safeguard of capital.

May 2019 11
CATEgORY OF SCHEME: FOcUSED FUND
KEY FACTS
iNVESTMENT OBjECTiVE
To generate long term capital appreciation/income by investing in equity & equity related instruments of up to 30 companies.
There is no assurance that the investment objective of the Scheme will be realized.
CATEgORY OF SCHEME: Focused Fund
FUND MANAgER ¥
Vinay Kulkarni (since November 21, 06)
Total Experience: Over 29 years
iNCEPTiON DATE (Date of Allotment)
September 17, 2004
NAV (AS ON MAY 31, 2019) NAV PER UNIT (`)
Regular Plan - Growth Option 80.032Regular Plan - Dividend Option 16.972Direct Plan - Growth Option 84.527Direct Plan - Dividend Option 18.610
ASSETS UNDER MANAgEMENT (`) iN CRORE
As on May 31, 2019 475.42Average for Month of May, 2019 455.39
qUANTiTATiVE DATA
Portfolio Turnover Ratio (Last 1 year) 36.82%
Risk Ration Standard Deviation 3.840%n Beta 0.873n Sharpe Ratio* 0.100
computed for the 3-yr period ended May 31, 2019. Based on month-end NAV. * Risk free rate: 6.00%(Source: FIMMDA MIBOR)
TOTAL ExPENSE RATIO (As on May 31, 2019)Including Additional expenses and Goods and Service Tax on Management Fees
Regular: 2.86% Direct: 1.81%
#BENCHMARK iNDEX: NIFTY 500 (Total Returns Index)
##ADDl. BENCHMARK iNDEX: S&P BSe SeNSex (Total Returns Index)
EXiT lOAD
l In respect of each purchase / switch-in of Units, an exit Load of 1.00% is payable if Units are redeemed / switched-out within 1 year from the date of allotment.
l No exit Load is payable if Units are redeemed / switched-out after 1 year from the date of allotment.
For further details, please refer to para ‘Exit Load’ on Pg 52.
PLANS & OPTIONS
Regular Plan, Direct Plan. Under each Plan : Growth & Dividend. The Dividend Option offers Dividend Payout and Reinvestment facility.
MiNiMUM APPliCATiON AMOUNT
Purchase : ` 5,000 and any amount thereafter.Additional Purchase : ` 1,000 and any amount thereafter.
¥ Dedicated Fund Manager for Overseas Investments: Mr. Amar Kalkundrikar (Total Experience: Over 16 years).
SiP PERFORMANCE ^ - Regular plan - growth Option
Since Inception SIP
10 year SIP
5 year SIP
3 year SIP
1 year SIP
Total Amount Invested (` ‘000) 1,770.00 1,200.00 600.00 360.00 120.00
Mkt Value As on May 31, 2019 (` ‘000) 4,490.21 2,067.69 726.95 393.68 127.27
Returns (%) 11.72 10.49 7.62 5.91 11.48
Benchmark Returns (%) # 12.49 12.23 11.24 10.91 11.44
Additional Benchmark Returns (%) ## 12.86 12.44 12.93 15.53 17.11
Assuming ` 10,000 invested systematically on the first Business Day of every month over a period of time. cAGR returns are computed after accounting for the cash flow by using xIRR method (investment internal rate of return) for Regular Plan - Growth Option. The above investment simulation is for illustrative purposes only and should not be construed as a promise on minimum returns and safeguard of capital.
PERFORMANCE ^ - Regular plan - growth Option
Date Period Scheme Returns
(%)
Benchmark Returns
(%)#
Additional Benchmark
Returns (%) ##
Value of ` 10,000 invested
Scheme (`) Benchmark (`)#
Additional Benchmark
(`)##
May 31, 18 Last 1 Year 2.63 6.46 13.70 10,263 10,646 11,370
May 31, 16 Last 3 Years 10.23 14.35 15.65 13,394 14,954 15,470
May 30, 14 Last 5 Years 9.70 12.35 11.91 15,893 17,910 17,566
Sep 17, 04 Since Inception 15.19 15.26 15.61 80,032 80,743 84,470
Returns greater than 1 year period are compounded annualized (cAGR). For performance of other schemes managed by Vinay Kulkarni, please refer page 52. Different plans viz. Regular Plan and Direct Plan have a different expense structure. The expenses of the Direct Plan under the Scheme will be lower to the extent of the distribution expenses / commission charged in the Regular Plan. For Performance of Direct Plan, refer page no. 58.
Face Value per Unit: ` 10 unless otherwise specified, + Industry classification as recommended by AMFI, Data is as of May 31, 2019 unless otherwise specified.
This product is suitable for investors who are seeking ~
l to generate long-term capital appreciation / income
l investments in equity & equity related instruments of up to 30 companies
Riskometer
Investors understand that their principal will be at moderately high risk
~ Investors should consult their financial advisers if in doubt about whether the product is suitable for them.
^Past performance may or may not be sustained in the future. Load is not taken into consideration for computation of performance.
An open ended equity scheme investing in maximum 30 stocks in large-cap, mid-cap and small-cap category (i.e. Multi-Cap)HDFC Focused 30 Fund
Company Industry+ / Rating % to NAV
EqUiTY & EqUiTY RElATED
• State Bank of India Banks 8.61
• IcIcI Bank Ltd. Banks 8.44
• HDFc Bank Ltd. Banks 8.16
• NTPc Ltd. Power 7.20
• Infosys Ltd. Software 6.76
• ITc Ltd. consumer Non Durables 5.46
• Tata Steel Ltd. Ferrous Metals 4.61
• Hindustan Petroleum corporation Ltd. Petroleum Products 4.09
• Bharat Petroleum corporation Ltd. Petroleum Products 3.82
• Kalpataru Power Transmission Ltd. Power 3.40
NHPc Ltd. Power 3.40
Vedanta Ltd. Non - Ferrous Metals 3.28
Bharat electronics Ltd. Industrial capital Goods 3.14
GAIL (India) Ltd. Gas 3.03
KEc International Ltd. construction Project 3.03
PNc Infratech Ltd. construction 2.81
Elecon Engineering comapny Ltd. Industrial capital Goods 2.62
Titagarh Wagons Ltd. Industrial capital Goods 2.57
Axis Bank Ltd. Banks 2.55
cESc Ltd. Power 2.19
Gujarat Pipavav Port Ltd. Transportation 2.04
coal India Ltd. Minerals/Mining 1.54
Tata Motors Ltd. DVR Auto 1.41
Transport corporation of India Ltd. Transportation 1.34
Company Industry+ / Rating % to NAV
Garden Reach Shipbuilders & engineers Ltd. Aerospace & Defence 1.24
Bharat Heavy electricals Ltd. Industrial capital Goods 1.18
Tata Motors Ltd. Auto 0.73
Sub Total 98.65
cash, cash Equivalents and Net current Assets 1.35
Grand Total 100.00
• Top Ten Holdings
PORTFOLIO
Industry Allocation of Equity Holding (% of Net Assets)
1.24
1.54
2.14
2.81
3.03
3.03
3.28
3.38
4.61
5.46
6.76
7.91
9.51
16.19
27.76
0 5 10 15 20 25 30
Aerospace & Defence
Minerals/Mining
Auto
Construction
Construction Project
Gas
Non - Ferrous Metals
Transportation
Ferrous Metals
Consumer Non Durables
Software
Petroleum Products
Industrial Capital Goods
Power
Banks

12 May 2019
CATEgORY OF SCHEME: THEMATIc FUND
KEY FACTS
iNVESTMENT OBjECTiVETo seek long-term capital appreciation/income by investing predominantly in equity and equity related securities of companies engaged in or expected to benefit from the growth and development of infrastructure.There is no assurance that the investment objective of the Scheme will be realized.
CATEgORY OF SCHEME: Thematic Fund
FUND MANAgER ¥
Srinivas Rao Ravuri (since March 10, 2008 *)
Total Experience: Over 23 years*Mr. Srinivas Rao Ravuri has ceased to be the Fund Manager of the above-mentioned Scheme with effect from close of business hours on May 31, 2019. The scheme will be co-managed by Mr. Rakesh Vyas & Mr. Prashant Jain w.e.f. June 01, 2019
iNCEPTiON DATE (Date of Allotment)March 10, 2008
NAV (AS ON MAY 31, 2019) NAV PER UNIT (`)Regular Plan - Growth Option 17.584Regular Plan - Dividend Option 10.496Direct Plan - Growth Option 18.523Direct Plan - Dividend Option 14.211
ASSETS UNDER MANAgEMENT (`) iN CROREAs on May 31, 2019 873.42Average for Month of May, 2019 823.92
qUANTiTATiVE DATAPortfolio Turnover Ratio (Last 1 year) 20.38%Risk Ration Standard Deviation 6.409%n Beta 1.418n Sharpe Ratio* 0.028computed for the 3-yr period ended May 31, 2019. Based on month-end NAV. * Risk free rate: 6.00%(Source: FIMMDA MIBOR)
TOTAL ExPENSE RATIO (As on May 31, 2019)Including Additional expenses and Goods and Service Tax on Management FeesRegular: 2.45% Direct: 1.71%
#BENCHMARK iNDEX: NIFTY 500 (Total Returns Index)##ADDl. BENCHMARK iNDEX: NIFTY 50 (Total Returns Index)
EXiT lOADl In respect of each purchase / switch-in of Units, an exit Load
of 1.00% is payable if Units are redeemed / switched-out within 1 year from the date of allotment.
l No exit Load is payable if Units are redeemed / switched-out after 1 year from the date of allotment.
For further details, please refer to para ‘Exit Load’ on Pg 52.
PLANS & OPTIONSRegular Plan, Direct Plan. Under each Plan : Growth & Dividend. The Dividend Option offers Dividend Payout and Reinvestment facility.
MiNiMUM APPliCATiON AMOUNTPurchase : ` 5,000 and any amount thereafter.Additional Purchase : ` 1,000 and any amount thereafter.
¥ Dedicated Fund Manager for Overseas Investments: Mr. Amar Kalkundrikar (Total Experience: Over 16 years).
SiP PERFORMANCE ^ - Regular plan - growth Option
Since Inception SIP
10 year SIP
5 year SIP
3 year SIP
1 year SIP
Total Amount Invested (` ‘000) 1,350.00 1,200.00 600.00 360.00 120.00 Mkt Value As on May 31, 2019 (` ‘000) 2,066.39 1,675.51 633.92 360.92 129.33 Returns (%) 7.31 6.50 2.17 0.17 14.80 Benchmark Returns (%) # 12.66 12.23 11.24 10.91 11.44 Additional Benchmark Returns (%) ## 12.47 12.18 12.37 14.19 16.44
Assuming ` 10,000 invested systematically on the first Business Day of every month over a period of time. cAGR returns are computed after accounting for the cash flow by using xIRR method (investment internal rate of return) for Regular Plan - Growth Option. The above investment simulation is for illustrative purposes only and should not be construed as a promise on minimum returns and safeguard of capital.
PERFORMANCE ^ - Regular plan - growth Option
Date Period Scheme Returns
(%)
Benchmark Returns
(%)#
Additional Benchmark
Returns (%) ##
Value of ` 10,000 invested
Scheme (`) Benchmark (`)#
Additional Benchmark
(`)##
May 31, 18 Last 1 Year -4.45 6.46 12.43 9,555 10,646 11,243May 31, 16 Last 3 Years 5.91 14.35 14.99 11,879 14,954 15,203May 30, 14 Last 5 Years 5.38 12.35 11.92 13,000 17,910 17,571Mar 10, 08 Since Inception 5.15 9.76 9.74 17,584 28,454 28,387
Returns greater than 1 year period are compounded annualized (cAGR). For performance of other schemes managed by Srinivas Rao Ravuri, please refer page 52. Different plans viz. Regular Plan and Direct Plan have a different expense structure. The expenses of the Direct Plan under the Scheme will be lower to the extent of the distribution expenses / commission charged in the Regular Plan. For Performance of Direct Plan, refer page no. 64.
Face Value per Unit: ` 10 unless otherwise specified, + Industry classification as recommended by AMFI, Data is as of May 31, 2019 unless otherwise specified.
This product is suitable for investors who are seeking ~
l to generate long-term capital appreciation / income
l investment predominantly in equity and equity related securities of companies engaged in or expected to benefit from the growth and development of infrastructure
Riskometer
Investors understand that their principal will be at high risk
~ Investors should consult their financial advisers if in doubt about whether the product is suitable for them. ^Past performance may or may not be sustained in the future. Load is not taken into consideration for computation of performance.
(An open ended equity scheme following infrastructure theme)HDFC Infrastructure Fund
Company Industry+ % to NAV
EqUiTY & EqUiTY RElATED
• IcIcI Bank Ltd. Banks 9.36
• State Bank of India Banks 9.13
• Larsen and Toubro Ltd. construction Project 8.64
• cESc Ltd. Power 4.73
• JMc Projects (India) Ltd. construction 4.57
• NTPc Ltd. Power 4.14
• Bharat Petroleum corporation Ltd. Petroleum Products 4.07
• Bank of Baroda Banks 4.04
• Texmaco Rail & engineering Ltd. Industrial capital Goods 3.81
• centum Electronics Ltd. Industrial capital Goods 3.35
coal India Ltd. Minerals/Mining 2.95
Hindustan construction company Ltd. construction Project 2.68
Rural electrification corporation Ltd. Finance 2.51
canara Bank Banks 2.35
Dilip Buildcon Ltd. construction Project 2.24
BeML Ltd. Industrial capital Goods 2.19
Power Finance corporation Ltd. Finance 2.09
Premier explosives Ltd. chemicals 2.02
Gujarat State Petronet Ltd. Gas 1.99
Dynamatic Technologies Ltd. Auto Ancillaries 1.98
J.Kumar Infraprojects Ltd. construction 1.91
Ashoka Buildcon Ltd. construction Project 1.89
Gujarat Pipavav Port Ltd. Transportation 1.82
Tata Steel Ltd. Ferrous Metals 1.56
Vedanta Ltd. Non - Ferrous Metals 1.41
Siemens Ltd. Industrial capital Goods 1.23
RITeS Ltd. construction Project 1.21
IRcON International Ltd. construction Project 1.10
Punjab National Bank Banks 1.08
Simplex Infrastructures Ltd. construction 0.99
cG Power and Industrial Solutions Ltd. Industrial capital Goods 0.93
Company Industry+ % to NAV
Sadbhav Infrastructure Project Ltd. (corporate Guarantee of Sadbhav engineering Ltd.) construction Project 0.85
B L Kashyap & Sons Ltd. construction 0.82
MeP Infrastructure Developers Ltd. Transportation 0.69
corporation Bank Banks 0.47
Transformers & Rectifiers India Ltd. Industrial capital Goods 0.28
Oriental Bank of commerce Banks 0.27
Elecon Engineering comapny Ltd. Industrial capital Goods 0.06
Sub Total 97.41
cash, cash Equivalents and Net current Assets 2.59
Grand Total 100.00
• Top Ten Holdings
PORTFOLIO
Industry Allocation of Equity Holding (% of Net Assets)
1.41
1.56
1.98
1.99
2.02
2.51
2.95
4.07
4.60
8.29
8.87
11.85
18.61
26.70
0 5 10 15 20 25 30
Non - Ferrous Metals
Ferrous Metals
Auto Ancillaries
Gas
Chemicals
Transportation
Minerals/Mining
Petroleum Products
Finance
Construction
Power
Industrial Capital Goods
Construction Project
Banks
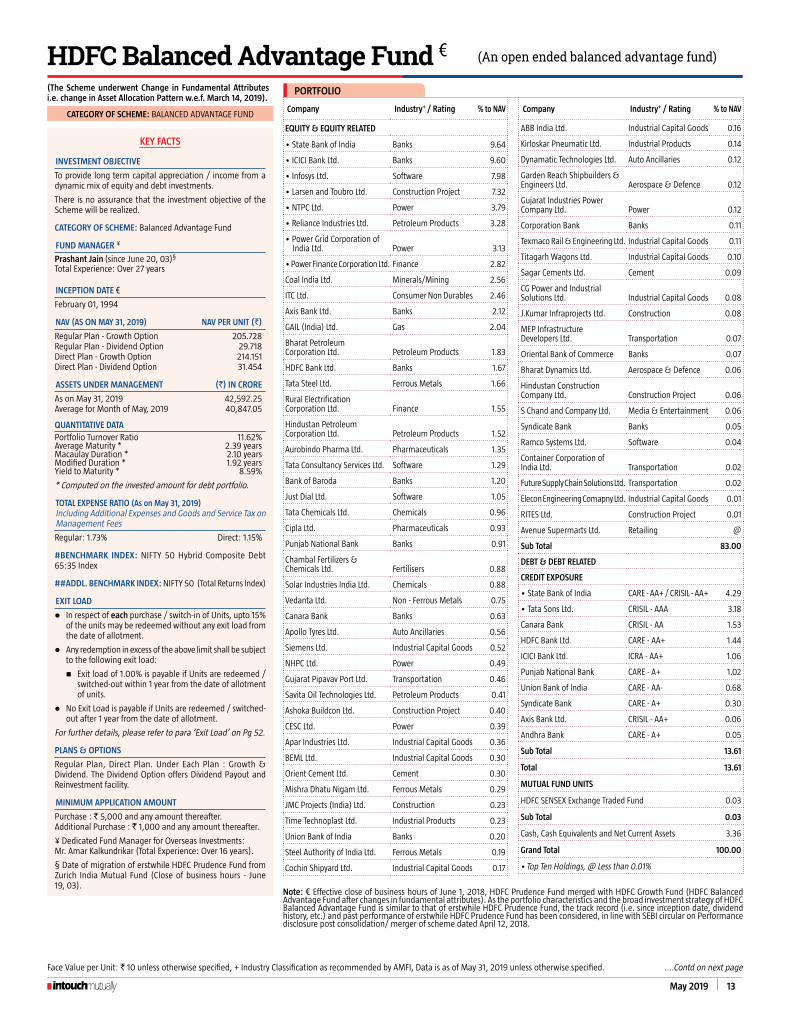
May 2019 13
Face Value per Unit: ` 10 unless otherwise specified, + Industry classification as recommended by AMFI, Data is as of May 31, 2019 unless otherwise specified. ....contd on next page
Note: ¤ Effective close of business hours of June 1, 2018, HDFc Prudence Fund merged with HDFc Growth Fund (HDFc Balanced Advantage Fund after changes in fundamental attributes). As the portfolio characteristics and the broad investment strategy of HDFc Balanced Advantage Fund is similar to that of erstwhile HDFc Prudence Fund, the track record (i.e. since inception date, dividend history, etc.) and past performance of erstwhile HDFc Prudence Fund has been considered, in line with SEBI circular on Performance disclosure post consolidation/ merger of scheme dated April 12, 2018.
(An open ended balanced advantage fund)HDFC Balanced Advantage Fund ¤
Company Industry+ / Rating % to NAV
EqUiTY & EqUiTY RElATED
• State Bank of India Banks 9.64
• IcIcI Bank Ltd. Banks 9.60
• Infosys Ltd. Software 7.98
• Larsen and Toubro Ltd. construction Project 7.32
• NTPc Ltd. Power 3.79
• Reliance Industries Ltd. Petroleum Products 3.28
• Power Grid corporation of India Ltd. Power 3.13
• Power Finance corporation Ltd. Finance 2.82
coal India Ltd. Minerals/Mining 2.56
ITc Ltd. consumer Non Durables 2.46
Axis Bank Ltd. Banks 2.12
GAIL (India) Ltd. Gas 2.04
Bharat Petroleum corporation Ltd. Petroleum Products 1.83
HDFc Bank Ltd. Banks 1.67
Tata Steel Ltd. Ferrous Metals 1.66
Rural electrification corporation Ltd. Finance 1.55
Hindustan Petroleum corporation Ltd. Petroleum Products 1.52
Aurobindo Pharma Ltd. Pharmaceuticals 1.35
Tata consultancy Services Ltd. Software 1.29
Bank of Baroda Banks 1.20
Just Dial Ltd. Software 1.05
Tata chemicals Ltd. chemicals 0.96
cipla Ltd. Pharmaceuticals 0.93
Punjab National Bank Banks 0.91
chambal Fertilizers & chemicals Ltd. Fertilisers 0.88
Solar Industries India Ltd. chemicals 0.88
Vedanta Ltd. Non - Ferrous Metals 0.75
canara Bank Banks 0.63
Apollo Tyres Ltd. Auto Ancillaries 0.56
Siemens Ltd. Industrial capital Goods 0.52
NHPc Ltd. Power 0.49
Gujarat Pipavav Port Ltd. Transportation 0.46
Savita Oil Technologies Ltd. Petroleum Products 0.41
Ashoka Buildcon Ltd. construction Project 0.40
cESc Ltd. Power 0.39
Apar Industries Ltd. Industrial capital Goods 0.36
BeML Ltd. Industrial capital Goods 0.30
Orient cement Ltd. cement 0.30
Mishra Dhatu Nigam Ltd. Ferrous Metals 0.29
JMc Projects (India) Ltd. construction 0.23
Time Technoplast Ltd. Industrial Products 0.23
Union Bank of India Banks 0.20
Steel Authority of India Ltd. Ferrous Metals 0.19
cochin Shipyard Ltd. Industrial capital Goods 0.17
Company Industry+ / Rating % to NAV
ABB India Ltd. Industrial capital Goods 0.16
Kirloskar Pneumatic Ltd. Industrial Products 0.14
Dynamatic Technologies Ltd. Auto Ancillaries 0.12
Garden Reach Shipbuilders & engineers Ltd. Aerospace & Defence 0.12
Gujarat Industries Power company Ltd. Power 0.12
corporation Bank Banks 0.11
Texmaco Rail & engineering Ltd. Industrial capital Goods 0.11
Titagarh Wagons Ltd. Industrial capital Goods 0.10
Sagar cements Ltd. cement 0.09
cG Power and Industrial Solutions Ltd. Industrial capital Goods 0.08
J.Kumar Infraprojects Ltd. construction 0.08
MeP Infrastructure Developers Ltd. Transportation 0.07
Oriental Bank of commerce Banks 0.07
Bharat Dynamics Ltd. Aerospace & Defence 0.06
Hindustan construction company Ltd. construction Project 0.06
S chand and company Ltd. Media & entertainment 0.06
Syndicate Bank Banks 0.05
Ramco Systems Ltd. Software 0.04
container corporation of India Ltd. Transportation 0.02
Future Supply chain Solutions Ltd. Transportation 0.02
Elecon Engineering comapny Ltd. Industrial capital Goods 0.01
RITeS Ltd. construction Project 0.01
Avenue Supermarts Ltd. Retailing @
Sub Total 83.00
DEBT & DEBT RElATED
CREDiT EXPOSURE
• State Bank of India cARE - AA+ / cRISIL - AA+ 4.29
• Tata Sons Ltd. cRISIL - AAA 3.18
canara Bank cRISIL - AA 1.53
HDFc Bank Ltd. cARE - AA+ 1.44
IcIcI Bank Ltd. IcRA - AA+ 1.06
Punjab National Bank cARE - A+ 1.02
Union Bank of India cARE - AA- 0.68
Syndicate Bank cARE - A+ 0.30
Axis Bank Ltd. cRISIL - AA+ 0.06
Andhra Bank cARE - A+ 0.05
Sub Total 13.61
Total 13.61
MUTUAl FUND UNiTS
HDFc SeNSex Exchange Traded Fund 0.03
Sub Total 0.03
cash, cash Equivalents and Net current Assets 3.36
Grand Total 100.00
• Top Ten Holdings, @ Less than 0.01%
PORTFOLIO
KEY FACTS
iNVESTMENT OBjECTiVE
To provide long term capital appreciation / income from a dynamic mix of equity and debt investments.
There is no assurance that the investment objective of the Scheme will be realized.
CATEgORY OF SCHEME: Balanced Advantage Fund
FUND MANAgER ¥
Prashant Jain (since June 20, 03)§
Total Experience: Over 27 years
iNCEPTiON DATE ¤February 01, 1994
NAV (AS ON MAY 31, 2019) NAV PER UNIT (`)
Regular Plan - Growth Option 205.728Regular Plan - Dividend Option 29.718Direct Plan - Growth Option 214.151Direct Plan - Dividend Option 31.454
ASSETS UNDER MANAgEMENT (`) iN CRORE
As on May 31, 2019 42,592.25Average for Month of May, 2019 40,847.05
qUANTiTATiVE DATAPortfolio Turnover Ratio 11.62%Average Maturity * 2.39 yearsMacaulay Duration * 2.10 yearsModified Duration * 1.92 yearsYield to Maturity * 8.59%
* computed on the invested amount for debt portfolio.
TOTAL ExPENSE RATIO (As on May 31, 2019)Including Additional expenses and Goods and Service Tax on Management Fees
Regular: 1.73% Direct: 1.15%
#BENCHMARK iNDEX: NIFTY 50 Hybrid composite Debt 65:35 Index
##ADDl. BENCHMARK iNDEX: NIFTY 50 (Total Returns Index)
EXiT lOAD
l In respect of each purchase / switch-in of Units, upto 15% of the units may be redeemed without any exit load from the date of allotment.
l Any redemption in excess of the above limit shall be subject to the following exit load:
n exit load of 1.00% is payable if Units are redeemed / switched-out within 1 year from the date of allotment of units.
l No exit Load is payable if Units are redeemed / switched-out after 1 year from the date of allotment.
For further details, please refer to para ‘Exit Load’ on Pg 52.
PLANS & OPTIONS
Regular Plan, Direct Plan. Under each Plan : Growth & Dividend. The Dividend Option offers Dividend Payout and Reinvestment facility.
MiNiMUM APPliCATiON AMOUNT
Purchase : ` 5,000 and any amount thereafter.Additional Purchase : ` 1,000 and any amount thereafter.
¥ Dedicated Fund Manager for Overseas Investments: Mr. Amar Kalkundrikar (Total Experience: Over 16 years).
§ Date of migration of erstwhile HDFc Prudence Fund from Zurich India Mutual Fund (close of business hours - June 19, 03).
(The Scheme underwent Change in Fundamental Attributes i.e. change in Asset Allocation Pattern w.e.f. March 14, 2019).
CATEgORY OF SCHEME: BALANcED ADVANTAGE FUND
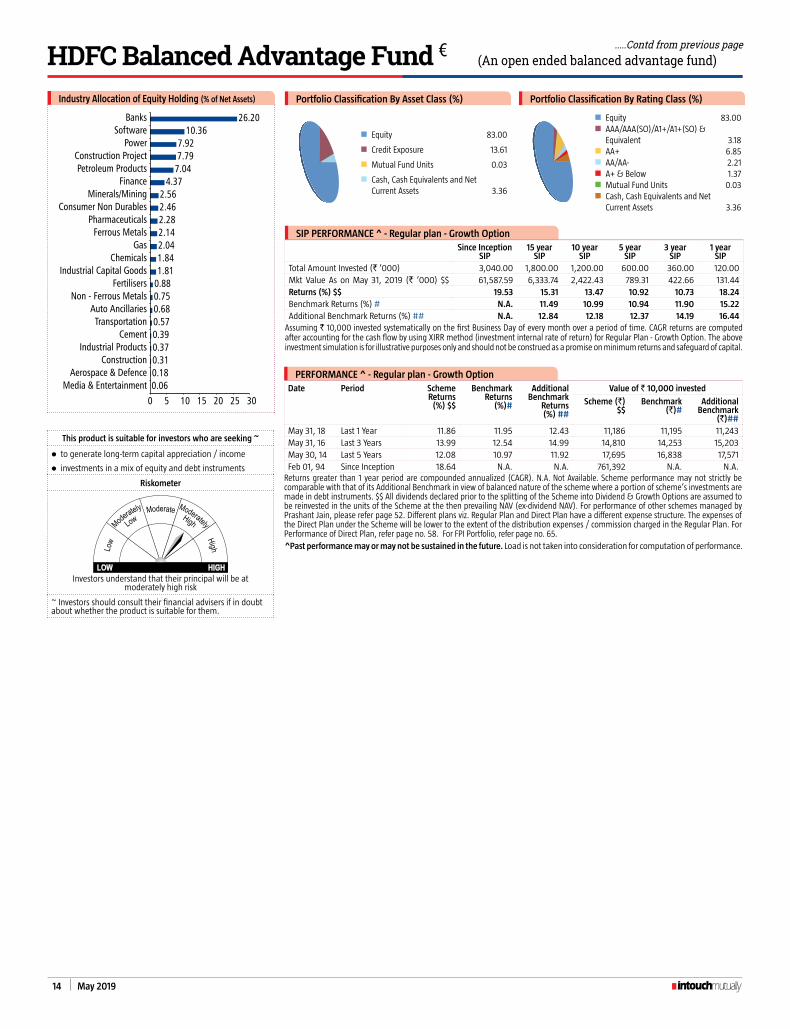
14 May 2019
This product is suitable for investors who are seeking ~
l to generate long-term capital appreciation / income
l investments in a mix of equity and debt instruments
Riskometer
Investors understand that their principal will be at moderately high risk
~ Investors should consult their financial advisers if in doubt about whether the product is suitable for them.
SiP PERFORMANCE ^ - Regular plan - growth OptionSince Inception
SIP15 year
SIP10 year
SIP5 year
SIP3 year
SIP1 year
SIPTotal Amount Invested (` ‘000) 3,040.00 1,800.00 1,200.00 600.00 360.00 120.00 Mkt Value As on May 31, 2019 (` ‘000) $$ 61,587.59 6,333.74 2,422.43 789.31 422.66 131.44 Returns (%) $$ 19.53 15.31 13.47 10.92 10.73 18.24 Benchmark Returns (%) # N.A. 11.49 10.99 10.94 11.90 15.22 Additional Benchmark Returns (%) ## N.A. 12.84 12.18 12.37 14.19 16.44
Assuming ` 10,000 invested systematically on the first Business Day of every month over a period of time. cAGR returns are computed after accounting for the cash flow by using xIRR method (investment internal rate of return) for Regular Plan - Growth Option. The above investment simulation is for illustrative purposes only and should not be construed as a promise on minimum returns and safeguard of capital.
PERFORMANCE ^ - Regular plan - growth OptionDate Period Scheme
Returns (%) $$
Benchmark Returns
(%)#
Additional Benchmark
Returns (%) ##
Value of ` 10,000 invested
Scheme (`) $$
Benchmark (`)#
Additional Benchmark
(`)##May 31, 18 Last 1 Year 11.86 11.95 12.43 11,186 11,195 11,243May 31, 16 Last 3 Years 13.99 12.54 14.99 14,810 14,253 15,203May 30, 14 Last 5 Years 12.08 10.97 11.92 17,695 16,838 17,571Feb 01, 94 Since Inception 18.64 N.A. N.A. 761,392 N.A. N.A.
Returns greater than 1 year period are compounded annualized (cAGR). N.A. Not Available. Scheme performance may not strictly be comparable with that of its Additional Benchmark in view of balanced nature of the scheme where a portion of scheme’s investments are made in debt instruments. $$ All dividends declared prior to the splitting of the Scheme into Dividend & Growth Options are assumed to be reinvested in the units of the Scheme at the then prevailing NAV (ex-dividend NAV). For performance of other schemes managed by Prashant Jain, please refer page 52. Different plans viz. Regular Plan and Direct Plan have a different expense structure. The expenses of the Direct Plan under the Scheme will be lower to the extent of the distribution expenses / commission charged in the Regular Plan. For Performance of Direct Plan, refer page no. 58. For FPI Portfolio, refer page no. 65.^Past performance may or may not be sustained in the future. Load is not taken into consideration for computation of performance.
Portfolio Classification By Asset Class (%)
n equity 83.00
n credit Exposure 13.61
n Mutual Fund Units 0.03
n cash, cash Equivalents and Net current Assets 3.36
Portfolio Classification By Rating Class (%)
n equity 83.00n AAA/AAA(SO)/A1+/A1+(SO) &
equivalent 3.18n AA+ 6.85n AA/AA- 2.21n A+ & Below 1.37n Mutual Fund Units 0.03n cash, cash Equivalents and Net
current Assets 3.36
(An open ended balanced advantage fund)HDFC Balanced Advantage Fund ¤ .....Contd from previous page
Industry Allocation of Equity Holding (% of Net Assets)
0.060.180.310.370.390.570.680.750.881.811.842.042.142.282.462.56
4.377.047.797.92
10.3626.20
0 5 10 15 20 25 30
Media & EntertainmentAerospace & Defence
ConstructionIndustrial Products
CementTransportation
Auto AncillariesNon - Ferrous Metals
FertilisersIndustrial Capital Goods
ChemicalsGas
Ferrous MetalsPharmaceuticals
Consumer Non DurablesMinerals/Mining
FinancePetroleum Products
Construction ProjectPower
SoftwareBanks

May 2019 15
CATEgORY OF SCHEME: AGGRESSIVE HYBRID FUND
Face Value per Unit: ` 10 unless otherwise specified, + Industry classification as recommended by AMFI, Data is as of May 31, 2019 unless otherwise specified.
Note: ¤ Effective close of business hours of June 1, 2018, HDFc Balanced Fund merged with HDFc Premier Multi cap Fund (HDFc Hybrid Equity Fund after changes in fundamental attributes). As the portfolio characteristics and the broad investment strategy of HDFc Hybrid Equity Fund is similar to that of erstwhile HDFc Balanced Fund, the track record (i.e. since inception date dividend history, etc) and past performance of erstwhile HDFc Balanced Fund has been considered, in line with SEBI circular on Performance disclosure post consolidation/ merger of scheme dated April 12, 2018.
Company Industry+ / Rating % to NAV
EqUiTY & EqUiTY RElATED
• HDFc Bank Ltd. Banks 7.95
• IcIcI Bank Ltd. Banks 5.17
• Infosys Ltd. Software 4.60
• Housing Development Finance corporation Ltd. £ Finance 4.44
• Larsen and Toubro Ltd. construction Project 3.53
• ITc Ltd. consumer Non Durables 3.09
• Axis Bank Ltd. Banks 2.67
• State Bank of India Banks 2.43
Reliance Industries Ltd. Petroleum Products 2.31
Aurobindo Pharma Ltd. Pharmaceuticals 2.18
Aarti Industries Ltd. chemicals 1.90
UPL Ltd. Pesticides 1.63
Bharat electronics Ltd. Industrial capital Goods 1.61
Indusind Bank Ltd. Banks 1.44
Power Grid corporation of India Ltd. Power 1.29
SKF India Ltd. Industrial Products 1.26
Voltas Ltd. consumer Durables 1.20
Hindustan Petroleum corporation Ltd. Petroleum Products 1.15
KEc International Ltd. construction Project 1.12
Tata Steel Ltd. Ferrous Metals 1.08
Bank of Baroda Banks 1.06
Atul Ltd. chemicals 1.05
Bharti Airtel Ltd. Telecom - Services 0.99
Indian Hotels company Ltd. Hotels/Resorts & Other Recreational Activities 0.95
Balkrishna Industries Ltd. Auto Ancillaries 0.91
cholamandalam Financial Holdings Ltd. Finance 0.87
Vedanta Ltd. Non - Ferrous Metals 0.74
Tube Investments of India Ltd. Auto Ancillaries 0.71
Hexaware Technologies Ltd. Software 0.65
Bharat Petroleum corporation Ltd. Petroleum Products 0.63
NIIT Technologies Ltd. Software 0.63
PNc Infratech Ltd. construction 0.63
Tata consultancy Services Ltd. Software 0.61
Edelweiss Financial Services Ltd. Finance 0.60
Mahindra Holidays & Resorts India Ltd.
Hotels/Resorts & Other Recreational Activities 0.59
Sadbhav engineering Ltd. construction Project 0.59
Yes Bank Ltd. Banks 0.46
VST Industries Ltd. consumer Non Durables 0.44
Vardhman Textiles Ltd. Textiles - cotton 0.40
Company Industry+ / Rating % to NAV
Ipca Laboratories Ltd. Pharmaceuticals 0.38
Zensar Technologies Ltd. Software 0.38
Redington (India) Ltd. Transportation 0.36
Sharda cropchem Ltd. Pesticides 0.36
Kalpataru Power Transmission Ltd. Power 0.35
Tamilnadu Newsprint & Papers Ltd. Paper 0.35
Allahabad Bank Banks 0.34
Torrent Pharmaceuticals Ltd. Pharmaceuticals 0.31
carborundum Universal Ltd. Industrial Products 0.30
Jagran Prakashan Ltd. Media & entertainment 0.25
Tata Motors Ltd. DVR Auto 0.25
MM Forgings Ltd. Industrial Products 0.14
Navneet education Ltd. Media & entertainment 0.14
Greenply Industries Ltd. consumer Durables 0.13
Persistent Systems Ltd. Software 0.11
IFB Industries Ltd. consumer Durables 0.09
Atul Auto Ltd. Auto 0.08
Insecticides (India) Ltd. Pesticides 0.06
Sub Total 69.94
DEBT & DEBT RElATED
gOVERNMENT SECURiTiES (CENTRAl/STATE)
7.16 GOI 2023 Sovereign 1.43
6.84 GOI 2022 Sovereign 1.33
8.2 GOI 2025 Sovereign 0.81
7.35 GOI 2024 Sovereign 0.67
8.08 GOI 2022 Sovereign 0.60
7.72 GOI 2025 Sovereign 0.46
8.24 GOI 2033 Sovereign 0.45
8.15 GOI 2022 Sovereign 0.37
7.68 GOI 2023 Sovereign 0.36
8.83 GOI 2023 Sovereign 0.25
8.4 GOI 2024 Sovereign 0.23
8.6 GOI 2028 Sovereign 0.19
8.35 GOI 2022 Sovereign 0.18
6.35 GOI 2020 Sovereign 0.17
7.8 GOI 2020 Sovereign 0.11
8.12 GOI 2020 Sovereign 0.10
8.13 GOI 2045 Sovereign 0.10
8.2 GOI 2022 Sovereign 0.01
SUB TOTAL 7.82
CREDiT EXPOSURE
Tata Sons Ltd. cRISIL - AAA 4.30
(An open ended hybrid scheme investing predominantly in equity and equity related instruments)HDFC Hybrid Equity Fund ¤
PORTFOLIO
KEY FACTS
INVESTMENT OBjECTiVE
The investment objective of the Scheme is to generate capital appreciation / income from a portfolio, predominantly of equity & equity related instruments. The Scheme will also invest in debt and money market instruments.
There is no assurance that the investment objective of the Scheme will be realized.
CATEgORY OF SCHEME: Aggressive Hybrid Fund
FUND MANAgER ¥
Chirag Setalvad (since April 2, 07) ¤
Total Experience: Over 21 years
iNCEPTiON DATE ¤September 11, 2000
NAV (AS ON MAY 31, 2019) NAV PER UNIT (`)
Regular Plan - Growth Option 55.129Regular Plan - Dividend Option 12.166Direct Plan - Growth Option 57.477Direct Plan - Dividend Option 12.905
ASSETS UNDER MANAgEMENT (`) iN CRORE
As on May 31, 2019 22,664.90Average for Month of May, 2019 22,164.12
qUANTiTATiVE DATA
Portfolio Turnover Ratio (Last 1 year) 9.32%Average Maturity * 3.04 yearsMacaulay Duration * 2.52 yearsModified Duration * 2.37 yearsYield to Maturity * 7.61%
* computed on the invested amount for debt portfolio.
TOTAL ExPENSE RATIO (As on May 31, 2019)Including Additional expenses and Goods and Service Tax on Management Fees
Regular: 1.77% Direct: 1.16%
#BENCHMARK iNDEX: NIFTY 50 Hybrid composite Debt 65:35 Index
##ADDl. BENCHMARK iNDEX: NIFTY 50 (Total Returns Index)
EXiT lOAD
l In respect of each purchase/switch-in of Units, upto 15% of the units may be redeemed without any exit load from the date of allotment.
l Any redemption in excess of the above limit shall be subject to the following exit load:
n exit load of 1.00% is payable if Units are redeemed / switched-out within 1 year from the date of allotment of units.
l No exit Load is payable if Units are redeemed / switched-out after 1 year from the date of allotment.
For further details, please refer to para ‘Exit Load’ on Pg 52.
PLANS & OPTIONS
Regular Plan, Direct Plan. Under each Plan : Growth & Dividend. The Dividend Option offers Dividend Payout and Reinvestment facility.
MiNiMUM APPliCATiON AMOUNT
Purchase : ` 5,000 and any amount thereafter.Additional Purchase : ` 1,000 and any amount thereafter.
SEgMENT-WiSE BREAK-UP OF EqUiTY HOlDiNgS (% OF NET ASSETS)
Large cap 49.68%Mid cap 11.69%Small cap 8.55%
¥ Dedicated Fund Manager for Overseas Investments: Mr. Amar Kalkundrikar (Total Experience: Over 16 years).
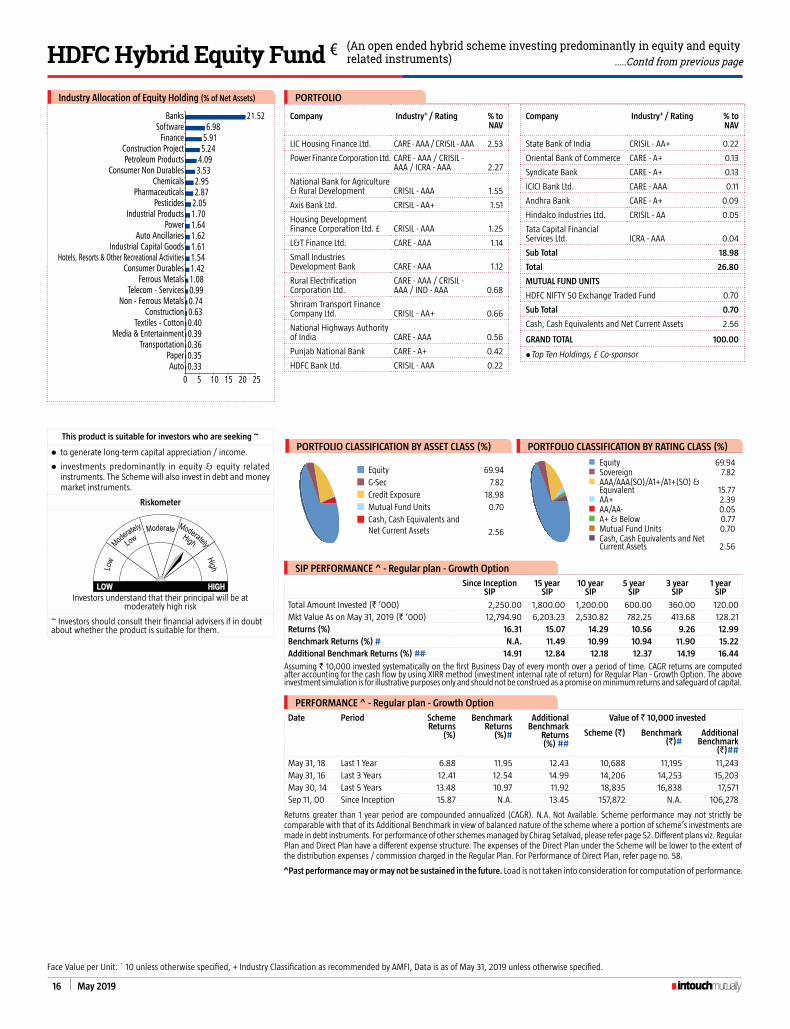
16 May 2019
Company Industry+ / Rating % to NAV
LIc Housing Finance Ltd. cARE - AAA / cRISIL - AAA 2.53
Power Finance corporation Ltd. cARE - AAA / cRISIL - AAA / IcRA - AAA 2.27
National Bank for Agriculture & Rural Development cRISIL - AAA 1.55
Axis Bank Ltd. cRISIL - AA+ 1.51
Housing Development Finance corporation Ltd. £ cRISIL - AAA 1.25
L&T Finance Ltd. cARE - AAA 1.14
Small Industries Development Bank cARE - AAA 1.12
Rural electrification corporation Ltd.
cARE - AAA / cRISIL - AAA / IND - AAA 0.68
Shriram Transport Finance company Ltd. cRISIL - AA+ 0.66
National Highways Authority of India cARE - AAA 0.56
Punjab National Bank cARE - A+ 0.42
HDFc Bank Ltd. cRISIL - AAA 0.22
Company Industry+ / Rating % to NAV
State Bank of India cRISIL - AA+ 0.22
Oriental Bank of commerce cARE - A+ 0.13
Syndicate Bank cARE - A+ 0.13
IcIcI Bank Ltd. cARE - AAA 0.11
Andhra Bank cARE - A+ 0.09
Hindalco Industries Ltd. cRISIL - AA 0.05
Tata capital Financial Services Ltd. IcRA - AAA 0.04
Sub Total 18.98
Total 26.80
MUTUAl FUND UNiTS
HDFc NIFTY 50 Exchange Traded Fund 0.70
Sub Total 0.70
cash, cash Equivalents and Net current Assets 2.56
gRAND TOTAl 100.00
l Top Ten Holdings, £ co-sponsor
SiP PERFORMANCE ^ - Regular plan - growth Option
Since Inception SIP
15 year SIP
10 year SIP
5 year SIP
3 year SIP
1 year SIP
Total Amount Invested (` ‘000) 2,250.00 1,800.00 1,200.00 600.00 360.00 120.00 Mkt Value As on May 31, 2019 (` ‘000) 12,794.90 6,203.23 2,530.82 782.25 413.68 128.21 Returns (%) 16.31 15.07 14.29 10.56 9.26 12.99 Benchmark Returns (%) # N.A. 11.49 10.99 10.94 11.90 15.22 Additional Benchmark Returns (%) ## 14.91 12.84 12.18 12.37 14.19 16.44
Assuming ` 10,000 invested systematically on the first Business Day of every month over a period of time. cAGR returns are computed after accounting for the cash flow by using xIRR method (investment internal rate of return) for Regular Plan - Growth Option. The above investment simulation is for illustrative purposes only and should not be construed as a promise on minimum returns and safeguard of capital.
PERFORMANCE ^ - Regular plan - growth Option
Date Period Scheme Returns
(%)
Benchmark Returns
(%)#
Additional Benchmark
Returns (%) ##
Value of ` 10,000 invested
Scheme (`) Benchmark (`)#
Additional Benchmark
(`)##
May 31, 18 Last 1 Year 6.88 11.95 12.43 10,688 11,195 11,243May 31, 16 Last 3 Years 12.41 12.54 14.99 14,206 14,253 15,203May 30, 14 Last 5 Years 13.48 10.97 11.92 18,835 16,838 17,571Sep 11, 00 Since Inception 15.87 N.A. 13.45 157,872 N.A. 106,278
Returns greater than 1 year period are compounded annualized (cAGR). N.A. Not Available. Scheme performance may not strictly be comparable with that of its Additional Benchmark in view of balanced nature of the scheme where a portion of scheme’s investments are made in debt instruments. For performance of other schemes managed by chirag Setalvad, please refer page 52. Different plans viz. Regular Plan and Direct Plan have a different expense structure. The expenses of the Direct Plan under the Scheme will be lower to the extent of the distribution expenses / commission charged in the Regular Plan. For Performance of Direct Plan, refer page no. 58.
^Past performance may or may not be sustained in the future. Load is not taken into consideration for computation of performance.
Face Value per Unit: ` 10 unless otherwise specified, + Industry classification as recommended by AMFI, Data is as of May 31, 2019 unless otherwise specified.
PORTFOLIO
This product is suitable for investors who are seeking ~
l to generate long-term capital appreciation / income.
l investments predominantly in equity & equity related instruments. The Scheme will also invest in debt and money market instruments.
Riskometer
Investors understand that their principal will be at moderately high risk
~ Investors should consult their financial advisers if in doubt about whether the product is suitable for them.
PORTFOliO ClASSiFiCATiON BY ASSET ClASS (%)
equity 69.94
G-Sec 7.82
credit Exposure 18.98
Mutual Fund Units 0.70cash, cash Equivalents and Net current Assets 2.56
PORTFOliO ClASSiFiCATiON BY RATiNg ClASS (%)
n equity 69.94n Sovereign 7.82n AAA/AAA(SO)/A1+/A1+(SO) &
equivalent 15.77n AA+ 2.39n AA/AA- 0.05n A+ & Below 0.77n Mutual Fund Units 0.70n cash, cash Equivalents and Net
current Assets 2.56
(An open ended hybrid scheme investing predominantly in equity and equity related instruments)HDFC Hybrid Equity Fund ¤ .....Contd from previous page
Industry Allocation of Equity Holding (% of Net Assets)
0.330.350.360.390.400.630.740.991.081.421.541.611.621.641.702.052.872.953.534.095.245.916.98
21.52
0 5 10 15 20 25Auto
PaperTransportation
Media & EntertainmentTextiles - Cotton
ConstructionNon - Ferrous Metals
Telecom - ServicesFerrous Metals
Consumer DurablesHotels, Resorts & Other Recreational Activities
Industrial Capital GoodsAuto Ancillaries
PowerIndustrial Products
PesticidesPharmaceuticals
ChemicalsConsumer Non Durables
Petroleum ProductsConstruction Project
FinanceSoftware
Banks
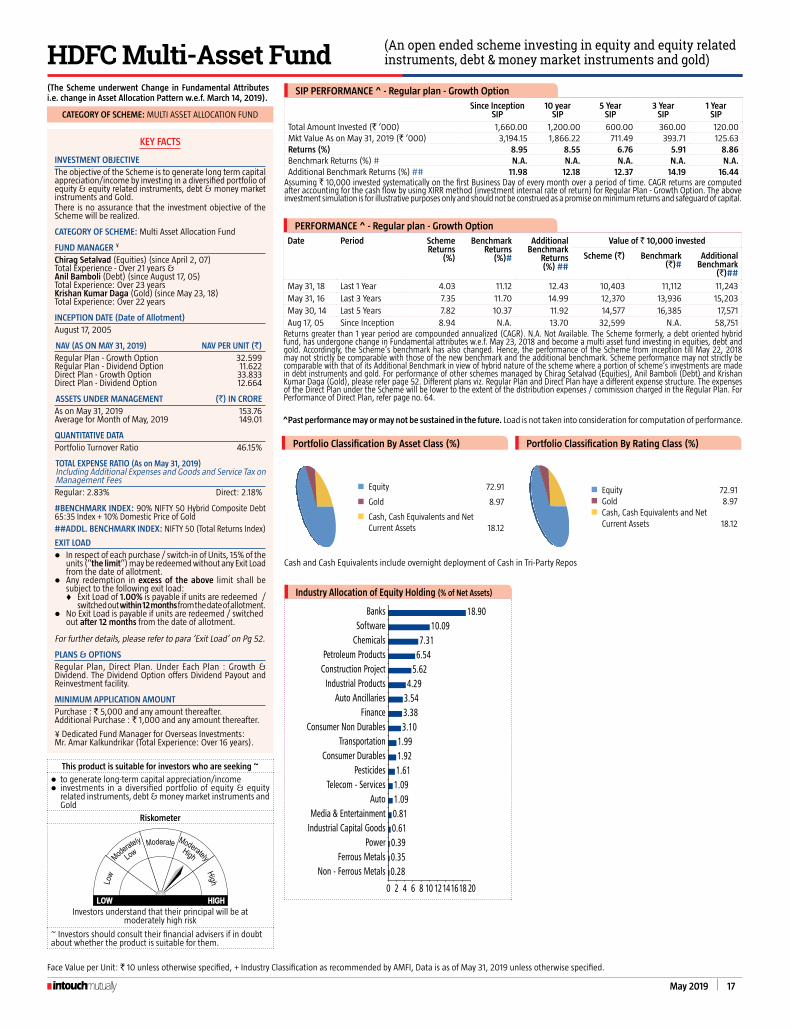
May 2019 17
SiP PERFORMANCE ^ - Regular plan - growth Option
Since Inception SIP
10 year SIP
5 Year SIP
3 Year SIP
1 Year SIP
Total Amount Invested (` ‘000) 1,660.00 1,200.00 600.00 360.00 120.00 Mkt Value As on May 31, 2019 (` ‘000) 3,194.15 1,866.22 711.49 393.71 125.63 Returns (%) 8.95 8.55 6.76 5.91 8.86 Benchmark Returns (%) # N.A. N.A. N.A. N.A. N.A. Additional Benchmark Returns (%) ## 11.98 12.18 12.37 14.19 16.44
Assuming ` 10,000 invested systematically on the first Business Day of every month over a period of time. cAGR returns are computed after accounting for the cash flow by using xIRR method (investment internal rate of return) for Regular Plan - Growth Option. The above investment simulation is for illustrative purposes only and should not be construed as a promise on minimum returns and safeguard of capital.
PERFORMANCE ^ - Regular plan - growth Option
Date Period Scheme Returns
(%)
Benchmark Returns
(%)#
Additional Benchmark
Returns (%) ##
Value of ` 10,000 invested
Scheme (`) Benchmark (`)#
Additional Benchmark
(`)##
May 31, 18 Last 1 Year 4.03 11.12 12.43 10,403 11,112 11,243May 31, 16 Last 3 Years 7.35 11.70 14.99 12,370 13,936 15,203May 30, 14 Last 5 Years 7.82 10.37 11.92 14,577 16,385 17,571Aug 17, 05 Since Inception 8.94 N.A. 13.70 32,599 N.A. 58,751
Returns greater than 1 year period are compounded annualized (cAGR). N.A. Not Available. The Scheme formerly, a debt oriented hybrid fund, has undergone change in Fundamental attributes w.e.f. May 23, 2018 and become a multi asset fund investing in equities, debt and gold. Accordingly, the Scheme’s benchmark has also changed. Hence, the performance of the Scheme from inception till May 22, 2018 may not strictly be comparable with those of the new benchmark and the additional benchmark. Scheme performance may not strictly be comparable with that of its Additional Benchmark in view of hybrid nature of the scheme where a portion of scheme’s investments are made in debt instruments and gold. For performance of other schemes managed by chirag Setalvad (Equities), Anil Bamboli (Debt) and Krishan Kumar Daga (Gold), please refer page 52. Different plans viz. Regular Plan and Direct Plan have a different expense structure. The expenses of the Direct Plan under the Scheme will be lower to the extent of the distribution expenses / commission charged in the Regular Plan. For Performance of Direct Plan, refer page no. 64.
Face Value per Unit: ` 10 unless otherwise specified, + Industry classification as recommended by AMFI, Data is as of May 31, 2019 unless otherwise specified.
This product is suitable for investors who are seeking ~
l to generate long-term capital appreciation/incomel investments in a diversified portfolio of equity & equity
related instruments, debt & money market instruments and Gold
Riskometer
Investors understand that their principal will be at moderately high risk
~ Investors should consult their financial advisers if in doubt about whether the product is suitable for them.
^Past performance may or may not be sustained in the future. Load is not taken into consideration for computation of performance.
(An open ended scheme investing in equity and equity related instruments, debt & money market instruments and gold)HDFC Multi-Asset Fund
Industry Allocation of Equity Holding (% of Net Assets)
0.280.350.390.610.811.091.091.611.921.99
3.103.383.544.29
5.626.547.31
10.0918.90
0 2 4 6 8 10 12141618 20
Non - Ferrous MetalsFerrous Metals
PowerIndustrial Capital GoodsMedia & Entertainment
AutoTelecom - Services
PesticidesConsumer Durables
TransportationConsumer Non Durables
FinanceAuto Ancillaries
Industrial ProductsConstruction ProjectPetroleum Products
ChemicalsSoftware
Banks
KEY FACTS
iNVESTMENT OBjECTiVEThe objective of the Scheme is to generate long term capital appreciation/income by investing in a diversified portfolio of equity & equity related instruments, debt & money market instruments and Gold.There is no assurance that the investment objective of the Scheme will be realized.
CATEgORY OF SCHEME: Multi Asset Allocation Fund
FUND MANAgER ¥
Chirag Setalvad (equities) (since April 2, 07)
Total Experience - Over 21 years &Anil Bamboli (Debt) (since August 17, 05)
Total Experience: Over 23 yearsKrishan Kumar Daga (Gold) (since May 23, 18)
Total Experience: Over 22 years
iNCEPTiON DATE (Date of Allotment)August 17, 2005
NAV (AS ON MAY 31, 2019) NAV PER UNIT (`)Regular Plan - Growth Option 32.599Regular Plan - Dividend Option 11.622Direct Plan - Growth Option 33.833Direct Plan - Dividend Option 12.664
ASSETS UNDER MANAgEMENT (`) iN CROREAs on May 31, 2019 153.76Average for Month of May, 2019 149.01
qUANTiTATiVE DATAPortfolio Turnover Ratio 46.15%
TOTAL ExPENSE RATIO (As on May 31, 2019)Including Additional expenses and Goods and Service Tax on Management FeesRegular: 2.83% Direct: 2.18%
#BENCHMARK iNDEX: 90% NIFTY 50 Hybrid composite Debt 65:35 Index + 10% Domestic Price of Gold##ADDl. BENCHMARK iNDEX: NIFTY 50 (Total Returns Index)
EXiT lOADl In respect of each purchase / switch-in of Units, 15% of the
units (“the limit”) may be redeemed without any exit Load from the date of allotment.
l Any redemption in excess of the above limit shall be subject to the following exit load:
t exit Load of 1.00% is payable if units are redeemed / switched out within 12 months from the date of allotment.
l No exit Load is payable if units are redeemed / switched out after 12 months from the date of allotment.
For further details, please refer to para ‘Exit Load’ on Pg 52.
PLANS & OPTIONSRegular Plan, Direct Plan. Under each Plan : Growth & Dividend. The Dividend Option offers Dividend Payout and Reinvestment facility.
MiNiMUM APPliCATiON AMOUNTPurchase : ` 5,000 and any amount thereafter.Additional Purchase : ` 1,000 and any amount thereafter.
¥ Dedicated Fund Manager for Overseas Investments: Mr. Amar Kalkundrikar (Total Experience: Over 16 years).
(The Scheme underwent Change in Fundamental Attributes i.e. change in Asset Allocation Pattern w.e.f. March 14, 2019).
Portfolio Classification By Asset Class (%)
n equity 72.91
n Gold 8.97
n cash, cash Equivalents and Net current Assets 18.12
Portfolio Classification By Rating Class (%)
n equity 72.91n Gold 8.97n cash, cash Equivalents and Net
current Assets 18.12
cash and cash Equivalents include overnight deployment of cash in Tri-Party Repos
CATEgORY OF SCHEME: MULTI ASSET ALLOcATION FUND
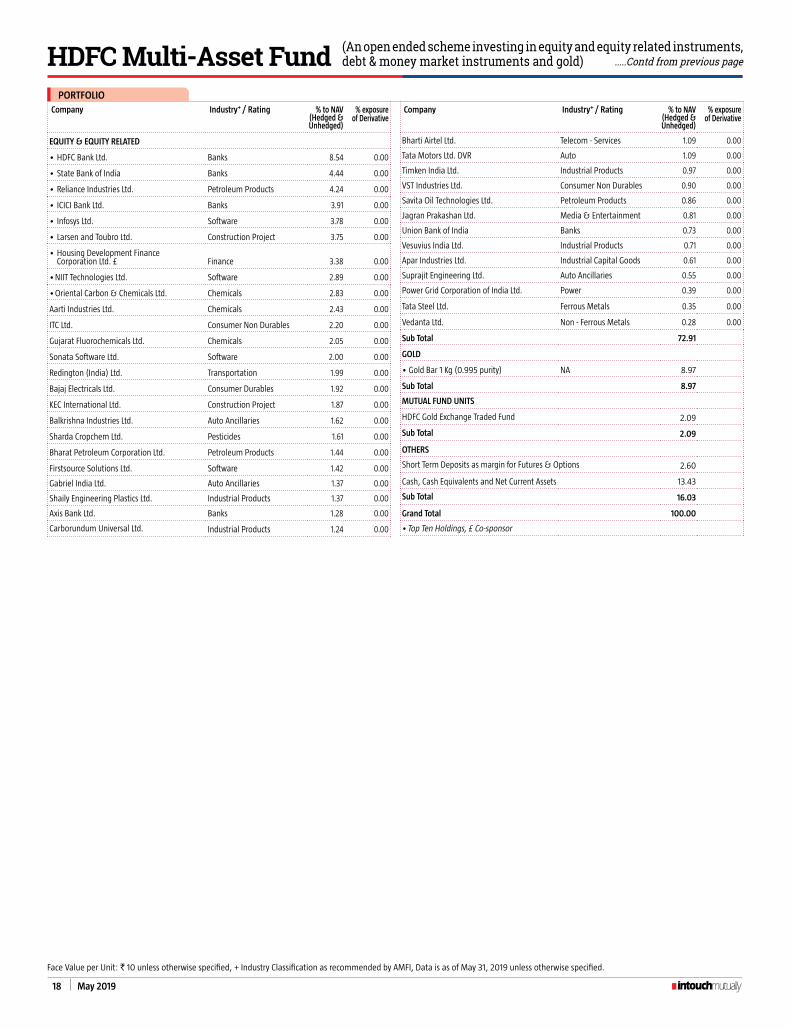
18 May 2019
Company Industry+ / Rating % to NAV (Hedged & Unhedged)
% exposure of Derivative
EqUiTY & EqUiTY RElATED
• HDFc Bank Ltd. Banks 8.54 0.00
• State Bank of India Banks 4.44 0.00
• Reliance Industries Ltd. Petroleum Products 4.24 0.00
• IcIcI Bank Ltd. Banks 3.91 0.00
• Infosys Ltd. Software 3.78 0.00
• Larsen and Toubro Ltd. construction Project 3.75 0.00
• Housing Development Finance corporation Ltd. £ Finance 3.38 0.00
• NIIT Technologies Ltd. Software 2.89 0.00
• Oriental carbon & chemicals Ltd. chemicals 2.83 0.00
Aarti Industries Ltd. chemicals 2.43 0.00
ITc Ltd. consumer Non Durables 2.20 0.00
Gujarat Fluorochemicals Ltd. chemicals 2.05 0.00
Sonata Software Ltd. Software 2.00 0.00
Redington (India) Ltd. Transportation 1.99 0.00
Bajaj electricals Ltd. consumer Durables 1.92 0.00
KEc International Ltd. construction Project 1.87 0.00
Balkrishna Industries Ltd. Auto Ancillaries 1.62 0.00
Sharda cropchem Ltd. Pesticides 1.61 0.00
Bharat Petroleum corporation Ltd. Petroleum Products 1.44 0.00
Firstsource Solutions Ltd. Software 1.42 0.00
Gabriel India Ltd. Auto Ancillaries 1.37 0.00
Shaily engineering Plastics Ltd. Industrial Products 1.37 0.00
Axis Bank Ltd. Banks 1.28 0.00
carborundum Universal Ltd. Industrial Products 1.24 0.00
Company Industry+ / Rating % to NAV (Hedged & Unhedged)
% exposure of Derivative
Bharti Airtel Ltd. Telecom - Services 1.09 0.00
Tata Motors Ltd. DVR Auto 1.09 0.00
Timken India Ltd. Industrial Products 0.97 0.00
VST Industries Ltd. consumer Non Durables 0.90 0.00
Savita Oil Technologies Ltd. Petroleum Products 0.86 0.00
Jagran Prakashan Ltd. Media & entertainment 0.81 0.00
Union Bank of India Banks 0.73 0.00
Vesuvius India Ltd. Industrial Products 0.71 0.00
Apar Industries Ltd. Industrial capital Goods 0.61 0.00
Suprajit engineering Ltd. Auto Ancillaries 0.55 0.00
Power Grid corporation of India Ltd. Power 0.39 0.00
Tata Steel Ltd. Ferrous Metals 0.35 0.00
Vedanta Ltd. Non - Ferrous Metals 0.28 0.00
Sub Total 72.91
gOlD
• Gold Bar 1 Kg (0.995 purity) NA 8.97
Sub Total 8.97
MUTUAl FUND UNiTS
HDFc Gold Exchange Traded Fund 2.09
Sub Total 2.09
OTHERS
Short Term Deposits as margin for Futures & Options 2.60
cash, cash Equivalents and Net current Assets 13.43
Sub Total 16.03
Grand Total 100.00
• Top Ten Holdings, £ co-sponsor
Face Value per Unit: ` 10 unless otherwise specified, + Industry classification as recommended by AMFI, Data is as of May 31, 2019 unless otherwise specified.
(An open ended scheme investing in equity and equity related instruments, debt & money market instruments and gold)HDFC Multi-Asset Fund .....Contd from previous page
PORTFOLIO

May 2019 19
CATEgORY OF SCHEME: ExcHANGE TRADED FUND
KEY FACTSiNVESTMENT OBjECTiVEThe investment objective of HDFc NIFTY 50 ETF is to generate returns that are commensurate with the performance of the NIFTY 50 Index, subject to tracking error.There is no assurance that the investment objective of the Scheme will be realized.
CATEgORY OF SCHEME: Exchange Traded Fund
FUND MANAgERKrishan Kumar Daga (since December 09, 15)
Total Experience: Over 22 years
iNCEPTiON DATE (Date of Allotment)December 09, 2015
NAV (AS ON MAY 31, 2019) NAV PER UNIT (`)Growth Option 1,240.63
ASSETS UNDER MANAgEMENT j (`) iN CROREAs on May 31, 2019 315.60Average for Month of May, 2019 305.55
qUANTiTATiVE DATAPortfolio Turnover Ratio (Last 1 year) 15.39%
TRACKiNg ERRORAnnualised tracking error is calculated based on daily rolling returns for the last 12 months: 0.05%
TOTAL ExPENSE RATIO (As on May 31, 2019)Including Additional expenses and Goods and Service Tax on Management FeesHDFc NIFTY 50 ETF 0.05%
#BENCHMARK iNDEX: NIFTY 50 (Total Returns Index)##ADDl. BENCHMARK iNDEX: S&P BSe SeNSex (Total Returns Index)
EXiT lOADFor Creation Unit Size:l No exit load will be levied on redemptions made by
Authorised Participants / Large Investors directly with the Fund in creation Unit Size.
For other than Creation Unit Size:l N.A. The Units of HNETF in other than creation Unit Size cannot
be directly redeemed with the Fund. These Units can be redeemed (sold) on a continuous basis on
the NSe and BSe during the trading hours on all trading days. Refer SID for further details.For further details, please refer to para ‘Exit Load’ on Pg 52.
PLANS & OPTIONSHDFc NIFTY 50 ETF. Presently the Scheme does not offer any Plans / Options for investmentMiNiMUM APPliCATiON AMOUNT (Under each Plan / Option)Authorised Participants / large investors: Application for subscription of HNETF Units in creation Unit Size can be made either: (i) in exchange of the Portfolio Deposit; or (ii) by depositing basket of securities comprising NIFTY 50 Index Each creation Unit Size will consist of 4,000 Units of HNETF and 1 Unit of HNETF will be approximately equal to 1/10th of the value of NIFTY 50 Index. Other investors (including Authorised Participants and large investors): Units of HNETF can be subscribed (in lots of 1 Unit) during the trading hours on all trading days on the NSe and BSe on which the Units will be listed.
Face Value per Unit: ` 761.25, + Industry classification as recommended by AMFI, Data is as of May 31, 2019 unless otherwise specified.
PERFORMANCE *^
Date Period Scheme Returns
(%)
Benchmark Returns
(%)#
Additional Benchmark
Returns (%) ##
Value of ` 10,000 invested
Scheme (`) Benchmark (`)#
Additional Benchmark
(`)##
May 31, 18 Last 1 Year 12.37 12.43 13.70 11,237 11,243 11,370
May 31, 16 Last 3 Years 14.88 14.99 15.65 15,162 15,203 15,470
Dec 09, 15 Since Inception 15.08 15.23 15.62 16,297 16,369 16,564
Returns are compounded annualized (cAGR). * The Scheme does not offer any Plans/Options. The Scheme is in existence for more than 1 year but less than 5 years. For performance of other schemes managed by Krishan Kumar Daga, please refer page 52.
This product is suitable for investors who are seeking ~
l returns that are commensurate with the performance of the NIFTY 50, subject to tracking errors over long term
l investment in equity securities covered by the NIFTY 50
Riskometer
Investors understand that their principal will be at moderately high risk
~ Investors should consult their financial advisers if in doubt about whether the product is suitable for them. ^Past performance may or may not be sustained in the future. Load is not taken into consideration for computation of performance.
j Includes investments made by the schemes of HDFc Mutual Fund aggregating to Rs. 159.24 crores
(An open ended scheme replicating / tracking NIFTY 50 index)HDFC NIFTY 50 ETF
Company Industry+ % to NAV
EqUiTY & EqUiTY RElATED
• HDFc Bank Ltd. Banks 10.84
• Reliance Industries Ltd. Petroleum Products 9.46
• Housing Development Finance corporation Ltd. £ Finance 7.48
• Infosys Ltd. Software 5.83
• IcIcI Bank Ltd. Banks 5.67
• ITc Ltd. consumer Non Durables 4.97
• Tata consultancy Services Ltd. Software 4.80
• Kotak Mahindra Bank Ltd. Banks 4.23
• Larsen and Toubro Ltd. construction Project 4.00
• Axis Bank Ltd. Banks 3.28
State Bank of India Banks 2.75
Hindustan Unilever Ltd. consumer Non Durables 2.66
Maruti Suzuki India Ltd. Auto 1.90
Bajaj Finance Ltd. Finance 1.71
Indusind Bank Ltd. Banks 1.71
Asian Paints Ltd. consumer Non Durables 1.32
Mahindra & Mahindra Ltd. Auto 1.25
Bharti Airtel Ltd. Telecom - Services 1.23
HcL Technologies Ltd. Software 1.23
NTPc Ltd. Power 1.12
Oil & Natural Gas corporation Ltd. Oil 1.08
Titan company Ltd. consumer Durables 1.07
Bajaj Finserv Ltd. Finance 1.03
UltraTech cement Ltd. cement 1.03
Tech Mahindra Ltd. Software 0.99
Sun Pharmaceutical Industries Ltd. Pharmaceuticals 0.94
Power Grid corporation of India Ltd. Power 0.91
Wipro Ltd. Software 0.90
coal India Ltd. Minerals/Mining 0.88
Bajaj Auto Ltd. Auto 0.83
Indian Oil corporation Ltd. Petroleum Products 0.81
Tata Steel Ltd. Ferrous Metals 0.77
UPL Ltd. Pesticides 0.76
Grasim Industries Ltd. cement 0.73
Britannia Industries Ltd. consumer Non Durables 0.72
Hero Motocorp Ltd. Auto 0.72
Adani Ports & Special economic Zone Transportation 0.68
Company Industry+ % to NAV
GAIL (India) Ltd. Gas 0.68
Dr Reddys Laboratories Ltd. Pharmaceuticals 0.67
Bharat Petroleum corporation Ltd. Petroleum Products 0.66
Tata Motors Ltd. Auto 0.65
Vedanta Ltd. Non - Ferrous Metals 0.61
Hindalco Industries Ltd. Non - Ferrous Metals 0.60
cipla Ltd. Pharmaceuticals 0.59
eicher Motors Ltd. Auto 0.58
JSW Steel Ltd. Ferrous Metals 0.57
Yes Bank Ltd. Banks 0.57
Indiabulls Housing Finance Ltd. Finance 0.54
Bharti Infratel Ltd. Telecom - equipment & Accessories 0.48
Zee entertainment enterprises Ltd. Media & entertainment 0.41
Sub Total 99.90
cash, cash Equivalents and Net current Assets 0.10
Grand Total 100.00
• Top Ten Holdings, £ co-sponsor
PORTFOLIO
Industry Allocation of Equity Holding (% of Net Assets)
0.410.480.680.680.760.881.071.081.211.231.341.762.032.204.005.93
9.6710.7610.93
13.7529.05
0 5 10 15 20 25 30 35
Media & EntertainmentTelecom - Equipment & Accessories
GasTransportation
PesticidesMinerals/Mining
Consumer DurablesOil
Non - Ferrous MetalsTelecom - Services
Ferrous MetalsCement
PowerPharmaceuticals
Construction ProjectAuto
Consumer Non DurablesFinance
Petroleum ProductsSoftware
Banks
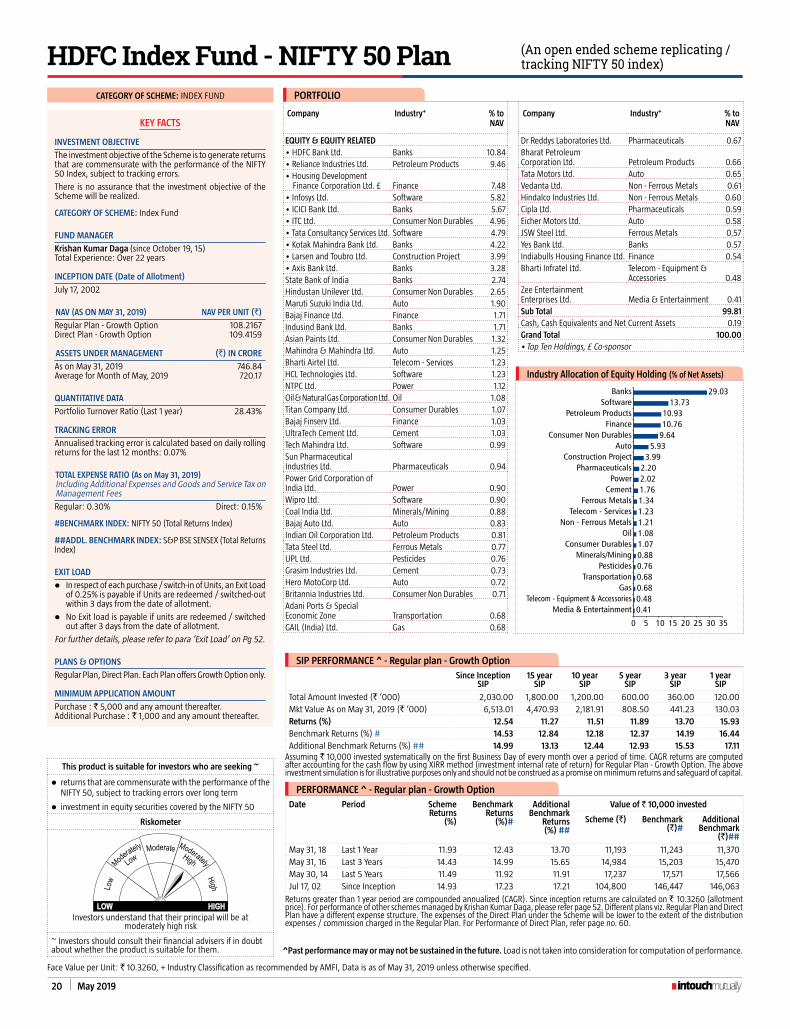
20 May 2019
CATEgORY OF SCHEME: INDEx FUND
Company Industry+ % to NAV
EqUiTY & EqUiTY RElATED• HDFc Bank Ltd. Banks 10.84• Reliance Industries Ltd. Petroleum Products 9.46• Housing Development
Finance corporation Ltd. £ Finance 7.48• Infosys Ltd. Software 5.82• IcIcI Bank Ltd. Banks 5.67• ITc Ltd. consumer Non Durables 4.96• Tata consultancy Services Ltd. Software 4.79• Kotak Mahindra Bank Ltd. Banks 4.22• Larsen and Toubro Ltd. construction Project 3.99• Axis Bank Ltd. Banks 3.28State Bank of India Banks 2.74Hindustan Unilever Ltd. consumer Non Durables 2.65Maruti Suzuki India Ltd. Auto 1.90Bajaj Finance Ltd. Finance 1.71Indusind Bank Ltd. Banks 1.71Asian Paints Ltd. consumer Non Durables 1.32Mahindra & Mahindra Ltd. Auto 1.25Bharti Airtel Ltd. Telecom - Services 1.23HcL Technologies Ltd. Software 1.23NTPc Ltd. Power 1.12Oil & Natural Gas corporation Ltd. Oil 1.08Titan company Ltd. consumer Durables 1.07Bajaj Finserv Ltd. Finance 1.03UltraTech cement Ltd. cement 1.03Tech Mahindra Ltd. Software 0.99Sun Pharmaceutical Industries Ltd. Pharmaceuticals 0.94Power Grid corporation of India Ltd. Power 0.90Wipro Ltd. Software 0.90coal India Ltd. Minerals/Mining 0.88Bajaj Auto Ltd. Auto 0.83Indian Oil corporation Ltd. Petroleum Products 0.81Tata Steel Ltd. Ferrous Metals 0.77UPL Ltd. Pesticides 0.76Grasim Industries Ltd. cement 0.73Hero Motocorp Ltd. Auto 0.72Britannia Industries Ltd. consumer Non Durables 0.71Adani Ports & Special economic Zone Transportation 0.68GAIL (India) Ltd. Gas 0.68
Company Industry+ % to NAV
Dr Reddys Laboratories Ltd. Pharmaceuticals 0.67Bharat Petroleum corporation Ltd. Petroleum Products 0.66Tata Motors Ltd. Auto 0.65Vedanta Ltd. Non - Ferrous Metals 0.61Hindalco Industries Ltd. Non - Ferrous Metals 0.60cipla Ltd. Pharmaceuticals 0.59eicher Motors Ltd. Auto 0.58JSW Steel Ltd. Ferrous Metals 0.57Yes Bank Ltd. Banks 0.57Indiabulls Housing Finance Ltd. Finance 0.54Bharti Infratel Ltd. Telecom - equipment &
Accessories 0.48Zee entertainment enterprises Ltd. Media & entertainment 0.41Sub Total 99.81cash, cash Equivalents and Net current Assets 0.19Grand Total 100.00• Top Ten Holdings, £ co-sponsor
KEY FACTS
iNVESTMENT OBjECTiVE
The investment objective of the Scheme is to generate returns that are commensurate with the performance of the NIFTY 50 Index, subject to tracking errors.
There is no assurance that the investment objective of the Scheme will be realized.
CATEgORY OF SCHEME: Index Fund
FUND MANAgER
Krishan Kumar Daga (since October 19, 15)
Total Experience: Over 22 years
iNCEPTiON DATE (Date of Allotment)
July 17, 2002
NAV (AS ON MAY 31, 2019) NAV PER UNIT (`)
Regular Plan - Growth Option 108.2167Direct Plan - Growth Option 109.4159
ASSETS UNDER MANAgEMENT (`) iN CRORE
As on May 31, 2019 746.84Average for Month of May, 2019 720.17
qUANTiTATiVE DATA
Portfolio Turnover Ratio (Last 1 year) 28.43%
TRACKiNg ERROR
Annualised tracking error is calculated based on daily rolling returns for the last 12 months: 0.07%
TOTAL ExPENSE RATIO (As on May 31, 2019)Including Additional expenses and Goods and Service Tax on Management Fees
Regular: 0.30% Direct: 0.15%
#BENCHMARK iNDEX: NIFTY 50 (Total Returns Index)
##ADDl. BENCHMARK iNDEX: S&P BSe SeNSex (Total Returns Index)
EXiT lOAD
l In respect of each purchase / switch-in of Units, an exit Load of 0.25% is payable if Units are redeemed / switched-out within 3 days from the date of allotment.
l No exit load is payable if units are redeemed / switched out after 3 days from the date of allotment.
For further details, please refer to para ‘Exit Load’ on Pg 52.
PLANS & OPTIONS
Regular Plan, Direct Plan. Each Plan offers Growth Option only.
MiNiMUM APPliCATiON AMOUNT
Purchase : ` 5,000 and any amount thereafter.Additional Purchase : ` 1,000 and any amount thereafter.
SiP PERFORMANCE ^ - Regular plan - growth Option
Since Inception SIP
15 year SIP
10 year SIP
5 year SIP
3 year SIP
1 year SIP
Total Amount Invested (` ‘000) 2,030.00 1,800.00 1,200.00 600.00 360.00 120.00 Mkt Value As on May 31, 2019 (` ‘000) 6,513.01 4,470.93 2,181.91 808.50 441.23 130.03 Returns (%) 12.54 11.27 11.51 11.89 13.70 15.93 Benchmark Returns (%) # 14.53 12.84 12.18 12.37 14.19 16.44 Additional Benchmark Returns (%) ## 14.99 13.13 12.44 12.93 15.53 17.11
Assuming ` 10,000 invested systematically on the first Business Day of every month over a period of time. cAGR returns are computed after accounting for the cash flow by using xIRR method (investment internal rate of return) for Regular Plan - Growth Option. The above investment simulation is for illustrative purposes only and should not be construed as a promise on minimum returns and safeguard of capital.
PERFORMANCE ^ - Regular plan - growth Option
Date Period Scheme Returns
(%)
Benchmark Returns
(%)#
Additional Benchmark
Returns (%) ##
Value of ` 10,000 invested
Scheme (`) Benchmark (`)#
Additional Benchmark
(`)##
May 31, 18 Last 1 Year 11.93 12.43 13.70 11,193 11,243 11,370May 31, 16 Last 3 Years 14.43 14.99 15.65 14,984 15,203 15,470May 30, 14 Last 5 Years 11.49 11.92 11.91 17,237 17,571 17,566Jul 17, 02 Since Inception 14.93 17.23 17.21 104,800 146,447 146,063
Returns greater than 1 year period are compounded annualized (cAGR). Since inception returns are calculated on ` 10.3260 (allotment price). For performance of other schemes managed by Krishan Kumar Daga, please refer page 52. Different plans viz. Regular Plan and Direct Plan have a different expense structure. The expenses of the Direct Plan under the Scheme will be lower to the extent of the distribution expenses / commission charged in the Regular Plan. For Performance of Direct Plan, refer page no. 60.
Face Value per Unit: ` 10.3260, + Industry classification as recommended by AMFI, Data is as of May 31, 2019 unless otherwise specified.
This product is suitable for investors who are seeking ~
l returns that are commensurate with the performance of the NIFTY 50, subject to tracking errors over long term
l investment in equity securities covered by the NIFTY 50
Riskometer
Investors understand that their principal will be at moderately high risk
~ Investors should consult their financial advisers if in doubt about whether the product is suitable for them. ^Past performance may or may not be sustained in the future. Load is not taken into consideration for computation of performance.
(An open ended scheme replicating / tracking NIFTY 50 index)HDFC Index Fund - NIFTY 50 Plan
PORTFOLIO
Industry Allocation of Equity Holding (% of Net Assets)
0.410.480.680.680.760.881.071.081.211.231.341.762.022.20
3.995.93
9.6410.7610.93
13.7329.03
0 5 10 15 20 25 30 35
Media & EntertainmentTelecom - Equipment & Accessories
GasTransportation
PesticidesMinerals/Mining
Consumer DurablesOil
Non - Ferrous MetalsTelecom - Services
Ferrous MetalsCement
PowerPharmaceuticals
Construction ProjectAuto
Consumer Non DurablesFinance
Petroleum ProductsSoftware
Banks

May 2019 21
CATEgORY OF SCHEME: ExcHANGE TRADED FUND
KEY FACTS
iNVESTMENT OBjECTiVEThe investment objective of HDFc SENSEx ETF is to generate returns that are commensurate with the performance of the S&P BSe SeNSex Index, subject to tracking errors.There is no assurance that the investment objective of the Scheme will be realized.
CATEgORY OF SCHEME: Exchange Traded Fund
FUND MANAgERKrishan Kumar Daga (since December 09, 15)
Total Experience: Over 22 years
iNCEPTiON DATE (Date of Allotment)December 09, 2015
NAV (AS ON MAY 31, 2019) NAV PER UNIT (`)Growth Option 4,147.70
ASSETS UNDER MANAgEMENT j (`) iN CROREAs on May 31, 2019 67.55Average for Month of May, 2019 57.73
qUANTiTATiVE DATAPortfolio Turnover Ratio (Last 1 year) 104.98%
TRACKiNg ERRORAnnualised tracking error is calculated based on daily rolling returns for the last 12 months: 0.05%
TOTAL ExPENSE RATIO (As on May 31, 2019)Including Additional expenses and Goods and Service Tax on Management FeesHDFc SeNSex ETF 0.05%
#BENCHMARK iNDEX: S&P BSe SeNSex (Total Returns Index)##ADDl. BENCHMARK iNDEX: NIFTY 50 (Total Returns Index)
EXiT lOADFor Creation Unit Size:l No exit load will be levied on redemptions made by
Authorised Participants / Large Investors directly with the Fund in creation Unit Size.
For other than Creation Unit Size:l N.A. The Units of HSxETF in other than creation Unit Size cannot
be directly redeemed with the Fund. These Units can be redeemed (sold) on a continuous basis on
the NSe and BSe during the trading hours on all trading days. Refer SID for further details.For further details, please refer to para ‘Exit Load’ on Pg 52.
PLANS & OPTIONSHDFc SENSEx ETF. Presently the Scheme does not offer any Plans / Options for investment
MiNiMUM APPliCATiON AMOUNT (Under each Plan / Option)Authorised Participants / large investors: Application for subscription of HSxETF Units in creation Unit Size can be made either: (i) in exchange of the Portfolio Deposit; or (ii) by depositing basket of securities comprising S&P BSe
SeNSex IndexEach creation Unit Size will consist of 1,000 Units of HSxETF and 1 Unit of HSxETF will be approximately equal to 1/10th of the value of S&P BSe SeNSex Index. Other investors (including Authorised Participants and large investors): Units of HSxETF can be subscribed (in lots of 1 Unit) during the trading hours on all trading days on the NSe and BSe on which the Units will be listed.
Face Value per Unit: ` 2,503.61, + Industry classification as recommended by AMFI, Data is as of May 31, 2019 unless otherwise specified.
PERFORMANCE *^
Date Period Scheme Returns
(%)
Benchmark Returns
(%)#
Additional Benchmark
Returns (%) ##
Value of ` 10,000 invested
Scheme (`) Benchmark (`)#
Additional Benchmark
(`)##
May 31, 18 Last 1 Year 13.65 13.70 12.43 11,365 11,370 11,243
May 31, 16 Last 3 Years 15.60 15.65 14.99 15,450 15,470 15,203
Dec 09, 15 Since Inception 15.63 15.62 15.23 16,567 16,564 16,369
Returns are compounded annualized (cAGR). * The Scheme does not offer any Plans/Options. The Scheme is in existence for more than 1 year but less than 5 years. For performance of other schemes managed by Krishan Kumar Daga, please refer page 52.
This product is suitable for investors who are seeking ~
l returns that are commensurate with the performance of the S&P BSe SeNSex, subject to tracking errors over long term
l investment in equity securities covered by the S&P BSe SeNSex
Riskometer
Investors understand that their principal will be at moderately high risk
~ Investors should consult their financial advisers if in doubt about whether the product is suitable for them. ^Past performance may or may not be sustained in the future. Load is not taken into consideration for computation of performance.
j Includes investments made by the schemes of HDFc Mutual Fund aggregating to Rs. 31.66 crores
(An open ended scheme replicating / tracking S&P BSE SENSEX index)HDFC SENSEX ETF
Company Industry+ % to NAV
EqUiTY & EqUiTY RElATED
• HDFc Bank Ltd. Banks 12.86
• Reliance Industries Ltd. Petroleum Products 10.62
• Housing Development Finance corporation Ltd. £ Finance 9.26
• Infosys Ltd. Software 6.92
• IcIcI Bank Ltd. Banks 6.71
• ITc Ltd. consumer Non Durables 5.87
• Tata consultancy Services Ltd. Software 5.71
• Larsen and Toubro Ltd. construction Project 4.69
• Kotak Mahindra Bank Ltd. Banks 4.43
• Axis Bank Ltd. Banks 3.53
State Bank of India Banks 3.27
Hindustan Unilever Ltd. consumer Non Durables 3.15
Maruti Suzuki India Ltd. Auto 2.26
Bajaj Finance Ltd. Finance 2.02
Indusind Bank Ltd. Banks 2.00
Asian Paints Ltd. consumer Non Durables 1.56
HcL Technologies Ltd. Software 1.50
Mahindra & Mahindra Ltd. Auto 1.49
Bharti Airtel Ltd. Telecom - Services 1.46
NTPc Ltd. Power 1.24
Oil & Natural Gas corporation Ltd. Oil 1.20
Sun Pharmaceutical Industries Ltd. Pharmaceuticals 1.09
Power Grid corporation of India Ltd. Power 1.08
Bajaj Auto Ltd. Auto 0.98
Tata Steel Ltd. Ferrous Metals 0.93
Company Industry+ % to NAV
Hero Motocorp Ltd. Auto 0.86
coal India Ltd. Minerals/Mining 0.85
Tata Motors Ltd. Auto 0.78
Vedanta Ltd. Non - Ferrous Metals 0.74
Yes Bank Ltd. Banks 0.68
Tata Motors Ltd. DVR Auto 0.11
Sub Total 99.85
cash, cash Equivalents and Net current Assets 0.15
Grand Total 100.00
• Top Ten Holdings, £ co-sponsor
PORTFOLIO
Industry Allocation of Equity Holding (% of Net Assets)
0.74
0.85
0.93
1.09
1.20
1.46
2.32
4.69
6.48
10.58
10.62
11.28
14.13
33.48
0 5 10 15 20 25 30 35 40
Non - Ferrous Metals
Minerals/Mining
Ferrous Metals
Pharmaceuticals
Oil
Telecom - Services
Power
Construction Project
Auto
Consumer Non Durables
Petroleum Products
Finance
Software
Banks
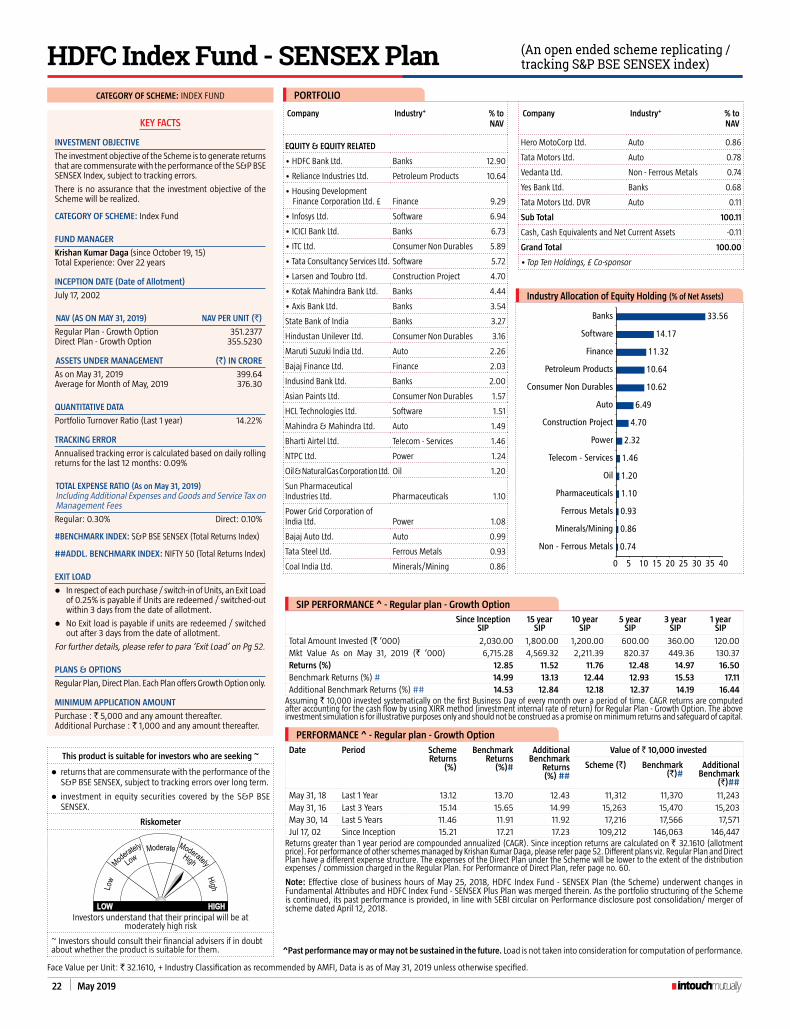
22 May 2019
CATEgORY OF SCHEME: INDEx FUND
KEY FACTS
iNVESTMENT OBjECTiVE
The investment objective of the Scheme is to generate returns that are commensurate with the performance of the S&P BSe SeNSex Index, subject to tracking errors.
There is no assurance that the investment objective of the Scheme will be realized.
CATEgORY OF SCHEME: Index Fund
FUND MANAgER
Krishan Kumar Daga (since October 19, 15)
Total Experience: Over 22 years
iNCEPTiON DATE (Date of Allotment)
July 17, 2002
NAV (AS ON MAY 31, 2019) NAV PER UNIT (`)
Regular Plan - Growth Option 351.2377Direct Plan - Growth Option 355.5230
ASSETS UNDER MANAgEMENT (`) iN CRORE
As on May 31, 2019 399.64Average for Month of May, 2019 376.30
qUANTiTATiVE DATA
Portfolio Turnover Ratio (Last 1 year) 14.22%
TRACKiNg ERROR
Annualised tracking error is calculated based on daily rolling returns for the last 12 months: 0.09%
TOTAL ExPENSE RATIO (As on May 31, 2019)Including Additional expenses and Goods and Service Tax on Management Fees
Regular: 0.30% Direct: 0.10%
#BENCHMARK iNDEX: S&P BSe SeNSex (Total Returns Index)
##ADDl. BENCHMARK iNDEX: NIFTY 50 (Total Returns Index)
EXiT lOAD
l In respect of each purchase / switch-in of Units, an exit Load of 0.25% is payable if Units are redeemed / switched-out within 3 days from the date of allotment.
l No exit load is payable if units are redeemed / switched out after 3 days from the date of allotment.
For further details, please refer to para ‘Exit Load’ on Pg 52.
PLANS & OPTIONS
Regular Plan, Direct Plan. Each Plan offers Growth Option only.
MiNiMUM APPliCATiON AMOUNT
Purchase : ` 5,000 and any amount thereafter.Additional Purchase : ` 1,000 and any amount thereafter.
SiP PERFORMANCE ^ - Regular plan - growth Option
Since Inception SIP
15 year SIP
10 year SIP
5 year SIP
3 year SIP
1 year SIP
Total Amount Invested (` ‘000) 2,030.00 1,800.00 1,200.00 600.00 360.00 120.00 Mkt Value As on May 31, 2019 (` ‘000) 6,715.28 4,569.32 2,211.39 820.37 449.36 130.37 Returns (%) 12.85 11.52 11.76 12.48 14.97 16.50 Benchmark Returns (%) # 14.99 13.13 12.44 12.93 15.53 17.11 Additional Benchmark Returns (%) ## 14.53 12.84 12.18 12.37 14.19 16.44
Assuming ` 10,000 invested systematically on the first Business Day of every month over a period of time. cAGR returns are computed after accounting for the cash flow by using xIRR method (investment internal rate of return) for Regular Plan - Growth Option. The above investment simulation is for illustrative purposes only and should not be construed as a promise on minimum returns and safeguard of capital.
PERFORMANCE ^ - Regular plan - growth Option
Date Period Scheme Returns
(%)
Benchmark Returns
(%)#
Additional Benchmark
Returns (%) ##
Value of ` 10,000 invested
Scheme (`) Benchmark (`)#
Additional Benchmark
(`)##
May 31, 18 Last 1 Year 13.12 13.70 12.43 11,312 11,370 11,243May 31, 16 Last 3 Years 15.14 15.65 14.99 15,263 15,470 15,203May 30, 14 Last 5 Years 11.46 11.91 11.92 17,216 17,566 17,571Jul 17, 02 Since Inception 15.21 17.21 17.23 109,212 146,063 146,447
Returns greater than 1 year period are compounded annualized (cAGR). Since inception returns are calculated on ` 32.1610 (allotment price). For performance of other schemes managed by Krishan Kumar Daga, please refer page 52. Different plans viz. Regular Plan and Direct Plan have a different expense structure. The expenses of the Direct Plan under the Scheme will be lower to the extent of the distribution expenses / commission charged in the Regular Plan. For Performance of Direct Plan, refer page no. 60.
Face Value per Unit: ` 32.1610, + Industry classification as recommended by AMFI, Data is as of May 31, 2019 unless otherwise specified.
This product is suitable for investors who are seeking ~
l returns that are commensurate with the performance of the S&P BSe SeNSex, subject to tracking errors over long term.
l investment in equity securities covered by the S&P BSe SeNSex.
Riskometer
Investors understand that their principal will be at moderately high risk
~ Investors should consult their financial advisers if in doubt about whether the product is suitable for them. ^Past performance may or may not be sustained in the future. Load is not taken into consideration for computation of performance.
Note: Effective close of business hours of May 25, 2018, HDFc Index Fund - SENSEx Plan (the Scheme) underwent changes in Fundamental Attributes and HDFc Index Fund - SENSEx Plus Plan was merged therein. As the portfolio structuring of the Scheme is continued, its past performance is provided, in line with SeBI circular on Performance disclosure post consolidation/ merger of scheme dated April 12, 2018.
(An open ended scheme replicating / tracking S&P BSE SENSEX index)HDFC Index Fund - SENSEX Plan
Company Industry+ % to NAV
EqUiTY & EqUiTY RElATED
• HDFc Bank Ltd. Banks 12.90
• Reliance Industries Ltd. Petroleum Products 10.64
• Housing Development Finance corporation Ltd. £ Finance 9.29
• Infosys Ltd. Software 6.94
• IcIcI Bank Ltd. Banks 6.73
• ITc Ltd. consumer Non Durables 5.89
• Tata consultancy Services Ltd. Software 5.72
• Larsen and Toubro Ltd. construction Project 4.70
• Kotak Mahindra Bank Ltd. Banks 4.44
• Axis Bank Ltd. Banks 3.54
State Bank of India Banks 3.27
Hindustan Unilever Ltd. consumer Non Durables 3.16
Maruti Suzuki India Ltd. Auto 2.26
Bajaj Finance Ltd. Finance 2.03
Indusind Bank Ltd. Banks 2.00
Asian Paints Ltd. consumer Non Durables 1.57
HcL Technologies Ltd. Software 1.51
Mahindra & Mahindra Ltd. Auto 1.49
Bharti Airtel Ltd. Telecom - Services 1.46
NTPc Ltd. Power 1.24
Oil & Natural Gas corporation Ltd. Oil 1.20
Sun Pharmaceutical Industries Ltd. Pharmaceuticals 1.10
Power Grid corporation of India Ltd. Power 1.08
Bajaj Auto Ltd. Auto 0.99
Tata Steel Ltd. Ferrous Metals 0.93
coal India Ltd. Minerals/Mining 0.86
Company Industry+ % to NAV
Hero Motocorp Ltd. Auto 0.86
Tata Motors Ltd. Auto 0.78
Vedanta Ltd. Non - Ferrous Metals 0.74
Yes Bank Ltd. Banks 0.68
Tata Motors Ltd. DVR Auto 0.11
Sub Total 100.11
cash, cash Equivalents and Net current Assets -0.11
Grand Total 100.00
• Top Ten Holdings, £ co-sponsor
PORTFOLIO
Industry Allocation of Equity Holding (% of Net Assets)
0.74
0.86
0.93
1.10
1.20
1.46
2.32
4.70
6.49
10.62
10.64
11.32
14.17
33.56
0 5 10 15 20 25 30 35 40
Non - Ferrous Metals
Minerals/Mining
Ferrous Metals
Pharmaceuticals
Oil
Telecom - Services
Power
Construction Project
Auto
Consumer Non Durables
Petroleum Products
Finance
Software
Banks

May 2019 23
CATEgORY OF SCHEME: EqUITY LINKED SAVINGS ScHEME
KEY FACTS
iNVESTMENT OBjECTiVE
To generate capital appreciation / income from a portfolio, comprising predominantly of equity & equity related instruments.There is no assurance that the investment objective of the Scheme will be realized.
CATEgORY OF SCHEME: equity Linked Savings Scheme
FUND MANAgER ¥
Vinay Kulkarni (since November 21, 06)
Total Experience: Over 29 years
iNCEPTiON DATE (Date of Allotment)
March 31, 1996
NAV (AS ON MAY 31, 2019) NAV PER UNIT (`)
Regular Plan - Growth Option 535.562Regular Plan - Dividend Option 54.905Direct Plan - Growth Option 557.503Direct Plan - Dividend Option 58.262
ASSETS UNDER MANAgEMENT (`) iN CRORE
As on May 31, 2019 7,544.77Average for Month of May, 2019 7,312.83
qUANTiTATiVE DATA
Portfolio Turnover Ratio (Last 1 year) 11.27%
Risk Ration Standard Deviation 3.824%n Beta 0.906n Sharpe Ratio* 0.157
computed for the 3-yr period ended May 31, 2019. Based on month-end NAV. * Risk free rate: 6.00%(Source: FIMMDA MIBOR)
TOTAL ExPENSE RATIO (As on May 31, 2019)Including Additional expenses and Goods and Service Tax on Management Fees
Regular: 1.98% Direct: 1.40%
#BENCHMARK iNDEX: NIFTY 500 (Total Returns Index)
##ADDl. BENCHMARK iNDEX: NIFTY 50 (Total Returns Index)
EXiT lOAD
Nil
PLANS & OPTIONS
Regular Plan, Direct Plan. Under each Plan : Growth & Dividend. The Dividend Option offers Dividend Payout facility.
MiNiMUM APPliCATiON AMOUNT
Purchase : ` 500 and in multiples of ` 500 thereafter.Additional Purchase : ̀ 500 and in multiples of ̀ 500 thereafter.
lOCK-iN PERiOD
3 years from the date of allotment of the respective Units
¥ Dedicated Fund Manager for Overseas Investments: Mr. Amar Kalkundrikar (Total Experience: Over 16 years).
SiP PERFORMANCE ^ - Regular plan - growth OptionSince Inception
SIP15 year
SIP10 year
SIP5 year
SIP3 year
SIP1 year
SIPTotal Amount Invested (` ‘000) 2,780.00 1,800.00 1,200.00 600.00 360.00 120.00 Mkt Value As on May 31, 2019 (` ‘000) $$ 67,974.37 5,545.82 2,227.30 744.75 403.38 126.84 Returns (%) $$ 22.78 13.78 11.89 8.59 7.55 10.78 Benchmark Returns (%) # 15.15 12.74 12.23 11.24 10.91 11.44 Additional Benchmark Returns (%) ## 14.10 12.84 12.18 12.37 14.19 16.44
Assuming ` 10,000 invested systematically on the first Business Day of every month over a period of time. cAGR returns are computed after accounting for the cash flow by using xIRR method (investment internal rate of return) for Regular Plan - Growth Option. The above investment simulation is for illustrative purposes only and should not be construed as a promise on minimum returns and safeguard of capital.
PERFORMANCE ^ - Regular plan - growth OptionDate Period Scheme
Returns (%) $$
Benchmark Returns
(%)#
Additional Benchmark
Returns (%) ##
Value of ` 10,000 investedScheme (`)
$$Benchmark
(`)#Additional
Benchmark (`)##
May 31, 18 Last 1 Year 5.24 6.46 12.43 10,524 10,646 11,243May 31, 16 Last 3 Years 13.08 14.35 14.99 14,460 14,954 15,203May 30, 14 Last 5 Years 10.34 12.35 11.92 16,361 17,910 17,571Mar 31, 96 Since Inception 23.57 13.90 12.68 1,350,999 204,250 159,108
Returns greater than 1 year period are compounded annualized (cAGR). $$ All dividends declared prior to the splitting of the Scheme into Dividend & Growth Options are assumed to be reinvested in the units of the Scheme at the then prevailing NAV (ex-dividend NAV). For performance of other schemes managed by Vinay Kulkarni, please refer page 52. Different plans viz. Regular Plan and Direct Plan have a different expense structure. The expenses of the Direct Plan under the Scheme will be lower to the extent of the distribution expenses / commission charged in the Regular Plan. For Performance of Direct Plan, refer page no. 58. As TRI data is not available since inception of the scheme, additional benchmark performance is calculated using composite cAGR of NIFTY 50 PRI values from Mar 29, 96 (Data for March 31, 96 is not available) to Jun 29, 99 and TRI values since Jun 30, 99. As NIFTY 500 TRI data is not available for March 31, 96, benchmark performance is calculated from March 29, 96.
Face Value per Unit: ` 10 unless otherwise specified, + Industry classification as recommended by AMFI, Data is as of May 31, 2019 unless otherwise specified.
This product is suitable for investors who are seeking ~
l to generate long-term capital appreciation / income
l investment predominantly of equity & equity related instruments
Riskometer
Investors understand that their principal will be at moderately high risk
~ Investors should consult their financial advisers if in doubt about whether the product is suitable for them. ^Past performance may or may not be sustained in the future. Load is not taken into consideration for computation of performance.
(An open ended equity linked savings scheme with a statutory lock in of 3 years and tax benefit)HDFC TaxSaver
Company Industry+ % to NAV
EqUiTY & EqUiTY RElATED
• IcIcI Bank Ltd. Banks 8.94
• HDFc Bank Ltd. Banks 8.26
• NTPc Ltd. Power 7.94
• State Bank of India Banks 7.64
• Infosys Ltd. Software 7.36
• Reliance Industries Ltd. Petroleum Products 7.30
• Larsen and Toubro Ltd. construction Project 6.01
• GAIL (India) Ltd. Gas 5.11
• ITc Ltd. consumer Non Durables 4.18
• Axis Bank Ltd. Banks 2.65
cipla Ltd. Pharmaceuticals 2.58
Vedanta Ltd. Non - Ferrous Metals 2.56
Tata Steel Ltd. Ferrous Metals 2.53
Bharat Petroleum corporation Ltd. Petroleum Products 2.36
NHPc Ltd. Power 2.01
Oracle Financial Services Software Ltd. Software 1.87
Bharat electronics Ltd. Industrial capital Goods 1.44
Power Grid corporation of India Ltd. Power 1.25
L&T Technology Services Ltd. Software 1.17
Solar Industries India Ltd. chemicals 1.15
Hindustan Petroleum corporation Ltd. Petroleum Products 1.01
Kalpataru Power Transmission Ltd. Power 1.01
Sadbhav engineering Ltd. construction Project 0.96
Tata Motors Ltd. DVR Auto 0.92
Gujarat Pipavav Port Ltd. Transportation 0.84
Aurobindo Pharma Ltd. Pharmaceuticals 0.83
coal India Ltd. Minerals/Mining 0.74
Tata Motors Ltd. Auto 0.68
Max Financial Services Ltd. Finance 0.59
Bharat Heavy electricals Ltd. Industrial capital Goods 0.58
eclerx Services Ltd. Software 0.56
Torrent Pharmaceuticals Ltd. Pharmaceuticals 0.49
BeML Ltd. Industrial capital Goods 0.45
Glenmark Pharmaceuticals Ltd. Pharmaceuticals 0.37
Company Industry+ % to NAV
cG Power and Industrial Solutions Ltd. Industrial capital Goods 0.30
ITD cementation India Ltd. construction 0.30
HSIL Ltd. construction 0.27
Hindustan construction company Ltd. construction Project 0.24
Sadbhav Infrastructure Project Ltd. (corporate Guarantee of Sadbhav engineering Ltd.) construction Project 0.22
Dynamatic Technologies Ltd. Auto Ancillaries 0.19
Persistent Systems Ltd. Software 0.11
MPS Ltd. Software 0.06
Siti Networks Ltd. Media & entertainment 0.02
Sub Total 96.05cash, cash Equivalents and Net current Assets 3.95
Grand Total 100.00
• Top Ten Holdings, @ Less than 0.01%
PORTFOLIO
Industry Allocation of Equity Holding (% of Net Assets)
0.020.190.570.590.740.841.151.602.532.562.77
4.184.275.11
7.4310.6711.1312.21
27.49
0 5 10 15 20 25 30
Media & EntertainmentAuto Ancillaries
ConstructionFinance
Minerals/MiningTransportation
ChemicalsAuto
Ferrous MetalsNon - Ferrous Metals
Industrial Capital GoodsConsumer Non Durables
PharmaceuticalsGas
Construction ProjectPetroleum Products
SoftwarePowerBanks

24 May 2019
CATEgORY OF SCHEME: cHILDREN’S FUND
KEY FACTS
iNVESTMENT OBjECTiVE
To generate capital appreciation / income from a portfolio of equity & equity related instruments and debt and money market instruments.
There is no assurance that the investment objective of the Scheme will be realized.
CATEgORY OF SCHEME: children’s Fund
FUND MANAgER ¥
Chirag Setalvad (since April 2, 07)
Total Experience - Over 21 years
iNCEPTiON DATE (Date of Allotment)
March 2, 2001
NAV (AS ON MAY 31, 2019) NAV PER UNIT (`)
Regular Plan 122.893Direct Plan 129.419
ASSETS UNDER MANAgEMENT (`) iN CRORE
As on May 31, 2019 2,808.34Average for Month of May, 2019 2,715.76
qUANTiTATiVE DATA
Portfolio Turnover Ratio (Last 1 year) 8.92%Average Maturity * 2.10 yearsMacaulay Duration * 1.64 yearsModified Duration * 1.53 yearsYield to Maturity * 7.26%* computed on the invested amount for debt portfolio.
TOTAL ExPENSE RATIO (As on May 31, 2019)Including Additional expenses and Goods and Service Tax on Management Fees
Regular: 2.15% Direct: 1.25%
#BENCHMARK iNDEX: NIFTY 50 Hybrid composite Debt 65:35 Index
##ADDl. BENCHMARK iNDEX: NIFTY 50 (Total Returns Index)
EXiT lOAD
Nil
PLANS & OPTIONS
Regular Plan, Direct Plan.
MiNiMUM APPliCATiON AMOUNT
Purchase : ` 5,000 and any amount thereafter.Additional Purchase : ` 1,000 and any amount thereafter.
lOCK-iN PERiOD
Fresh investments by investors including SiP/ STP registrations, etc (effective May 23, 2018):Lock-in period will be compulsory. Lock-in period shall be earlier ofl 5 Years from the date of allotment; orl Until the Unit holder (being the beneficiary child) attains
the age of majority (i.e. completion of 18 years)
(¥) Dedicated Fund Manager for Overseas Investments:Mr. Amar Kalkundrikar (Total Experience: Over 16 years).
(Ω) Eligibility (of Unit holder) : children less than 18 years of age as on the date of investment by the Investor / Applicant are eligible as Unit holders in the Scheme. (π) Personal Accident Insurance cover for Parent / Legal Guardian (upto the age of 80 years) of the Unit holder, equivalent to 10 times the cost value of the outstanding Units held by the Unit holder under all the applications / account statements / folios, subject to a maximum amount of ` 10 lakhs per Unit holder. The insurance premium in respect of the personal accident insurance cover will be borne by the AMc. This accident insurance cover is subject to conditions of the group personal accident insurance policy.
Face Value per Unit: ` 10 unless otherwise specified, + Industry classification as recommended by AMFI, Data is as of May 31, 2019 unless otherwise specified.
[An open ended fund for investment for children having a lock-in for atleast 5 years or till the child attains age of majority (whichever is earlier)] ΩπHDFC Children's Gift Fund
Company Industry+ / Rating % to NAV
EqUiTY & EqUiTY RElATED
• HDFc Bank Ltd. Banks 6.60
• Reliance Industries Ltd. Petroleum Products 4.45
• Infosys Ltd. Software 3.20
• Larsen and Toubro Ltd. construction Project 3.05
• IcIcI Bank Ltd. Banks 3.04
• Housing Development Finance corporation Ltd. £ Finance 2.64
Bajaj Finance Ltd. Finance 2.47
State Bank of India Banks 2.11
NIIT Technologies Ltd. Software 1.78
cholamandalam Investment and Financial company Ltd. Finance 1.73
Britannia Industries Ltd. consumer Non Durables 1.66
Bharat electronics Ltd. Industrial capital Goods 1.47
Hexaware Technologies Ltd. Software 1.42
UPL Ltd. Pesticides 1.42
Aurobindo Pharma Ltd. Pharmaceuticals 1.41
Bank of Baroda Banks 1.30
Bharti Airtel Ltd. Telecom - Services 1.22
Axis Bank Ltd. Banks 1.19
Balkrishna Industries Ltd. Auto Ancillaries 1.11
Voltas Ltd. consumer Durables 1.03
Schaeffler India Ltd. Industrial Products 1.02
AIA engineering Ltd. Industrial Products 0.98
Finolex Industries Ltd. Industrial Products 0.92
Motherson Sumi Systems Ltd. Auto Ancillaries 0.86
SKF India Ltd. Industrial Products 0.85
Larsen & Toubro Infotech Ltd. Software 0.84
century Plyboards (India) Ltd. consumer Durables 0.79
carborundum Universal Ltd. Industrial Products 0.78
PNc Infratech Ltd. construction 0.77
Sonata Software Ltd. Software 0.77
Supreme Industries Ltd. Industrial Products 0.77
Mahindra Holidays & Resorts India Ltd.
Hotels/Resorts & Other Recreational Activities 0.72
Indian Bank Banks 0.69
Indian Hotels company Ltd. Hotels/Resorts & Other Recreational Activities 0.69
Company Industry+ / Rating % to NAV
Zensar Technologies Ltd. Software 0.69
Ipca Laboratories Ltd. Pharmaceuticals 0.68
eIH Ltd. Hotels/Resorts & Other Recreational Activities 0.66
VST Industries Ltd. consumer Non Durables 0.66
Power Grid corporation of India Ltd. Power 0.64
Tata Steel Ltd. Ferrous Metals 0.64
Apollo Tyres Ltd. Auto Ancillaries 0.61
cholamandalam Financial Holdings Ltd. Finance 0.59
Blue Star Ltd. consumer Durables 0.56
Swaraj engines Ltd. Industrial Products 0.54
Vedanta Ltd. Non - Ferrous Metals 0.53
Vesuvius India Ltd. Industrial Products 0.52
Tube Investments of India Ltd. Auto Ancillaries 0.50
Navneet education Ltd. Media & entertainment 0.45
Sadbhav engineering Ltd. construction Project 0.33
V.S.T Tillers Tractors Ltd. Auto 0.30
IFB Industries Ltd. consumer Durables 0.27
Jagran Prakashan Ltd. Media & entertainment 0.27
eclerx Services Ltd. Software 0.25
Nilkamal Ltd. Industrial Products 0.25
Mcleod Russel India Ltd. consumer Non Durables 0.10
Jyoti Structures Ltd. Power 0.01
Sub Total 65.80
DEBT & DEBT RElATED
gOVERNMENT SECURiTiES (CENTRAl/STATE)
8.28 GOI 2027 Sovereign 1.71
8.12 GOI 2020 Sovereign 1.20
8.32 GOI 2032 Sovereign 1.16
8.83 GOI 2023 Sovereign 1.01
8.15 GOI 2022 Sovereign 0.56
6.35 GOI 2020 Sovereign 0.45
8.08 GOI 2022 Sovereign 0.37
8.6 GOI 2028 Sovereign 0.19
7.16 GOI 2023 Sovereign 0.18
8.2 GOI 2022 Sovereign 0.09
Sub Total 6.92
PORTFOLIO
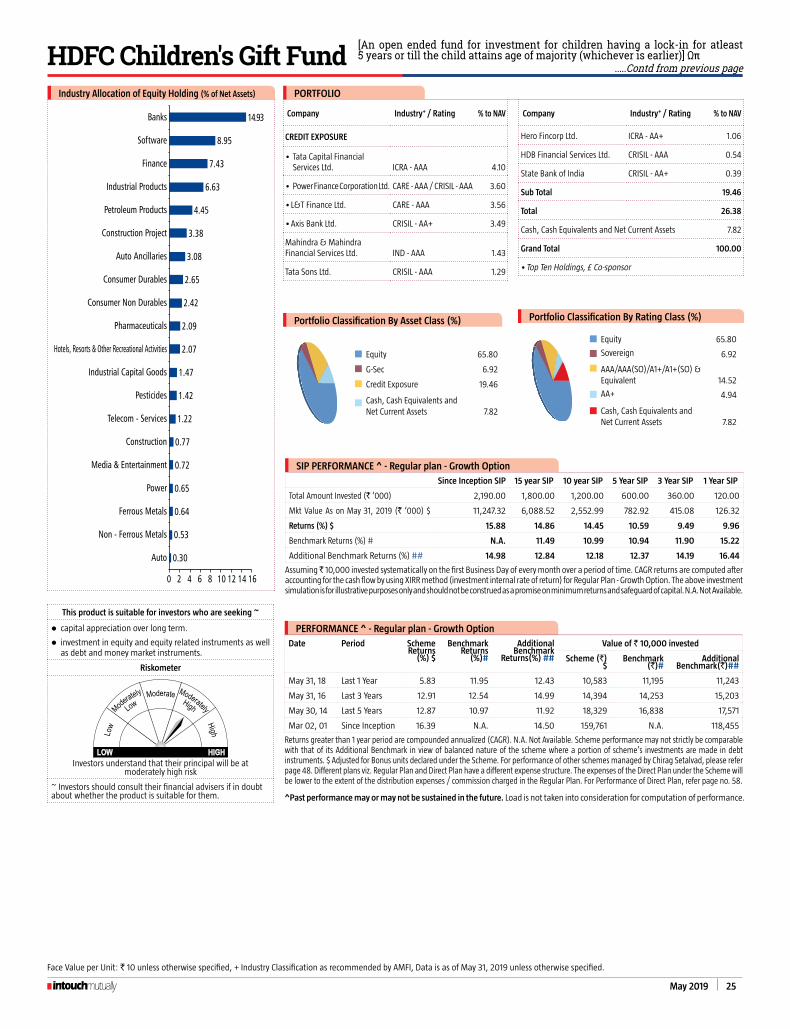
May 2019 25
SiP PERFORMANCE ^ - Regular plan - growth Option
Since Inception SIP 15 year SIP 10 year SIP 5 Year SIP 3 Year SIP 1 Year SIP
Total Amount Invested (` ‘000) 2,190.00 1,800.00 1,200.00 600.00 360.00 120.00
Mkt Value As on May 31, 2019 (` ‘000) $ 11,247.32 6,088.52 2,552.99 782.92 415.08 126.32
Returns (%) $ 15.88 14.86 14.45 10.59 9.49 9.96
Benchmark Returns (%) # N.A. 11.49 10.99 10.94 11.90 15.22
Additional Benchmark Returns (%) ## 14.98 12.84 12.18 12.37 14.19 16.44
Assuming ̀ 10,000 invested systematically on the first Business Day of every month over a period of time. cAGR returns are computed after accounting for the cash flow by using xIRR method (investment internal rate of return) for Regular Plan - Growth Option. The above investment simulation is for illustrative purposes only and should not be construed as a promise on minimum returns and safeguard of capital. N.A. Not Available.
PERFORMANCE ^ - Regular plan - growth Option
Date Period Scheme Returns
(%) $
Benchmark Returns
(%)#
Additional Benchmark
Returns(%) ##
Value of ` 10,000 invested
Scheme (`) $
Benchmark (`)#
Additional Benchmark(`)##
May 31, 18 Last 1 Year 5.83 11.95 12.43 10,583 11,195 11,243
May 31, 16 Last 3 Years 12.91 12.54 14.99 14,394 14,253 15,203
May 30, 14 Last 5 Years 12.87 10.97 11.92 18,329 16,838 17,571
Mar 02, 01 Since Inception 16.39 N.A. 14.50 159,761 N.A. 118,455
Returns greater than 1 year period are compounded annualized (cAGR). N.A. Not Available. Scheme performance may not strictly be comparable with that of its Additional Benchmark in view of balanced nature of the scheme where a portion of scheme’s investments are made in debt instruments. $ Adjusted for Bonus units declared under the Scheme. For performance of other schemes managed by chirag Setalvad, please refer page 48. Different plans viz. Regular Plan and Direct Plan have a different expense structure. The expenses of the Direct Plan under the Scheme will be lower to the extent of the distribution expenses / commission charged in the Regular Plan. For Performance of Direct Plan, refer page no. 58.
Portfolio Classification By Asset Class (%)
equity 65.80
G-Sec 6.92
credit Exposure 19.46
cash, cash Equivalents and Net current Assets 7.82
Face Value per Unit: ` 10 unless otherwise specified, + Industry classification as recommended by AMFI, Data is as of May 31, 2019 unless otherwise specified.
This product is suitable for investors who are seeking ~
l capital appreciation over long term.
l investment in equity and equity related instruments as well as debt and money market instruments.
Riskometer
Investors understand that their principal will be at moderately high risk
~ Investors should consult their financial advisers if in doubt about whether the product is suitable for them. ^Past performance may or may not be sustained in the future. Load is not taken into consideration for computation of performance.
Portfolio Classification By Rating Class (%)
equity 65.80
Sovereign 6.92
AAA/AAA(SO)/A1+/A1+(SO) & equivalent 14.52
AA+ 4.94
cash, cash Equivalents and Net current Assets 7.82
[An open ended fund for investment for children having a lock-in for atleast 5 years or till the child attains age of majority (whichever is earlier)] ΩπHDFC Children's Gift Fund .....Contd from previous page
Company Industry+ / Rating % to NAV
CREDiT EXPOSURE
• Tata capital Financial Services Ltd. IcRA - AAA 4.10
• Power Finance corporation Ltd. cARE - AAA / cRISIL - AAA 3.60
• L&T Finance Ltd. cARE - AAA 3.56
• Axis Bank Ltd. cRISIL - AA+ 3.49
Mahindra & Mahindra Financial Services Ltd. IND - AAA 1.43
Tata Sons Ltd. cRISIL - AAA 1.29
Company Industry+ / Rating % to NAV
Hero Fincorp Ltd. IcRA - AA+ 1.06
HDB Financial Services Ltd. cRISIL - AAA 0.54
State Bank of India cRISIL - AA+ 0.39
Sub Total 19.46
Total 26.38
cash, cash Equivalents and Net current Assets 7.82
Grand Total 100.00
• Top Ten Holdings, £ co-sponsor
PORTFOLIOIndustry Allocation of Equity Holding (% of Net Assets)
0.30
0.53
0.64
0.65
0.72
0.77
1.22
1.42
1.47
2.07
2.09
2.42
2.65
3.08
3.38
4.45
6.63
7.43
8.95
14.93
0 2 4 6 8 10 12 14 16
Auto
Non - Ferrous Metals
Ferrous Metals
Power
Media & Entertainment
Construction
Telecom - Services
Pesticides
Industrial Capital Goods
Hotels, Resorts & Other Recreational Activities
Pharmaceuticals
Consumer Non Durables
Consumer Durables
Auto Ancillaries
Construction Project
Petroleum Products
Industrial Products
Finance
Software
Banks

26 May 2019
CATEgORY OF SCHEME: RETIREMENT FUND
KEY FACTS
iNVESTMENT OBjECTiVE
The investment objective of the Scheme is to provide long-term capital appreciation/income by investing in a mix of equity and debt instruments to help investors meet their retirement goals. There is no assurance that the investment objective of the Scheme will be realized.
CATEgORY OF SCHEME: Retirement Fund
FUND MANAgER ¥
Chirag Setalvad (Equities) (since February 25, 2016)
Total Experience - Over 21 years &Shobhit Mehrotra (Debt) (since February 25, 2016)
Total Experience: Over 25 years
iNCEPTiON DATE (Date of Allotment)
February 25, 2016
NAV (AS ON MAY 31, 2019) NAV PER UNIT (`)
Regular Plan 17.347Direct Plan 18.262
ASSETS UNDER MANAgEMENT (`) iN CRORE
As on May 31, 2019 722.17Average for Month of May, 2019 687.55
qUANTiTATiVE DATA
Portfolio Turnover Ratio 5.76%
TOTAL ExPENSE RATIO (As on May 31, 2019)Including Additional expenses and Goods and Service Tax on Management Fees
Regular: 2.64% Direct: 1.19%
#BENCHMARK iNDEX: NIFTY 500 (Total Returns Index)
##ADDl. BENCHMARK iNDEX: NIFTY 50 (Total Returns Index)
EXiT lOAD
Upon completion of lock-in period: Nil
PLANS & OPTIONS
Regular Plan, Direct Plan. Under Each Plan offers Growth Option only.
MiNiMUM APPliCATiON AMOUNT
Purchase : ` 5,000 and any amount thereafter.Additional Purchase : ` 1,000 and any amount thereafter.
lOCK-iN PERiOD
Existing investments by investors including SiP / STP registrations, etc (until june 1, 2018):
Units purchased cannot be assigned / transferred / pledged / redeemed / switched out until completion of 5 years from the date of allotment of Units under the Scheme.
Fresh investments by investors including SiP / STP registrations, etc (effective june 2, 2018):
Units purchased cannot be assigned / transferred / pledged / redeemed / switched out until completion of 5 years from the date of allotment of Units or Retirement Age of Unit holder (i.e. completion of 60 years), whichever is earlier.
¥ Dedicated Fund Manager for Overseas Investments: Mr. Amar Kalkundrikar (Total Experience: Over 16 years).
Face Value per Unit: ` 10 unless otherwise specified, + Industry classification as recommended by AMFI, Data is as of May 31, 2019 unless otherwise specified.
PERFORMANCE ^ - Regular plan - growth Option
Date Period Scheme Returns
(%)
Benchmark Returns
(%)#
Additional Benchmark
Returns (%) ##
Value of ` 10,000 invested
Scheme (`)
Benchmark (`)#
Additional Benchmark
(`)##
May 31, 18 Last 1 Year 2.41 6.46 12.43 10,241 10,646 11,243May 31, 16 Last 3 Years 13.75 14.35 14.99 14,718 14,954 15,203Feb 25, 16 Since Inception 18.39 18.81 19.46 17,347 17,551 17,866
Returns greater than 1 year period are compounded annualized (cAGR). For performance of other schemes managed by chirag Setalvad (equities) and Shobhit Mehrotra (Debt), please refer page 52. The Scheme is in existence for more than 3 years but less than 5 years. Different plans viz. Regular Plan and Direct Plan have a different expense structure. The expenses of the Direct Plan under the Scheme will be lower to the extent of the distribution expenses / commission charged in the Regular Plan. For Performance of Direct Plan, refer page no. 65.
This product is suitable for investors who are seeking ~
l a corpus to provide for pension in the form of income to the extent of the redemption value of their holding after the age of 60 years.
l investment predominantly in equity and equity related instruments.
Riskometer
Investors understand that their principal will be at moderately high risk
~ Investors should consult their financial advisers if in doubt about whether the product is suitable for them. ^Past performance may or may not be sustained in the future. Load is not taken into consideration for computation of performance.
[An open ended retirement solution oriented scheme having a lock-in of 5 years or till retirement age (whichever is earlier)]HDFC Retirement Savings Fund - Equity Plan
(A notified Tax Savings Cum Pension Scheme)
Company Industry+ / Rating % to NAV
EqUiTY & EqUiTY RElATED
• HDFc Bank Ltd. Banks 8.26
• IcIcI Bank Ltd. Banks 4.90
• Reliance Industries Ltd. Petroleum Products 4.68
• Housing Development Finance corporation Ltd. £ Finance 4.08
• Larsen and Toubro Ltd. construction Project 3.90
• Infosys Ltd. Software 3.65
• State Bank of India Banks 2.44
• Aarti Industries Ltd. chemicals 2.17
Aurobindo Pharma Ltd. Pharmaceuticals 1.91
chambal Fertilizers & chemicals Ltd. Fertilisers 1.86
KEc International Ltd. construction Project 1.83
cholamandalam Investment and Financial company Ltd. Finance 1.81
Axis Bank Ltd. Banks 1.66
carborundum Universal Ltd. Industrial Products 1.63
Kalpataru Power Transmission Ltd. Power 1.61
Indian Hotels company Ltd. Hotels/Resorts & Other Recreational Activities 1.42
Mahindra Holidays & Resorts India Ltd.
Hotels/Resorts & Other Recreational Activities 1.41
Redington (India) Ltd. Transportation 1.39
UPL Ltd. Pesticides 1.38
Hexaware Technologies Ltd. Software 1.35
Blue Star Ltd. consumer Durables 1.34
Balkrishna Industries Ltd. Auto Ancillaries 1.32
Atul Ltd. chemicals 1.23
Jagran Prakashan Ltd. Media & entertainment 1.22
Bajaj electricals Ltd. consumer Durables 1.20
NIIT Technologies Ltd. Software 1.18
KeI Industries Ltd. Industrial Products 1.17
Sharda cropchem Ltd. Pesticides 1.15
Tata Steel Ltd. Ferrous Metals 1.03
Hindustan Petroleum corporation Ltd. Petroleum Products 1.01
SKF India Ltd. Industrial Products 0.98
Finolex Industries Ltd. Industrial Products 0.96
Power Grid corporation of India Ltd. Power 0.96
Oriental carbon & chemicals Ltd. chemicals 0.91
Indusind Bank Ltd. Banks 0.89
Tata Metaliks Ltd. Ferrous Metals 0.89
Voltas Ltd. consumer Durables 0.83
eIH Ltd. Hotels/Resorts & Other Recreational Activities 0.80
Great eastern Shipping company Ltd. Transportation 0.78
Nilkamal Ltd. Industrial Products 0.76
IFB Industries Ltd. consumer Durables 0.70
T. V. Today Network Ltd. Media & entertainment 0.70
Timken India Ltd. Industrial Products 0.67
Company Industry+ / Rating % to NAV
Vedanta Ltd. Non - Ferrous Metals 0.58
Apar Industries Ltd. Industrial capital Goods 0.57
Zensar Technologies Ltd. Software 0.54
Tube Investments of India Ltd. Auto Ancillaries 0.53
GNA Axles Ltd. Auto Ancillaries 0.50
Tata Motors Ltd. DVR Auto 0.47
Yes Bank Ltd. Banks 0.47
Bank of Baroda Banks 0.40
Tamilnadu Newsprint & Papers Ltd. Paper 0.38
Greenply Industries Ltd. consumer Durables 0.28
Mcleod Russel India Ltd. consumer Non Durables 0.24
cG Power and Industrial Solutions Ltd. Industrial capital Goods 0.23
Sub Total 81.21DEBT & DEBT RElATEDgOVERNMENT SECURiTiES (CENTRAl/STATE)• 6.84 GOI 2022 Sovereign 3.48
7.59 GOI 2026 Sovereign 2.13
Sub Total 5.61CREDiT EXPOSURE • Housing and Urban Development corporation Ltd. cARE - AAA 3.57
Syndicate Bank cARE - A+ 0.49
Union Bank of India cARE - AA- 0.40
Sub Total 4.46Total 10.07cash, cash Equivalents and Net current Assets 8.72
Grand Total 100.00
• Top Ten Holdings, £ co-sponsor
PORTFOLIO
Industry Allocation of Equity Holding (% of Net Assets)
0.240.380.470.580.801.861.911.921.922.172.352.532.573.634.314.35
5.695.735.896.176.72
19.02
0 2 4 6 8 1012141618 20
Consumer Non DurablesPaperAuto
Non - Ferrous MetalsIndustrial Capital Goods
FertilisersPharmaceuticals
Ferrous MetalsMedia & Entertainment
TransportationAuto Ancillaries
PesticidesPower
Hotels, Resorts & Other Recreational ActivitiesChemicals
Consumer DurablesPetroleum Products
Construction ProjectFinance
Industrial ProductsSoftware
Banks

May 2019 27
Face Value per Unit: ` 10 unless otherwise specified, + Industry classification as recommended by AMFI, Data is as of May 31, 2019 unless otherwise specified.
[An open ended retirement solution oriented scheme having a lock-in of 5 years or till retirement age (whichever is earlier)]
HDFC Retirement Savings Fund - Hybrid Equity Plan(A notified Tax Savings Cum Pension Scheme)
Company Industry+ / Rating % to
NAV
EqUiTY & EqUiTY RElATED
• HDFc Bank Ltd. Banks 5.61
• IcIcI Bank Ltd. Banks 4.16
• Reliance Industries Ltd. Petroleum Products 3.92
• Housing Development
Finance corporation Ltd. £ Finance 3.60
• Merck Ltd. Pharmaceuticals 2.64
• Larsen and Toubro Ltd. construction Project 2.46
Infosys Ltd. Software 2.41
State Bank of India Banks 1.96
Aarti Industries Ltd. chemicals 1.93
chambal Fertilizers &
chemicals Ltd. Fertilisers 1.83
NIIT Technologies Ltd. Software 1.74
Axis Bank Ltd. Banks 1.59
cholamandalam Investment
and Financial company Ltd. Finance 1.48
Aurobindo Pharma Ltd. Pharmaceuticals 1.41
Sonata Software Ltd. Software 1.30
Sundram Fasteners Ltd. Auto Ancillaries 1.28
Redington (India) Ltd. Transportation 1.27
Blue Star Ltd. consumer Durables 1.23
UPL Ltd. Pesticides 1.23
NRB Bearing Ltd. Industrial Products 1.18
Kalpataru Power
Transmission Ltd. Power 1.14
Bajaj electricals Ltd. consumer Durables 1.13
KEc International Ltd. construction Project 1.01
Vesuvius India Ltd. Industrial Products 0.97
Indian Hotels company Ltd. Hotels/Resorts & Other
Recreational Activities 0.93
Oriental carbon & chemicals Ltd. chemicals 0.92
Balkrishna Industries Ltd. Auto Ancillaries 0.91
Sadbhav engineering Ltd. construction Project 0.89
Mahindra Holidays & Resorts
India Ltd.
Hotels/Resorts & Other
Recreational Activities 0.88
carborundum Universal Ltd. Industrial Products 0.86
Power Grid corporation of
India Ltd. Power 0.86
Tata Steel Ltd. Ferrous Metals 0.86
Zensar Technologies Ltd. Software 0.86
crompton Greaves consumer
elec. Ltd. consumer Durables 0.83
Jagran Prakashan Ltd. Media & entertainment 0.70
Company Industry+ / Rating % to
NAV
Hindustan Petroleum
corporation Ltd. Petroleum Products 0.68
SKF India Ltd. Industrial Products 0.60
cholamandalam Financial
Holdings Ltd. Finance 0.58
Nilkamal Ltd. Industrial Products 0.58
Voltas Ltd. consumer Durables 0.58
Shaily engineering Plastics Ltd. Industrial Products 0.56
Apar Industries Ltd. Industrial capital Goods 0.47
Shree Pushkar chemicals &
Fertilisers Ltd. chemicals 0.46
Indusind Bank Ltd. Banks 0.45
Tube Investments of India Ltd. Auto Ancillaries 0.45
Vedanta Ltd. Non - Ferrous Metals 0.39
Bank of Baroda Banks 0.37
Tata Motors Ltd. DVR Auto 0.35
Yes Bank Ltd. Banks 0.29
Tamilnadu Newsprint &
Papers Ltd. Paper 0.26
Sub Total 65.05
DEBT & DEBT RElATED
gOVERNMENT SECURiTiES (CENTRAl/STATE)
• 6.84 GOI 2022 Sovereign 3.52
6.35 GOI 2020 Sovereign 1.75
7.68 GOI 2023 Sovereign 1.08
7.37 GOI 2023 Sovereign 0.89
8.27 GOI 2020 Sovereign 0.04
Sub Total 7.28
CREDiT EXPOSURE
• Power Finance corporation Ltd. cRISIL - AAA 8.63
• Jamnagar Utilities & Power
Pvt. Ltd. (erstwhile Reliance
Utilities & Power Pvt. Ltd.) cARE - AAA 3.52
• State Bank of India cRISIL - AA+ 2.97
Power Grid corporation of
India Ltd. cRISIL - AAA 1.75
Syndicate Bank cARE - A+ 1.24
Reliance Jio Infocomm Ltd. cRISIL - AAA 0.90
Sub Total 19.01
Total 26.29
cash, cash Equivalents and Net current Assets 8.66
Grand Total 100.00
• Top Ten Holdings, £ co-sponsor
PORTFOLIO
KEY FACTS
iNVESTMENT OBjECTiVE
The investment objective of the Scheme is to provide long-term capital appreciation/income by investing in a mix of equity and debt instruments to help investors meet their retirement goals. There is no assurance that the investment objective of the Scheme will be realized.
CATEgORY OF SCHEME: Retirement Fund
FUND MANAgER ¥
Chirag Setalvad (Equities) (since February 25, 2016)
Total Experience - Over 21 years &
Shobhit Mehrotra (Debt) (since February 25, 2016)
Total Experience: Over 25 years
iNCEPTiON DATE (Date of Allotment)
February 25, 2016
NAV (AS ON MAY 31, 2019) NAV PER UNIT (`)
Regular Plan 17.138Direct Plan 18.054
ASSETS UNDER MANAgEMENT (`) iN CRORE
As on May 31, 2019 285.32Average for Month of May, 2019 268.91
qUANTiTATiVE DATA
Portfolio Turnover Ratio 5.36%Average Maturity * 4.41 yearsMacaulay Duration * 3.35 yearsModified Duration * 3.11 yearsYield to Maturity * 7.61%* computed on the invested amount for debt portfolio.
TOTAL ExPENSE RATIO (As on May 31, 2019)Including Additional expenses and Goods and Service Tax on Management Fees
Regular: 2.73% Direct: 1.35%
#BENCHMARK iNDEX: NIFTY 50 Hybrid composite Debt 65:35 Index
##ADDl. BENCHMARK iNDEX: NIFTY 50 (Total Returns Index)
EXiT lOAD
Upon completion of lock-in period: Nil
PLANS & OPTIONS
Regular Plan, Direct Plan. Under Each Plan offers Growth Option only.
MiNiMUM APPliCATiON AMOUNT
Purchase : ` 5,000 and any amount thereafter.Additional Purchase : ` 1,000 and any amount thereafter.
lOCK-iN PERiOD
Existing investments by investors including SiP / STP registrations, etc (until june 1, 2018):
Units purchased cannot be assigned / transferred / pledged / redeemed / switched out until completion of 5 years from the date of allotment of Units under the Scheme.
Fresh investments by investors including SiP / STP registrations, etc (effective june 2, 2018):
Units purchased cannot be assigned / transferred / pledged / redeemed / switched out until completion of 5 years from the date of allotment of Units or Retirement Age of Unit holder (i.e. completion of 60 years), whichever is earlier.
¥ Dedicated Fund Manager for Overseas Investments: Mr. Amar Kalkundrikar (Total Experience: Over 16 years).
(The Plan underwent Change in Fundamental Attributes i.e. change in Asset Allocation Pattern w.e.f. March 14, 2019).
CATEgORY OF SCHEME: RETIREMENT FUND

28 May 2019
Portfolio Classification By Asset Class (%)
n equity 65.05
n G-Sec 7.28
n credit Exposure 19.01
n cash, cash Equivalents and Net current Assets 8.66
Portfolio Classification By Rating Class (%)
n equity 65.05n Sovereign 7.28n AAA/AAA(SO)/A1+/A1+(SO) &
equivalent 14.80n AA+ 2.97n A+ & Below 1.24n cash, cash Equivalents and Net
current Assets 8.66
This product is suitable for investors who are seeking ~
l a corpus to provide for pension in the form of income to the extent of the redemption value of their holding after the age of 60 years.
l investment predominantly in equity and equity related instruments & balance in debt and money market instruments.
Riskometer
Investors understand that their principal will be at moderately high risk
~ Investors should consult their financial advisers if in doubt about whether the product is suitable for them.
PERFORMANCE ^ - Regular plan - growth Option
Date Period Scheme Returns
(%)
Benchmark Returns
(%)#
Additional Benchmark
Returns (%) ##
Value of ` 10,000 invested
Scheme (`)
Benchmark (`)#
Additional Benchmark
(`)##
May 31, 18 Last 1 Year 7.27 11.95 12.43 10,727 11,195 11,243
May 31, 16 Last 3 Years 14.38 12.54 14.99 14,965 14,253 15,203
Feb 25, 16 Since Inception 17.95 15.69 19.46 17,138 16,089 17,866
Returns greater than 1 year period are compounded annualized (cAGR). Scheme performance may not strictly be comparable with that of its Additional Benchmark in view of hybrid nature of the scheme where a portion of scheme’s investments are made in debt instruments. The Scheme is in existence for more than 3 years but less than 5 years. For performance of other schemes managed by chirag Setalvad (Equities) and Shobhit Mehrotra (Debt), please refer page 52. Different plans viz. Regular Plan and Direct Plan have a different expense structure. The expenses of the Direct Plan under the Scheme will be lower to the extent of the distribution expenses / commission charged in the Regular Plan. For Performance of Direct Plan, refer page no. 65.
^Past performance may or may not be sustained in the future. Load is not taken into consideration for computation of performance.
[An open ended retirement solution oriented scheme having a lock-in of 5 years or till retirement age(whichever is earlier)]
HDFC Retirement Savings Fund - Hybrid Equity Plan(A notified Tax Savings Cum Pension Scheme)
Industry Allocation of Equity Holding (% of Net Assets)
0.260.350.390.470.700.861.231.271.811.832.002.643.313.774.054.364.604.75
5.666.31
14.43
0 2 4 6 8 10 12 14 16
PaperAuto
Non - Ferrous MetalsIndustrial Capital GoodsMedia & Entertainment
Ferrous MetalsPesticides
TransportationHotels, Resorts & Other Recreational Activities
FertilisersPower
Auto AncillariesChemicals
Consumer DurablesPharmaceuticals
Construction ProjectPetroleum ProductsIndustrial Products
FinanceSoftware
Banks
.....Contd from previous page

May 2019 29
CATEgORY OF SCHEME: RETIREMENT FUND
KEY FACTS
iNVESTMENT OBjECTiVEThe investment objective of the Scheme is to provide long-term capital appreciation/income by investing in a mix of equity and debt instruments to help investors meet their retirement goals. There is no assurance that the investment objective of the Scheme will be realized.
CATEgORY OF SCHEME: Retirement Fund
FUND MANAgER ¥
Chirag Setalvad (Equities) (since February 26, 2016)
Total Experience - Over 21 years &Shobhit Mehrotra (Debt) (since February 26, 2016)
Total Experience: Over 25 years
iNCEPTiON DATE (Date of Allotment)February 26, 2016
NAV (AS ON MAY 31, 2019) NAV PER UNIT (`)Regular Plan 13.3038Direct Plan 13.9871
ASSETS UNDER MANAgEMENT (`) iN CROREAs on May 31, 2019 66.29Average for Month of May, 2019 65.07
qUANTiTATiVE DATAAverage Maturity * 4.47 yearsMacaulay Duration * 3.57 yearsModified Duration * 3.34 yearsYield to Maturity * 7.95%* computed on the invested amount for debt portfolio.
TOTAL ExPENSE RATIO (As on May 31, 2019)Including Additional expenses and Goods and Service Tax on Management FeesRegular: 2.28% Direct: 1.14%
#BENCHMARK iNDEX: NIFTY 50 Hybrid composite Debt 15:85 Index##ADDl. BENCHMARK iNDEX: cRISIL 10 Year Gilt Index
EXiT lOADUpon completion of lock-in period: Nil
PLANS & OPTIONSRegular Plan, Direct Plan. Under Each Plan offers Growth Option only.MiNiMUM APPliCATiON AMOUNTPurchase : ` 5,000 and any amount thereafter.Additional Purchase : ` 1,000 and any amount thereafter.
lOCK-iN PERiODExisting investments by investors including SiP / STP registrations, etc (until june 1, 2018):Units purchased cannot be assigned / transferred / pledged / redeemed / switched out until completion of 5 years from the date of allotment of Units under the Scheme. Fresh investments by investors including SiP / STP registrations, etc (effective june 2, 2018): Units purchased cannot be assigned / transferred / pledged / redeemed / switched out until completion of 5 years from the date of allotment of Units or Retirement Age of Unit holder (i.e. completion of 60 years), whichever is earlier.¥ Dedicated Fund Manager for Overseas Investments:
Mr. Amar Kalkundrikar (Total Experience: Over 16 years).
Face Value per Unit: ` 10 unless otherwise specified, + Industry classification as recommended by AMFI, Data is as of May 31, 2019 unless otherwise specified.
PERFORMANCE ^ - Regular plan - growth Option
Date Period Scheme Returns
(%)
Benchmark Returns
(%)#
Additional Benchmark
Returns (%) ##
Value of ` 10,000 invested
Scheme (`)
Benchmark (`)#
Additional Benchmark
(`)##
May 31, 18 Last 1 Year 6.29 10.91 12.20 10,629 11,091 11,220May 31, 16 Last 3 Years 8.19 8.77 6.75 12,664 12,868 12,165Feb 26, 16 Since Inception 9.15 10.04 7.51 13,304 13,659 12,661
Returns greater than 1 year period are compounded annualized (cAGR). Scheme performance may not strictly be comparable with that of its Additional Benchmark in view of hybrid nature of the scheme where a portion of scheme’s investments are made in equity instruments. The Scheme is in existence for more than 3 years but less than 5 years. For performance of other schemes managed by chirag Setalvad (equities) and Shobhit Mehrotra (Debt), please refer page 52. Different plans viz. Regular Plan and Direct Plan have a different expense structure. The expenses of the Direct Plan under the Scheme will be lower to the extent of the distribution expenses / commission charged in the Regular Plan. For Performance of Direct Plan, refer page no. 65.
This product is suitable for investors who are seeking ~
l a corpus to provide for pension in the form of income to the extent of the redemption value of their holding after the age of 60 years.
l investment predominantly in debt and money market instruments & balance in equity and equity related instruments.
Riskometer
Investors understand that their principal will be at moderately high risk
~ Investors should consult their financial advisers if in doubt about whether the product is suitable for them. ^Past performance may or may not be sustained in the future. Load is not taken into consideration for computation of performance.
Portfolio Classification By Asset Class (%)
n equity 18.72
n G-Sec 29.97
n credit Exposure 43.52
n cash, cash Equivalents and Net current Assets 7.79
Portfolio Classification By Rating Class (%)
n equity 18.72n Sovereign 29.97n AAA/AAA(SO)/A1+/A1+(SO)
& equivalent 23.55n AA+ 6.76n AA/AA- 2.89n A+ & Below 10.32n cash, cash Equivalents and
Net current Assets 7.79
[An open ended retirement solution oriented scheme having a lock-in of 5 years or till retirement age (whichever is earlier)]
HDFC Retirement Savings Fund - Hybrid Debt Plan(A notified Tax Savings Cum Pension Scheme)
Company Industry+ / Rating % to NAV
EqUiTY & EqUiTY RElATED
IcIcI Bank Ltd. Banks 1.58
HDFc Bank Ltd. Banks 1.24
Aarti Industries Ltd. chemicals 0.92
Sundram Fasteners Ltd. Auto Ancillaries 0.90
Reliance Industries Ltd. Petroleum Products 0.80
Larsen and Toubro Ltd. construction Project 0.78
NIIT Technologies Ltd. Software 0.73
Axis Bank Ltd. Banks 0.71
Infosys Ltd. Software 0.64
Blue Star Ltd. consumer Durables 0.61
chambal Fertilizers & chemicals Ltd. Fertilisers 0.57
carborundum Universal Ltd. Industrial Products 0.51
State Bank of India Banks 0.51
Tata Steel Ltd. Ferrous Metals 0.47
Oriental carbon & chemicals Ltd. chemicals 0.46
Redington (India) Ltd. Transportation 0.45
Avanti Feeds Ltd. consumer Non Durables 0.42
Bajaj electricals Ltd. consumer Durables 0.41
Vesuvius India Ltd. Industrial Products 0.39
Kalpataru Power Transmission Ltd. Power 0.38
Mahindra Holidays & Resorts India Ltd.
Hotels/Resorts & Other Recreational Activities 0.38
NRB Bearing Ltd. Industrial Products 0.38
Time Technoplast Ltd. Industrial Products 0.38
Hindustan Petroleum corporation Ltd. Petroleum Products 0.37
Indian Hotels company Ltd. Hotels/Resorts & Other Recreational Activities 0.37
SKF India Ltd. Industrial Products 0.35
Zensar Technologies Ltd. Software 0.35
GNA Axles Ltd. Auto Ancillaries 0.33
Timken India Ltd. Industrial Products 0.31
Apar Industries Ltd. Industrial capital Goods 0.30
Bank of Baroda Banks 0.26
Power Grid corporation of India Ltd. Power 0.26
Nilkamal Ltd. Industrial Products 0.24
Company Industry+ / Rating % to NAV
Aurobindo Pharma Ltd. Pharmaceuticals 0.20
Sadbhav engineering Ltd. construction Project 0.19
Poddar Pigments Ltd. chemicals 0.18
Tube Investments of India Ltd. Auto Ancillaries 0.18
Tamilnadu Newsprint & Papers Ltd. Paper 0.15
Tata Motors Ltd. DVR Auto 0.06
Sub Total 18.72
DEBT & DEBT RElATED
gOVERNMENT SECURiTiES (CENTRAl/STATE)
• 7.37 GOI 2023 Sovereign 11.55
• 7.68 GOI 2023 Sovereign 10.89
• 8.27 GOI 2020 Sovereign 7.53
Sub Total 29.97
CREDiT EXPOSURE
• Indian Railways Finance
corporation Ltd. cRISIL - AAA 7.75
• Power Grid corporation of
India Ltd. cRISIL - AAA 7.53
• Starlite Lighting Ltd.
(corporate Guarantee of
Bajaj electrical Ltd.) IcRA - A+(SO) 7.27
• State Bank of India cRISIL - AA+ 6.76
• Jamnagar Utilities & Power
Pvt. Ltd. (erstwhile Reliance
Utilities & Power Pvt. Ltd.) cARE - AAA 3.79
• Syndicate Bank cARE - A+ 3.05
• Reliance Jio Infocomm Ltd. cRISIL - AAA 2.93
Union Bank of India cARE - AA- 2.89
Power Finance corporation Ltd. cRISIL - AAA 1.55
Sub Total 43.52
Total 73.49
cash, cash Equivalents and Net current Assets 7.79
Grand Total 100.00
• Top Ten Holdings
PORTFOLIO

30 May 2019
CATEgORY OF SCHEME: EqUITY SAVINGS FUND
KEY FACTS
iNVESTMENT OBjECTiVETo provide capital appreciation by investing in equity & equity related instruments, Arbitrage opportunities, and Debt & money market instruments.There is no assurance that the investment objective of the Scheme will be realized.
CATEgORY OF SCHEME: Equity Savings Fund
FUND MANAgER ¥
Vinay Kulkarni (equities) (since November 21, 06)
Total Experience: Over 29 years Krishan Kumar Daga (equities) (since January 08, 16)
Total Experience: Over 22 yearsAnil Bamboli (Debt) (since September 17, 04)
Total Experience: Over 23 years
iNCEPTiON DATE (Date of Allotment)September 17, 2004
NAV (AS ON MAY 31, 2019) NAV PER UNIT (`)Regular Plan - Growth Option 37.386Regular Plan - Dividend Option 11.288Direct Plan - Growth Option 39.709Direct Plan - Dividend Option 12.163
ASSETS UNDER MANAgEMENT (`) iN CROREAs on May 31, 2019 5,613.93Average for Month of May, 2019 5,626.98
qUANTiTATiVE DATAPortfolio Turnover Ratio 23.42%Average Maturity * 1.72 yearsMacaulay Duration * 1.55 yearsModified Duration * 1.43 yearsYield to Maturity * 8.49%* computed on the invested amount for debt portfolio.
TOTAL ExPENSE RATIO (As on May 31, 2019)Including Additional expenses and Goods and Service Tax on Management FeesRegular: 1.95% Direct: 1.16%
#BENCHMARK iNDEX: 40% NIFTY 50 Arbitrage Index, 30% cRISIL Short Term Bond Fund Index and 30% NIFTY 50 (Total Returns Index)
##ADDl. BENCHMARK iNDEX: NIFTY 50 (Total Returns Index)
EXiT lOADl In respect of each purchase / switch-in of Units, upto 15%
of the units may be redeemed without any exit load from the date of allotment.
l Any redemption in excess of the above limit shall be subject to the following exit load:
n exit load of 1.00% is payable if Units are redeemed / switched-out within 1 year from the date of allotment of units.
l No exit Load is payable if Units are redeemed / switched-out after 1 year from the date of allotment.
For further details, please refer to para ‘Exit Load’ on Pg 52.
PLANS & OPTIONSRegular Plan, Direct Plan. Under each Plan : Growth & Dividend. The Dividend Option offers Dividend Payout and Reinvestment facility.
MiNiMUM APPliCATiON AMOUNTPurchase : ` 5,000 and any amount thereafter.Additional Purchase : ` 1,000 and any amount thereafter.
¥ Dedicated Fund Manager for Overseas Investments: Mr. Amar Kalkundrikar (Total Experience: Over 16 years).
This product is suitable for investors who are seeking ~l capital appreciation while generating income over medium to
long term.l provide capital appreciation and income distribution to the
investors by using equity and equity related instruments, arbitrage opportunities, and investments in debt and money market instruments.
Riskometer
Investors understand that their principal will be at moderately high risk
~ Investors should consult their financial advisers if in doubt about whether the product is suitable for them.
SiP PERFORMANCE ^ - Regular plan - growth OptionSince Inception SIP 10 year SIP 5 Year SIP 3 Year SIP 1 Year SIP
Total Amount Invested (` ‘000) 1,770.00 1,200.00 600.00 360.00 120.00 Mkt Value As on May 31, 2019 (` ‘000) 3,733.12 1,955.64 751.66 404.77 126.21 Returns (%) 9.50 9.44 8.96 7.78 9.78 Benchmark Returns (%) # N.A. N.A. N.A. N.A. N.A. Additional Benchmark Returns (%) ## 12.59 12.18 12.37 14.19 16.44
Assuming ` 10,000 invested systematically on the first Business Day of every month over a period of time. cAGR returns are computed after accounting for the cash flow by using xIRR method (investment internal rate of return) for Regular Plan - Growth Option. The above investment simulation is for illustrative purposes only and should not be construed as a promise on minimum returns and safeguard of capital. N.A. Not Available.
PERFORMANCE ^ - Regular plan - growth OptionDate Period^^ Scheme
Returns (%)
Benchmark Returns
(%)#
Additional Benchmark
Returns (%) ##
Value of ` 10,000 investedScheme (`) Benchmark
(`)#Additional
Benchmark (`)##
May 31, 18 Last 1 Year 7.04 9.07 12.43 10,704 10,907 11,243May 31, 16 Last 3 Years 11.11 9.03 14.99 13,718 12,962 15,203May 30, 14 Last 5 Years 8.97 8.71 11.92 15,376 15,190 17,571Sep 17, 04 Since Inception 9.38 N.A. 15.44 37,386 N.A. 82,661
^^Effective December 16, 2015, certain changes, including changes to fundamental attributes, were effected in the erstwhile HDFc Multiple Yield Fund, (an open ended income scheme) which was renamed as HDFc Equity Savings Fund, an open ended equity scheme. On account of these changes, the performance during the period(s) from September 17, 2004 to December 15, 2015 is not comparable.Returns greater than 1 year period are compounded annualized (cAGR). N.A. Not Available. Scheme performance may not strictly be comparable with that of its Additional Benchmark, since a portion of scheme’s investments are made in debt instruments. Performance of dividend option under the schemes for the investors would be net of distribution tax as applicable. For performance of other schemes managed by Vinay Kulkarni (equities), Krishan Kumar Daga (equities) and Anil Bamboli (Debt), please refer page 52. Different plans viz. Regular Plan and Direct Plan have a different expense structure. The expenses of the Direct Plan under the Scheme will be lower to the extent of the distribution expenses / commission charged in the Regular Plan. For Performance of Direct Plan, refer page no. 64.^Past performance may or may not be sustained in the future. Load is not taken into consideration for computation of performance.
Face Value per Unit: ` 10 unless otherwise specified, + Industry classification as recommended by AMFI, Data is as of May 31, 2019 unless otherwise specified. ...contd on next page
PORTFOLIO
Portfolio Classification By Rating Class (%)
n equity 68.67n Sovereign 1.26n AAA/AAA(SO)/A1+/A1+(SO)
& equivalent 7.77n AA+ 5.08n AA/AA- 1.78n A+ & Below 5.03n cash, cash Equivalents and
Net current Assets 10.41
(An open ended scheme investing in equity, arbitrage and debt)HDFC Equity Savings Fund
Company Industry+ / Rating % to NAV (Hedged & Unhedged)
% exposure of Derivative
EqUiTY & EqUiTY RElATED• Reliance Industries Ltd. Petroleum Products 5.32 1.11• Housing Development Finance corporation
Ltd. £ Finance 5.20 5.20• IcIcI Bank Ltd. Banks 4.62 0.00• NTPc Ltd. Power 3.78 0.01• Infosys Ltd. Software 3.41 0.08• HDFc Bank Ltd. Banks 3.17 0.00• Larsen and Toubro Ltd. construction Project 2.99 0.00• State Bank of India Banks 2.98 0.27Tata Steel Ltd. Ferrous Metals 2.06 1.89GAIL (India) Ltd. Gas 1.63 0.00Vedanta Ltd. Non - Ferrous Metals 1.35 0.00
Company Industry+ / Rating % to NAV (Hedged & Unhedged)
% exposure of Derivative
Aurobindo Pharma Ltd. Pharmaceuticals 1.27 0.75ITc Ltd. consumer Non Durables 1.25 0.14Yes Bank Ltd. Banks 1.23 1.21Sun Pharmaceutical Industries Ltd. Pharmaceuticals 1.18 1.18Maruti Suzuki India Ltd. Auto 1.15 1.15Dr Reddys Laboratories Ltd. Pharmaceuticals 0.97 0.97Mahindra & Mahindra Ltd. Auto 0.96 0.76Bajaj Finance Ltd. Finance 0.92 0.92Tata Motors Ltd. Auto 0.87 0.62LIc Housing Finance Ltd. Finance 0.82 0.82Shriram Transport Finance company Ltd. Finance 0.78 0.77Oil & Natural Gas corporation Ltd. Oil 0.77 0.00DLF Ltd. construction 0.73 0.73
PORTFOLIO
Industry Allocation of Equity Holding (% of Net Assets)
0.010.070.140.150.170.200.280.360.400.520.600.740.770.791.031.111.351.73
3.164.03
4.954.96
11.07
0 2 4 6 8 10 12
Media & EntertainmentCement
Auto AncillariesPesticides
Ferrous MetalsFinance
Minerals/MiningTelecom - Services
ChemicalsTransportation
AutoConstruction
OilPharmaceuticals
Industrial Capital GoodsConsumer Non Durables
Non - Ferrous MetalsGas
Construction ProjectSoftware
PowerPetroleum Products
Banks
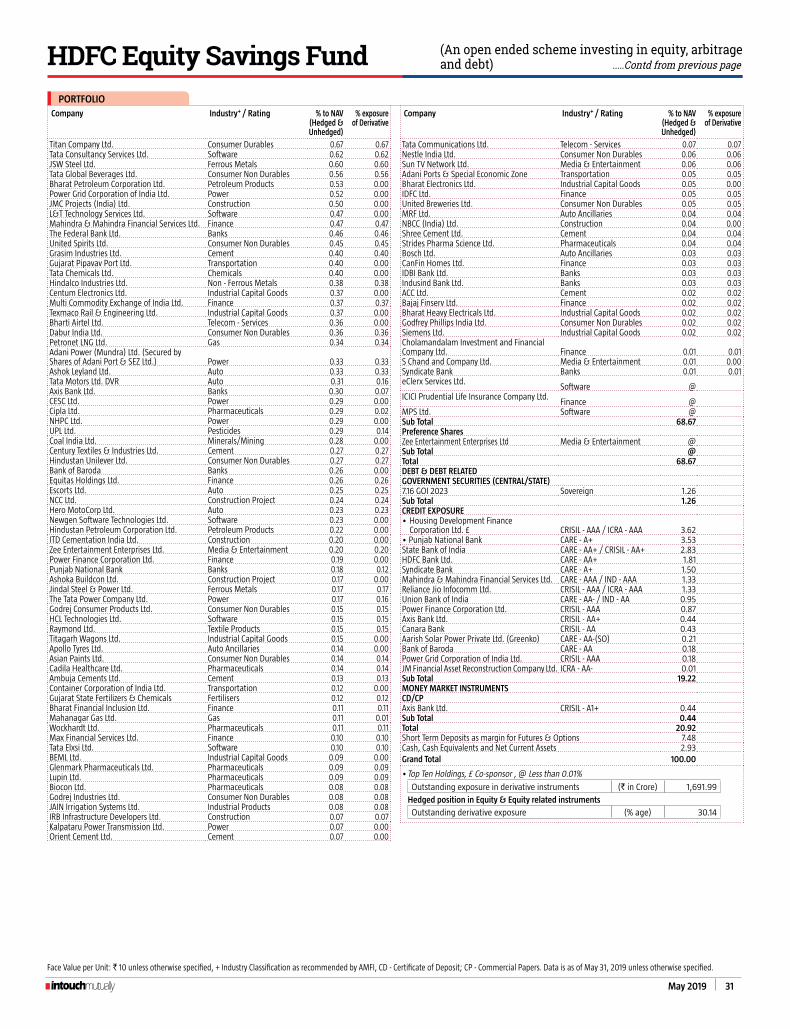
May 2019 31
Face Value per Unit: ` 10 unless otherwise specified, + Industry classification as recommended by AMFI, cD - certificate of Deposit; cP - commercial Papers. Data is as of May 31, 2019 unless otherwise specified.
(An open ended scheme investing in equity, arbitrage and debt) .....Contd from previous pageHDFC Equity Savings Fund
Company Industry+ / Rating % to NAV (Hedged & Unhedged)
% exposure of Derivative
Titan company Ltd. consumer Durables 0.67 0.67Tata consultancy Services Ltd. Software 0.62 0.62JSW Steel Ltd. Ferrous Metals 0.60 0.60Tata Global Beverages Ltd. consumer Non Durables 0.56 0.56Bharat Petroleum corporation Ltd. Petroleum Products 0.53 0.00Power Grid corporation of India Ltd. Power 0.52 0.00JMc Projects (India) Ltd. construction 0.50 0.00L&T Technology Services Ltd. Software 0.47 0.00Mahindra & Mahindra Financial Services Ltd. Finance 0.47 0.47The Federal Bank Ltd. Banks 0.46 0.46United Spirits Ltd. consumer Non Durables 0.45 0.45Grasim Industries Ltd. cement 0.40 0.40Gujarat Pipavav Port Ltd. Transportation 0.40 0.00Tata chemicals Ltd. chemicals 0.40 0.00Hindalco Industries Ltd. Non - Ferrous Metals 0.38 0.38centum Electronics Ltd. Industrial capital Goods 0.37 0.00Multi commodity Exchange of India Ltd. Finance 0.37 0.37Texmaco Rail & engineering Ltd. Industrial capital Goods 0.37 0.00Bharti Airtel Ltd. Telecom - Services 0.36 0.00Dabur India Ltd. consumer Non Durables 0.36 0.36Petronet LNG Ltd. Gas 0.34 0.34Adani Power (Mundra) Ltd. (Secured by Shares of Adani Port & SeZ Ltd.) Power 0.33 0.33Ashok Leyland Ltd. Auto 0.33 0.33Tata Motors Ltd. DVR Auto 0.31 0.16Axis Bank Ltd. Banks 0.30 0.07cESc Ltd. Power 0.29 0.00cipla Ltd. Pharmaceuticals 0.29 0.02NHPc Ltd. Power 0.29 0.00UPL Ltd. Pesticides 0.29 0.14coal India Ltd. Minerals/Mining 0.28 0.00century Textiles & Industries Ltd. cement 0.27 0.27Hindustan Unilever Ltd. consumer Non Durables 0.27 0.27Bank of Baroda Banks 0.26 0.00equitas Holdings Ltd. Finance 0.26 0.26escorts Ltd. Auto 0.25 0.25Ncc Ltd. construction Project 0.24 0.24Hero Motocorp Ltd. Auto 0.23 0.23Newgen Software Technologies Ltd. Software 0.23 0.00Hindustan Petroleum corporation Ltd. Petroleum Products 0.22 0.00ITD cementation India Ltd. construction 0.20 0.00Zee entertainment enterprises Ltd. Media & entertainment 0.20 0.20Power Finance corporation Ltd. Finance 0.19 0.00Punjab National Bank Banks 0.18 0.12Ashoka Buildcon Ltd. construction Project 0.17 0.00Jindal Steel & Power Ltd. Ferrous Metals 0.17 0.17The Tata Power company Ltd. Power 0.17 0.16Godrej consumer Products Ltd. consumer Non Durables 0.15 0.15HcL Technologies Ltd. Software 0.15 0.15Raymond Ltd. Textile Products 0.15 0.15Titagarh Wagons Ltd. Industrial capital Goods 0.15 0.00Apollo Tyres Ltd. Auto Ancillaries 0.14 0.00Asian Paints Ltd. consumer Non Durables 0.14 0.14cadila Healthcare Ltd. Pharmaceuticals 0.14 0.14Ambuja cements Ltd. cement 0.13 0.13container corporation of India Ltd. Transportation 0.12 0.00Gujarat State Fertilizers & chemicals Fertilisers 0.12 0.12Bharat Financial Inclusion Ltd. Finance 0.11 0.11Mahanagar Gas Ltd. Gas 0.11 0.01Wockhardt Ltd. Pharmaceuticals 0.11 0.11Max Financial Services Ltd. Finance 0.10 0.10Tata elxsi Ltd. Software 0.10 0.10BeML Ltd. Industrial capital Goods 0.09 0.00Glenmark Pharmaceuticals Ltd. Pharmaceuticals 0.09 0.09Lupin Ltd. Pharmaceuticals 0.09 0.09Biocon Ltd. Pharmaceuticals 0.08 0.08Godrej Industries Ltd. consumer Non Durables 0.08 0.08JAIN Irrigation Systems Ltd. Industrial Products 0.08 0.08IRB Infrastructure Developers Ltd. construction 0.07 0.07Kalpataru Power Transmission Ltd. Power 0.07 0.00Orient cement Ltd. cement 0.07 0.00
Company Industry+ / Rating % to NAV (Hedged & Unhedged)
% exposure of Derivative
Tata communications Ltd. Telecom - Services 0.07 0.07Nestle India Ltd. consumer Non Durables 0.06 0.06Sun TV Network Ltd. Media & entertainment 0.06 0.06Adani Ports & Special economic Zone Transportation 0.05 0.05Bharat electronics Ltd. Industrial capital Goods 0.05 0.00IDFc Ltd. Finance 0.05 0.05United Breweries Ltd. consumer Non Durables 0.05 0.05MRF Ltd. Auto Ancillaries 0.04 0.04NBcc (India) Ltd. construction 0.04 0.00Shree cement Ltd. cement 0.04 0.04Strides Pharma Science Ltd. Pharmaceuticals 0.04 0.04Bosch Ltd. Auto Ancillaries 0.03 0.03canFin Homes Ltd. Finance 0.03 0.03IDBI Bank Ltd. Banks 0.03 0.03Indusind Bank Ltd. Banks 0.03 0.03Acc Ltd. cement 0.02 0.02Bajaj Finserv Ltd. Finance 0.02 0.02Bharat Heavy electricals Ltd. Industrial capital Goods 0.02 0.02Godfrey Phillips India Ltd. consumer Non Durables 0.02 0.02Siemens Ltd. Industrial capital Goods 0.02 0.02cholamandalam Investment and Financial company Ltd. Finance 0.01 0.01S chand and company Ltd. Media & entertainment 0.01 0.00Syndicate Bank Banks 0.01 0.01eclerx Services Ltd.
Software @IcIcI Prudential Life Insurance company Ltd.
Finance @MPS Ltd. Software @Sub Total 68.67Preference SharesZee entertainment enterprises Ltd Media & entertainment @Sub Total @Total 68.67DEBT & DEBT RElATEDgOVERNMENT SECURiTiES (CENTRAl/STATE)7.16 GOI 2023 Sovereign 1.26Sub Total 1.26CREDiT EXPOSURE • Housing Development Finance
corporation Ltd. £ cRISIL - AAA / IcRA - AAA 3.62• Punjab National Bank cARE - A+ 3.53State Bank of India cARE - AA+ / cRISIL - AA+ 2.83HDFc Bank Ltd. cARE - AA+ 1.81Syndicate Bank cARE - A+ 1.50Mahindra & Mahindra Financial Services Ltd. cARE - AAA / IND - AAA 1.33Reliance Jio Infocomm Ltd. cRISIL - AAA / IcRA - AAA 1.33Union Bank of India cARE - AA- / IND - AA 0.95Power Finance corporation Ltd. cRISIL - AAA 0.87Axis Bank Ltd. cRISIL - AA+ 0.44canara Bank cRISIL - AA 0.43Aarish Solar Power Private Ltd. (Greenko) cARE - AA-(SO) 0.21Bank of Baroda cARE - AA 0.18Power Grid corporation of India Ltd. cRISIL - AAA 0.18JM Financial Asset Reconstruction company Ltd. IcRA - AA- 0.01Sub Total 19.22MONEY MARKET INSTRUMENTSCD/CPAxis Bank Ltd. cRISIL - A1+ 0.44Sub Total 0.44Total 20.92Short Term Deposits as margin for Futures & Options 7.48cash, cash Equivalents and Net current Assets 2.93Grand Total 100.00
• Top Ten Holdings, £ co-sponsor , @ Less than 0.01%
Outstanding exposure in derivative instruments (` in crore) 1,691.99
Hedged position in Equity & Equity related instruments
Outstanding derivative exposure (% age) 30.14
PORTFOLIO
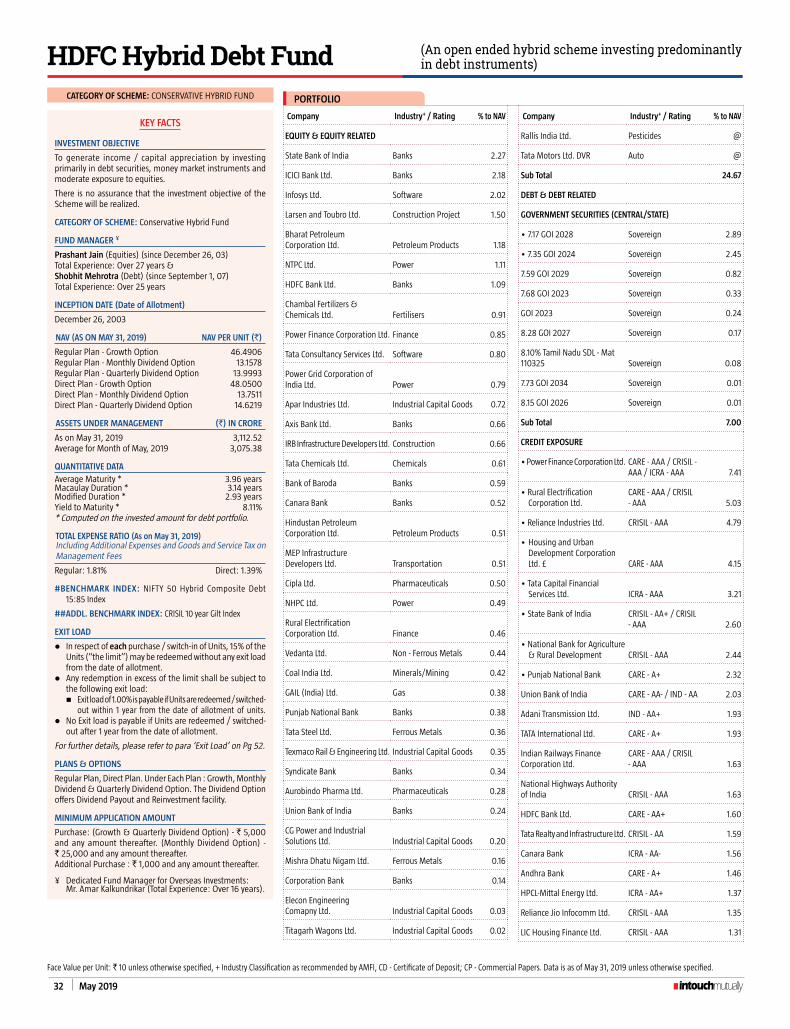
32 May 2019
CATEgORY OF SCHEME: cONSERVATIVE HYBRID FUND
KEY FACTS
iNVESTMENT OBjECTiVE
To generate income / capital appreciation by investing primarily in debt securities, money market instruments and moderate exposure to equities.
There is no assurance that the investment objective of the Scheme will be realized.
CATEgORY OF SCHEME: conservative Hybrid Fund
FUND MANAgER ¥
Prashant Jain (equities) (since December 26, 03)
Total Experience: Over 27 years &Shobhit Mehrotra (Debt) (since September 1, 07)
Total Experience: Over 25 years
iNCEPTiON DATE (Date of Allotment)
December 26, 2003
NAV (AS ON MAY 31, 2019) NAV PER UNIT (`)
Regular Plan - Growth Option 46.4906Regular Plan - Monthly Dividend Option 13.1578Regular Plan - quarterly Dividend Option 13.9993Direct Plan - Growth Option 48.0500Direct Plan - Monthly Dividend Option 13.7511Direct Plan - quarterly Dividend Option 14.6219
ASSETS UNDER MANAgEMENT (`) iN CRORE
As on May 31, 2019 3,112.52Average for Month of May, 2019 3,075.38
qUANTiTATiVE DATA
Average Maturity * 3.96 yearsMacaulay Duration * 3.14 yearsModified Duration * 2.93 yearsYield to Maturity * 8.11%* computed on the invested amount for debt portfolio.
TOTAL ExPENSE RATIO (As on May 31, 2019)Including Additional expenses and Goods and Service Tax on Management Fees
Regular: 1.81% Direct: 1.39%
#BENCHMARK iNDEX: NIFTY 50 Hybrid composite Debt 15:85 Index
##ADDl. BENCHMARK iNDEX: cRISIL 10 year Gilt Index
EXiT lOAD
l In respect of each purchase / switch-in of Units, 15% of the Units (“the limit”) may be redeemed without any exit load from the date of allotment.
l Any redemption in excess of the limit shall be subject to the following exit load:
n exit load of 1.00% is payable if Units are redeemed / switched-out within 1 year from the date of allotment of units.
l No exit load is payable if Units are redeemed / switched-out after 1 year from the date of allotment.
For further details, please refer to para ‘Exit Load’ on Pg 52.
PLANS & OPTIONS
Regular Plan, Direct Plan. Under each Plan : Growth, Monthly Dividend & quarterly Dividend Option. The Dividend Option offers Dividend Payout and Reinvestment facility.
MiNiMUM APPliCATiON AMOUNT
Purchase: (Growth & quarterly Dividend Option) - ` 5,000 and any amount thereafter. (Monthly Dividend Option) - ` 25,000 and any amount thereafter.Additional Purchase : ` 1,000 and any amount thereafter.
¥ Dedicated Fund Manager for Overseas Investments: Mr. Amar Kalkundrikar (Total Experience: Over 16 years).
Face Value per Unit: ` 10 unless otherwise specified, + Industry classification as recommended by AMFI, cD - certificate of Deposit; cP - commercial Papers. Data is as of May 31, 2019 unless otherwise specified.
Company Industry+ / Rating % to NAV
EqUiTY & EqUiTY RElATED
State Bank of India Banks 2.27
IcIcI Bank Ltd. Banks 2.18
Infosys Ltd. Software 2.02
Larsen and Toubro Ltd. construction Project 1.50
Bharat Petroleum corporation Ltd. Petroleum Products 1.18
NTPc Ltd. Power 1.11
HDFc Bank Ltd. Banks 1.09
chambal Fertilizers & chemicals Ltd. Fertilisers 0.91
Power Finance corporation Ltd. Finance 0.85
Tata consultancy Services Ltd. Software 0.80
Power Grid corporation of India Ltd. Power 0.79
Apar Industries Ltd. Industrial capital Goods 0.72
Axis Bank Ltd. Banks 0.66
IRB Infrastructure Developers Ltd. construction 0.66
Tata chemicals Ltd. chemicals 0.61
Bank of Baroda Banks 0.59
canara Bank Banks 0.52
Hindustan Petroleum corporation Ltd. Petroleum Products 0.51
MeP Infrastructure Developers Ltd. Transportation 0.51
cipla Ltd. Pharmaceuticals 0.50
NHPc Ltd. Power 0.49
Rural electrification corporation Ltd. Finance 0.46
Vedanta Ltd. Non - Ferrous Metals 0.44
coal India Ltd. Minerals/Mining 0.42
GAIL (India) Ltd. Gas 0.38
Punjab National Bank Banks 0.38
Tata Steel Ltd. Ferrous Metals 0.36
Texmaco Rail & engineering Ltd. Industrial capital Goods 0.35
Syndicate Bank Banks 0.34
Aurobindo Pharma Ltd. Pharmaceuticals 0.28
Union Bank of India Banks 0.24
cG Power and Industrial Solutions Ltd. Industrial capital Goods 0.20
Mishra Dhatu Nigam Ltd. Ferrous Metals 0.16
corporation Bank Banks 0.14
elecon engineering comapny Ltd. Industrial capital Goods 0.03
Titagarh Wagons Ltd. Industrial capital Goods 0.02
Company Industry+ / Rating % to NAV
Rallis India Ltd. Pesticides @
Tata Motors Ltd. DVR Auto @
Sub Total 24.67
DEBT & DEBT RElATED
gOVERNMENT SECURiTiES (CENTRAl/STATE)
• 7.17 GOI 2028 Sovereign 2.89
• 7.35 GOI 2024 Sovereign 2.45
7.59 GOI 2029 Sovereign 0.82
7.68 GOI 2023 Sovereign 0.33
GOI 2023 Sovereign 0.24
8.28 GOI 2027 Sovereign 0.17
8.10% Tamil Nadu SDL - Mat 110325 Sovereign 0.08
7.73 GOI 2034 Sovereign 0.01
8.15 GOI 2026 Sovereign 0.01
Sub Total 7.00
CREDiT EXPOSURE
• Power Finance corporation Ltd. cARE - AAA / cRISIL - AAA / IcRA - AAA 7.41
• Rural Electrification corporation Ltd.
cARE - AAA / cRISIL - AAA 5.03
• Reliance Industries Ltd. cRISIL - AAA 4.79
• Housing and Urban Development corporation Ltd. £ cARE - AAA 4.15
• Tata capital Financial Services Ltd. IcRA - AAA 3.21
• State Bank of India cRISIL - AA+ / cRISIL - AAA 2.60
• National Bank for Agriculture & Rural Development cRISIL - AAA 2.44
• Punjab National Bank cARE - A+ 2.32
Union Bank of India cARE - AA- / IND - AA 2.03
Adani Transmission Ltd. IND - AA+ 1.93
TATA International Ltd. cARE - A+ 1.93
Indian Railways Finance corporation Ltd.
cARE - AAA / cRISIL - AAA 1.63
National Highways Authority of India cRISIL - AAA 1.63
HDFc Bank Ltd. cARE - AA+ 1.60
Tata Realty and Infrastructure Ltd. cRISIL - AA 1.59
canara Bank IcRA - AA- 1.56
Andhra Bank cARE - A+ 1.46
HPcL-Mittal Energy Ltd. IcRA - AA+ 1.37
Reliance Jio Infocomm Ltd. cRISIL - AAA 1.35
LIc Housing Finance Ltd. cRISIL - AAA 1.31
(An open ended hybrid scheme investing predominantly in debt instruments)HDFC Hybrid Debt Fund
PORTFOLIO

May 2019 33
Face Value per Unit: ` 10 unless otherwise specified, + Industry classification as recommended by AMFI, Data is as of May 31, 2019 unless otherwise specified.
This product is suitable for investors who are seeking ~
l to generate long-term income / capital appreciation
l investments primarily in debt securities, money market instruments and moderate exposure to equities
Riskometer
Investors understand that their principal will be at moderately high risk
~ Investors should consult their financial advisers if in doubt about whether the product is suitable for them.
SiP PERFORMANCE ^ - Regular plan - growth Option
Since Inception SIP
15 year SIP 10 year SIP 5 Year SIP 3 Year SIP 1 Year SIP
Total Amount Invested (` ‘000) 1,860.00 1,800.00 1,200.00 600.00 360.00 120.00
Mkt Value As on May 31, 2019 (` ‘000) 4,228.09 3,957.07 1,910.14 722.25 395.18 126.94
Returns (%) 9.88 9.82 9.00 7.36 6.16 10.94
Benchmark Returns (%) # 8.81 8.86 8.89 8.58 8.38 13.22
Additional Benchmark Returns (%) ## 6.63 6.72 7.05 7.19 6.53 14.48
Assuming ` 10,000 invested systematically on the first Business Day of every month over a period of time. cAGR returns are computed after accounting for the cash flow by using xIRR method (investment internal rate of return) for Regular Plan - Growth Option. The above investment simulation is for illustrative purposes only and should not be construed as a promise on minimum returns and safeguard of capital.
PERFORMANCE ^ - Regular plan - growth Option
Date Period Scheme Returns
(%)
Benchmark Returns
(%)#
Additional Benchmark
Returns (%) ##
Value of ` 10,000 invested
Scheme (`) Benchmark (`)#
Additional Benchmark (`)##
May 31, 18 Last 1 Year 8.07 10.91 12.20 10,807 11,091 11,220
May 31, 16 Last 3 Years 8.28 8.77 6.75 12,695 12,868 12,165
May 30, 14 Last 5 Years 8.63 9.25 8.23 15,132 15,571 14,859
Dec 26, 03 Since Inception 10.47 8.27 5.57 46,491 34,094 23,095
Returns greater than 1 year period are compounded annualized (cAGR). Scheme performance may not strictly be comparable with that of its Additional Benchmark in view of hybrid nature of the scheme where a portion of scheme’s investments are made in equity instruments. For performance of other schemes managed by Prashant Jain (Equities) and Shobhit Mehrotra (Debt), please refer page 52. Different plans viz. Regular Plan and Direct Plan have a different expense structure. The expenses of the Direct Plan under the Scheme will be lower to the extent of the distribution expenses / commission charged in the Regular Plan. For Performance of Direct Plan, refer page no. 64.
^Past performance may or may not be sustained in the future. Load is not taken into consideration for computation of performance.
Note: Effective close of business hours of May 25, 2018, HDFc MF Monthly Income Plan – Long Term Plan (MIP-LTP) underwent changes in Fundamental Attributes and was renamed as HDFc Hybrid Debt Fund (HHDF) and HDFc MF Monthly Income Plan – Short Term Plan was merged therein. As the portfolio structuring of HHDF closely resembles the erstwhile MIP-LTP, the past performance of MIP-LTP is provided, in line with SeBI circular on Performance disclosure post consolidation/ merger of scheme dated April 12, 2018.
Portfolio Classification By Asset Class (%)
n equity 24.67
n G-Sec, SDL 7.00
n cP 0.76
n cD 1.60n credit Exposure 60.28
n cash, cash Equivalents and Net current Assets 5.69
Portfolio Classification By Rating Class (%)
n equity 24.67n Sovereign 7.00n AAA/AAA(SO)/A1+/A1+(SO)
& equivalent 41.63n AA+ 6.47n AA/AA- 7.14n A+ & Below 7.40n cash, cash Equivalents and
Net current Assets 5.69
(An open ended hybrid scheme investing predominantly in debt instruments) .....Contd from previous pageHDFC Hybrid Debt Fund
Company Industry+ / Rating % to NAV
The Tata Power company Ltd. cRISIL - AA- 1.16
Andhra Pradesh expressway Ltd. (NHAI Annuity) IcRA - AAA(SO) 1.06
Power Grid corporation of India Ltd. cRISIL - AAA 1.01
Syndicate Bank cARE - A+ 0.99
Kotak Mahindra Bank Ltd. cRISIL - AAA 0.83
Bank of Baroda cARE - AA+ 0.80
Housing Development Finance corporation Ltd. £ cRISIL - AAA 0.80
Hazaribagh Ranchi expressway Ltd. (NHAI Annuity) cARE - D 0.66
Shriram city Union Finance Ltd. cARE - AA+ 0.40
EcL Finance Ltd. IcRA - A1+ 0.34
Hindalco Industries Ltd. cRISIL - AA 0.33
Vedanta Ltd. cRISIL - AA 0.22
Tata Steel Ltd. cARE - AA- 0.17
Company Industry+ / Rating % to NAV
Tata Motors Ltd. cARE - AA 0.08
Bharati Telecom Ltd. cRISIL - AA+ 0.05
Asian Satellite Broadcast Pvt. Ltd. (Secured with shares of Zee entertainment enterprise Ltd.) BRIcKWORKS - BBB 0.04
Sub Total 60.28
Total 67.28
MONEY MARKET INSTRUMENTS
CD/CP
Axis Bank Ltd. cRISIL - A1+ 1.60
Kotak Mahindra Investments Ltd. cRISIL - A1+ 0.76
Sub Total 2.36
cash, cash Equivalents and Net current Assets 5.69
Grand Total 100.00
• Top Ten Holdings, £ co-sponsor, @ Less than 0.01%
PORTFOLIO

34 May 2019
CATEgORY OF SCHEME: ARBITRAGE FUND
KEY FACTS
iNVESTMENT OBjECTiVE
To generate income through arbitrage opportunities and debt & money market instruments.
There is no assurance that the investment objective of the Scheme will be realized.
CATEgORY OF SCHEME: Arbitrage Fund
FUND MANAgER ¥
Krishan Kumar Daga (since September 10, 15)
Total Experience: Over 22 years
iNCEPTiON DATE (Date of Allotment)
October 23, 2007
NAV (AS ON MAY 31, 2019) NAV PER UNIT (`)
Retail PlanRegular Plan - Growth Option 21.790Regular Plan - Dividend Option 16.185Regular Plan - Quarterly Dividend Option 15.481Direct Plan - Growth Option 22.493Direct Plan - Quarterly Dividend Option 17.044
Wholesale PlanRegular Plan - Growth Option 22.266Regular Plan - Dividend Option 10.413Regular Plan - Monthly Dividend Option 10.838Direct Plan - Growth Option 14.191Direct Plan - Dividend Option 10.801Direct Plan - Monthly Dividend Option 10.518
ASSETS UNDER MANAgEMENT (`) iN CRORE
As on May 31, 2019 3,517.18Average for Month of May, 2019 3,435.97
qUANTiTATiVE DATA
Portfolio Turnover Ratio (Last 1 year) 128.94%Average Maturity * 249 daysMacaulay Duration * 234 daysModified Duration * 204 daysYield to Maturity * 7.78%* computed on the invested amount for debt portfolio.
TOTAL ExPENSE RATIO (As on May 31, 2019)Including Additional expenses and Goods and Service Tax on Management Fees
Regular: 0.75% Direct: 0.25%
#BENCHMARK iNDEX: NIFTY 50 Arbitrage Index
##ADDl. BENCHMARK iNDEX: NIFTY 50 (Total Returns Index)
EXiT lOAD
l In respect of each purchase / switch-in of Units, an exit Load of 0.25% is payable if Units are redeemed / switched-out within 1 month from the date of allotment.
l No exit Load is payable if Units are redeemed / switched-out after 1 month from the date of allotment.
For further details, please refer to para ‘Exit Load’ on Pg 52.
PLANS & OPTIONS
(Wholesale Plan) - Regular Plan, (Wholesale Plan) - Direct Plan.Under Each Plan : Growth & Dividend. Dividend Option offers Monthly Dividend Option and Normal Dividend Option with Payout and Reinvestment facility.
MiNiMUM APPliCATiON AMOUNT
Purchase/Additional Purchase: ̀ 1 lakh and any amount thereafter.
¥ Dedicated Fund Manager for Overseas Investments: Mr. Amar Kalkundrikar (Total Experience: Over 16 years).
Company Industry+ / Rating % to NAV
EqUiTY & EqUiTY RElATED (quantity fully hedged using Futures/Options)
EqUITY
• Reliance Industries Ltd. Petroleum Products 7.48
• Aurobindo Pharma Ltd. Pharmaceuticals 4.71
• Sun Pharmaceutical Industries Ltd. Pharmaceuticals
4.70
• Tata consultancy Services Ltd. Software 4.42
• Housing Development Finance corporation Ltd. £ Finance
3.37
• Hindustan Unilever Ltd. consumer Non Durables 2.86
• Mahindra & Mahindra Ltd. Auto 2.57
• Yes Bank Ltd. Banks 2.04
Maruti Suzuki India Ltd. Auto 1.84
Adani Ports & Special economic Zone Transportation
1.54
DLF Ltd. construction 1.34
Nestle India Ltd. consumer Non Durables 1.22
Shriram Transport Finance company Ltd. Finance
1.22
Lupin Ltd. Pharmaceuticals 1.21
Dabur India Ltd. consumer Non Durables 1.13
HDFc Bank Ltd. Banks 1.07
Dr Reddys Laboratories Ltd. Pharmaceuticals 1.06
Adani enterprises Ltd. Trading 1.05
Tata Steel Ltd. Ferrous Metals 1.03
HcL Technologies Ltd. Software 1.00
Ncc Ltd. construction Project 0.94
Indiabulls Housing Finance Ltd. Finance 0.72
Hindalco Industries Ltd. Non - Ferrous Metals 0.71
Bharat Financial Inclusion Ltd. Finance 0.69
Hero Motocorp Ltd. Auto 0.68
UPL Ltd. Pesticides 0.68
Infosys Ltd. Software 0.64
century Textiles & Industries Ltd. cement 0.63
Ashok Leyland Ltd. Auto 0.60
ITc Ltd. consumer Non Durables 0.59
Adani Power (Mundra) Ltd. (Secured by Shares of Adani Port & SeZ Ltd.) Power
0.57
LIc Housing Finance Ltd. Finance 0.56
Tata Motors Ltd. DVR Auto 0.56
Marico Ltd. consumer Non Durables 0.55
Multi commodity Exchange of India Ltd. Finance
0.54
Acc Ltd. cement 0.53
UltraTech cement Ltd. cement 0.49
Godrej consumer Products Ltd. consumer Non Durables 0.48
Tata Motors Ltd. Auto 0.47
The Tata Power company Ltd. Power 0.42
Grasim Industries Ltd. cement 0.41
Bajaj Finance Ltd. Finance 0.40
Hindustan Petroleum corporation Ltd. Petroleum Products 0.39
Bajaj Finserv Ltd. Finance 0.37
Petronet LNG Ltd. Gas 0.36
Raymond Ltd. Textile Products 0.36
Mahindra & Mahindra Financial Services Ltd. Finance
0.35
Company Industry+ / Rating % to NAV
Asian Paints Ltd. consumer Non Durables 0.31
Tata chemicals Ltd. chemicals 0.29
United Spirits Ltd. consumer Non Durables 0.27
cipla Ltd. Pharmaceuticals 0.25
Axis Bank Ltd. Banks 0.24
Bharat Heavy electricals Ltd. Industrial capital Goods 0.21
coal India Ltd. Minerals/Mining 0.21
Vedanta Ltd. Non - Ferrous Metals 0.21
Glenmark Pharmaceuticals Ltd. Pharmaceuticals 0.20
Godrej Industries Ltd. consumer Non Durables 0.19
IRB Infrastructure Developers Ltd. construction 0.19
Rural electrification corporation Ltd. Finance
0.19
canFin Homes Ltd. Finance 0.18
cadila Healthcare Ltd. Pharmaceuticals 0.17
equitas Holdings Ltd. Finance 0.17
Tech Mahindra Ltd. Software 0.17
Britannia Industries Ltd. consumer Non Durables 0.16
IDFc Ltd. Finance 0.16
State Bank of India Banks 0.16
Tata Global Beverages Ltd. consumer Non Durables 0.16
Indusind Bank Ltd. Banks 0.15
Siemens Ltd. Industrial capital Goods 0.14
Tata elxsi Ltd. Software 0.14
Biocon Ltd. Pharmaceuticals 0.13
GAIL (India) Ltd. Gas 0.13
exide Industries Ltd. Auto Ancillaries 0.12
Larsen and Toubro Ltd. construction Project 0.10
Motherson Sumi Systems Ltd. Auto Ancillaries 0.10
MRF Ltd. Auto Ancillaries 0.10
National Aluminium company Ltd. Non - Ferrous Metals
0.09
Wockhardt Ltd. Pharmaceuticals 0.09
Torrent Pharmaceuticals Ltd. Pharmaceuticals 0.08
escorts Ltd. Auto 0.05
Gujarat State Fertilizers & chemicals Fertilisers
0.05
Titan company Ltd. consumer Durables 0.05
Arvind Ltd. Textile Products 0.04
Bharat Petroleum corporation Ltd. Petroleum Products
0.04
colgate-Palmolive (I) Ltd. consumer Non Durables 0.04
Kajaria ceramics Ltd. construction 0.04
NMDc Ltd. Minerals/Mining 0.04
The Federal Bank Ltd. Banks 0.04
IFcI Ltd. Finance 0.03
Shree cement Ltd. cement 0.03
Zee entertainment enterprises Ltd. Media & entertainment
0.03
Ambuja cements Ltd. cement 0.02
Jindal Steel & Power Ltd. Ferrous Metals 0.02
NTPc Ltd. Power 0.02
Bharti Infratel Ltd.Telecom - equipment & Accessories
0.01
Birlasoft Ltd. Software 0.01
Oracle Financial Services Software Ltd.
Software 0.01
TV18 Broadcast Ltd. Media & entertainment 0.01
Sub Total 67.59
Face Value per Unit: ` 10 unless otherwise specified, + Industry classification as recommended by AMFI, Data is as of May 31, 2019 unless otherwise specified. ....contd on next page
(An open ended scheme investing in arbitrage opportunities)HDFC Arbitrage FundPORTFOLIO

May 2019 35
This product is suitable for investors who are seeking ~
l income over short term.
l income through arbitrage opportunities between cash and derivative market and arbitrage opportunities within the derivative segment.
Riskometer
Investors understand that their principal will be at moderately low risk
~ Investors should consult their financial advisers if in doubt about whether the product is suitable for them.
PERFORMANCE ^ - Wholesale Plan - Regular plan - growth Option
Date Period Scheme Returns
(%)
Benchmark Returns
(%)#
Additional Benchmark
Returns (%) ##
Value of ` 10,000 invested
Scheme (`) Benchmark (`)#
Additional Benchmark
(`)##
May 31, 18 Last 1 Year 6.33 6.03 12.43 10,633 10,603 11,243May 31, 16 Last 3 Years 6.04 5.42 14.99 11,925 11,715 15,203May 30, 14 Last 5 Years 6.45 6.21 11.92 13,672 13,518 17,571Oct 23, 07 Since Inception 7.14 N.A. 8.20 22,266 N.A. 24,958
Returns greater than 1 year period are compounded annualized (cAGR). N.A. Not Available. Scheme performance is not strictly comparable with that of its Additional Benchmark since the scheme does not take directional call in equity markets but is limited to availing arbitrage opportunities, etc. For performance of other schemes managed by Krishan Kumar Daga, please refer page 52. Different plans viz. Regular Plan and Direct Plan have a different expense structure. The expenses of the Direct Plan under the Scheme will be lower to the extent of the distribution expenses / commission charged in the Regular Plan. For Performance of Direct Plan, refer page no. 60.
Face Value per Unit: ` 10 unless otherwise specified, + Industry classification as recommended by AMFI, cD - certificate of Deposit; cP - commercial Papers, Data is as of May 31, 2019 unless otherwise specified.
^Past performance may or may not be sustained in the future. Load is not taken into consideration for computation of performance.
Portfolio Classification By Rating Class (%)
n equity 67.59n AAA/AAA(SO)/A1+/A1+(SO)
& equivalent 3.55n AA+ 0.06n AA/AA- 1.40n A+ & Below 3.49n cash, cash Equivalents and
Net current Assets 23.91
Portfolio Classification By Asset Class (%)
n equity 67.59
n cD 3.55
n credit Exposure 4.95
n cash, cash Equivalents and Net current Assets 23.91
(An open ended scheme investing in arbitrage opportunities) .....Contd from previous pageHDFC Arbitrage Fund
Company Industry+ / Rating % to NAV
DEBT & DEBT RElATED
CREDiT EXPOSURE
Punjab National Bank cARE - A+ 2.20
Vedanta Ltd. cRISIL - AA 1.40
Syndicate Bank cARE - A+ 0.70
Andhra Bank cARE - A+ 0.59
IcIcI Bank Ltd. IcRA - AA+ 0.06
Sub Total 4.95
MONEY MARKET INSTRUMENTS
CD/CP
Oriental Bank of commerce cRISIL - A1+ 2.13
Company Industry+ / Rating % to NAV
Andhra Bank IND - A1+ 0.71
IcIcI Bank Ltd. IcRA - A1+ 0.71
Sub Total 3.55
Short Term Deposits as margin for Futures & Options 18.20
cash, cash Equivalents and Net current Assets 5.71
Grand Total 100.00
• Top Ten Holdings, £ co-sponsor, @ less than 0.01%
Outstanding exposure in derivative instruments (` in crore) 2,377.61
Hedged position in Equity & Equity related instruments
Outstanding derivative exposure (% age) 67.60
PORTFOLIOIndustry Allocation of Equity Holding (% of Net Assets)
0.010.040.050.050.250.290.320.350.400.490.681.011.011.041.051.051.541.572.11
3.706.396.77
7.917.96
8.9512.60
0 2 4 6 8 10 12 14
Telecom - Equipment & AccessoriesMedia & Entertainment
Consumer DurablesFertilisers
Minerals/MiningChemicals
Auto AncillariesIndustrial Capital Goods
Textile ProductsGas
PesticidesNon - Ferrous Metals
PowerConstruction Project
Ferrous MetalsTrading
TransportationConstruction
CementBanks
SoftwareAuto
Petroleum ProductsConsumer Non Durables
FinancePharmaceuticals

36 May 2019
CATEgORY OF SCHEME: cORPORATE BOND FUND
KEY FACTSiNVESTMENT OBjECTiVE
To generate income/capital appreciation through investments predominantly in AA+ and above rated corporate bonds.
There is no assurance that the investment objective of the Scheme will be realized.
CATEgORY OF SCHEME: corporate Bond Fund
FUND MANAgER ¥
Anupam Joshi (since October 27, 15)
Total Experience: Over 12 years
iNCEPTiON DATE (Date of Allotment)
June 29, 2010
NAV (AS ON MAY 31, 2019) NAV PER UNIT (`)
Regular Plan - Growth Option 21.1706Regular Plan - Dividend Option 14.3990Regular Plan - quarterly Dividend Option 10.3777Direct Plan - Growth Option 21.3004Direct Plan - Dividend Option 14.6181Direct Plan - quarterly Dividend Option 10.2722
ASSETS UNDER MANAgEMENT (`) iN CRORE
As on May 31, 2019 12,320.87Average for Month of May, 2019 12,335.22
qUANTiTATiVE DATA
Average Maturity * 3.89 yearsMacaulay Duration * 3.06 yearsModified Duration * 2.86 yearsYield to Maturity * 7.86%* computed on the invested amount.
TOTAL ExPENSE RATIO (As on May 31, 2019)Including Additional expenses and Goods and Service Tax on Management Fees
Regular: 0.45% Direct: 0.30%
#BENCHMARK iNDEX: cRISIL composite Bond Fund Index
##ADDl. BENCHMARK iNDEX: cRISIL 10 year Gilt Index
EXiT lOAD
Nil
PLANS & OPTIONS
Regular Plan, Direct Plan. Under both the Plans: Growth, Quarterly Dividend & Normal Dividend. Both Dividend options offer Payout and Reinvestment facilities.
MiNiMUM APPliCATiON AMOUNT
Purchase : ` 5,000 and any amount thereafter. Additional Purchase : ` 1,000 and any amount thereafter.
¥ Dedicated Fund Manager for Overseas Investments: Mr. Amar Kalkundrikar (Total Experience: Over 16 years).
PERFORMANCE ^ - Regular plan - growth Option
Date Period Scheme Returns
(%)
Benchmark Returns
(%)#
Additional Benchmark
Returns (%) ##
Value of ` 10,000 invested
Scheme (`) Benchmark (`)#
Additional Benchmark
(`)##
May 31, 18 Last 1 Year 9.96 10.68 12.20 10,996 11,068 11,220May 31, 16 Last 3 Years 8.16 7.95 6.75 12,652 12,579 12,165May 30, 14 Last 5 Years 8.62 8.98 8.23 15,126 15,377 14,859Jun 29, 10 Since Inception 8.77 8.13 6.62 21,171 20,095 17,723
Returns greater than 1 year period are compounded annualized (cAGR). Performance of dividend option under the schemes for the investors would be net of distribution tax as applicable. For performance of other schemes managed by Anupam Joshi, please refer page 52. Different plans viz. Regular Plan and Direct Plan have a different expense structure. The expenses of the Direct Plan under the Scheme will be lower to the extent of the distribution expenses / commission charged in the Regular Plan. For Performance of Direct Plan, refer page no. 61.
Face Value per Unit: ` 10 unless otherwise specified, cD - certificate of Deposit; cP - commercial Papers, Data is as of May 31, 2019 unless otherwise specified.
This product is suitable for investors who are seeking ~
l income over short to medium term
l to generate income/capital appreciation through investments predominantly in AA+ and above rated corporate bonds
Riskometer
Investors understand that their principal will be at moderately low risk
~ Investors should consult their financial advisers if in doubt about whether the product is suitable for them.
Issuer Rating % to NAVDEBT & DEBT RElATEDgOVERNMENT SECURiTiES (CENTRAl/STATE)• 7.27 GOI 2026 Sovereign 4.127.32 GOI 2024 Sovereign 3.317.35 GOI 2024 Sovereign 0.837.42% Maharashtra SDL - Mat 110522 Sovereign 0.417.68 GOI 2023 Sovereign 0.01Sub Total 8.68CREDiT EXPOSURE • LIc Housing Finance Ltd. cARE - AAA / cRISIL - AAA 8.65• Housing Development
Finance corporation Ltd. £ cRISIL - AAA 6.89• Reliance Industries Ltd. cRISIL - AAA / IcRA - AAA 6.41• Rural Electrification
corporation Ltd. cRISIL - AAA / IND - AAA 5.20• Mahindra & Mahindra
Financial Services Ltd. IND - AAA 4.48• Indiabulls Housing Finance Ltd. cARE - AAA 4.38• National Highways Authority
of India cARE - AAA / cRISIL - AAA 4.14• HDB Financial Services Ltd. cARE - AAA / cRISIL - AAA 3.88• Power Finance corporation Ltd. cARE - AAA / cRISIL -
AAA / IcRA - AAA 3.84National Bank for Agriculture & Rural Development cRISIL - AAA 3.67Power Grid corporation of India Ltd. cRISIL - AAA 2.96Indian Railways Finance corporation Ltd. cRISIL - AAA 2.87Bajaj Finance Ltd. cRISIL - AAA / IND - AAA 2.84Bank of Baroda cARE - AAA 2.47State Bank of India cRISIL - AAA 2.11Reliance Jio Infocomm Ltd. cRISIL - AAA 2.07Reliable Devices Trust (PTc banked by receivables from Reliance Retail Ltd.) IcRA - AAA(SO) 1.99NTPc Ltd. cRISIL - AAA 1.75Food corporation of India (corporate guarantee from Govt of India) cRISIL - AAA(SO) 1.40
Issuer Rating % to NAV
export - Import Bank of India cRISIL - AAA 1.26Tata Sons Ltd. cRISIL - AAA 1.09Sikka Port and Terminal Ltd. (erstwhile Reliance Ports and Terminals Ltd.) cARE - AAA 0.75Andhra Pradesh expressway Ltd. (NHAI Annuity) IcRA - AAA(SO) 0.44NHPc Ltd. cARE - AAA 0.42Nabha Power Ltd. (corporate Guarantee of L&T Ltd.) IcRA - AAA(SO) 0.41Larsen and Toubro Ltd. cRISIL - AAA 0.38Jamnagar Utilities & Power Pvt. Ltd. (erstwhile Reliance Utilities & Power Pvt. Ltd.) cARE - AAA 0.37Small Industries Development Bank cARE - AAA 0.36Toyota Financial Services India Ltd. cRISIL - AAA 0.24Housing and Urban Development corporation Ltd. cARE - AAA 0.21Gujarat Road and Infra co Ltd. IcRA - AAA(SO) 0.20Kotak Mahindra Prime Ltd. cRISIL - AAA 0.20Sub Total 78.33Total 87.01MONEY MARKET INSTRUMENTSCD/CPBank of Baroda cRISIL - A1+ 2.30National Bank for Agriculture & Rural Development cRISIL - A1+ 2.29Oriental Bank of commerce cRISIL - A1+ 2.00Tata Sons Ltd. cRISIL - A1+ 1.35Andhra Bank cARE - A1+ 0.38IDFc First Bank Ltd. cRISIL - A1+ 0.15Sub Total 8.47cash, cash Equivalents and Net current Assets 4.52
Grand Total 100.00
• Top Ten Holdings, £ co-sponsor
^Past performance may or may not be sustained in the future. Load is not taken into consideration for computation of performance. Note: Effective close of business hours of May 8, 2018, HDFc Medium Term Opportunities Fund (HMTOF) underwent changes in Fundamental Attributes and was renamed as HDFc corporate Bond Fund (HcBF) and HDFc Floating Rate Income Fund – Long Term Plan and HDFc Gilt Fund – Short Term Plan were merged therein. As the portfolio structuring of HcBF closely resembles the erstwhile HMTOF, the past performance of HMTOF is provided, in line with SEBI circular on Performance disclosure post consolidation/ merger of scheme dated April 12, 2018.
Portfolio Classification By Asset Class (%)
n G-Sec, SDL 8.68
n cP 1.35
n cD 7.12
n credit Exposure 78.33
n cash, cash Equivalents and Net current Assets 4.52
Portfolio Classification By Rating Class (%)
n Sovereign 8.68n AAA/AAA(SO)/A1+/A1+(SO)
& equivalent 86.80n cash, cash Equivalents and
Net current Assets 4.52
(An open ended debt scheme predominantly investing in AA+ and above rated corporate bonds)HDFC Corporate Bond Fund
PORTFOLIO

May 2019 37
CATEgORY OF SCHEME: cREDIT RISK FUND
KEY FACTS
iNVESTMENT OBjECTiVE
To generate income/capital appreciation by investing predominantly in AA and below rated corporate debt.
There is no assurance that the investment objective of the Scheme will be realized.
CATEgORY OF SCHEME: credit Risk Fund
FUND MANAgER ¥
Shobhit Mehrotra (since March 25, 14)
Total Experience: Over 25 years
iNCEPTiON DATE (Date of Allotment)
March 25, 2014
NAV (AS ON MAY 31, 2019) NAV PER UNIT (`)
Regular Plan - Growth Option 15.4571Regular Plan - Dividend Option 14.2326Regular Plan - quarterly Dividend Option 10.4182Direct Plan - Growth Option 16.1416Direct Plan - Dividend Option 14.1494Direct Plan - quarterly Dividend Option 10.5470
ASSETS UNDER MANAgEMENT (`) iN CRORE
As on May 31, 2019 15,415.47Average for Month of May, 2019 15,613.46
qUANTiTATiVE DATA
Average Maturity * 2.50 yearsMacaulay Duration * 2.10 yearsModified Duration * 1.93 yearsYield to Maturity * 9.80%* computed on the invested amount.
#BENCHMARK iNDEX: cRISIL Short Term Bond Fund Index
##ADDl. BENCHMARK iNDEX: cRISIL 10 year Gilt Index
TOTAL ExPENSE RATIO (As on May 31, 2019)Including Additional expenses and Goods and Service Tax on Management Fees
Regular: 1.47% Direct: 0.99%
EXiT lOAD
l In respect of each purchase / switch-in of Units, 15% of the units (“the limit”) may be redeemed without any exit Load from the date of allotment
l Any redemption in excess of the above limit shall be subject to the following exit load:
n In respect of each purchase / switch-in of Units, an exit Load of 1.00% is payable if Units are redeemed / switched-out within 12 months from the date of allotment
n In respect of each purchase / switch-in of Units, an exit Load of 0.50% is payable if Units are redeemed / switched-out after 12 months but within 18 months from the date of allotment
l No exit Load is payable if Units are redeemed / switched-out after 18 months from the date of allotment
For further details, please refer to para ‘Exit Load’ on Pg 52.
PLANS & OPTIONS
Regular Plan, Direct Plan. Under each Plan: Growth, Quarterly Dividend and Normal Dividend. Both Dividend options offers Payout and Reinvestment facilities.
MiNiMUM APPliCATiON AMOUNT
Purchase : ` 5,000 and any amount thereafter. Additional Purchase : ` 1,000 and any amount thereafter.
¥ Dedicated Fund Manager for Overseas Investments: Mr. Amar Kalkundrikar (Total Experience: Over 16 years).
PERFORMANCE ^ - Regular plan - growth Option
Date Period Scheme Returns
(%)
Benchmark Returns
(%)#
Additional Benchmark
Returns (%) ##
Value of ` 10,000 invested
Scheme (`) Benchmark (`)#
Additional Benchmark
(`)##
May 31, 18 Last 1 Year 7.90 9.24 12.20 10,790 10,924 11,220May 31, 16 Last 3 Years 7.47 7.64 6.75 12,412 12,470 12,165May 30, 14 Last 5 Years 8.56 8.25 8.23 15,086 14,874 14,859Mar 25, 14 Since Inception 8.76 8.36 8.44 15,457 15,168 15,224
The above returns are for Regular Plan - Growth Option. Returns greater than 1 year period are compounded annualized (cAGR). Performance of dividend option under the schemes for the investors would be net of distribution tax as applicable. Load is not taken into consideration for computation of performance. For performance of other schemes managed by Shobhit Mehrotra, please refer page 52. Different plans viz. Regular Plan and Direct Plan have a different expense structure. The expenses of the Direct Plan under the Scheme will be lower to the extent of the distribution expenses / commission charged in the Regular Plan. For Performance of Direct Plan, refer page no. 59.
This product is suitable for investors who are seeking ~
l income over short to medium terml to generate income/capital appreciation by investing
predominantly in AA and below rated corporate debt (excluding AA+ rated corporate bonds)
Riskometer
Investors understand that their principal will be at moderate risk
~ Investors should consult their financial advisers if in doubt about whether the product is suitable for them.
Note: Effective close of business hours of May 8, 2018, HDFc corporate Debt Opportunities Fund (HcDOF) underwent changes in Fundamental Attributes and was renamed as HDFc credit Risk Debt Fund (HcRDF) and HDFc Regular Savings Fund was merged therein. As the portfolio structuring of HcRDF closely resembles the erstwhile HcDOF, the past performance of HcDOF is provided, in line with SeBI circular on Performance disclosure post consolidation/ merger of scheme dated April 12, 2018.
Portfolio Classification By Asset Class (%)
n SDL 0.33
n credit Exposure 96.50
n cash, cash Equivalents and Net current Assets 3.17
Portfolio Classification By issuer Rating Class (%) ≈
n Sovereign 0.33n AAA/AAA(SO)/A1+/A1+(SO)
& equivalent 23.56n AA+ 8.38n AA/AA- 44.04n A+ & Below 20.52n cash, cash Equivalents and
Net current Assets 3.17
[An open ended debt scheme predominantly investing in AA andbelow rated corporate bonds (excluding AA+ rated corporate bonds)]HDFC Credit Risk Debt Fund
PORTFOLIO
Company Industry+ / Security Rating
Issuer Rating % to NAV
DEBT & DEBT RElATED
gOVERNMENT SECURiTiES (CENTRAl/STATE)
8.39% Rajasthan SDL - Mat 150322 Sovereign Sovereign 0.33
Sub Total 0.33
CREDiT EXPOSURE
• HPcL-Mittal Energy Ltd. IcRA - AA+ IcRA - AA+ 4.89
• TATA International Ltd. cARE - A+ IcRA - A 4.51
• Vedanta Ltd. cRISIL - AA cRISIL - AA 3.81
• Rural Electrification corporation Ltd. cARE - AAA / cRISIL - AAA cRISIL - AAA 3.40
• Tata Steel Ltd. cARE - AA / cARE - AA- cARE - AA 3.25
• The Tata Power company Ltd. cARE - AA / cRISIL - AA- cRISIL - AA- 3.18
• Punjab National Bank cARE - A+ IcRA - AA- 2.88
• Muthoot Finance Ltd. cRISIL - AA / IcRA - AA IcRA - AA- 2.83
Company Industry+ / Security Rating
Issuer Rating % to NAV
• Jamnagar Utilities & Power Pvt. Ltd. (erstwhile Reliance Utilities & Power Pvt. Ltd.) cARE - AAA / cRISIL - AAA cRISIL - AAA 2.68
• Talwandi Sabo Power Ltd.(corporate Guarantee of Vedanta Ltd.) cRISIL - AA(SO) IND - A+ 2.58
HDFc Bank Ltd. cARE - AA+ cRISIL - AAA 2.56
Dilip Buildcon Ltd. cRISIL - A cRISIL - A 2.53
Sikka Port and Terminal Ltd. (erstwhile Reliance Ports and Terminals Ltd.) cARE - AAA cRISIL - AAA 2.29
Power Finance corporation Ltd. cARE - AAA / cRISIL - AAA / IcRA - AAA cRISIL - AAA 2.21
DB consolidated Pvt. Ltd. (Dainik Bhaskar Group company) NA - UNRATeD INTERNAL - A-(SO) 1.94
Tata Sky Ltd. (Subsidiary of Tata Sons) cRISIL - AA cRISIL - AA 1.93
Reliance Jio Infocomm Ltd. cRISIL - AAA cRISIL - AAA 1.83
coastal Gujarat Power Ltd. (corporate Guarantee of Tata Power) cARE - AA(SO) cARE - AA(SO) 1.79
Face Value per Unit: ` 10 unless otherwise specified, Data is as of May 31, 2019 unless otherwise specified. ≈ Based on long term rating.
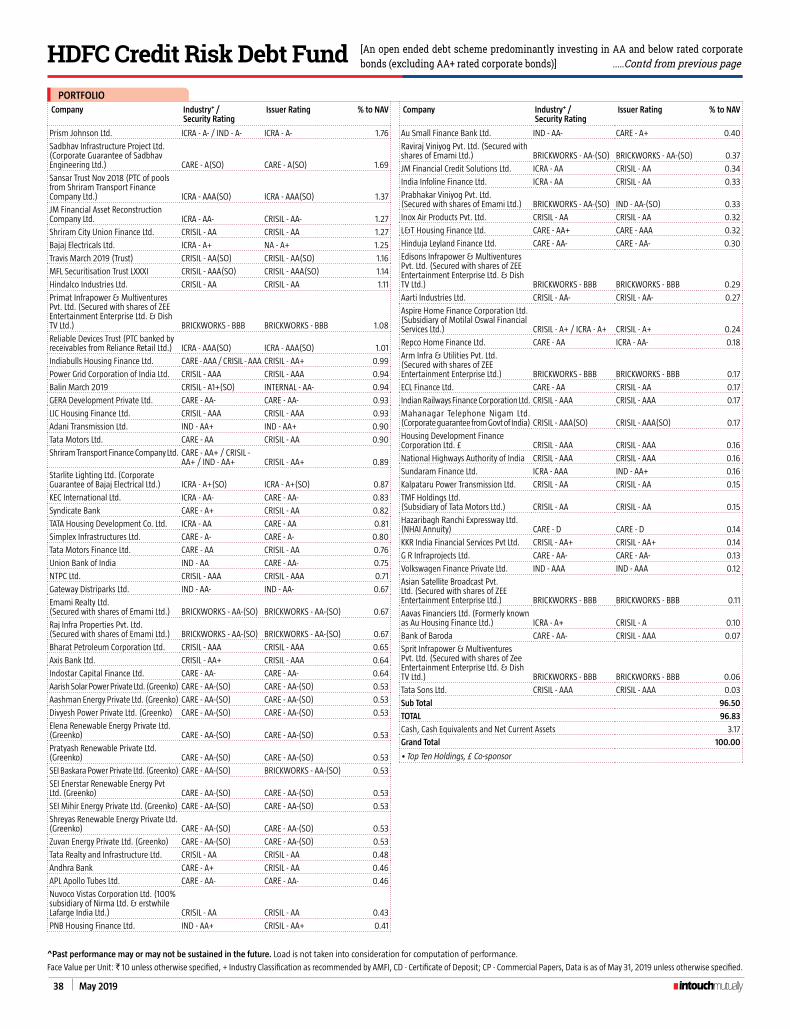
38 May 2019
Company Industry+ / Security Rating
Issuer Rating % to NAV
Prism Johnson Ltd. IcRA - A- / IND - A- IcRA - A- 1.76
Sadbhav Infrastructure Project Ltd. (corporate Guarantee of Sadbhav engineering Ltd.) cARE - A(SO) cARE - A(SO) 1.69
Sansar Trust Nov 2018 (PTc of pools from Shriram Transport Finance company Ltd.) IcRA - AAA(SO) IcRA - AAA(SO) 1.37
JM Financial Asset Reconstruction company Ltd. IcRA - AA- cRISIL - AA- 1.27
Shriram city Union Finance Ltd. cRISIL - AA cRISIL - AA 1.27
Bajaj electricals Ltd. IcRA - A+ NA - A+ 1.25
Travis March 2019 (Trust) cRISIL - AA(SO) cRISIL - AA(SO) 1.16
MFL Securitisation Trust LxxxI cRISIL - AAA(SO) cRISIL - AAA(SO) 1.14
Hindalco Industries Ltd. cRISIL - AA cRISIL - AA 1.11
Primat Infrapower & Multiventures Pvt. Ltd. (Secured with shares of Zee entertainment enterprise Ltd. & Dish TV Ltd.) BRIcKWORKS - BBB BRIcKWORKS - BBB 1.08
Reliable Devices Trust (PTc banked by receivables from Reliance Retail Ltd.) IcRA - AAA(SO) IcRA - AAA(SO) 1.01
Indiabulls Housing Finance Ltd. cARE - AAA / cRISIL - AAA cRISIL - AA+ 0.99
Power Grid corporation of India Ltd. cRISIL - AAA cRISIL - AAA 0.94
Balin March 2019 cRISIL - A1+(SO) INTeRNAL - AA- 0.94
GeRA Development Private Ltd. cARE - AA- cARE - AA- 0.93
LIc Housing Finance Ltd. cRISIL - AAA cRISIL - AAA 0.93
Adani Transmission Ltd. IND - AA+ IND - AA+ 0.90
Tata Motors Ltd. cARE - AA cRISIL - AA 0.90
Shriram Transport Finance company Ltd. cARE - AA+ / cRISIL - AA+ / IND - AA+ cRISIL - AA+ 0.89
Starlite Lighting Ltd. (corporate Guarantee of Bajaj electrical Ltd.) IcRA - A+(SO) IcRA - A+(SO) 0.87
KEc International Ltd. IcRA - AA- cARE - AA- 0.83
Syndicate Bank cARE - A+ cRISIL - AA 0.82
TATA Housing Development co. Ltd. IcRA - AA cARE - AA 0.81
Simplex Infrastructures Ltd. cARE - A- cARE - A- 0.80
Tata Motors Finance Ltd. cARE - AA cRISIL - AA 0.76
Union Bank of India IND - AA cARE - AA- 0.75
NTPc Ltd. cRISIL - AAA cRISIL - AAA 0.71
Gateway Distriparks Ltd. IND - AA- IND - AA- 0.67
emami Realty Ltd. (Secured with shares of emami Ltd.) BRIcKWORKS - AA-(SO) BRIcKWORKS - AA-(SO) 0.67
Raj Infra Properties Pvt. Ltd. (Secured with shares of emami Ltd.) BRIcKWORKS - AA-(SO) BRIcKWORKS - AA-(SO) 0.67
Bharat Petroleum corporation Ltd. cRISIL - AAA cRISIL - AAA 0.65
Axis Bank Ltd. cRISIL - AA+ cRISIL - AAA 0.64
Indostar capital Finance Ltd. cARE - AA- cARE - AA- 0.64
Aarish Solar Power Private Ltd. (Greenko) cARE - AA-(SO) cARE - AA-(SO) 0.53
Aashman energy Private Ltd. (Greenko) cARE - AA-(SO) cARE - AA-(SO) 0.53
Divyesh Power Private Ltd. (Greenko) cARE - AA-(SO) cARE - AA-(SO) 0.53
elena Renewable energy Private Ltd.(Greenko) cARE - AA-(SO) cARE - AA-(SO) 0.53
Pratyash Renewable Private Ltd. (Greenko) cARE - AA-(SO) cARE - AA-(SO) 0.53
SeI Baskara Power Private Ltd. (Greenko) cARE - AA-(SO) BRIcKWORKS - AA-(SO) 0.53
SeI enerstar Renewable energy Pvt Ltd. (Greenko) cARE - AA-(SO) cARE - AA-(SO) 0.53
SeI Mihir energy Private Ltd. (Greenko) cARE - AA-(SO) cARE - AA-(SO) 0.53
Shreyas Renewable energy Private Ltd. (Greenko) cARE - AA-(SO) cARE - AA-(SO) 0.53
Zuvan energy Private Ltd. (Greenko) cARE - AA-(SO) cARE - AA-(SO) 0.53
Tata Realty and Infrastructure Ltd. cRISIL - AA cRISIL - AA 0.48
Andhra Bank cARE - A+ cRISIL - AA 0.46
APL Apollo Tubes Ltd. cARE - AA- cARE - AA- 0.46
Nuvoco Vistas corporation Ltd. (100% subsidiary of Nirma Ltd. & erstwhile Lafarge India Ltd.) cRISIL - AA cRISIL - AA 0.43
PNB Housing Finance Ltd. IND - AA+ cRISIL - AA+ 0.41
Company Industry+ / Security Rating
Issuer Rating % to NAV
Au Small Finance Bank Ltd. IND - AA- cARE - A+ 0.40
Raviraj Viniyog Pvt. Ltd. (Secured with shares of emami Ltd.) BRIcKWORKS - AA-(SO) BRIcKWORKS - AA-(SO) 0.37
JM Financial credit Solutions Ltd. IcRA - AA cRISIL - AA 0.34
India Infoline Finance Ltd. IcRA - AA cRISIL - AA 0.33
Prabhakar Viniyog Pvt. Ltd. (Secured with shares of emami Ltd.) BRIcKWORKS - AA-(SO) IND - AA-(SO) 0.33
Inox Air Products Pvt. Ltd. cRISIL - AA cRISIL - AA 0.32
L&T Housing Finance Ltd. cARE - AA+ cARE - AAA 0.32
Hinduja Leyland Finance Ltd. cARE - AA- cARE - AA- 0.30
edisons Infrapower & Multiventures Pvt. Ltd. (Secured with shares of Zee entertainment enterprise Ltd. & Dish TV Ltd.) BRIcKWORKS - BBB BRIcKWORKS - BBB 0.29
Aarti Industries Ltd. cRISIL - AA- cRISIL - AA- 0.27
Aspire Home Finance corporation Ltd. (Subsidiary of Motilal Oswal Financial Services Ltd.) cRISIL - A+ / IcRA - A+ cRISIL - A+ 0.24
Repco Home Finance Ltd. cARE - AA IcRA - AA- 0.18
Arm Infra & Utilities Pvt. Ltd. (Secured with shares of Zee entertainment enterprise Ltd.) BRIcKWORKS - BBB BRIcKWORKS - BBB 0.17
EcL Finance Ltd. cARE - AA cRISIL - AA 0.17
Indian Railways Finance corporation Ltd. cRISIL - AAA cRISIL - AAA 0.17
Mahanagar Telephone Nigam Ltd. (corporate guarantee from Govt of India) cRISIL - AAA(SO) cRISIL - AAA(SO) 0.17
Housing Development Finance corporation Ltd. £ cRISIL - AAA cRISIL - AAA 0.16
National Highways Authority of India cRISIL - AAA cRISIL - AAA 0.16
Sundaram Finance Ltd. IcRA - AAA IND - AA+ 0.16
Kalpataru Power Transmission Ltd. cRISIL - AA cRISIL - AA 0.15
TMF Holdings Ltd. (Subsidiary of Tata Motors Ltd.) cRISIL - AA cRISIL - AA 0.15
Hazaribagh Ranchi expressway Ltd. (NHAI Annuity) cARE - D cARE - D 0.14
KKR India Financial Services Pvt Ltd. cRISIL - AA+ cRISIL - AA+ 0.14
G R Infraprojects Ltd. cARE - AA- cARE - AA- 0.13
Volkswagen Finance Private Ltd. IND - AAA IND - AAA 0.12
Asian Satellite Broadcast Pvt. Ltd. (Secured with shares of Zee entertainment enterprise Ltd.) BRIcKWORKS - BBB BRIcKWORKS - BBB 0.11
Aavas Financiers Ltd. (Formerly known as Au Housing Finance Ltd.) IcRA - A+ cRISIL - A 0.10
Bank of Baroda cARE - AA- cRISIL - AAA 0.07
Sprit Infrapower & Multiventures Pvt. Ltd. (Secured with shares of Zee entertainment enterprise Ltd. & Dish TV Ltd.) BRIcKWORKS - BBB BRIcKWORKS - BBB 0.06
Tata Sons Ltd. cRISIL - AAA cRISIL - AAA 0.03
Sub Total 96.50
TOTAL 96.83
cash, cash Equivalents and Net current Assets 3.17
Grand Total 100.00
• Top Ten Holdings, £ co-sponsor
^Past performance may or may not be sustained in the future. Load is not taken into consideration for computation of performance.
Face Value per Unit: ` 10 unless otherwise specified, + Industry classification as recommended by AMFI, cD - certificate of Deposit; cP - commercial Papers, Data is as of May 31, 2019 unless otherwise specified.
[An open ended debt scheme predominantly investing in AA and below rated corporate bonds (excluding AA+ rated corporate bonds)] .....Contd from previous pageHDFC Credit Risk Debt Fund
PORTFOLIO
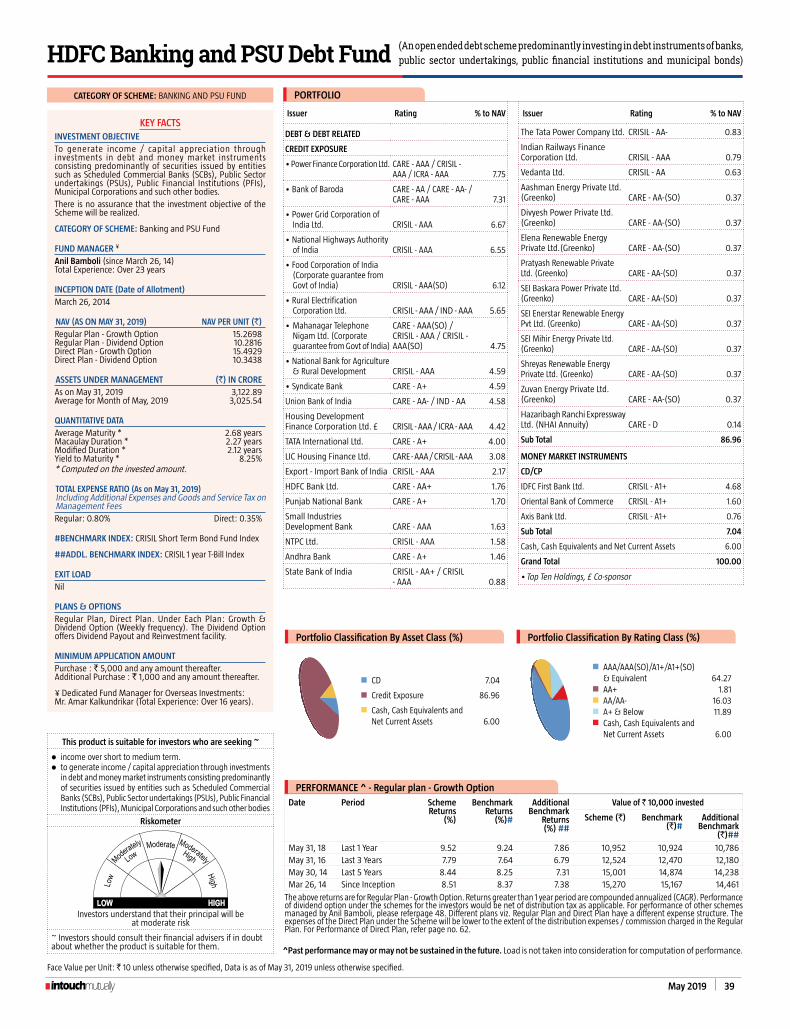
May 2019 39
CATEgORY OF SCHEME: BANKING AND PSU FUND
KEY FACTSiNVESTMENT OBjECTiVETo generate income / capital appreciation through investments in debt and money market instruments consisting predominantly of securities issued by entities such as Scheduled commercial Banks (ScBs), Public Sector undertakings (PSUs), Public Financial Institutions (PFIs), Municipal corporations and such other bodies.
There is no assurance that the investment objective of the Scheme will be realized.
CATEgORY OF SCHEME: Banking and PSU Fund
FUND MANAgER ¥
Anil Bamboli (since March 26, 14)
Total Experience: Over 23 years
iNCEPTiON DATE (Date of Allotment)March 26, 2014
NAV (AS ON MAY 31, 2019) NAV PER UNIT (`)Regular Plan - Growth Option 15.2698Regular Plan - Dividend Option 10.2816Direct Plan - Growth Option 15.4929Direct Plan - Dividend Option 10.3438
ASSETS UNDER MANAgEMENT (`) iN CROREAs on May 31, 2019 3,122.89Average for Month of May, 2019 3,025.54
qUANTiTATiVE DATAAverage Maturity * 2.68 yearsMacaulay Duration * 2.27 yearsModified Duration * 2.12 yearsYield to Maturity * 8.25%* computed on the invested amount.
TOTAL ExPENSE RATIO (As on May 31, 2019)Including Additional expenses and Goods and Service Tax on Management FeesRegular: 0.80% Direct: 0.35%
#BENCHMARK iNDEX: cRISIL Short Term Bond Fund Index
##ADDl. BENCHMARK iNDEX: cRISIL 1 year T-Bill Index
EXiT lOADNil
PLANS & OPTIONSRegular Plan, Direct Plan. Under each Plan: Growth & Dividend Option (Weekly frequency). The Dividend Option offers Dividend Payout and Reinvestment facility.
MiNiMUM APPliCATiON AMOUNTPurchase : ` 5,000 and any amount thereafter. Additional Purchase : ` 1,000 and any amount thereafter.
¥ Dedicated Fund Manager for Overseas Investments: Mr. Amar Kalkundrikar (Total Experience: Over 16 years).
Face Value per Unit: ` 10 unless otherwise specified, Data is as of May 31, 2019 unless otherwise specified.
PERFORMANCE ^ - Regular plan - growth Option
Date Period Scheme Returns
(%)
Benchmark Returns
(%)#
Additional Benchmark
Returns (%) ##
Value of ` 10,000 invested
Scheme (`) Benchmark (`)#
Additional Benchmark
(`)##
May 31, 18 Last 1 Year 9.52 9.24 7.86 10,952 10,924 10,786May 31, 16 Last 3 Years 7.79 7.64 6.79 12,524 12,470 12,180May 30, 14 Last 5 Years 8.44 8.25 7.31 15,001 14,874 14,238Mar 26, 14 Since Inception 8.51 8.37 7.38 15,270 15,167 14,461
The above returns are for Regular Plan - Growth Option. Returns greater than 1 year period are compounded annualized (cAGR). Performance of dividend option under the schemes for the investors would be net of distribution tax as applicable. For performance of other schemes managed by Anil Bamboli, please referpage 48. Different plans viz. Regular Plan and Direct Plan have a different expense structure. The expenses of the Direct Plan under the Scheme will be lower to the extent of the distribution expenses / commission charged in the Regular Plan. For Performance of Direct Plan, refer page no. 62.
This product is suitable for investors who are seeking ~
l income over short to medium term.l to generate income / capital appreciation through investments
in debt and money market instruments consisting predominantly of securities issued by entities such as Scheduled commercial Banks (ScBs), Public Sector undertakings (PSUs), Public Financial Institutions (PFIs), Municipal corporations and such other bodies
Riskometer
Investors understand that their principal will be at moderate risk
~ Investors should consult their financial advisers if in doubt about whether the product is suitable for them.
Issuer Rating % to NAV
DEBT & DEBT RElATED
CREDiT EXPOSURE
• Power Finance corporation Ltd. cARE - AAA / cRISIL - AAA / IcRA - AAA 7.75
• Bank of Baroda cARE - AA / cARE - AA- / cARE - AAA 7.31
• Power Grid corporation of India Ltd. cRISIL - AAA 6.67
• National Highways Authority of India cRISIL - AAA 6.55
• Food corporation of India (corporate guarantee from Govt of India) cRISIL - AAA(SO) 6.12
• Rural Electrification corporation Ltd. cRISIL - AAA / IND - AAA 5.65
• Mahanagar Telephone Nigam Ltd. (corporate
guarantee from Govt of India)
cARE - AAA(SO) / cRISIL - AAA / cRISIL - AAA(SO) 4.75
• National Bank for Agriculture & Rural Development cRISIL - AAA 4.59
• Syndicate Bank cARE - A+ 4.59
Union Bank of India cARE - AA- / IND - AA 4.58
Housing Development Finance corporation Ltd. £ cRISIL - AAA / IcRA - AAA 4.42
TATA International Ltd. cARE - A+ 4.00
LIc Housing Finance Ltd. cARE - AAA / cRISIL - AAA 3.08
export - Import Bank of India cRISIL - AAA 2.17
HDFc Bank Ltd. cARE - AA+ 1.76
Punjab National Bank cARE - A+ 1.70
Small Industries Development Bank cARE - AAA 1.63
NTPc Ltd. cRISIL - AAA 1.58
Andhra Bank cARE - A+ 1.46
State Bank of India cRISIL - AA+ / cRISIL - AAA 0.88
Issuer Rating % to NAV
The Tata Power company Ltd. cRISIL - AA- 0.83
Indian Railways Finance corporation Ltd. cRISIL - AAA 0.79
Vedanta Ltd. cRISIL - AA 0.63
Aashman energy Private Ltd. (Greenko) cARE - AA-(SO) 0.37
Divyesh Power Private Ltd. (Greenko) cARE - AA-(SO) 0.37
elena Renewable energy Private Ltd.(Greenko) cARE - AA-(SO) 0.37
Pratyash Renewable Private Ltd. (Greenko) cARE - AA-(SO) 0.37
SeI Baskara Power Private Ltd. (Greenko) cARE - AA-(SO) 0.37
SeI enerstar Renewable energy Pvt Ltd. (Greenko) cARE - AA-(SO) 0.37
SeI Mihir energy Private Ltd. (Greenko) cARE - AA-(SO) 0.37
Shreyas Renewable energy Private Ltd. (Greenko) cARE - AA-(SO) 0.37
Zuvan energy Private Ltd. (Greenko) cARE - AA-(SO) 0.37
Hazaribagh Ranchi expresswayLtd. (NHAI Annuity) cARE - D 0.14
Sub Total 86.96
MONEY MARKET INSTRUMENTS
CD/CP
IDFc First Bank Ltd. cRISIL - A1+ 4.68
Oriental Bank of commerce cRISIL - A1+ 1.60
Axis Bank Ltd. cRISIL - A1+ 0.76
Sub Total 7.04
cash, cash Equivalents and Net current Assets 6.00
Grand Total 100.00
• Top Ten Holdings, £ co-sponsor
^Past performance may or may not be sustained in the future. Load is not taken into consideration for computation of performance.
Portfolio Classification By Asset Class (%)
n cD 7.04
n credit Exposure 86.96
n cash, cash Equivalents and Net current Assets 6.00
Portfolio Classification By Rating Class (%)
n AAA/AAA(SO)/A1+/A1+(SO) & equivalent 64.27
n AA+ 1.81n AA/AA- 16.03n A+ & Below 11.89n cash, cash Equivalents and
Net current Assets 6.00
(An open ended debt scheme predominantly investing in debt instruments of banks, public sector undertakings, public financial institutions and municipal bonds)HDFC Banking and PSU Debt Fund
PORTFOLIO

40 May 2019
CATEgORY OF SCHEME: GILT FUND
KEY FACTSiNVESTMENT OBjECTiVE
To generate credit risk-free returns through investments in sovereign securities issued by the central Government and/or State Government.
There is no assurance that the investment objective of the Scheme will be realized.
CATEgORY OF SCHEME: Gilt Fund
FUND MANAgER ¥
Anil Bamboli (since September 1, 07)
Total Experience: Over 23 years
iNCEPTiON DATE (Date of Allotment)
July 25, 2001
NAV (AS ON MAY 31, 2019) NAV PER UNIT (`)
Regular Plan - Growth Option 37.8790Regular Plan - Dividend Option 11.3697Direct Plan - Growth Option 38.8427Direct Plan - Dividend Option 11.7352
ASSETS UNDER MANAgEMENT (`) iN CRORE
As on May 31, 2019 1,196.75Average for Month of May, 2019 1,172.61
qUANTiTATiVE DATA
Average Maturity * 4.53 yearsMacaulay Duration * 3.47 yearsModified Duration * 3.34 yearsYield to Maturity * 6.92%* computed on the invested amount.
TOTAL ExPENSE RATIO (As on May 31, 2019)Including Additional expenses and Goods and Service Tax on Management Fees
Regular: 0.90% Direct: 0.55%
#BENCHMARK iNDEX: cRISIL Dynamic Gilt Index
##ADDl. BENCHMARK iNDEX: cRISIL 10 year Gilt Index
EXiT lOAD
Nil
PLANS & OPTIONS
Regular Plan, Direct Plan. Under both the Plans: Growth & Dividend Option (Dividend Option offers Dividend Payout and Reinvestment facility.
MiNiMUM APPliCATiON AMOUNT
Purchase : ` 5,000 and any amount thereafter. Additional Purchase : ` 1,000 and any amount thereafter.
¥ Dedicated Fund Manager for Overseas Investments: Mr. Amar Kalkundrikar (Total Experience: Over 16 years).
Face Value per Unit: ` 10 unless otherwise specified, Data is as of May 31, 2019 unless otherwise specified.
PERFORMANCE ^ - Regular plan - growth Option
Date Period Scheme Returns
(%)
Benchmark Returns
(%)#
Additional Benchmark
Returns (%) ##
Value of ` 10,000 invested
Scheme (`) Benchmark (`)#
Additional Benchmark
(`)##
May 31, 18 Last 1 Year 9.16 11.93 12.20 10,916 11,193 11,220May 31, 16 Last 3 Years 7.16 7.74 6.75 12,307 12,505 12,165May 30, 14 Last 5 Years 9.02 9.02 8.23 15,405 15,406 14,859Jul 25, 01 Since Inception 7.74 8.29 N.A. 37,879 41,445 N.A.
Returns greater than 1 year period are compounded annualized (cAGR). N.A. Not Available. Performance of dividend option under the schemes for the investors would be net of distribution tax as applicable. For performance of other schemes managed by Anil Bamboli, please refer page 52. Different plans viz. Regular Plan and Direct Plan have a different expense structure. The expenses of the Direct Plan under the Scheme will be lower to the extent of the distribution expenses / commission charged in the Regular Plan. For Performance of Direct Plan, refer page no. 62.
This product is suitable for investors who are seeking ~
l credit risk free returns over medium to long term
l to generate credit risk-free returns through investments in sovereign securities issued by the central Government and / or State Government
Riskometer
Investors understand that their principal will be at moderate risk
~ Investors should consult their financial advisers if in doubt about whether the product is suitable for them. ^Past performance may or may not be sustained in the future. Load is not taken into consideration for computation of performance.
Portfolio Classification By Asset Class (%)
n G-Sec, SDL, T-Bills 88.47
n cash, cash Equivalents and Net current Assets 11.53
Portfolio Classification By Rating Class (%)
n Sovereign 88.47n cash, cash Equivalents and
Net current Assets 11.53
(An open ended debt scheme investing in government securities across maturities)HDFC Gilt Fund
Issuer Rating % to NAV
DEBT & DEBT RElATED
gOVERNMENT SECURiTiES (CENTRAl/STATE)
• 7.17 GOI 2028 Sovereign 19.20
• 7.35 GOI 2024 Sovereign 8.50
• 7.26 GOI 2029 Sovereign 7.21
• 7.37 GOI 2023 Sovereign 5.32
• 8.60% Rajasthan SDL- Mat 061128 Sovereign 4.42
• 8.59% Andhra Pradesh SDL - Mat 230123 Sovereign 4.34
• 8.60% Madhya Pradesh SDL - Mat 230123 Sovereign 4.34
• 8.21% Rajasthan (UDAY) SDL - Mat 310322 Sovereign 4.26
• 8.61% Uttar Pradesh SDL (UDAY) - Mat 210322 Sovereign 3.30
8.2 GOI 2025 Sovereign 2.20
8.2 GOI 2022 Sovereign 2.17
8.39% Rajasthan SDL - Mat 150322 Sovereign 2.14
8.21% Haryana SDL - Mat 310322 Sovereign 2.13
Issuer Rating % to NAV
7.86% Rajasthan SDL (UDAY Scheme- Strip II ) - ISD 230616 Mat 230619 Sovereign 2.09
8.66% Maharashtra SDL - Mat 250122 Sovereign 1.30
8.15 GOI 2022 Sovereign 0.87
7.27 GOI 2026 Sovereign 0.85
7.32 GOI 2024 Sovereign 0.52
8.24 GOI 2033 Sovereign 0.38
7.73 GOI 2034 Sovereign 0.26
7.95 GOI 2032 Sovereign 0.10
8.97 GOI 2030 Sovereign 0.09
Sub Total 75.99
T-BillS
• 91 Days Tbill - Mat 270619 Sovereign 12.48
Sub Total 12.48
Total 88.47
cash, cash Equivalents and Net current Assets 11.53
Grand Total 100.00
• Top Ten Holdings
Outstanding exposure in derivative instruments Interest Rate Swap (` in crore) 35.00
PORTFOLIO

May 2019 41
CATEgORY OF SCHEME: DYNAMIc BOND FUND
KEY FACTSiNVESTMENT OBjECTiVE
To generate income / capital appreciation by investing in a range of debt and money market instruments.
There is no assurance that the investment objective of the Scheme will be realized.
CATEgORY OF SCHEME: Dynamic Bond Fund
FUND MANAgER ¥
Anil Bamboli (since February 16, 04)
Total Experience: Over 23 years
iNCEPTiON DATE (Date of Allotment)
April 28, 1997
NAV (AS ON MAY 31, 2019) NAV PER UNIT (`)
Regular Plan - Growth Option 59.8899Regular Plan - quarterly Dividend Option 11.6206Regular Plan - Half-Yearly Dividend Option 11.0581Regular Plan - Yearly Dividend Option 12.3766Regular Plan - Normal Dividend Option 12.8302Direct Plan - Growth Option 62.7970Direct Plan - quarterly Dividend Option 12.2303Direct Plan - Half-Yearly Dividend Option 12.1303Direct Plan - Yearly Dividend Option 13.0497Direct Plan - Normal Dividend Option 13.2223
ASSETS UNDER MANAgEMENT (`) iN CRORE
As on May 31, 2019 678.66Average for Month of May, 2019 686.42
qUANTiTATiVE DATA
Average Maturity * 4.02 yearsMacaulay Duration * 2.99 yearsModified Duration * 2.82 yearsYield to Maturity * 7.80%* computed on the invested amount.
TOTAL ExPENSE RATIO (As on May 31, 2019)Including Additional expenses and Goods and Service Tax on Management Fees
Regular: 1.86% Direct: 1.25%
#BENCHMARK iNDEX: cRISIL composite Bond Fund Index
##ADDl. BENCHMARK iNDEX: cRISIL 10 year Gilt Index
EXiT lOAD
l In respect of each purchase / switch-in of Units, an exit Load of 0.50% is payable if Units are redeemed / switched-out within 6 months from the date of allotment.
l No exit Load is payable if Units are redeemed / switched-out after 6 months from the date of allotment.
For further details, please refer to para ‘Exit Load’ on Pg 52.
PLANS & OPTIONS
Regular Plan, Direct Plan. Under each Plan: Growth, Normal Dividend, Quarterly Dividend, Half Yearly Dividend, & Yearly Dividend. All Dividend Options offer Payout and Reinvestment facility.
MiNiMUM APPliCATiON AMOUNT
Purchase : ` 5,000 and any amount thereafter. Additional Purchase : ` 1,000 and any amount thereafter.
¥ Dedicated Fund Manager for Overseas Investments: Mr. Amar Kalkundrikar (Total Experience: Over 16 years).
Face Value per Unit: ` 10 unless otherwise specified, Data is as of May 31, 2019 unless otherwise specified.
PERFORMANCE ^ - Regular plan - growth Option
Date Period Scheme Returns
(%)
Benchmark Returns
(%)#
Additional Benchmark
Returns (%) ##
Value of ` 10,000 invested
Scheme (`) Benchmark (`)#
Additional Benchmark
(`)##
May 31, 18 Last 1 Year 3.05 10.68 12.20 10,305 11,068 11,220May 31, 16 Last 3 Years 4.97 7.95 6.75 11,566 12,579 12,165May 30, 14 Last 5 Years 7.08 8.98 8.23 14,080 15,377 14,859Apr 28, 97 Since Inception 8.43 N.A. N.A. 59,890 N.A. N.A.
Returns greater than 1 year period are compounded annualized (cAGR). N.A. Not Available. Performance of dividend option under the schemes for the investors would be net of distribution tax as applicable. For performance of other schemes managed by Anil Bamboli, please refer page 52. Different plans viz. Regular Plan and Direct Plan have a different expense structure. The expenses of the Direct Plan under the Scheme will be lower to the extent of the distribution expenses / commission charged in the Regular Plan. For Performance of Direct Plan, refer page no. 61.
This product is suitable for investors who are seeking ~
l income over medium to long term
l to generate income / capital appreciation by investing in a range of debt and money market instruments
Riskometer
Investors understand that their principal will be at moderate risk
~ Investors should consult their financial advisers if in doubt about whether the product is suitable for them.
^Past performance may or may not be sustained in the future. Load is not taken into consideration for computation of performance.
Portfolio Classification By Asset Class (%)
n G-Sec, SDL 24.60
n credit Exposure 71.48
n cash, cash Equivalents and Net current Assets 3.92
Portfolio Classification By Rating Class (%)
n Sovereign 24.60n AAA/AAA(SO)/A1+/A1+(SO)
& equivalent 44.46n AA/AA- 13.82n A+ & Below 13.20n cash, cash Equivalents and
Net current Assets 3.92
(An open ended dynamic debt scheme investing across duration)HDFC Dynamic Debt Fund
Issuer Rating % to NAV
DEBT & DEBT RElATED
gOVERNMENT SECURiTiES (CENTRAl/STATE)
• 8.21% Rajasthan (UDAY) SDL - Mat 310322 Sovereign 6.66
• 7.17 GOI 2028 Sovereign 5.89
• 8.39% Rajasthan SDL - Mat 150322 Sovereign 3.78
8.21% Haryana SDL - Mat 310322 Sovereign 3.76
7.42% Maharashtra SDL - Mat 110522 Sovereign 1.93
8.68% Gujarat SDL - Mat 060223 Sovereign 0.77
7.27 GOI 2026 Sovereign 0.75
7.32 GOI 2024 Sovereign 0.75
8.51% Punjab SDL - Mat 100423 Sovereign 0.11
GOI 2023 Sovereign 0.11
8.26% Maharashtra SDL - ISD 120815 Mat 120825 Sovereign 0.09
8.19% Rajasthan SDL (UDAY Scheme- Strip Ix ) - ISD 230616 Mat 230626 Sovereign @
Sub Total 24.60
CREDiT EXPOSURE
• Power Finance corporation Ltd. cARE - AAA 9.84
• Union Bank of India cARE - AA- 9.44
• Reliance Industries Ltd. cRISIL - AAA 7.63
• State Bank of India cRISIL - AAA 7.57
Issuer Rating % to NAV
• Hazaribagh Ranchi expressway Ltd. (NHAI Annuity) cARE - D 5.98
• Syndicate Bank cARE - A+ 5.09
• Mahanagar Telephone Nigam Ltd. (corporate
guarantee from Govt of India) cARE - AAA(SO) 3.93
Rural electrification corporation Ltd. IND - AAA 3.64
Reliance Jio Infocomm Ltd. cRISIL - AAA 3.62
Vedanta Ltd. cRISIL - AA 3.62
LIc Housing Finance Ltd. cRISIL - AAA 3.03
Housing Development Finance corporation Ltd. £ IcRA - AAA 2.21
Jamnagar Utilities & Power Pvt. Ltd. (erstwhile Reliance Utilities & Power Pvt. Ltd.) cRISIL - AAA 2.13
Punjab National Bank cARE - A+ 2.13
Sikka Port and Terminal Ltd. (erstwhile Reliance Ports and Terminals Ltd.) cARE - AAA 0.76
The Tata Power company Ltd. cRISIL - AA- 0.76
NTPc Ltd. cRISIL - AAA 0.10
Sub Total 71.48
Total 96.08
cash, cash Equivalents and Net current Assets 3.92
Grand Total 100.00
• Top Ten Holdings, £ co-sponsor, @ less than 0.01%
Outstanding exposure in derivative instruments Interest Rate Swap (` in crore) 40.00
PORTFOLIO

42 May 2019
CATEgORY OF SCHEME: MEDIUM TO LONG DURATION FUND
KEY FACTS
iNVESTMENT OBjECTiVE
To generate income / capital appreciation through investments in debt and money market instruments.There is no assurance that the investment objective of the Scheme will be realized.
CATEgORY OF SCHEME: Medium to Long Duration Fund
FUND MANAgER ¥
Shobhit Mehrotra (since September 11, 07)
Total Experience: Over 25 years
iNCEPTiON DATE (Date of Allotment)
September 11, 2000
NAV (AS ON MAY 31, 2019) NAV PER UNIT (`)
Regular Plan - Growth Option 40.8924Regular Plan - quarterly Dividend Option 11.0811Regular Plan - Normal Dividend Option 12.8946Direct Plan - Growth Option 42.9238Direct Plan - quarterly Dividend Option 11.7067Direct Plan - Normal Dividend Option 13.5740
ASSETS UNDER MANAgEMENT (`) iN CRORE
As on May 31, 2019 616.92Average for Month of May, 2019 629.99
qUANTiTATiVE DATA
Average Maturity * 5.37 yearsMacaulay Duration * 4.08 yearsModified Duration * 3.82 yearsYield to Maturity * 8.13%* computed on the invested amount for debt portfolio.
TOTAL ExPENSE RATIO (As on May 31, 2019)Including Additional expenses and Goods and Service Tax on Management Fees
Regular: 2.25% Direct: 1.79%
#BENCHMARK iNDEX: cRISIL composite Bond Fund Index
##ADDl. BENCHMARK iNDEX: cRISIL 10 year Gilt Index
EXiT lOAD
l In respect of each purchase / switch-in of Units, an exit Load of 0.25% is payable if Units are redeemed / switched-out within 1 month from the date of allotment.
l No exit Load is payable if Units are redeemed / switched-out after 1 month from the date of allotment.
For further details, please refer to para ‘Exit Load’ on Pg 52.
PLANS & OPTIONS
Regular Plan, Direct Plan. Under each Plan : Growth, Quarterly Dividend & Normal Dividend. Both Dividend Options offer Payout and Reinvestment facility.
MiNiMUM APPliCATiON AMOUNT
Purchase : ` 5,000 and any amount thereafter.Additional Purchase : ` 1,000 and any amount thereafter.
¥ Dedicated Fund Manager for Overseas Investments: Mr. Amar Kalkundrikar (Total Experience: Over 16 years).
PERFORMANCE ^ - Regular plan - growth Option
Date Period Scheme Returns
(%)
Benchmark Returns
(%)#
Additional Benchmark
Returns (%) ##
Value of ` 10,000 invested
Scheme (`) Benchmark (`)#
Additional Benchmark
(`)##
May 31, 18 Last 1 Year 8.20 10.68 12.20 10,820 11,068 11,220May 31, 16 Last 3 Years 6.03 7.95 6.75 11,919 12,579 12,165May 30, 14 Last 5 Years 7.55 8.98 8.23 14,399 15,377 14,859Sep 11, 00 Since Inception 7.81 N.A. N.A. 40,892 N.A. N.A.
Returns greater than 1 year period are compounded annualized (cAGR). N.A. Not Available. Performance of dividend option under the schemes for the investors would be net of distribution tax as applicable. For performance of other schemes managed by Shobhit Mehrotra, please refer page 52. Different plans viz. Regular Plan and Direct Plan have a different expense structure. The expenses of the Direct Plan under the Scheme will be lower to the extent of the distribution expenses / commission charged in the Regular Plan. For Performance of Direct Plan, refer page no. 59.
Face Value per Unit: ` 10 unless otherwise specified, Data is as of May 31, 2019 unless otherwise specified.
This product is suitable for investors who are seeking ~
l income over medium to long term
l to generate income / capital appreciation through investments in debt and money market instruments
Riskometer
Investors understand that their principal will be at moderate risk
~ Investors should consult their financial advisers if in doubt about whether the product is suitable for them.
^Past performance may or may not be sustained in the future. Load is not taken into consideration for computation of performance.
Portfolio Classification By Asset Class (%)
n G-Sec 19.87
n credit Exposure 70.27
n cash, cash Equivalents and Net current Assets 9.86
Portfolio Classification By Rating Class (%)
n Sovereign 19.87n AAA/AAA(SO)/A1+/A1+(SO)
& equivalent 38.04n AA+ 11.76n AA/AA- 14.16n A+ & Below 6.31n cash, cash Equivalents and
Net current Assets 9.86
[An open ended medium term debt scheme investing in instruments such that the Macaulay Duration of the Portfolio is between 4 years and 7 years (Refer page 2 for definition of Macaulay Duration)]HDFC Income Fund
Issuer Rating % to NAV
DEBT & DEBT RElATED
gOVERNMENT SECURiTiES (CENTRAl/STATE)
• 7.17 GOI 2028 Sovereign 10.53
• 7.26 GOI 2029 Sovereign 4.12
7.37 GOI 2023 Sovereign 3.31
GOI 2023 Sovereign 0.96
8.2 GOI 2025 Sovereign 0.54
7.95 GOI 2032 Sovereign 0.41
9.15 GOI 2024 Sovereign @
Sub Total 19.87
CREDiT EXPOSURE
• Indian Railways Finance corporation Ltd.
cARE - AAA / cRISIL - AAA 9.74
• The Tata Power company Ltd. cRISIL - AA- 9.18
• NTPc Ltd. cRISIL - AAA 8.49
• Power Finance corporation Ltd. cRISIL - AAA 8.26
Issuer Rating % to NAV
• Punjab National Bank cARE - A+ 6.31
• State Bank of India cRISIL - AA+ 5.32
• Tata Steel Ltd. cARE - AA- 4.19
• Rural Electrification corporation Ltd. cRISIL - AAA 4.13
National Highways Authority of India cRISIL - AAA 4.11
export - Import Bank of India cRISIL - AA+ 4.01
LIc Housing Finance Ltd. cRISIL - AAA 3.31
Adani Transmission Ltd. IND - AA+ 2.43
Union Bank of India cARE - AA- 0.79
Sub Total 70.27
Total 90.14
cash, cash Equivalents and Net current Assets 9.86
Grand Total 100.00
• Top Ten Holdings, @ less than 0.01%
PORTFOLIO
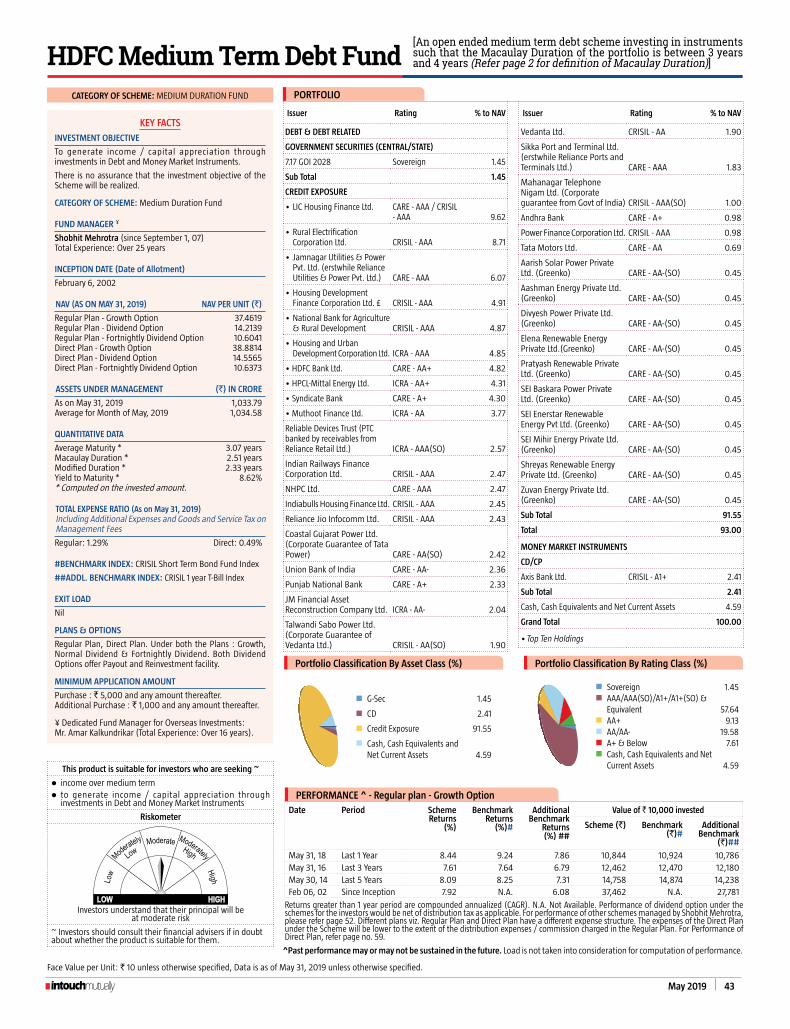
May 2019 43
CATEgORY OF SCHEME: MEDIUM DURATION FUND
PERFORMANCE ^ - Regular plan - growth Option
Date Period Scheme Returns
(%)
Benchmark Returns
(%)#
Additional Benchmark
Returns (%) ##
Value of ` 10,000 invested
Scheme (`) Benchmark (`)#
Additional Benchmark
(`)##
May 31, 18 Last 1 Year 8.44 9.24 7.86 10,844 10,924 10,786May 31, 16 Last 3 Years 7.61 7.64 6.79 12,462 12,470 12,180May 30, 14 Last 5 Years 8.09 8.25 7.31 14,758 14,874 14,238Feb 06, 02 Since Inception 7.92 N.A. 6.08 37,462 N.A. 27,781
Returns greater than 1 year period are compounded annualized (cAGR). N.A. Not Available. Performance of dividend option under the schemes for the investors would be net of distribution tax as applicable. For performance of other schemes managed by Shobhit Mehrotra, please refer page 52. Different plans viz. Regular Plan and Direct Plan have a different expense structure. The expenses of the Direct Plan under the Scheme will be lower to the extent of the distribution expenses / commission charged in the Regular Plan. For Performance of Direct Plan, refer page no. 59.
KEY FACTS
iNVESTMENT OBjECTiVE
To generate income / capital appreciation through investments in Debt and Money Market Instruments.
There is no assurance that the investment objective of the Scheme will be realized.
CATEgORY OF SCHEME: Medium Duration Fund
FUND MANAgER ¥
Shobhit Mehrotra (since September 1, 07)
Total Experience: Over 25 years
iNCEPTiON DATE (Date of Allotment)
February 6, 2002
NAV (AS ON MAY 31, 2019) NAV PER UNIT (`)
Regular Plan - Growth Option 37.4619Regular Plan - Dividend Option 14.2139Regular Plan - Fortnightly Dividend Option 10.6041Direct Plan - Growth Option 38.8814Direct Plan - Dividend Option 14.5565Direct Plan - Fortnightly Dividend Option 10.6373
ASSETS UNDER MANAgEMENT (`) iN CRORE
As on May 31, 2019 1,033.79Average for Month of May, 2019 1,034.58
qUANTiTATiVE DATA
Average Maturity * 3.07 yearsMacaulay Duration * 2.51 yearsModified Duration * 2.33 yearsYield to Maturity * 8.62%* computed on the invested amount.
TOTAL ExPENSE RATIO (As on May 31, 2019)Including Additional expenses and Goods and Service Tax on Management Fees
Regular: 1.29% Direct: 0.49%
#BENCHMARK iNDEX: cRISIL Short Term Bond Fund Index
##ADDl. BENCHMARK iNDEX: cRISIL 1 year T-Bill Index
EXiT lOAD
Nil
PLANS & OPTIONS
Regular Plan, Direct Plan. Under both the Plans : Growth, Normal Dividend & Fortnightly Dividend. Both Dividend Options offer Payout and Reinvestment facility.
MiNiMUM APPliCATiON AMOUNT
Purchase : ` 5,000 and any amount thereafter. Additional Purchase : ` 1,000 and any amount thereafter.
¥ Dedicated Fund Manager for Overseas Investments: Mr. Amar Kalkundrikar (Total Experience: Over 16 years).
Face Value per Unit: ` 10 unless otherwise specified, Data is as of May 31, 2019 unless otherwise specified.
This product is suitable for investors who are seeking ~
l income over medium terml to generate income / capital appreciation through
investments in Debt and Money Market Instruments
Riskometer
Investors understand that their principal will be at moderate risk
~ Investors should consult their financial advisers if in doubt about whether the product is suitable for them.
^Past performance may or may not be sustained in the future. Load is not taken into consideration for computation of performance.
[An open ended medium term debt scheme investing in instruments such that the Macaulay Duration of the portfolio is between 3 years and 4 years (Refer page 2 for definition of Macaulay Duration)]HDFC Medium Term Debt Fund
Issuer Rating % to NAV
DEBT & DEBT RElATED
gOVERNMENT SECURiTiES (CENTRAl/STATE)
7.17 GOI 2028 Sovereign 1.45
Sub Total 1.45
CREDiT EXPOSURE
• LIc Housing Finance Ltd. cARE - AAA / cRISIL - AAA 9.62
• Rural Electrification corporation Ltd. cRISIL - AAA 8.71
• Jamnagar Utilities & Power Pvt. Ltd. (erstwhile Reliance Utilities & Power Pvt. Ltd.) cARE - AAA 6.07
• Housing Development Finance corporation Ltd. £ cRISIL - AAA 4.91
• National Bank for Agriculture & Rural Development cRISIL - AAA 4.87
• Housing and Urban Development corporation Ltd. IcRA - AAA 4.85
• HDFc Bank Ltd. cARE - AA+ 4.82
• HPcL-Mittal Energy Ltd. IcRA - AA+ 4.31
• Syndicate Bank cARE - A+ 4.30
• Muthoot Finance Ltd. IcRA - AA 3.77
Reliable Devices Trust (PTc banked by receivables from Reliance Retail Ltd.) IcRA - AAA(SO) 2.57
Indian Railways Finance corporation Ltd. cRISIL - AAA 2.47
NHPc Ltd. cARE - AAA 2.47
Indiabulls Housing Finance Ltd. cRISIL - AAA 2.45
Reliance Jio Infocomm Ltd. cRISIL - AAA 2.43
coastal Gujarat Power Ltd. (corporate Guarantee of Tata Power) cARE - AA(SO) 2.42
Union Bank of India cARE - AA- 2.36
Punjab National Bank cARE - A+ 2.33
JM Financial Asset Reconstruction company Ltd. IcRA - AA- 2.04
Talwandi Sabo Power Ltd. (corporate Guarantee of Vedanta Ltd.) cRISIL - AA(SO) 1.90
Issuer Rating % to NAV
Vedanta Ltd. cRISIL - AA 1.90
Sikka Port and Terminal Ltd. (erstwhile Reliance Ports and Terminals Ltd.) cARE - AAA 1.83
Mahanagar Telephone Nigam Ltd. (corporateguarantee from Govt of India) cRISIL - AAA(SO) 1.00
Andhra Bank cARE - A+ 0.98
Power Finance corporation Ltd. cRISIL - AAA 0.98
Tata Motors Ltd. cARE - AA 0.69
Aarish Solar Power Private Ltd. (Greenko) cARE - AA-(SO) 0.45
Aashman energy Private Ltd. (Greenko) cARE - AA-(SO) 0.45
Divyesh Power Private Ltd. (Greenko) cARE - AA-(SO) 0.45
elena Renewable energy Private Ltd.(Greenko) cARE - AA-(SO) 0.45
Pratyash Renewable Private Ltd. (Greenko) cARE - AA-(SO) 0.45
SeI Baskara Power Private Ltd. (Greenko) cARE - AA-(SO) 0.45
SeI enerstar Renewable energy Pvt Ltd. (Greenko) cARE - AA-(SO) 0.45
SeI Mihir energy Private Ltd. (Greenko) cARE - AA-(SO) 0.45
Shreyas Renewable energy Private Ltd. (Greenko) cARE - AA-(SO) 0.45
Zuvan energy Private Ltd. (Greenko) cARE - AA-(SO) 0.45
Sub Total 91.55
Total 93.00
MONEY MARKET INSTRUMENTS
CD/CP
Axis Bank Ltd. cRISIL - A1+ 2.41
Sub Total 2.41
cash, cash Equivalents and Net current Assets 4.59
Grand Total 100.00
• Top Ten Holdings
PORTFOLIO
Portfolio Classification By Asset Class (%)
n G-Sec 1.45
n cD 2.41
n credit Exposure 91.55
n cash, cash Equivalents and Net current Assets 4.59
Portfolio Classification By Rating Class (%)
n Sovereign 1.45n AAA/AAA(SO)/A1+/A1+(SO) &
equivalent 57.64n AA+ 9.13n AA/AA- 19.58n A+ & Below 7.61n cash, cash Equivalents and Net
current Assets 4.59

44 May 2019
CATEgORY OF SCHEME: SHORT DURATION FUND
PERFORMANCE ^ - Regular plan - growth Option
Date Period Scheme Returns
(%)
Benchmark Returns
(%)#
Additional Benchmark
Returns (%) ##
Value of ` 10,000 invested
Scheme (`) Benchmark (`)#
Additional Benchmark
(`)##
May 31, 18 Last 1 Year 8.86 9.24 7.86 10,886 10,924 10,786May 31, 16 Last 3 Years 7.69 7.64 6.79 12,488 12,470 12,180May 30, 14 Last 5 Years 8.24 8.25 7.31 14,867 14,874 14,238Jun 25, 10 Since Inception 8.62 8.18 6.94 20,932 20,196 18,215
Returns greater than 1 year period are compounded annualized (cAGR). Performance of dividend option under the schemes for the investors would be net of distribution tax as applicable. For performance of other schemes managed by Anil Bamboli, please refer page 52. Different plans viz. Regular Plan and Direct Plan have a different expense structure. The expenses of the Direct Plan under the Scheme will be lower to the extent of the distribution expenses / commission charged in the Regular Plan. For Performance of Direct Plan, refer page no. 62.
Face Value per Unit: ` 10 unless otherwise specified, cD - certificate of Deposit; cP - commercial Papers. Data is as of May 31, 2019 unless otherwise specified.
KEY FACTS
iNVESTMENT OBjECTiVE
To generate income / capital appreciation through investments in Debt and Money Market Instruments.
There is no assurance that the investment objective of the Scheme will be realized.
CATEgORY OF SCHEME: Short Duration Fund
FUND MANAgER ¥
Anil Bamboli (since June 25, 10)
Total Experience: Over 23 years
iNCEPTiON DATE (Date of Allotment)
June 25, 2010
NAV (AS ON MAY 31, 2019) NAV PER UNIT (`)
Regular Plan - Growth Option 20.9324Regular Plan - Fortnightly Dividend Option 10.2361Regular Plan - Normal Dividend Option 14.0743Direct Plan - Growth Option 21.1320Direct Plan - Fortnightly Dividend Option 10.2964Direct Plan - Normal Dividend Option 14.1256
ASSETS UNDER MANAgEMENT (`) iN CRORE
As on May 31, 2019 7,955.71Average for Month of May, 2019 7,831.52
qUANTiTATiVE DATA
Average Maturity * 2.08 yearsMacaulay Duration * 1.77 yearsModified Duration * 1.64 yearsYield to Maturity * 7.91%* computed on the invested amount.
TOTAL ExPENSE RATIO (As on May 31, 2019)Including Additional expenses and Goods and Service Tax on Management Fees
Regular: 0.40% Direct: 0.25%
#BENCHMARK iNDEX: cRISIL Short Term Bond Fund Index
##ADDl. BENCHMARK iNDEX: cRISIL 1 year T-Bill Index
EXiT lOAD
Nil
PLANS & OPTIONS
Regular Plan, Direct Plan. Under each Plan: Growth, Fortnightly Dividend & Normal Dividend. Both Dividend options offer Payout and Reinvestment facilities.
MiNiMUM APPliCATiON AMOUNT
Purchase : ` 5,000 and any amount thereafter. Additional Purchase : ` 1,000 and any amount thereafter.
¥ Dedicated Fund Manager for Overseas Investments: Mr. Amar Kalkundrikar (Total Experience: Over 16 years).
This product is suitable for investors who are seeking ~
l income over short term.
l to generate income / capital appreciation through investments in Debt and Money Market Instruments
Riskometer
Investors understand that their principal will be at moderately low risk
~ Investors should consult their financial advisers if in doubt about whether the product is suitable for them.
^Past performance may or may not be sustained in the future. Load is not taken into consideration for computation of performance.
[An open ended short term debt scheme investing in instruments such that the Macaulay Duration of the portfolio is between 1 year and 3 years (Refer page 2 for definition of Macaulay Duration)]HDFC Short Term Debt Fund
Issuer Rating % to NAV
DEBT & DEBT RElATED
gOVERNMENT SECURiTiES (CENTRAl/STATE)
8.60% Madhya Pradesh SDL - Mat 230123 Sovereign 0.65
7.26 GOI 2029 Sovereign 0.19
8.38% Gujarat SDL - Mat 270229 Sovereign 0.13
8.58% Gujarat SDL - Mat 230123 Sovereign 0.13
8.39% Rajasthan SDL - Mat 150320 Sovereign 0.05
Sub Total 1.15
CREDiT EXPOSURE
• Power Finance corporation Ltd. cARE - AAA / cRISIL - AAA 10.29
• Rural Electrification corporation Ltd. cRISIL - AAA / IND - AAA 8.64
• National Bank for Agriculture & Rural Development cRISIL - AAA / IND - AAA 8.37
• LIc Housing Finance Ltd. cARE - AAA / cRISIL - AAA 7.57
• Housing Development Finance corporation Ltd. £
cRISIL - AAA / IcRA - AAA 6.45
• Reliance Jio Infocomm Ltd. cRISIL - AAA / cRISIL - AAA(SO) / IcRA - AAA 5.25
• Housing and Urban Development corporation Ltd.
cARE - AAA / IcRA - AAA / IND - AAA 5.14
• Reliance Industries Ltd. cRISIL - AAA / IcRA - AAA 3.46
• Tata capital Financial Services Ltd. IcRA - AAA 3.45
• Tata Sons Ltd. cRISIL - AAA 3.29
National Highways Authority of India cARE - AAA / cRISIL - AAA 2.54
Reliable Devices Trust (PTc banked by receivables from Reliance Retail Ltd.) IcRA - AAA(SO) 2.33
Larsen and Toubro Ltd. cRISIL - AAA 2.23
Vedanta Ltd. cRISIL - AA 1.43
Sansar Trust Nov 2018(PTc of pools from ShriramTransport Finance company Ltd.) IcRA - AAA(SO) 1.34
Bajaj Finance Ltd. cRISIL - AAA / IND - AAA 1.26
cholamandalam Investment and Financial company Ltd. IcRA - AA+ 1.26
Issuer Rating % to NAV
John Deere Financial India Private Ltd. cRISIL - AAA 1.26
Sundaram Finance Ltd. cRISIL - AAA 1.26
Tata Motors Ltd. cARE - AA 1.13
Mahindra & Mahindra Financial Services Ltd. IND - AAA 1.06
Small Industries Development Bank cARE - AAA 0.96
Fullerton India Home Finance company Ltd. cARE - AA+ 0.63
Indian Railways Finance corporation Ltd.
cRISIL - AAA / IcRA - AAA 0.63
Talwandi Sabo Power Ltd. (corporate Guarantee of Vedanta Ltd.) cRISIL - AA(SO) 0.62
Shriram city Union Finance Ltd. cRISIL - AA 0.61
Hindalco Industries Ltd. cRISIL - AA 0.58
L&T Finance Ltd. cARE - AAA 0.50
canFin Homes Ltd. IcRA - AA+ 0.43
Aditya Birla Finance Ltd. IcRA - AAA / IND - AAA 0.38
Power Grid corporation of India Ltd. cRISIL - AAA 0.37
Toyota Financial Services India Ltd. cRISIL - AAA 0.31
Bank of Baroda cARE - AA- 0.26
NHPc Ltd. IcRA - AAA 0.25
Hazaribagh Ranchi expressway Ltd. (NHAI Annuity) cARE - D 0.23
Sub Total 85.77
Total 86.92
MONEY MARKET INSTRUMENTS
CD/CP
Indusind Bank Ltd. cRISIL - A1+ 1.19
IDFc First Bank Ltd. cRISIL - A1+ 1.13
Sub Total 2.32
cash, cash Equivalents and Net current Assets 10.76
Grand Total 100.00
• Top Ten Holdings, £ co-sponsor
PORTFOLIO
Portfolio Classification By Asset Class (%)
n G-Sec, SDL 1.15
n cD 2.32
n credit Exposure 85.77
n cash, cash Equivalents and Net current Assets 10.76
Portfolio Classification By Rating Class (%)
n Sovereign 1.15n AAA/AAA(SO)/A1+/A1+(SO)
& equivalent 80.91n AA+ 2.32n AA/AA- 4.63n A+ & Below 0.23n cash, cash Equivalents and
Net current Assets 10.76

May 2019 45
CATEgORY OF SCHEME: LOW DURATION FUND
KEY FACTSiNVESTMENT OBjECTiVETo generate income / capital appreciation through investment in debt securities and money market instruments.There is no assurance that the investment objective of the Scheme will be realized.
CATEgORY OF SCHEME: Low Duration Fund
FUND MANAgER ¥
Anupam Joshi (since October 27, 15)
Total Experience: Over 12 years
iNCEPTiON DATE (Date of Allotment)November 18, 1999
NAV (AS ON MAY 31, 2019)^^ NAV PER UNiT (`)Retail OptionRegular Plan - Growth Option 39.6405Regular Plan - Daily Dividend Reinvestment Option 10.1428Regular Plan - Weekly Dividend Option 10.1733Regular Plan - Monthly Dividend Option 10.1553Direct Plan - Growth Option 41.4411Direct Plan - Daily Dividend Reinvestment Option 10.0655Direct Plan - Weekly Dividend Option 10.2035Direct Plan - Monthly Dividend Option 10.1585
ASSETS UNDER MANAgEMENT (`) iN CROREAs on May 31, 2019 15,996.63Average for Month of May, 2019 15,085.68
qUANTiTATiVE DATAAverage Maturity * 351 daysMacaulay Duration * 328 daysModified Duration * 296 daysYield to Maturity * 7.61%* computed on the invested amount.
TOTAL ExPENSE RATIO (As on May 31, 2019)Including Additional expenses and Goods and Service Tax on Management FeesRegular: 1.01% Direct: 0.41%
#BENCHMARK iNDEX: cRISIL Liquid Fund Index##ADDl. BENCHMARK iNDEX: cRISIL 1 year T-Bill Index
EXiT lOADNil
PLANS & OPTIONSRegular Plan, Direct Plan. Retail Option: Each Plan offers Growth and Dividend Option. Dividend Option offers Daily Dividend Option with Reinvestment facility only and Weekly and Monthly Dividend Option with Payout and Reinvestment facility.
MiNiMUM APPliCATiON AMOUNTRetail Option : Growth, Weekly and Monthly Dividend Option: Purchase : ` 5,000 and any amount thereafter. Additional Purchase : ̀ 1,000 and any amount thereafter. Daily Dividend Option : Purchase : ` 10,000 and any amount thereafter. Additional Purchase : ` 5,000 and any amount thereafter.
¥ Dedicated Fund Manager for Overseas Investments: Mr. Amar Kalkundrikar (Total Experience: Over 16 years).^^ calculated on all calendar days.
PERFORMANCE ^ - Regular plan - growth Option
Date Period Scheme Returns
(%)
Benchmark Returns
(%)#
Additional Benchmark
Returns (%) ##
Value of ` 10,000 invested
Scheme (`) Benchmark (`)#
Additional Benchmark
(`)##
May 31, 18 Last 1 Year 7.93 7.73 7.86 10,793 10,773 10,786May 31, 16 Last 3 Years 7.23 7.19 6.79 12,330 12,316 12,180May 30, 14 Last 5 Years 7.49 7.65 7.31 14,355 14,465 14,238Nov 18, 99 Since Inception 7.30 N.A. 6.51 39,641 N.A. 34,296
Returns greater than 1 year period are compounded annualized (cAGR). N.A. Not Available. Performance of dividend option under the schemes for the investors would be net of distribution tax as applicable. For performance of other schemes managed by Anupam Joshi, please refer page 52. Different plans viz. Regular Plan and Direct Plan have a different expense structure. The expenses of the Direct Plan under the Scheme will be lower to the extent of the distribution expenses / commission charged in the Regular Plan. For Performance of Direct Plan, refer page no. 60.
Face Value per Unit: ` 10 unless otherwise specified, cD - certificate of Deposit; cP - commercial Papers. Data is as of May 31, 2019 unless otherwise specified.
This product is suitable for investors who are seeking ~
l income over short term.
l to generate income / capital appreciation through investmentin debt securities and money market instruments
Riskometer
Investors understand that their principal will be at moderately low risk
~ Investors should consult their financial advisers if in doubt about whether the product is suitable for them. ^Past performance may or may not be sustained in the future. Load is not taken into consideration for computation of performance.
Portfolio Classification by Asset Class (%)
n G-Sec, SDL 2.61
n cP 9.68
n cD 31.93
n credit Exposure 52.07
n cash, cash Equivalents and Net current Assets 3.71
Portfolio Classification by Rating Class (%)
n Sovereign 2.61n AAA/AAA(SO)/A1+/A1+(SO) &
equivalent 80.12n AA+ 3.04n AA/AA- 8.54n A+ & Below 1.98n cash, cash Equivalents and Net
current Assets 3.71
[An open ended low duration debt scheme investing in instruments such that the Macaulay Duration of the portfolio is between 6 months and 12 months (Refer page 2 for definition of Macaulay Duration)]HDFC Low Duration Fund
Issuer Rating % to NAVDEBT & DEBT RElATEDgOVERNMENT SECURiTiES (CENTRAl/STATE)7.27 GOI 2026 Sovereign 1.277.32 GOI 2024 Sovereign 0.967.35 GOI 2024 Sovereign 0.327.65% Karnataka SDL - Mat 061227 Sovereign 0.06Sub Total 2.61CREDiT EXPOSURE • Housing Development
Finance corporation Ltd. £ cRISIL - AAA 7.66• LIc Housing Finance Ltd. cARE - AAA / cRISIL - AAA 6.72• Power Finance corporation Ltd. cRISIL - AAA 3.93• National Housing Bank cARE - AAA 3.77• National Bank for Agriculture
& Rural Development cRISIL - AAA / IND - AAA 3.19Rural electrification corporation Ltd. cRISIL - AAA 2.67Bajaj Finance Ltd. cARE - AAA / IND - AAA 2.31Nuvoco Vistas corporation Ltd. (100% subsidiary of Nirma Ltd. & erstwhile Lafarge India Ltd.) cRISIL - AA 1.82Power Grid corporation of India Ltd. cRISIL - AAA 1.75Union Bank of India cARE - AA- 1.31Bank of Baroda cARE - AA / cARE - AA- 1.25Reliable Devices Trust (PTc banked by receivables from Reliance Retail Ltd.) IcRA - AAA(SO) 1.20Petronet LNG Ltd. cRISIL - AAA 1.10Syndicate Bank cARE - A+ 1.08canara Bank cRISIL - AA 1.06L&T Finance Ltd. cARE - AAA 0.94State Bank of India cRISIL - AA+ 0.94Punjab National Bank cARE - A+ 0.90Shriram Transport Finance company Ltd. cRISIL - AA+ / IND - AA+ 0.90Tata capital Financial Services Ltd. IcRA - AAA 0.78Tata Motors Ltd. cARE - AA 0.78Housing and Urban Development corporation Ltd. IcRA - AAA 0.69TATA capital Housing Finance Ltd. cRISIL - AAA 0.63Axis Bank Ltd. cRISIL - AA+ 0.62Shriram city Union Finance Ltd. cRISIL - AA 0.61Vedanta Ltd. cRISIL - AA 0.50TMF Holdings Ltd. (Subsidiary of Tata Motors Ltd.) cRISIL - AA 0.38Adani Transmission Ltd. IND - AA+ 0.31export - Import Bank of India cRISIL - AAA 0.31NRSS xxIx Transmission Ltd. cRISIL - AAA 0.31The Tata Power company Ltd. IcRA - AA- 0.31Volkswagen Finance Private Ltd. IND - AAA 0.31KKR India Financial Services Pvt Ltd. cRISIL - AA+ 0.27Hinduja Leyland Finance Ltd. cARE - AA- 0.22Indian Railways Finance corporation Ltd. cRISIL - AAA 0.13NTPc Ltd. cRISIL - AAA 0.05
Issuer Rating % to NAVAarish Solar Power Private Ltd. (Greenko) cARE - AA-(SO) 0.03Aashman energy Private Ltd. (Greenko) cARE - AA-(SO) 0.03Divyesh Power Private Ltd. (Greenko) cARE - AA-(SO) 0.03elena Renewable energy Private Ltd.(Greenko) cARE - AA-(SO) 0.03Mahindra & Mahindra Financial Services Ltd. IND - AAA 0.03Pratyash Renewable Private Ltd. (Greenko) cARE - AA-(SO) 0.03Reliance Jio Infocomm Ltd. cRISIL - AAA 0.03SeI Baskara Power Private Ltd. (Greenko) cARE - AA-(SO) 0.03SeI enerstar Renewable energy Pvt Ltd. (Greenko) cARE - AA-(SO) 0.03SeI Mihir energy Private Ltd. (Greenko) cARE - AA-(SO) 0.03Shreyas Renewable energy Private Ltd. (Greenko) cARE - AA-(SO) 0.03Zuvan energy Private Ltd. (Greenko) cARE - AA-(SO) 0.03Sub Total 52.07Total 54.68MONEY MARKET INSTRUMENTSCD/CP • Small Industries
Development BankcARE - A1+ / cRISIL - A1+ / IcRA - A1+ 5.66
• National Bank for Agriculture & Rural Development cRISIL - A1+ 5.14
• Axis Bank Ltd. cRISIL - A1+ 5.06• Indusind Bank Ltd. cRISIL - A1+ 3.00• Export - Import Bank of India cRISIL - A1+ 2.96Bank of Baroda cRISIL - A1+ 2.72canFin Homes Ltd. cARE - A1+ / IcRA - A1+ 2.11IcIcI Bank Ltd. IcRA - A1+ 2.07The Federal Bank Ltd. cARE - A1+ 1.93Tata Motors Ltd. cRISIL - A1+ 1.22IDFc First Bank Ltd. cRISIL - A1+ 1.19Kotak Mahindra Bank Ltd. cRISIL - A1+ 1.19LIc Housing Finance Ltd. cRISIL - A1+ 1.19Punjab National Bank cARE - A1+ 1.19Tata Sons Ltd. cRISIL - A1+ 1.04National Housing Bank cRISIL - A1+ 0.93cooperatieve Rabobank U.A cRISIL - A1+ 0.89Indiabulls Housing Finance Ltd. cRISIL - A1+ 0.62Hero Fincorp Ltd. cRISIL - A1+ 0.60India Infoline Finance Ltd. cRISIL - A1+ 0.31Kotak Mahindra Investments Ltd. cRISIL - A1+ 0.30Deutsche Investments India Pvt Ltd. cRISIL - A1+ 0.29Sub Total 41.61cash, cash Equivalents and Net current Assets 3.71Grand Total 100.00• Top Ten Holdings, £ co-sponsor, @ less than 0.01%
Outstanding exposure in derivative instruments Interest Rate Swap (` in crore) 100.00
PORTFOLIO

46 May 2019
CATEgORY OF SCHEME: MONEY MARKET FUND
KEY FACTS
iNVESTMENT OBjECTiVE
To generate income / capital appreciation by investing in money market instruments.
There is no assurance that the investment objective of the Scheme will be realized.
CATEgORY OF SCHEME: Money Market Fund
FUND MANAgER ¥
Anil Bamboli (since July 25, 12)
Total Experience: Over 23 years
iNCEPTiON DATE (Date of Allotment)
November 18, 1999
NAV (AS ON MAY 31, 2019) NAV PER UNIT (`)
Regular Plan - Growth Option 3,936.1440Regular Plan - Daily Dividend Reinvestment Option 1,063.6400Regular Plan - Weekly Dividend Option 1,064.6746Direct Plan - Growth Option 3,972.7088Direct Plan - Daily Dividend Reinvestment Option 1,063.6400Direct Plan - Weekly Dividend Option 1,064.7156
ASSETS UNDER MANAgEMENT (`) iN CRORE
As on May 31, 2019 5,744.90Average for Month of May, 2019 5,587.14
qUANTiTATiVE DATA
Average Maturity * 260 daysMacaulay Duration * 259 daysModified Duration * 234 daysYield to Maturity * 7.28%* computed on the invested amount.
TOTAL ExPENSE RATIO (As on May 31, 2019)Including Additional expenses and Goods and Service Tax on Management Fees
Regular: 0.35% Direct: 0.15%
#BENCHMARK iNDEX: cRISIL Liquid Fund Index
##ADDl. BENCHMARK iNDEX: cRISIL 1 year T-Bill Index
EXiT lOAD
Nil
PLANS & OPTIONS
Regular Plan, Direct Plan. Each Plan offers Growth and Daily Dividend Option (with Reinvestment facility only). Weekly Dividend Option (with Payout and Reinvestment facility).
MiNiMUM APPliCATiON AMOUNT
Purchase : Under Growth Option and Weekly Dividend Option : ` 5,000 and any amount thereafter. Under Daily Dividend Option : ` 10,000 and any amount thereafter
Additional Purchase : Under Growth Option and Weekly Dividend Option : ̀ 1,000 and any amount thereafter. Under Daily Dividend Option : ` 5,000 and any amount thereafter
¥ Dedicated Fund Manager for Overseas Investments: Mr. Amar Kalkundrikar (Total Experience: Over 16 years).
PERFORMANCE ^ - Regular plan - growth Option
Date Period Scheme Returns
(%) $$
Benchmark Returns
(%)#
Additional Benchmark
Returns (%) ##
Value of ` 10,000 invested
Scheme (`) Benchmark (`)#
Additional Benchmark
(`)##
May 31, 18 Last 1 Year 8.17 7.73 7.86 10,817 10,773 10,786May 31, 16 Last 3 Years 7.18 7.19 6.79 12,313 12,316 12,180May 30, 14 Last 5 Years 7.67 7.65 7.31 14,479 14,465 14,238Nov 18, 99 Since Inception 7.28 N.A. 6.51 39,497 N.A. 34,296
Returns greater than 1 year period are compounded annualized (cAGR). N.A. Not Available. $$ All dividends declared prior to the splitting of the Scheme into Dividend & Growth Options are assumed to be reinvested in the units of the Scheme at the then prevailing NAV (ex-dividend NAV). Performance of dividend option under the schemes for the investors would be net of distribution tax as applicable. For performance of other schemes managed by Anil Bamboli, please refer page 52. Different plans viz. Regular Plan and Direct Plan have a different expense structure. The expenses of the Direct Plan under the Scheme will be lower to the extent of the distribution expenses / commission charged in the Regular Plan. For Performance of Direct Plan, refer page no. 62.
Face Value per Unit: ` 1,000, cD - certificate of Deposit; cP - commercial Papers. Data is as of May 31, 2019 unless otherwise specified.
n cP 36.35
n cD 61.59
n cash, cash Equivalents and Net current Assets 2.06
Portfolio Classification by Asset Class (%)
n AAA/AAA(SO)/A1+/A1+(SO) & equivalent 97.94
n cash, cash Equivalents and Net current Assets 2.06
Portfolio Classification by Rating Class (%)
This product is suitable for investors who are seeking ~
l income over short term
l to generate income / capital appreciation by investing in money market instruments
Riskometer
Investors understand that their principal will be at moderately low risk
~ Investors should consult their financial advisers if in doubt about whether the product is suitable for them. ^Past performance may or may not be sustained in the future. Load is not taken into consideration for computation of performance.
(An open ended debt scheme investing in money market instruments)HDFC Money Market Fund
Issuer Rating % to NAV
DEBT & DEBT RElATED
MONEY MARKET INSTRUMENTS
CD/CP
• Small Industries Development Bank
cARE - A1+ / cRISIL - A1+ / IcRA - A1+ 8.67
• Tata Sons Ltd. cRISIL - A1+ 8.66
• National Bank for Agriculture & Rural Development cRISIL - A1+ / IND - A1+ 8.53
• Rural Electrification corporation Ltd. cARE - A1+ 7.44
• LIc Housing Finance Ltd. cRISIL - A1+ / IcRA - A1+ 6.66
• Axis Bank Ltd. cRISIL - A1+ 6.62
• Indian Bank cRISIL - A1+ 5.78
• Indusind Bank Ltd. cRISIL - A1+ 4.85
• Andhra Bank cARE - A1+ 4.71
• IDFc First Bank Ltd. cRISIL - A1+ 4.56
Punjab National Bank cARE - A1+ 4.54
Power Finance corporation Ltd. cRISIL - A1+ 4.12
canFin Homes Ltd. IcRA - A1+ 4.11
Issuer Rating % to NAV
IcIcI Bank Ltd. IcRA - A1+ 3.73
Au Small Finance Bank Ltd. cRISIL - A1+ 2.58
Kotak Mahindra Investments Ltd. cRISIL - A1+ 2.48
The Federal Bank Ltd. cARE - A1+ 2.48
cooperatieve Rabobank U.A cRISIL - A1+ 2.47
Kotak Mahindra Bank Ltd. cRISIL - A1+ 1.66
Kotak Mahindra Prime Ltd. cRISIL - A1+ 1.64
L&T Finance Ltd. cARE - A1+ 0.42
Deutsche Investments India Pvt Ltd. cRISIL - A1+ 0.41
Oriental Bank of commerce cRISIL - A1+ 0.41
Sundaram BNP Paribas Home Finance Ltd. cRISIL - A1+ 0.41
Sub Total 97.94
cash, cash Equivalents and Net current Assets 2.06
Grand Total 100.00
• Top Ten Holdings
PORTFOLIO

May 2019 47
CATEgORY OF SCHEME: FLOATER FUND
KEY FACTS
iNVESTMENT OBjECTiVETo generate income/capital appreciation through investment in a portfolio comprising substantially of floating rate debt, fixed rate debt instruments swapped for floating rate returns and money market instruments. There is no assurance that the investment objective of the Scheme will be realized.
CATEgORY OF SCHEME: Floater Fund
FUND MANAgER ¥
Shobhit Mehrotra (since October 23, 2007)
Total Experience: Over 25 years
iNCEPTiON DATE (Date of Allotment)October 23, 2007
NAV (AS ON MAY 31, 2019) NAV PER UNIT (`)Wholesale OptionRegular Plan - Growth Option 32.9589Regular Plan - Daily Dividend Reinvestment Option 10.0809Regular Plan - Weekly Dividend Option 10.1499Regular Plan - Monthly Dividend Option 10.1585Direct Plan - Growth Option 33.1707Direct Plan - Daily Dividend Reinvestment Option 10.0809Direct Plan - Weekly Dividend Option 10.1500Direct Plan - Monthly Dividend Option 10.1587
ASSETS UNDER MANAgEMENT (`) iN CROREAs on May 31, 2019 11,083.59Average for Month of May, 2019 11,083.64
qUANTITATiVE DATAAverage Maturity * 306 daysMacaulay Duration * 277 daysModified Duration * 248 daysYield to Maturity * 7.78%* computed on the invested amount.
TOTAL ExPENSE RATIO (As on May 31, 2019)Including Additional expenses and Goods and Service Tax on Management FeesRegular: 0.38% Direct: 0.23%
#BENCHMARK iNDEX: cRISIL Liquid Fund Index
##ADDl. BENCHMARK iNDEX: cRISIL 1 year T-Bill Index
EXiT lOADNil
PLANS & OPTIONSRegular Plan, Direct Plan. Under both the Plans: Growth & Dividend Option. The Dividend Option offers Daily Dividend Option (with Reinvestment facility only) and Weekly and Monthly Dividend Option (with Payout and Reinvestment facility).
MiNiMUM APPliCATiON AMOUNTPurchase : ` 5,000 and any amount thereafter. Additional Purchase : ` 1 and any amount thereafter.
¥ Dedicated Fund Manager for Overseas Investments: Mr. Amar Kalkundrikar (Total Experience: Over 16 years).
Face Value per Unit: ` 10 unless otherwise specified, cD - certificate of Deposit; cP - commercial Papers. Data is as of May 31, 2019 unless otherwise specified.
PERFORMANCE ^ - Regular plan - growth Option
Date Period Scheme Returns
(%)
Benchmark Returns
(%)#
Additional Benchmark
Returns (%) ##
Value of ` 10,000 invested
Scheme (`) Benchmark (`)#
Additional Benchmark
(`)##
May 31, 18 Last 1 Year 8.39 7.73 7.86 10,839 10,773 10,786May 31, 16 Last 3 Years 7.68 7.19 6.79 12,485 12,316 12,180May 30, 14 Last 5 Years 8.18 7.65 7.31 14,820 14,465 14,238Oct 23, 07 Since Inception 8.21 7.54 6.51 25,003 23,264 20,795
Returns greater than 1 year period are compounded annualized (cAGR). Since Inception returns are calculated on ` 13.1821 (allotment price). Performance of dividend option under the schemes for the investors would be net of distribution tax as applicable. For performance of other schemes managed by Shobhit Mehrotra, please refer page 52. Different plans viz. Regular Plan and Direct Plan have a different expense structure. The expenses of the Direct Plan under the Scheme will be lower to the extent of the distribution expenses / commission charged in the Regular Plan. For Performance of Direct Plan, refer page no. 59.
This product is suitable for investors who are seeking ~
l income over short terml to generate income / capital appreciation through investment
in a portfolio comprising substantially of floating rate debt, fixed rate debt instruments swapped for floating rate returns and money market instruments
Riskometer
Investors understand that their principal will be at moderately low risk
~ Investors should consult their financial advisers if in doubt about whether the product is suitable for them.
^Past performance may or may not be sustained in the future. Load is not taken into consideration for computation of performance.
Portfolio Classification by Asset Class (%)
n G-Sec, SDL 2.75
n cP 5.90
n cD 31.29
n credit Exposure 53.80
n cash, cash Equivalents and Net current Assets 6.26
Portfolio Classification by Rating Class (%)
n Sovereign 2.75n AAA/AAA(SO)/A1+/A1+(SO) &
equivalent 75.66n AA+ 9.18n AA/AA- 3.83n A+ & Below 2.32n cash, cash Equivalents and Net
current Assets 6.26
[An open ended debt scheme predominantly investing in floating rate instruments (including fixed rate instruments converted to floating rate exposures using swaps / derivatives)]HDFC Floating Rate Debt Fund
Issuer Rating % to NAV
DEBT & DEBT RElATED
gOVERNMENT SECURiTiES (CENTRAl/STATE)
7.27 GOI 2026 Sovereign 1.14
7.32 GOI 2024 Sovereign 0.92
7.35 GOI 2024 Sovereign 0.46
7.65% Karnataka SDL - Mat 061227 Sovereign 0.18
9.23% Gujarat SDL - Mat 300322 Sovereign 0.05
7.69% Gujarat SDL - Mat 201227 Sovereign @
Sub Total 2.75
CREDiT EXPOSURE
• LIc Housing Finance Ltd. cARE - AAA / cRISIL - AAA 7.68
• Housing Development Finance corporation Ltd. £ cRISIL - AAA 6.38
• Power Finance corporation Ltd. cRISIL - AAA 5.98
• Shriram city Union Finance Ltd. cARE - AA+ 4.50
• National Bank for Agriculture & Rural Development cRISIL - AAA / IND - AAA 3.45
• Axis Bank Ltd. cRISIL - A1+ / cRISIL - AA+ 3.37
National Housing Bank cARE - AAA 3.22
Rural Electrification corporation Ltd. cRISIL - AAA 2.72
Union Bank of India cARE - AA- 2.51
Syndicate Bank cARE - A+ 2.32
Shriram Transport Finance company Ltd. IND - AA+ 2.23
Housing and Urban Development corporation Ltd. IcRA - AAA 1.36
Indiabulls Housing Finance Ltd. cARE - AAA 1.13
Reliable Devices Trust (PTc banked by receivables from Reliance Retail Ltd.) IcRA - AAA(SO) 1.06
State Bank of India cARE - AA+ / cRISIL - AA+ 1.03
Power Grid corporation of India Ltd. cRISIL - AAA 0.88
canara Bank cRISIL - AA 0.87
HPcL-Mittal Energy Ltd. IcRA - AA+ 0.75
NRSS xxIx Transmission Ltd. cRISIL - AAA 0.68
Issuer Rating % to NAV
Gujarat Road and Infra co Ltd. cARE - AAA(SO) 0.46
Bharti Airtel Ltd. cRISIL - AA 0.45
Volkswagen Finance Private Ltd. IND - AAA 0.45
HDB Financial Services Ltd. cRISIL - AAA 0.23
Reliance Industries Ltd. cRISIL - AAA 0.05
Tata Sons Ltd. cRISIL - AAA 0.04
Sub Total 53.80
Total 56.55
MONEY MARKET INSTRUMENTS
CD/CP
• National Bank for Agriculture & Rural Development cRISIL - A1+ 5.63
• Small Industries Development Bank cRISIL - A1+ / IcRA - A1+ 4.70
• IcIcI Bank Ltd. cRISIL - A1+ / IcRA - A1+ 4.70
• Export - Import Bank of India cRISIL - A1+ 4.27
Indusind Bank Ltd. cRISIL - A1+ 2.69
IDFc First Bank Ltd. cRISIL - A1+ 2.17
Bank of Baroda cRISIL - A1+ 1.96
Axis Bank Ltd. cRISIL - A1+ 1.93
JM Financial credit Solutions Ltd. IcRA - A1+ 1.51
Punjab National Bank cARE - A1+ 1.49
Andhra Bank cARE - A1+ 1.32
Adani Transmission Ltd. IcRA - A1+ 1.08
Indiabulls Housing Finance Ltd. cRISIL - A1+ 0.90
Power Finance corporation Ltd. cRISIL - A1+ 0.88
LIc Housing Finance Ltd. IcRA - A1+ 0.87
The Federal Bank Ltd. cARE - A1+ 0.64
India Infoline Finance Ltd. cRISIL - A1+ 0.45
Sub Total 37.19
cash, cash Equivalents and Net current Assets 6.26
Grand Total 100.00
• Top Ten Holdings, £ co-sponsor, @ Less than 0.01%
Outstanding exposure in derivative instruments Interest Rate Swap (` in crore) 6,410.00
PORTFOLIO

48 May 2019
CATEgORY OF SCHEME: ULTRA SHORT DURATION FUND
KEY FACTSiNVESTMENT OBjECTiVE
To generate income / capital appreciation through investment in debt securities and money market instruments.
There is no assurance that the investment objective of the Scheme will be realized.
CATEgORY OF SCHEME: Ultra Short Duration Fund
FUND MANAgER ¥
Anil Bamboli (since September 25, 18)
Total Experience: Over 23 years
iNCEPTiON DATE (Date of Allotment)
September 25, 2018
NAV (AS ON MAY 31, 2019) NAV PER UNIT (`)
Regular Plan - Growth Option 10.5974Regular Plan - Daily Dividend Reinvestment Option 10.0500Regular Plan - Weekly Dividend Option 10.0613Regular Plan - Monthly Dividend Option 10.0693Direct Plan - Growth Option 10.6204Direct Plan - Daily Dividend Reinvestment Option 10.0500Direct Plan - Weekly Dividend Option 10.0617Direct Plan - Monthly Dividend Option 10.0617
ASSETS UNDER MANAgEMENT (`) iN CRORE
As on May 31, 2019 6,196.08Average for Month of May, 2019 5,879.25
qUANTiTATiVE DATA
Average Maturity * 150 daysMacaulay Duration * 150 daysModified Duration * 131 daysYield to Maturity * 7.26%* computed on the invested amount.
TOTAL ExPENSE RATIO (As on May 31, 2019)Including Additional expenses and Goods and Service Tax on Management Fees
Regular: 0.60% Direct: 0.30%
#BENCHMARK iNDEX: cRISIL Ultra Short Term Debt Index
##ADDl. BENCHMARK iNDEX: cRISIL 1 year T-Bill Index
EXiT lOAD
Nil
PLANS & OPTIONS
Regular Plan, Direct Plan. Under both the Plans: Growth & Dividend Option. The Dividend Option offers Daily Dividend Option (with Reinvestment facility only) and Weekly and Monthly Dividend Option (with Payout and Reinvestment facility).
MiNiMUM APPliCATiON AMOUNT
Purchase : ` 5,000 and any amount thereafter. Additional Purchase : ` 1,000 and any amount thereafter.
¥ Dedicated Fund Manager for Overseas Investments: Mr. Amar Kalkundrikar (Total Experience: Over 16 years).
Face Value per Unit: ` 10 unless otherwise specified, cD - certificate of Deposit; cP - commercial Papers. Data is as of May 31, 2019 unless otherwise specified.
This product is suitable for investors who are seeking ~
l income over short terml income/capital appreciation through investment in debt
securities and money market instruments
Riskometer
Investors understand that their principal will be at moderately low risk
~ Investors should consult their financial advisers if in doubt about whether the product is suitable for them.
Portfolio Classification by Asset Class (%)
n cP 36.28
n cD 22.24
n credit Exposure 37.58
n cash, cash Equivalents and Net current Assets 3.90
Portfolio Classification by Rating Class (%)
n AAA/AAA(SO)/A1+/A1+(SO) & equivalent 94.32
n AA+ 1.62n AA/AA- 0.16
n cash, cash Equivalents and Net current Assets 3.90
[An open ended ultra-short term debt scheme investing in instruments such that the Macaulay Duration of the portfolio is between 3 months and 6 months (Refer page 2 for definition of Macaulay Duration)]HDFC Ultra Short Term Fund
Issuer Rating % to NAV
DEBT & DEBT RElATED
CREDiT EXPOSURE
• Housing Development Finance corporation Ltd. £ cRISIL - AAA / IcRA - AAA 8.22
• LIc Housing Finance Ltd. cARE - AAA / cRISIL - AAA 6.98
• National Housing Bank cARE - AAA 3.24
• Power Finance corporation Ltd. cRISIL - AAA 2.91
Rural electrification corporation Ltd. cRISIL - AAA 2.82
Power Grid corporation of India Ltd. cRISIL - AAA 2.42
National Bank for Agriculture & Rural Development cRISIL - AAA / IND - AAA 2.03
Mahindra & Mahindra Financial Services Ltd. cARE - AAA / IND - AAA 1.61
Bajaj Finance Ltd. IND - AAA 1.49
Tata capital Financial Services Ltd. cRISIL - AAA 1.21
Kotak Mahindra Prime Ltd. cRISIL - AAA 1.14
Adani Transmission Ltd. IND - AA+ 0.81
Sundaram BNP Paribas Home Finance Ltd. IcRA - AA+ 0.81
UltraTech cement Ltd. cRISIL - AAA 0.65
Small Industries Development Bank cARE - AAA 0.57
Reliable Devices Trust (PTc banked by receivables from Reliance Retail Ltd.) IcRA - AAA(SO) 0.51
cholamandalam Investment and Financial company Ltd. IcRA - AA 0.16
Sub Total 37.58
MONEY MARKET INSTRUMENTS
CD/CP
• Hindustan Petroleum corporation Ltd. cRISIL - A1+ 6.43
• Small Industries Development Bank cARE - A1+ 5.53
• Housing and Urban Development corporation Ltd. IND - A1+ 3.97
• IDFc First Bank Ltd. cRISIL - A1+ 3.81
• National Bank for Agriculture & Rural Development cRISIL - A1+ 3.60
Issuer Rating % to NAV
• IcIcI Bank Ltd. IcRA - A1+ 3.04
Andhra Bank cARE - A1+ 2.45
Axis Bank Ltd. cRISIL - A1+ 2.31
Kotak Mahindra Investments Ltd. cRISIL - A1+ 2.30
Punjab National Bank cARE - A1+ 2.30
Muthoot Finance Ltd. cRISIL - A1+ 2.01
Indian Bank cRISIL - A1+ 1.91
Tata Sons Ltd. cRISIL - A1+ 1.91
TATA capital Housing Finance Ltd. cRISIL - A1+ 1.58
Kotak Mahindra Bank Ltd. cRISIL - A1+ 1.54
LIc Housing Finance Ltd. cRISIL - A1+ / IcRA - A1+ 1.54
The Federal Bank Ltd. cARE - A1+ 1.53
Au Small Finance Bank Ltd. cRISIL - A1+ 1.47
Deutsche Investments India Pvt Ltd. cRISIL - A1+ 1.45
JSW Steel Ltd. IcRA - A1+ 1.21
Shriram Transport Finance company Ltd. cRISIL - A1+ 0.96
Indusind Bank Ltd. cRISIL - A1+ 0.94
ScB Inv & Loan (I) Ltd. cRISIL - A1+ 0.80
Sundaram BNP Paribas Home Finance Ltd. cRISIL - A1+ 0.79
Hero Fincorp Ltd. cRISIL - A1+ 0.78
Tata capital Financial Services Ltd. IcRA - A1+ 0.78
Ford credit India Pvt Ltd. IND - A1+ 0.40
Hongkong & Shanghai Bank Ltd. IND - A1+ 0.40
Power Finance corporation Ltd. cRISIL - A1+ 0.40
Kotak Mahindra Prime Ltd. cRISIL - A1+ 0.38
Sub Total 58.52
cash, cash Equivalents and Net current Assets 3.90
Grand Total 100.00
• Top Ten Holdings, £ co-sponsor
Outstanding exposure in derivative instruments Interest Rate Swap (` in crore) 525.00
PORTFOLIO

May 2019 49
CATEgORY OF SCHEME: LIqUID FUND
KEY FACTSiNVESTMENT OBjECTiVE
To generate income through a portfolio comprising money market and debt instruments.
There is no assurance that the investment objective of the Scheme will be realized.
CATEgORY OF SCHEME: Liquid Fund
FUND MANAgER ¥
Anupam Joshi (since October 27, 15)
Total Experience: Over 12 years
iNCEPTiON DATE (Date of Allotment)
October 17, 2000
NAV (AS ON MAY 31, 2019)^^ NAV PER UNiT (`)
HDFC liquid FundRegular Plan - Growth Option 3,704.2368Regular Plan - Daily Dividend Reinvestment Option 1,019.8200Regular Plan - Weekly Dividend Option 1,031.8884Regular Plan - Monthly Dividend Option 1,027.1551Direct Plan - Growth Option 3,723.0574Direct Plan - Daily Dividend Reinvestment Option 1,019.8200Direct Plan - Weekly Dividend Option 1,031.8995Direct Plan - Monthly Dividend Option 1,027.1664
ASSETS UNDER MANAgEMENT (`) iN CRORE
As on May 31, 2019 87,799.02Average for Month of May, 2019 83,328.27
qUANTiTATiVE DATA
Average Maturity * 41 daysMacaulay Duration * 40 daysModified Duration * 37 daysYield to Maturity * 6.94%* computed on the invested amount.
TOTAL ExPENSE RATIO (As on May 31, 2019)Including Additional expenses and Goods and Service Tax on Management Fees
Regular: 0.25% Direct: 0.15%
#BENCHMARK iNDEX: cRISIL Liquid Fund Index
##ADDl. BENCHMARK iNDEX: cRISIL 1 year T-Bill Index
EXiT lOAD
Nil
PLANS & OPTIONS
Regular Plan, Direct Plan. Under both the Plans: Growth & Dividend Option. The Dividend Option offers Daily Dividend Option (Reinvestment facility only) and Weekly and Monthly Dividend Option (with Payout and Reinvestment facility).
MiNiMUM APPliCATiON AMOUNT
Purchase : Under Growth Option, Weekly Dividend Option and Monthly Dividend Option: ` 5,000 and any amount thereafter. Under Daily Dividend Option: ̀ 10,000 and any amount thereafter.Additional Purchase : Under Growth Option, Weekly Dividend Option and Monthly Dividend Option: ̀ 1,000 and any amount thereafter. Under Daily Dividend Option: ` 5,000 and any amount thereafter.
¥ Dedicated Fund Manager for Overseas Investments: Mr. Amar Kalkundrikar (Total Experience: Over 16 years).
^^calculated on all calendar days.
Face Value per Unit: ` 1,000, cD - certificate of Deposit; cP - commercial Papers. Data is as of May 31, 2019 unless otherwise specified.
This product is suitable for investors who are seeking ~
l regular income over short term
l to generate income through a portfolio comprising money market and debt instruments
Riskometer
Investors understand that their principal will be at low risk
~ Investors should consult their financial advisers if in doubt about whether the product is suitable for them.
PERFORMANCE ^ - Regular plan - growth Option
Date Period Scheme Returns
(%)
Benchmark Returns
(%)#
Additional Benchmark
Returns (%) ##
Value of ` 10,000 invested
Scheme (`) Benchmark (`)#
Additional Benchmark
(`)##
May 24, 19 Last 7 days 7.25 7.60 14.27 10,014 10,015 10,027May 16, 19 Last 15 days 7.39 7.97 11.25 10,030 10,033 10,046Apr 30, 19 Last 1 Month 7.34 8.06 9.02 10,062 10,068 10,077May 31, 18 Last 1 Year 7.41 7.73 7.86 10,741 10,773 10,786May 31, 16 Last 3 Years 6.99 7.19 6.79 12,247 12,316 12,180May 30, 14 Last 5 Years 7.59 7.65 7.31 14,421 14,465 14,238Oct 17, 00 Since Inception 7.28 N.A. 6.42 37,042 N.A. 31,869
Returns less than 1 year period are simple annualized and greater than 1 year are compounded annualized (cAGR). N.A. Not Available. Performance of dividend option under the schemes for the investors would be net of distribution tax as applicable. For performance of other schemes managed by Anupam Joshi, please refer page 52. Different plans viz. Regular Plan and Direct Plan have a different expense structure. The expenses of the Direct Plan under the Scheme will be lower to the extent of the distribution expenses / commission charged in the Regular Plan. For Performance of Direct Plan, refer page no. 60.
n SDL, T-Bills 15.56
n cP 61.23
n cD 17.15
n credit Exposure 5.97
n cash, cash Equivalents and Net current Assets 0.09
Portfolio Classification by Asset Class (%)
n Sovereign 15.56
n AAA/AAA(SO)/A1+/A1+(SO) & equivalent 84.32
n AA+ 0.03
n cash, cash Equivalents and Net current Assets 0.09
Portfolio Classification by Rating Class (%)
(An open ended liquid scheme)HDFC Liquid Fund
PORTFOLIO
Company Rating % to NAV
DEBT & DEBT RElATED
gOVERNMENT SECURiTiES (CENTRAl/STATE)
7.86% Rajasthan SDL (UDAY Scheme- Strip II ) - ISD 230616 Mat 230619 Sovereign 0.19
7.85% Andhra Pradesh SDL - Mat 220719 Sovereign 0.10
7.85% Gujarat SDL - Mat 220719 Sovereign 0.04
7.93% Andhra Pradesh SDL - Mat 080719 Sovereign 0.03
Sub Total 0.36
T-BillS
• 91 Days TBill - Mat 150819 Sovereign 4.50
• 91 Days Tbill - ISD 090519 Mat 080819 Sovereign 3.39
91 Days TBill - Mat 220819 Sovereign 2.59
91 Days TBill - Mat 040719 Sovereign 1.61
Company Rating % to NAV
91 Days Tbill - Mat 270619 Sovereign 0.88
91 Days TBill - Mat 250719 Sovereign 0.54
91 Days TBill - Mat 010819 Sovereign 0.41
91 Days Tbill - Mat 110719 Sovereign 0.32
182 Days Tbill - Mat 080819 Sovereign 0.31
91 Days Tbill - Mat 180719 Sovereign 0.28
182 Days Tbill - Mat 270619 Sovereign 0.11
91 Days Tbill - Mat 060619 Sovereign 0.10
182 Days Tbill - Mat 180719 Sovereign 0.06
364 Days TBill - Mat 060619 Sovereign 0.05
182 Days TBill - Mat 010819 Sovereign 0.03
91 Days Tbill - Mat 210619 Sovereign 0.02
Sub Total 15.20
^Past performance may or may not be sustained in the future. Load is not taken into consideration for computation of performance.

50 May 2019
Face Value per Unit: ` 1,000, cD - certificate of Deposit; cP - commercial Papers. Data is as of May 31, 2019 unless otherwise specified.
(An open ended liquid scheme) .....Contd from previous pageHDFC Liquid FundPORTFOLIO
Company Rating % to NAV
CREDiT EXPOSURE
Housing Development Finance corporation Ltd. £ cRISIL - AAA 2.14
Indian Railways Finance corporation Ltd. cARE - AAA / cRISIL - AAA 0.79
Power Finance corporation Ltd. cRISIL - AAA 0.64
Mahindra & Mahindra Financial Services Ltd. IND - AAA 0.45
LIc Housing Finance Ltd. cARE - AAA / cRISIL - AAA 0.38
ONGc Mangalore Petrochemicals Ltd. IND - AAA 0.35
Tata capital Financial Services Ltd. cRISIL - AAA / IcRA - AA+ 0.23
Toyota Financial Services India Ltd. cRISIL - AAA 0.23
L&T Finance Ltd. cARE - AAA 0.18
L&T Infrastructure Finance Ltd. cARE - AAA 0.14
Power Grid corporation of India Ltd. cARE - AAA / cRISIL - AAA 0.14
IcIcI Home Finance Ltd. IcRA - AAA 0.09
Kotak Mahindra Prime Ltd. cRISIL - AAA 0.06
Rural Electrification corporation Ltd. cRISIL - AAA 0.05
Bajaj Finance Ltd. IND - AAA 0.03
Daimler Financial Services India Private Ltd. IND - AAA 0.03
Volkswagen Finance Private Ltd. IND - AAA 0.03
Housing and Urban Development corporation Ltd. cARE - AAA 0.01
Sub Total 5.97
TOTAL 21.53
MONEY MARKET INSTRUMENTS
CD/CP
• National Bank for Agriculture & Rural Development cRISIL - A1+ / IcRA - A1+ 7.74
• Indian Oil corporation Ltd. cRISIL - A1+ / IcRA - A1+ 6.03
• Tata Sons Ltd. cRISIL - A1+ 4.50
• NTPc Ltd. cARE - A1+ / cRISIL - A1+ / IcRA - A1+ 3.96
• Reliance Industries Ltd. cRISIL - A1+ / IcRA - A1+ 3.83
• Steel Authority of India Ltd. cARE - A1+ 3.73
• Reliance Retail Ltd. cARE - A1+ 2.84
• IcIcI Bank Ltd. IcRA - A1+ 2.72
Bank of Baroda cRISIL - A1+ 2.58
Axis Bank Ltd. cRISIL - A1+ / IcRA - A1+ 2.18
Bajaj Finance Ltd. cRISIL - A1+ 2.08
Reliance Jio Infocomm Ltd. cRISIL - A1+ 1.80
Tata Teleservices (Maharashtra) Ltd. cRISIL - A1+ 1.73
Tata Teleservices Ltd. cRISIL - A1+ 1.72
Hindustan Zinc Ltd. cRISIL - A1+ 1.70
Adani Ports & Special economic Zone cARE - A1+ 1.68
LIc Housing Finance Ltd. cRISIL - A1+ 1.64
National Housing Bank cRISIL - A1+ 1.62
Syndicate Bank cRISIL - A1+ 1.59
Oriental Bank of commerce cRISIL - A1+ 1.42
The South Indian Bank Ltd. cARE - A1+ / cRISIL - A1+ 1.34
PNB Housing Finance Ltd. cARE - A1+ / cRISIL - A1+ 1.29
canara Bank cRISIL - A1+ 1.26
Punjab National Bank cARE - A1+ 1.22
Oil & Natural Gas corporation Ltd. cARE - A1+ 1.13
Power Finance corporation Ltd. cRISIL - A1+ 1.13
Company Rating % to NAV
Tata Motors Finance Ltd. cARE - A1+ / cRISIL - A1+ 0.97
Bharat Heavy electricals Ltd. cARE - A1+ 0.91
Bank of India cRISIL - A1+ 0.86
Aditya Birla Finance Ltd. IcRA - A1+ 0.79
IDFc First Bank Ltd. cRISIL - A1+ 0.68
TMF Holdings Ltd. (Subsidiary of Tata Motors Ltd.) cARE - A1+ 0.57
Tata Steel Ltd. IcRA - A1+ 0.57
Deutsche Investments India Pvt Ltd. cRISIL - A1+ 0.49
Housing and Urban Development corporation Ltd. cARE - A1+ 0.48
Kotak Mahindra Prime Ltd. cRISIL - A1+ 0.46
chambal Fertilizers & chemicals Ltd. cRISIL - A1+ 0.39
JSW Steel Ltd. IcRA - A1+ 0.39
Andhra Bank IND - A1+ 0.34
Larsen and Toubro Ltd. cRISIL - A1+ 0.34
Muthoot Finance Ltd. cRISIL - A1+ 0.34
SBI cards & Payment Services P. Ltd. cRISIL - A1+ 0.34
Tata Projects Ltd. cRISIL - A1+ 0.34
Indusind Bank Ltd. cRISIL - A1+ 0.33
National Fertilizers Ltd. IcRA - A1+ 0.31
Tata capital Financial Services Ltd. cRISIL - A1+ 0.28
Aditya Birla capital Ltd. cRISIL - A1+ 0.23
BASF India Ltd. cRISIL - A1+ 0.23
Julius Baer capital (India) Private cRISIL - A1+ / IcRA - A1+ 0.23
Kotak Securities Ltd. cRISIL - A1+ 0.23
Nirma Ltd. cRISIL - A1+ 0.23
Tata Realty and Infrastructure Ltd. cRISIL - A1+ 0.23
Au Small Finance Bank Ltd. cRISIL - A1+ 0.22
Magma Fincorp Ltd. cRISIL - A1+ 0.22
SBI Global Factors Ltd. cRISIL - A1+ 0.22
Tata Motors Finance Solutions Ltd. cARE - A1+ 0.22
T V Sundram Iyengar & Sons Pvt Ltd. IcRA - A1+ 0.17
Axis Finance Ltd. IND - A1+ 0.14
ScB Inv & Loan (I) Ltd. cRISIL - A1+ 0.12
Hindustan Petroleum corporation Ltd. cRISIL - A1+ 0.11
L&T Finance Holdings Ltd. cARE - A1+ 0.11
Redington (India) Ltd. IcRA - A1+ 0.11
Shriram Transport Finance company Ltd. cRISIL - A1+ 0.11
TGS Investment & Trade Pvt Ltd. IcRA - A1+ 0.11
UPL Ltd. cRISIL - A1+ 0.11
Aditya Birla Money Ltd. cRISIL - A1+ 0.09
Turquoise Investments & Finance Pvt Ltd. cRISIL - A1+ 0.09
Grasim Industries Ltd. cRISIL - A1+ 0.06
Small Industries Development Bank cARE - A1+ 0.06
Toyota Financial Services India Ltd. cRISIL - A1+ 0.06
L&T Finance Ltd. cRISIL - A1+ 0.03
Sub Total 78.38
cash, cash Equivalents and Net current Assets 0.09
Grand Total 100.00
• Top Ten Holdings, £ co-sponsor
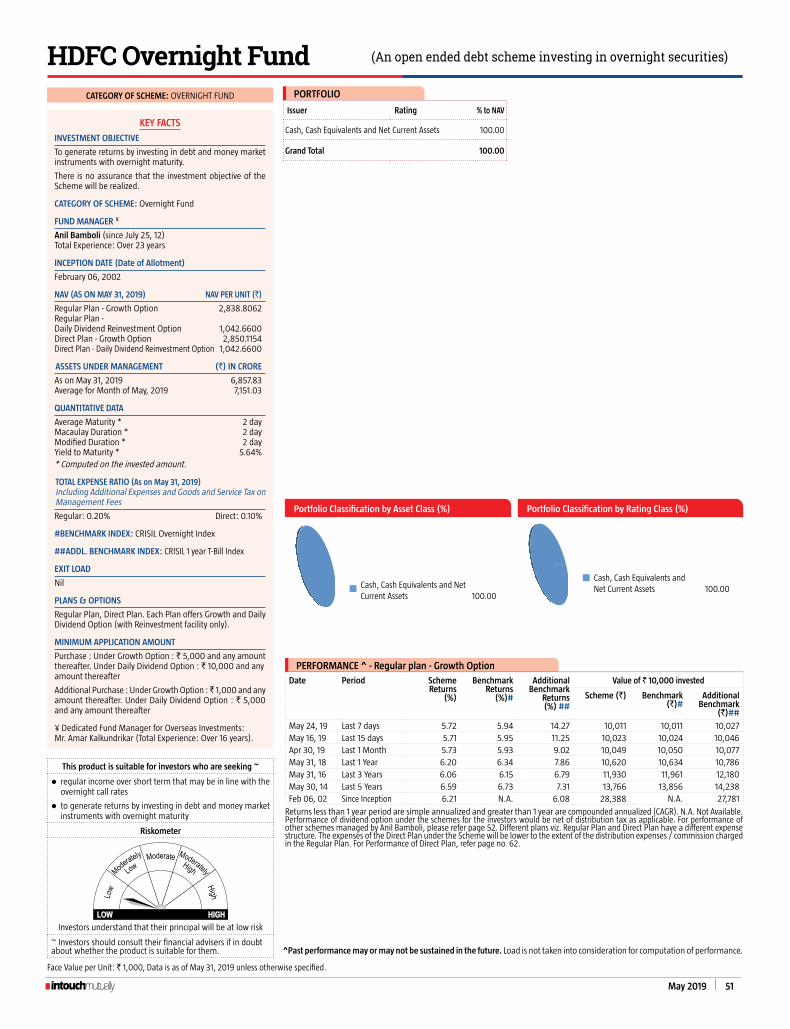
May 2019 51
CATEgORY OF SCHEME: OVERNIGHT FUND
KEY FACTS
iNVESTMENT OBjECTiVE
To generate returns by investing in debt and money market instruments with overnight maturity.
There is no assurance that the investment objective of the Scheme will be realized.
CATEgORY OF SCHEME: Overnight Fund
FUND MANAgER ¥
Anil Bamboli (since July 25, 12)
Total Experience: Over 23 years
iNCEPTiON DATE (Date of Allotment)
February 06, 2002
NAV (AS ON MAY 31, 2019) NAV PER UNIT (`)
Regular Plan - Growth Option 2,838.8062Regular Plan - Daily Dividend Reinvestment Option 1,042.6600Direct Plan - Growth Option 2,850.1154Direct Plan - Daily Dividend Reinvestment Option 1,042.6600
ASSETS UNDER MANAgEMENT (`) iN CRORE
As on May 31, 2019 6,857.83Average for Month of May, 2019 7,151.03
qUANTiTATiVE DATA
Average Maturity * 2 dayMacaulay Duration * 2 dayModified Duration * 2 dayYield to Maturity * 5.64%* computed on the invested amount.
TOTAL ExPENSE RATIO (As on May 31, 2019)Including Additional expenses and Goods and Service Tax on Management Fees
Regular: 0.20% Direct: 0.10%
#BENCHMARK iNDEX: cRISIL Overnight Index
##ADDl. BENCHMARK iNDEX: cRISIL 1 year T-Bill Index
EXiT lOAD
Nil
PLANS & OPTIONS
Regular Plan, Direct Plan. Each Plan offers Growth and Daily Dividend Option (with Reinvestment facility only).
MiNiMUM APPliCATiON AMOUNT
Purchase : Under Growth Option : ` 5,000 and any amount thereafter. Under Daily Dividend Option : ` 10,000 and any amount thereafter
Additional Purchase : Under Growth Option : ̀ 1,000 and any amount thereafter. Under Daily Dividend Option : ` 5,000 and any amount thereafter
¥ Dedicated Fund Manager for Overseas Investments: Mr. Amar Kalkundrikar (Total Experience: Over 16 years).
PERFORMANCE ^ - Regular plan - growth Option
Date Period Scheme Returns
(%)
Benchmark Returns
(%)#
Additional Benchmark
Returns (%) ##
Value of ` 10,000 invested
Scheme (`) Benchmark (`)#
Additional Benchmark
(`)##
May 24, 19 Last 7 days 5.72 5.94 14.27 10,011 10,011 10,027May 16, 19 Last 15 days 5.71 5.95 11.25 10,023 10,024 10,046Apr 30, 19 Last 1 Month 5.73 5.93 9.02 10,049 10,050 10,077May 31, 18 Last 1 Year 6.20 6.34 7.86 10,620 10,634 10,786May 31, 16 Last 3 Years 6.06 6.15 6.79 11,930 11,961 12,180May 30, 14 Last 5 Years 6.59 6.73 7.31 13,766 13,856 14,238Feb 06, 02 Since Inception 6.21 N.A. 6.08 28,388 N.A. 27,781
Returns less than 1 year period are simple annualized and greater than 1 year are compounded annualized (cAGR). N.A. Not Available. Performance of dividend option under the schemes for the investors would be net of distribution tax as applicable. For performance of other schemes managed by Anil Bamboli, please refer page 52. Different plans viz. Regular Plan and Direct Plan have a different expense structure. The expenses of the Direct Plan under the Scheme will be lower to the extent of the distribution expenses / commission charged in the Regular Plan. For Performance of Direct Plan, refer page no. 62.
Face Value per Unit: ` 1,000, Data is as of May 31, 2019 unless otherwise specified.
cash, cash Equivalents and Net current Assets 100.00
Portfolio Classification by Asset Class (%)
cash, cash Equivalents and Net current Assets 100.00
Portfolio Classification by Rating Class (%)
This product is suitable for investors who are seeking ~
l regular income over short term that may be in line with the overnight call rates
l to generate returns by investing in debt and money market instruments with overnight maturity
Riskometer
Investors understand that their principal will be at low risk
~ Investors should consult their financial advisers if in doubt about whether the product is suitable for them. ^Past performance may or may not be sustained in the future. Load is not taken into consideration for computation of performance.
(An open ended debt scheme investing in overnight securities)HDFC Overnight Fund
Issuer Rating % to NAV
cash, cash Equivalents and Net current Assets 100.00
Grand Total 100.00
PORTFOLIO

52 May 2019
Performance details of Schemes managed by respective Fund Managers
Sr. No. Name of the Fund Manager Funds Managed Page no.1 Mr. Prashant Jain HDFC Equity Fund 05
HDFC Top 100 Fund 07
HDFC Balanced Advantage Fund 13-14
HDFC Hybrid Debt Fund (Co-managed scheme) 32-33
2 Mr. Vinay Kulkarni HDFC Focused 30 Fund 11
HDFC Growth Opportunities Fund 10
HDFC TaxSaver 23
HDFC Equity Savings Fund (Co-managed scheme) 30-31
3 Mr. Chirag Setalvad HDFC Mid-Cap Opportunities Fund 08
HDFC Small Cap Fund 09
HDFC Long Term Advantage Fund 53
HDFC Hybrid Equity Fund 15-16
HDFC Children’s Gift Fund 24-25
HDFC Multi-Asset Fund (Co-managed scheme) 17-18
HDFC Retirement Savings Fund - Equity Plan (Co-managed scheme) 26
HDFC Retirement Savings Fund - Hybrid Equity Plan (Co-managed scheme) 27-28
HDFC Retirement Savings Fund - Hybrid Debt Plan (Co-managed scheme) 29
4 Mr. Miten Lathia HDFC Capital Builder Value Fund 06
HDFC Dynamic PE Ratio Fund of Funds (Co-managed scheme) 57
5 Mr. Krishan Kumar Daga HDFC Arbitrage Fund 34-35
HDFC Multi-Asset Fund (Co-managed scheme) 17-18
HDFC Index Fund - SEnSEx Plan 22
HDFC Index Fund - nIFTY 50 Plan 20
HDFC SEnSEx ETF 21
HDFC nIFTY 50 ETF 19
HDFC Gold Exchange Traded Fund 55
HDFC Gold Fund 55
HDFC Equity Savings Fund (Co-managed scheme) 30-31
Closed ended schemes (Co-managed) 57
6 Mr. Shobhit Mehrotra HDFC Income Fund 42
HDFC Medium Term Debt Fund 43
HDFC Floating Rate Debt Fund 47
HDFC Credit Risk Debt Fund 37-38
HDFC Hybrid Debt Fund (Co-managed scheme) 32-33
HDFC Retirement Savings Fund - Equity Plan (Co-managed scheme) 26
HDFC Retirement Savings Fund - Hybrid Equity Plan (Co-managed scheme) 27-28
HDFC Retirement Savings Fund - Hybrid Debt Plan (Co-managed scheme) 29
Close ended schemes 53
7 Mr. Anil Bamboli HDFC Dynamic Debt Fund 41
HDFC Short Term Debt Fund 42
HDFC Gilt Fund 40
HDFC Money Market Fund 46
HDFC Ultra Short Term Fund 48
HDFC Overnight Fund 50
HDFC Banking and PSU Debt Fund 39
HDFC Equity Savings Fund (Co-managed scheme) 30-31
HDFC Multi-Asset Fund (Co-managed scheme) 17-18
HDFC Dynamic PE Ratio Fund of Funds (Co-managed scheme) 56
Close ended schemes 53-55
Closed ended schemes (Co-managed) 57
8 Mr. Anupam Joshi HDFC Liquid Fund 49-50
HDFC Corporate Bond Fund 36
HDFC Low Duration Fund 45
Close ended schemes 55-56
9 Mr. Srinivas Rao Ravuri HDFC Infrastructure Fund 12
Close ended schemes 56
For performance details of Direct Plan, refer page 58-65
Exit Load : (i) no exit load shall be levied for switching between Options under the same Plan within a Scheme. (ii) Switch of investments to Direct Plan within the same Scheme shall be subject to applicable exit load, unless the investments were made without any distributor code. However, any subsequent switch-out or redemption of such investments from the Direct Plan will not be subject to any exit load. (iii) no exit load shall be levied for switch-out from Direct Plan to other Plan within the same Scheme. However, any subsequent switch-out or redemption of such investment from the other Plan shall be subject to exit load based on the original date of investment in the Direct Plan. (iv) Switch of investments between Plans under a Scheme having separate portfolios, will be subject to applicable exit load. (v) no exit load will be levied on Bonus Units and Units allotted on Dividend Re-investment. (vi) In case of Systematic Transactions such as SIP, GSIP, Flex SIP, STP, Flex STP, Swing STP, Flexindex; Exit Load, if any, prevailing on the date of registration / enrolment shall be levied.
Tax Benefits / Consequences : The Dividend Distribution Tax on distribution of income by equity oriented fund to all the investors shall be payable at the rate of 11.648%* and on distribution of income by other than equity oriented fund to an individual / HUF shall be payable at the rate of 29.12%* and at the rate of 34.944%* on distribution of income to any other investor. Such income distributed by the Scheme(s) is free from Income–tax in the hands of Investors. Units of the Scheme(s) are not subject to Wealth-tax and Gift-tax. Unit holders are required to pay Securities Transaction Tax (STT) at the rate of 0.001% at the time of redemption / switch-out of units of an equity-oriented fund. * including applicable surcharge, health and education cess.
Investors should be aware that the fiscal rules / tax laws may change and there can be no guarantee that the current tax position may continue indefinitely. In view of individual nature of tax consequences, each investor is advised to consult his / her own professional tax advisor.
3 Mr. Srinivas Rao Ravuri HDFC Infrastructure Fund 12
Close ended schemes 53

May 2019 53
SCHEME PERFORMANCE - REGULAR PLAN - GROWTH OPTION (FUND MANAGER-WISE)
Past performance may or may not be sustained in the future. Returns greater than 1 year period are compounded annualized (CAGR). Different plans viz. Regular Plan and Direct Plan have a different expense structure. The expenses of the Direct Plan under the Scheme will be lower to the extent of the distribution expenses / commission charged in the Regular Plan. Load is not taken into consideration for computation of performance. n.A.: not Available
Performance of close-ended schemes, being close-ended in nature, is not strictly comparable with that of open-ended schemes since the investment strategy for close-ended schemes is primarily buy-and-hold whereas open-ended schemes are actively managed.
CHIRAG SETALVAD
HDFC LONG TERM ADVANTAGE FUND NAV as on May 31, 2019 ` 371.714
Date Period Scheme Returns
(%)
Benchmark Returns
(%)#
Additional Benchmark
Returns (%) ##
Value of ` 10,000 invested
Scheme (`)
Benchmark (`)#
Additional Benchmark
(`)##
May 31, 18 Last 1 Year 10.24 13.70 12.43 11,024 11,370 11,243May 31, 16 Last 3 Years 15.28 15.65 14.99 15,320 15,470 15,203May 30, 14 Last 5 Years 13.52 11.91 11.92 18,864 17,566 17,571Jan 02, 01 Since Inception 21.69 14.28 14.53 371,714 116,886 121,679
# S&P BSE SEnSEx (Total Returns Index) ## nIFTY 50 (Total Returns Index). The scheme is managed by Mr. Chirag Setalvad since April 02, 2007.
SHOBHIT MEHROTRA
HDFC FMP 3360D MARCH 2014 (1) NAV as on May 31, 2019 ` 14.3343
Date Period Scheme Returns
(%)
Benchmark Returns
(%)#
Additional Benchmark
Returns (%) ##
Value of ` 10,000 invested
Scheme (`)
Benchmark (`)#
Additional Benchmark
(`)##
May 31, 18 Last 1 Year 10.97 10.68 12.20 11,097 11,068 11,220May 31, 16 Last 3 Years 8.26 7.95 6.75 12,689 12,579 12,165May 30, 14 Last 5 Years 7.66 8.98 8.23 14,471 15,377 14,859Mar 26, 14 Since Inception 7.19 9.31 8.43 14,334 15,861 15,215
# CRISIL Composite Bond Fund Index ## CRISIL 10 year Gilt Index. The scheme is managed by Mr. Shobhit Mehrotra since inception.
HDFC FMP 1168D FEBRUARy 2016 (1) NAV as on May 31, 2019 ` 13.4979
Date Period Scheme Returns
(%)
Benchmark Returns
(%)#
Additional Benchmark
Returns (%) ##
Value of ` 10,000 invested
Scheme (`)
Benchmark (`)#
Additional Benchmark
(`)##
May 31, 18 Last 1 Year 8.17 10.68 7.86 10,817 11,068 10,786May 31, 16 Last 3 Years 9.35 7.95 6.79 13,076 12,579 12,180Feb 03, 16 Since Inception 9.45 8.35 6.86 13,498 13,053 12,466
# CRISIL Composite Bond Fund Index ## CRISIL 1 year T-Bill Index. The Scheme is in existence for more than 3 years but less than 5 years. The scheme is managed by Mr. Shobhit Mehrotra since inception.
HDFC FMP 1213D MARCH 2017 (1) NAV as on May 31, 2019 ` 11.6170
Date Period Scheme Returns
(%)
Benchmark Returns
(%)#
Additional Benchmark
Returns (%) ##
Value of ` 10,000 invested
Scheme (`)
Benchmark (`)#
Additional Benchmark
(`)##
May 31, 18 Last 1 Year 7.47 10.68 7.86 10,747 11,068 10,786Mar 23, 17 Since Inception 7.09 6.88 6.65 11,617 11,568 11,514
# CRISIL Composite Bond Fund Index ## CRISIL 1 year T-Bill Index. The Scheme is in existence for more than 1 year but less than 3 years. The scheme is managed by Mr. Shobhit Mehrotra since inception.
HDFC FMP 1188D MARCH 2017 (1) NAV as on May 31, 2019 ` 11.6226
Date Period Scheme Returns
(%)
Benchmark Returns
(%)#
Additional Benchmark
Returns (%) ##
Value of ` 10,000 invested
Scheme (`)
Benchmark (`)#
Additional Benchmark
(`)##
May 31, 18 Last 1 Year 7.34 10.68 7.86 10,734 11,068 10,786Mar 30, 17 Since Inception 7.18 6.66 6.67 11,623 11,501 11,504
# CRISIL Composite Bond Fund Index ## CRISIL 1 year T-Bill Index. The Scheme is in existence for more than 1 year but less than 3 years. The scheme is managed by Mr. Shobhit Mehrotra since inception.
HDFC FMP 1172D APRIL 2017 (1) NAV as on May 31, 2019 ` 11.5629
Date Period Scheme Returns
(%)
Benchmark Returns
(%)#
Additional Benchmark
Returns (%) ##
Value of ` 10,000 invested
Scheme (`)
Benchmark (`)#
Additional Benchmark
(`)##
May 31, 18 Last 1 Year 8.77 10.68 7.86 10,877 11,068 10,786Apr 11, 17 Since Inception 7.03 6.82 6.70 11,563 11,515 11,487
# CRISIL Composite Bond Fund Index ## CRISIL 1 year T-Bill Index. The Scheme is in existence for more than 1 year but less than 3 years. The scheme is managed by Mr. Shobhit Mehrotra since inception.
HDFC FMP 1165D APRIL 2017 (1) NAV as on May 31, 2019 ` 11.5458
Date Period Scheme Returns
(%)
Benchmark Returns
(%)#
Additional Benchmark
Returns (%) ##
Value of ` 10,000 invested
Scheme (`)
Benchmark (`)#
Additional Benchmark
(`)##
May 31, 18 Last 1 Year 8.71 10.68 7.86 10,871 11,068 10,786Apr 18, 17 Since Inception 7.02 6.73 6.78 11,546 11,480 11,490
# CRISIL Composite Bond Fund Index ## CRISIL 1 year T-Bill Index. The Scheme is in existence for more than 1 year but less than 3 years. The scheme is managed by Mr. Shobhit Mehrotra since inception.
HDFC FMP 1166D MAy 2017 (1) NAV as on May 31, 2019 ` 11.6216
Date Period Scheme Returns
(%)
Benchmark Returns
(%)#
Additional Benchmark
Returns (%) ##
Value of ` 10,000 invested
Scheme (`)
Benchmark (`)#
Additional Benchmark
(`)##
May 31, 18 Last 1 Year 8.08 10.68 7.86 10,808 11,068 10,786May 09, 17 Since Inception 7.57 6.87 6.86 11,622 11,467 11,464
# CRISIL Composite Bond Fund Index ## CRISIL 1 year T-Bill Index. The Scheme is in existence for more than 1 year but less than 3 years. The scheme is managed by Mr. Shobhit Mehrotra since inception.
HDFC FMP 1136D JUNE 2017 (1) NAV as on May 31, 2019 ` 11.4546
Date Period Scheme Returns
(%)
Benchmark Returns
(%)#
Additional Benchmark
Returns (%) ##
Value of ` 10,000 invested
Scheme (`)
Benchmark (`)#
Additional Benchmark
(`)##
May 31, 18 Last 1 Year 7.57 10.68 7.86 10,757 11,068 10,786Jun 08, 17 Since Inception 7.11 5.94 6.86 11,455 11,208 11,402
# CRISIL Composite Bond Fund Index ## CRISIL 1 year T-Bill Index. The Scheme is in existence for more than 1 year but less than 3 years. The scheme is managed by Mr. Shobhit Mehrotra since inception.
HDFC FMP 1430D JULy 2017 (1) NAV as on May 31, 2019 ` 11.2611
Date Period Scheme Returns
(%)
Benchmark Returns
(%)#
Additional Benchmark
Returns (%) ##
Value of ` 10,000 invested
Scheme (`)
Benchmark (`)#
Additional Benchmark
(`)##
May 31, 18 Last 1 Year 9.98 10.68 7.86 10,998 11,068 10,786Aug 01, 17 Since Inception 6.70 5.68 6.89 11,261 11,064 11,297
# CRISIL Composite Bond Fund Index ## CRISIL 1 year T-Bill Index. The Scheme is in existence for more than 1 year but less than 3 years. The scheme is managed by Mr. Shobhit Mehrotra since inception.
ANIL BAMBOLI
HDFC CHARITy FUND FOR CANCER CURE - DEBT PLAN^
NAV as on May 31, 2019 ` 10.1882
Date Period Scheme Returns
(%)
Benchmark Returns
(%)#
Additional Benchmark
Returns (%) ##
Value of ` 10,000 invested
Scheme (`)
Benchmark (`)#
Additional Benchmark
(`)##
May 31, 18 Last 1 Year 8.56 9.24 7.86 10,856 10,924 10,786Mar 27, 17 Since Inception 7.36 7.07 6.66 11,674 11,604 11,507
# CRISIL Short Term Bond Fund Index ## CRISIL 1 year T-Bill Index. The Scheme is in existence for more than 1 year but less than 3 years. The scheme is managed by Mr. Anil Bamboli since inception. ^Scheme offers Dividend option only. Returns of HDFC Charity Fund for Cancer Cure - Debt Plan - Regular Plan are computed based on nAV of Dividend Option and all dividends (after statutory levy) are assumed to be reinvested in the units of the scheme at the then prevailing nAV (ex-dividend nAV).
HDFC FMP 1846D AUGUST 2013 (1) NAV as on May 31, 2019 ` 16.1472
Date Period Scheme Returns
(%)
Benchmark Returns
(%)#
Additional Benchmark
Returns (%) ##
Value of ` 10,000 invested
Scheme (`)
Benchmark (`)#
Additional Benchmark
(`)##
May 31, 18 Last 1 Year 7.49 10.68 7.86 10,749 11,068 10,786May 31, 16 Last 3 Years 7.13 7.95 6.79 12,295 12,579 12,180May 30, 14 Last 5 Years 7.95 8.98 7.31 14,665 15,377 14,238Aug 14, 13 Since Inception 8.62 9.40 7.54 16,147 16,833 15,244
# CRISIL Composite Bond Fund Index ## CRISIL 1 year T-Bill Index. The scheme is managed by Mr. Anil Bamboli since inception.
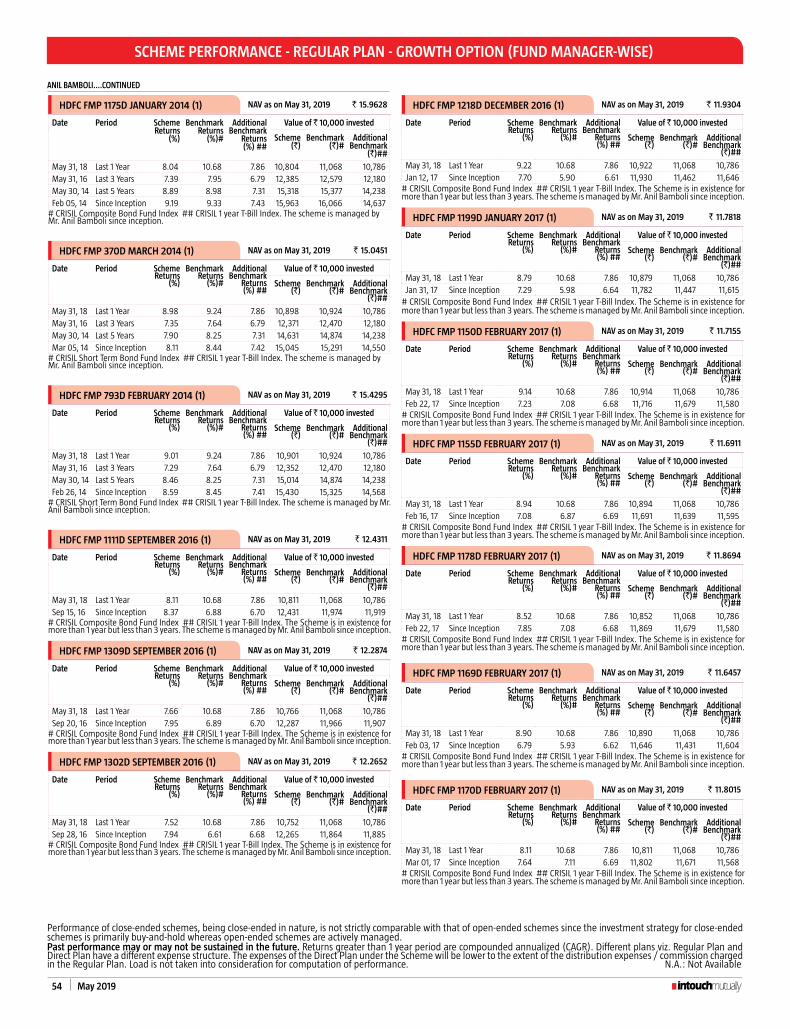
54 May 2019
SCHEME PERFORMANCE - REGULAR PLAN - GROWTH OPTION (FUND MANAGER-WISE)
Past performance may or may not be sustained in the future. Returns greater than 1 year period are compounded annualized (CAGR). Different plans viz. Regular Plan and Direct Plan have a different expense structure. The expenses of the Direct Plan under the Scheme will be lower to the extent of the distribution expenses / commission charged in the Regular Plan. Load is not taken into consideration for computation of performance. n.A.: not Available
Performance of close-ended schemes, being close-ended in nature, is not strictly comparable with that of open-ended schemes since the investment strategy for close-ended schemes is primarily buy-and-hold whereas open-ended schemes are actively managed.
HDFC FMP 1175D JANUARy 2014 (1) NAV as on May 31, 2019 ` 15.9628
Date Period Scheme Returns
(%)
Benchmark Returns
(%)#
Additional Benchmark
Returns (%) ##
Value of ` 10,000 invested
Scheme (`)
Benchmark (`)#
Additional Benchmark
(`)##
May 31, 18 Last 1 Year 8.04 10.68 7.86 10,804 11,068 10,786May 31, 16 Last 3 Years 7.39 7.95 6.79 12,385 12,579 12,180May 30, 14 Last 5 Years 8.89 8.98 7.31 15,318 15,377 14,238Feb 05, 14 Since Inception 9.19 9.33 7.43 15,963 16,066 14,637
# CRISIL Composite Bond Fund Index ## CRISIL 1 year T-Bill Index. The scheme is managed by Mr. Anil Bamboli since inception.
HDFC FMP 370D MARCH 2014 (1) NAV as on May 31, 2019 ` 15.0451
Date Period Scheme Returns
(%)
Benchmark Returns
(%)#
Additional Benchmark
Returns (%) ##
Value of ` 10,000 invested
Scheme (`)
Benchmark (`)#
Additional Benchmark
(`)##
May 31, 18 Last 1 Year 8.98 9.24 7.86 10,898 10,924 10,786May 31, 16 Last 3 Years 7.35 7.64 6.79 12,371 12,470 12,180May 30, 14 Last 5 Years 7.90 8.25 7.31 14,631 14,874 14,238Mar 05, 14 Since Inception 8.11 8.44 7.42 15,045 15,291 14,550
# CRISIL Short Term Bond Fund Index ## CRISIL 1 year T-Bill Index. The scheme is managed by Mr. Anil Bamboli since inception.
HDFC FMP 793D FEBRUARy 2014 (1) NAV as on May 31, 2019 ` 15.4295
Date Period Scheme Returns
(%)
Benchmark Returns
(%)#
Additional Benchmark
Returns (%) ##
Value of ` 10,000 invested
Scheme (`)
Benchmark (`)#
Additional Benchmark
(`)##
May 31, 18 Last 1 Year 9.01 9.24 7.86 10,901 10,924 10,786May 31, 16 Last 3 Years 7.29 7.64 6.79 12,352 12,470 12,180May 30, 14 Last 5 Years 8.46 8.25 7.31 15,014 14,874 14,238Feb 26, 14 Since Inception 8.59 8.45 7.41 15,430 15,325 14,568
# CRISIL Short Term Bond Fund Index ## CRISIL 1 year T-Bill Index. The scheme is managed by Mr. Anil Bamboli since inception.
HDFC FMP 1111D SEPTEMBER 2016 (1) NAV as on May 31, 2019 ` 12.4311
Date Period Scheme Returns
(%)
Benchmark Returns
(%)#
Additional Benchmark
Returns (%) ##
Value of ` 10,000 invested
Scheme (`)
Benchmark (`)#
Additional Benchmark
(`)##
May 31, 18 Last 1 Year 8.11 10.68 7.86 10,811 11,068 10,786Sep 15, 16 Since Inception 8.37 6.88 6.70 12,431 11,974 11,919
# CRISIL Composite Bond Fund Index ## CRISIL 1 year T-Bill Index. The Scheme is in existence for more than 1 year but less than 3 years. The scheme is managed by Mr. Anil Bamboli since inception.
HDFC FMP 1309D SEPTEMBER 2016 (1) NAV as on May 31, 2019 ` 12.2874
Date Period Scheme Returns
(%)
Benchmark Returns
(%)#
Additional Benchmark
Returns (%) ##
Value of ` 10,000 invested
Scheme (`)
Benchmark (`)#
Additional Benchmark
(`)##
May 31, 18 Last 1 Year 7.66 10.68 7.86 10,766 11,068 10,786Sep 20, 16 Since Inception 7.95 6.89 6.70 12,287 11,966 11,907
# CRISIL Composite Bond Fund Index ## CRISIL 1 year T-Bill Index. The Scheme is in existence for more than 1 year but less than 3 years. The scheme is managed by Mr. Anil Bamboli since inception.
HDFC FMP 1302D SEPTEMBER 2016 (1) NAV as on May 31, 2019 ` 12.2652
Date Period Scheme Returns
(%)
Benchmark Returns
(%)#
Additional Benchmark
Returns (%) ##
Value of ` 10,000 invested
Scheme (`)
Benchmark (`)#
Additional Benchmark
(`)##
May 31, 18 Last 1 Year 7.52 10.68 7.86 10,752 11,068 10,786Sep 28, 16 Since Inception 7.94 6.61 6.68 12,265 11,864 11,885
# CRISIL Composite Bond Fund Index ## CRISIL 1 year T-Bill Index. The Scheme is in existence for more than 1 year but less than 3 years. The scheme is managed by Mr. Anil Bamboli since inception.
HDFC FMP 1218D DECEMBER 2016 (1) NAV as on May 31, 2019 ` 11.9304
Date Period Scheme Returns
(%)
Benchmark Returns
(%)#
Additional Benchmark
Returns (%) ##
Value of ` 10,000 invested
Scheme (`)
Benchmark (`)#
Additional Benchmark
(`)##
May 31, 18 Last 1 Year 9.22 10.68 7.86 10,922 11,068 10,786Jan 12, 17 Since Inception 7.70 5.90 6.61 11,930 11,462 11,646
# CRISIL Composite Bond Fund Index ## CRISIL 1 year T-Bill Index. The Scheme is in existence for more than 1 year but less than 3 years. The scheme is managed by Mr. Anil Bamboli since inception.
HDFC FMP 1199D JANUARy 2017 (1) NAV as on May 31, 2019 ` 11.7818
Date Period Scheme Returns
(%)
Benchmark Returns
(%)#
Additional Benchmark
Returns (%) ##
Value of ` 10,000 invested
Scheme (`)
Benchmark (`)#
Additional Benchmark
(`)##
May 31, 18 Last 1 Year 8.79 10.68 7.86 10,879 11,068 10,786Jan 31, 17 Since Inception 7.29 5.98 6.64 11,782 11,447 11,615
# CRISIL Composite Bond Fund Index ## CRISIL 1 year T-Bill Index. The Scheme is in existence for more than 1 year but less than 3 years. The scheme is managed by Mr. Anil Bamboli since inception.
HDFC FMP 1150D FEBRUARy 2017 (1) NAV as on May 31, 2019 ` 11.7155
Date Period Scheme Returns
(%)
Benchmark Returns
(%)#
Additional Benchmark
Returns (%) ##
Value of ` 10,000 invested
Scheme (`)
Benchmark (`)#
Additional Benchmark
(`)##
May 31, 18 Last 1 Year 9.14 10.68 7.86 10,914 11,068 10,786Feb 22, 17 Since Inception 7.23 7.08 6.68 11,716 11,679 11,580
# CRISIL Composite Bond Fund Index ## CRISIL 1 year T-Bill Index. The Scheme is in existence for more than 1 year but less than 3 years. The scheme is managed by Mr. Anil Bamboli since inception.
HDFC FMP 1155D FEBRUARy 2017 (1) NAV as on May 31, 2019 ` 11.6911
Date Period Scheme Returns
(%)
Benchmark Returns
(%)#
Additional Benchmark
Returns (%) ##
Value of ` 10,000 invested
Scheme (`)
Benchmark (`)#
Additional Benchmark
(`)##
May 31, 18 Last 1 Year 8.94 10.68 7.86 10,894 11,068 10,786Feb 16, 17 Since Inception 7.08 6.87 6.69 11,691 11,639 11,595
# CRISIL Composite Bond Fund Index ## CRISIL 1 year T-Bill Index. The Scheme is in existence for more than 1 year but less than 3 years. The scheme is managed by Mr. Anil Bamboli since inception.
HDFC FMP 1178D FEBRUARy 2017 (1) NAV as on May 31, 2019 ` 11.8694
Date Period Scheme Returns
(%)
Benchmark Returns
(%)#
Additional Benchmark
Returns (%) ##
Value of ` 10,000 invested
Scheme (`)
Benchmark (`)#
Additional Benchmark
(`)##
May 31, 18 Last 1 Year 8.52 10.68 7.86 10,852 11,068 10,786Feb 22, 17 Since Inception 7.85 7.08 6.68 11,869 11,679 11,580
# CRISIL Composite Bond Fund Index ## CRISIL 1 year T-Bill Index. The Scheme is in existence for more than 1 year but less than 3 years. The scheme is managed by Mr. Anil Bamboli since inception.
HDFC FMP 1169D FEBRUARy 2017 (1) NAV as on May 31, 2019 ` 11.6457
Date Period Scheme Returns
(%)
Benchmark Returns
(%)#
Additional Benchmark
Returns (%) ##
Value of ` 10,000 invested
Scheme (`)
Benchmark (`)#
Additional Benchmark
(`)##
May 31, 18 Last 1 Year 8.90 10.68 7.86 10,890 11,068 10,786Feb 03, 17 Since Inception 6.79 5.93 6.62 11,646 11,431 11,604
# CRISIL Composite Bond Fund Index ## CRISIL 1 year T-Bill Index. The Scheme is in existence for more than 1 year but less than 3 years. The scheme is managed by Mr. Anil Bamboli since inception.
HDFC FMP 1170D FEBRUARy 2017 (1) NAV as on May 31, 2019 ` 11.8015
Date Period Scheme Returns
(%)
Benchmark Returns
(%)#
Additional Benchmark
Returns (%) ##
Value of ` 10,000 invested
Scheme (`)
Benchmark (`)#
Additional Benchmark
(`)##
May 31, 18 Last 1 Year 8.11 10.68 7.86 10,811 11,068 10,786Mar 01, 17 Since Inception 7.64 7.11 6.69 11,802 11,671 11,568
# CRISIL Composite Bond Fund Index ## CRISIL 1 year T-Bill Index. The Scheme is in existence for more than 1 year but less than 3 years. The scheme is managed by Mr. Anil Bamboli since inception.
ANIL BAMBOLI....CONTINUED
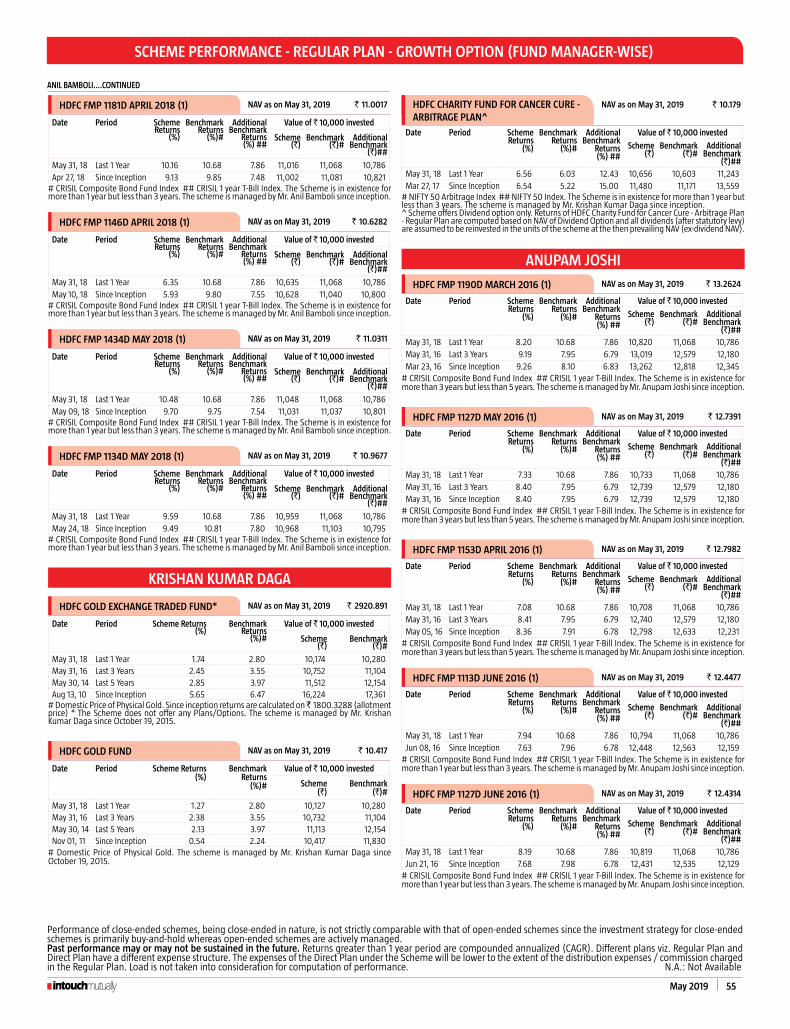
May 2019 55
SCHEME PERFORMANCE - REGULAR PLAN - GROWTH OPTION (FUND MANAGER-WISE)
ANIL BAMBOLI....CONTINUED
Past performance may or may not be sustained in the future. Returns greater than 1 year period are compounded annualized (CAGR). Different plans viz. Regular Plan and Direct Plan have a different expense structure. The expenses of the Direct Plan under the Scheme will be lower to the extent of the distribution expenses / commission charged in the Regular Plan. Load is not taken into consideration for computation of performance. n.A.: not Available
Performance of close-ended schemes, being close-ended in nature, is not strictly comparable with that of open-ended schemes since the investment strategy for close-ended schemes is primarily buy-and-hold whereas open-ended schemes are actively managed.
HDFC FMP 1181D APRIL 2018 (1) NAV as on May 31, 2019 ` 11.0017
Date Period Scheme Returns
(%)
Benchmark Returns
(%)#
Additional Benchmark
Returns (%) ##
Value of ` 10,000 invested
Scheme (`)
Benchmark (`)#
Additional Benchmark
(`)##
May 31, 18 Last 1 Year 10.16 10.68 7.86 11,016 11,068 10,786Apr 27, 18 Since Inception 9.13 9.85 7.48 11,002 11,081 10,821
# CRISIL Composite Bond Fund Index ## CRISIL 1 year T-Bill Index. The Scheme is in existence for more than 1 year but less than 3 years. The scheme is managed by Mr. Anil Bamboli since inception.
HDFC FMP 1146D APRIL 2018 (1) NAV as on May 31, 2019 ` 10.6282
Date Period Scheme Returns
(%)
Benchmark Returns
(%)#
Additional Benchmark
Returns (%) ##
Value of ` 10,000 invested
Scheme (`)
Benchmark (`)#
Additional Benchmark
(`)##
May 31, 18 Last 1 Year 6.35 10.68 7.86 10,635 11,068 10,786May 10, 18 Since Inception 5.93 9.80 7.55 10,628 11,040 10,800
# CRISIL Composite Bond Fund Index ## CRISIL 1 year T-Bill Index. The Scheme is in existence for more than 1 year but less than 3 years. The scheme is managed by Mr. Anil Bamboli since inception.
HDFC FMP 1434D MAy 2018 (1) NAV as on May 31, 2019 ` 11.0311
Date Period Scheme Returns
(%)
Benchmark Returns
(%)#
Additional Benchmark
Returns (%) ##
Value of ` 10,000 invested
Scheme (`)
Benchmark (`)#
Additional Benchmark
(`)##
May 31, 18 Last 1 Year 10.48 10.68 7.86 11,048 11,068 10,786May 09, 18 Since Inception 9.70 9.75 7.54 11,031 11,037 10,801
# CRISIL Composite Bond Fund Index ## CRISIL 1 year T-Bill Index. The Scheme is in existence for more than 1 year but less than 3 years. The scheme is managed by Mr. Anil Bamboli since inception.
HDFC FMP 1134D MAy 2018 (1) NAV as on May 31, 2019 ` 10.9677
Date Period Scheme Returns
(%)
Benchmark Returns
(%)#
Additional Benchmark
Returns (%) ##
Value of ` 10,000 invested
Scheme (`)
Benchmark (`)#
Additional Benchmark
(`)##
May 31, 18 Last 1 Year 9.59 10.68 7.86 10,959 11,068 10,786May 24, 18 Since Inception 9.49 10.81 7.80 10,968 11,103 10,795
# CRISIL Composite Bond Fund Index ## CRISIL 1 year T-Bill Index. The Scheme is in existence for more than 1 year but less than 3 years. The scheme is managed by Mr. Anil Bamboli since inception.
KRISHAN KUMAR DAGA
HDFC GOLD EXCHANGE TRADED FUND* NAV as on May 31, 2019 ` 2920.891
Date Period Scheme Returns (%)
Benchmark Returns
(%)#
Value of ` 10,000 invested
Scheme (`)
Benchmark (`)#
May 31, 18 Last 1 Year 1.74 2.80 10,174 10,280May 31, 16 Last 3 Years 2.45 3.55 10,752 11,104May 30, 14 Last 5 Years 2.85 3.97 11,512 12,154Aug 13, 10 Since Inception 5.65 6.47 16,224 17,361
# Domestic Price of Physical Gold. Since inception returns are calculated on ̀ 1800.3288 (allotment price) * The Scheme does not offer any Plans/Options. The scheme is managed by Mr. Krishan Kumar Daga since October 19, 2015.
HDFC GOLD FUND NAV as on May 31, 2019 ` 10.417
Date Period Scheme Returns (%)
Benchmark Returns
(%)#
Value of ` 10,000 invested
Scheme (`)
Benchmark (`)#
May 31, 18 Last 1 Year 1.27 2.80 10,127 10,280May 31, 16 Last 3 Years 2.38 3.55 10,732 11,104May 30, 14 Last 5 Years 2.13 3.97 11,113 12,154nov 01, 11 Since Inception 0.54 2.24 10,417 11,830
# Domestic Price of Physical Gold. The scheme is managed by Mr. Krishan Kumar Daga since October 19, 2015.
HDFC CHARITy FUND FOR CANCER CURE - ARBITRAGE PLAN^
NAV as on May 31, 2019 ` 10.179
Date Period Scheme Returns
(%)
Benchmark Returns
(%)#
Additional Benchmark
Returns (%) ##
Value of ` 10,000 invested
Scheme (`)
Benchmark (`)#
Additional Benchmark
(`)##May 31, 18 Last 1 Year 6.56 6.03 12.43 10,656 10,603 11,243Mar 27, 17 Since Inception 6.54 5.22 15.00 11,480 11,171 13,559
# nIFTY 50 Arbitrage Index ## nIFTY 50 Index. The Scheme is in existence for more than 1 year but less than 3 years. The scheme is managed by Mr. Krishan Kumar Daga since inception. ^ Scheme offers Dividend option only. Returns of HDFC Charity Fund for Cancer Cure - Arbitrage Plan - Regular Plan are computed based on nAV of Dividend Option and all dividends (after statutory levy) are assumed to be reinvested in the units of the scheme at the then prevailing nAV (ex-dividend nAV).
ANUPAM JOSHI
HDFC FMP 1190D MARCH 2016 (1) NAV as on May 31, 2019 ` 13.2624
Date Period Scheme Returns
(%)
Benchmark Returns
(%)#
Additional Benchmark
Returns (%) ##
Value of ` 10,000 invested
Scheme (`)
Benchmark (`)#
Additional Benchmark
(`)##May 31, 18 Last 1 Year 8.20 10.68 7.86 10,820 11,068 10,786May 31, 16 Last 3 Years 9.19 7.95 6.79 13,019 12,579 12,180Mar 23, 16 Since Inception 9.26 8.10 6.83 13,262 12,818 12,345
# CRISIL Composite Bond Fund Index ## CRISIL 1 year T-Bill Index. The Scheme is in existence for more than 3 years but less than 5 years. The scheme is managed by Mr. Anupam Joshi since inception.
HDFC FMP 1127D MAy 2016 (1) NAV as on May 31, 2019 ` 12.7391
Date Period Scheme Returns
(%)
Benchmark Returns
(%)#
Additional Benchmark
Returns (%) ##
Value of ` 10,000 invested
Scheme (`)
Benchmark (`)#
Additional Benchmark
(`)##May 31, 18 Last 1 Year 7.33 10.68 7.86 10,733 11,068 10,786May 31, 16 Last 3 Years 8.40 7.95 6.79 12,739 12,579 12,180May 31, 16 Since Inception 8.40 7.95 6.79 12,739 12,579 12,180
# CRISIL Composite Bond Fund Index ## CRISIL 1 year T-Bill Index. The Scheme is in existence for more than 3 years but less than 5 years. The scheme is managed by Mr. Anupam Joshi since inception.
HDFC FMP 1153D APRIL 2016 (1) NAV as on May 31, 2019 ` 12.7982
Date Period Scheme Returns
(%)
Benchmark Returns
(%)#
Additional Benchmark
Returns (%) ##
Value of ` 10,000 invested
Scheme (`)
Benchmark (`)#
Additional Benchmark
(`)##May 31, 18 Last 1 Year 7.08 10.68 7.86 10,708 11,068 10,786May 31, 16 Last 3 Years 8.41 7.95 6.79 12,740 12,579 12,180May 05, 16 Since Inception 8.36 7.91 6.78 12,798 12,633 12,231
# CRISIL Composite Bond Fund Index ## CRISIL 1 year T-Bill Index. The Scheme is in existence for more than 3 years but less than 5 years. The scheme is managed by Mr. Anupam Joshi since inception.
HDFC FMP 1113D JUNE 2016 (1) NAV as on May 31, 2019 ` 12.4477
Date Period Scheme Returns
(%)
Benchmark Returns
(%)#
Additional Benchmark
Returns (%) ##
Value of ` 10,000 invested
Scheme (`)
Benchmark (`)#
Additional Benchmark
(`)##May 31, 18 Last 1 Year 7.94 10.68 7.86 10,794 11,068 10,786Jun 08, 16 Since Inception 7.63 7.96 6.78 12,448 12,563 12,159
# CRISIL Composite Bond Fund Index ## CRISIL 1 year T-Bill Index. The Scheme is in existence for more than 1 year but less than 3 years. The scheme is managed by Mr. Anupam Joshi since inception.
HDFC FMP 1127D JUNE 2016 (1) NAV as on May 31, 2019 ` 12.4314
Date Period Scheme Returns
(%)
Benchmark Returns
(%)#
Additional Benchmark
Returns (%) ##
Value of ` 10,000 invested
Scheme (`)
Benchmark (`)#
Additional Benchmark
(`)##May 31, 18 Last 1 Year 8.19 10.68 7.86 10,819 11,068 10,786Jun 21, 16 Since Inception 7.68 7.98 6.78 12,431 12,535 12,129
# CRISIL Composite Bond Fund Index ## CRISIL 1 year T-Bill Index. The Scheme is in existence for more than 1 year but less than 3 years. The scheme is managed by Mr. Anupam Joshi since inception.

56 May 2019
SCHEME PERFORMANCE - REGULAR PLAN - GROWTH OPTION (FUND MANAGER-WISE)
Past performance may or may not be sustained in the future. Returns greater than 1 year period are compounded annualized (CAGR). Different plans viz. Regular Plan and Direct Plan have a different expense structure. The expenses of the Direct Plan under the Scheme will be lower to the extent of the distribution expenses / commission charged in the Regular Plan. Load is not taken into consideration for computation of performance. n.A.: not Available
Performance of close-ended schemes, being close-ended in nature, is not strictly comparable with that of open-ended schemes since the investment strategy for close-ended schemes is primarily buy-and-hold whereas open-ended schemes are actively managed.
ANUPAM JOSHI....CONTINUED
HDFC FMP 1128D JUNE 2016 (1) NAV as on May 31, 2019 ` 12.7009
Date Period Scheme Returns
(%)
Benchmark Returns
(%)#
Additional Benchmark
Returns (%) ##
Value of ` 10,000 invested
Scheme (`)
Benchmark (`)#
Additional Benchmark
(`)##May 31, 18 Last 1 Year 7.71 10.68 7.86 10,771 11,068 10,786Jun 29, 16 Since Inception 8.53 7.86 6.77 12,701 12,472 12,108
# CRISIL Composite Bond Fund Index ## CRISIL 1 year T-Bill Index. The Scheme is in existence for more than 1 year but less than 3 years. The scheme is managed by Mr. Anupam Joshi since inception.
HDFC FMP 1112D JUNE 2016 (1) NAV as on May 31, 2019 ` 12.3372
Date Period Scheme Returns
(%)
Benchmark Returns
(%)#
Additional Benchmark
Returns (%) ##
Value of ` 10,000 invested
Scheme (`)
Benchmark (`)#
Additional Benchmark
(`)##May 31, 18 Last 1 Year 7.81 10.68 7.86 10,781 11,068 10,786Jul 07, 16 Since Inception 7.51 7.70 6.75 12,337 12,399 12,085
# CRISIL Composite Bond Fund Index ## CRISIL 1 year T-Bill Index. The Scheme is in existence for more than 1 year but less than 3 years. The scheme is managed by Mr. Anupam Joshi since inception.
HDFC FMP 1161D JULy 2016 (1) NAV as on May 31, 2019 ` 12.5917
Date Period Scheme Returns
(%)
Benchmark Returns
(%)#
Additional Benchmark
Returns (%) ##
Value of ` 10,000 invested
Scheme (`)
Benchmark (`)#
Additional Benchmark
(`)##May 31, 18 Last 1 Year 8.48 10.68 7.86 10,848 11,068 10,786Jul 27, 16 Since Inception 8.44 7.36 6.72 12,592 12,238 12,033
# CRISIL Composite Bond Fund Index ## CRISIL 1 year T-Bill Index. The Scheme is in existence for more than 1 year but less than 3 years. The scheme is managed by Mr. Anupam Joshi since inception.
HDFC FMP 1158D FEBRUARy 2018 (1) NAV as on May 31, 2019 ` 11.0379
Date Period Scheme Returns
(%)
Benchmark Returns
(%)#
Additional Benchmark
Returns (%) ##
Value of ` 10,000 invested
Scheme (`)
Benchmark (`)#
Additional Benchmark
(`)##
May 31, 18 Last 1 Year 9.79 10.68 7.86 10,979 11,068 10,786Feb 27, 18 Since Inception 8.19 9.11 7.49 11,038 11,156 10,948
# CRISIL Composite Bond Fund Index ## CRISIL 1 year T-Bill Index. The Scheme is in existence for more than 1 year but less than 3 years. The scheme is managed by Mr. Anupam Joshi since inception.
HDFC FMP 1150D MARCH 2018 (1) NAV as on May 31, 2019 ` 10.9918
Date Period Scheme Returns
(%)
Benchmark Returns
(%)#
Additional Benchmark
Returns (%) ##
Value of ` 10,000 invested
Scheme (`)
Benchmark (`)#
Additional Benchmark
(`)##
May 31, 18 Last 1 Year 9.64 10.68 7.86 10,964 11,068 10,786Mar 07, 18 Since Inception 7.97 9.15 7.51 10,992 11,140 10,934
# CRISIL Composite Bond Fund Index ## CRISIL 1 year T-Bill Index. The Scheme is in existence for more than 1 year but less than 3 years. The scheme is managed by Mr. Anupam Joshi since inception.
HDFC FMP 1208D MARCH 2018 (1) NAV as on May 31, 2019 ` 10.7592
Date Period Scheme Returns
(%)
Benchmark Returns
(%)#
Additional Benchmark
Returns (%) ##
Value of ` 10,000 invested
Scheme (`)
Benchmark (`)#
Additional Benchmark
(`)##
May 31, 18 Last 1 Year 7.45 10.68 7.86 10,745 11,068 10,786Mar 16, 18 Since Inception 6.24 8.68 7.43 10,759 11,058 10,904
# CRISIL Composite Bond Fund Index ## CRISIL 1 year T-Bill Index. The Scheme is in existence for more than 1 year but less than 3 years. The scheme is managed by Mr. Anupam Joshi since inception.
HDFC FMP 1143D MARCH 2018 (1) NAV as on May 31, 2019 ` 10.9531
Date Period Scheme Returns
(%)
Benchmark Returns
(%)#
Additional Benchmark
Returns (%) ##
Value of ` 10,000 invested
Scheme (`)
Benchmark (`)#
Additional Benchmark
(`)##
May 31, 18 Last 1 Year 9.72 10.68 7.86 10,972 11,068 10,786Mar 13, 18 Since Inception 7.77 9.01 7.45 10,953 11,106 10,914
# CRISIL Composite Bond Fund Index ## CRISIL 1 year T-Bill Index. The Scheme is in existence for more than 1 year but less than 3 years. The scheme is managed by Mr. Anupam Joshi since inception.
HDFC FMP 1147D MARCH 2018 (1) NAV as on May 31, 2019 ` 10.9196
Date Period Scheme Returns
(%)
Benchmark Returns
(%)#
Additional Benchmark
Returns (%) ##
Value of ` 10,000 invested
Scheme (`)
Benchmark (`)#
Additional Benchmark
(`)##
May 31, 18 Last 1 Year 9.73 10.68 7.86 10,973 11,068 10,786Mar 22, 18 Since Inception 7.66 8.73 7.44 10,920 11,048 10,893
# CRISIL Composite Bond Fund Index ## CRISIL 1 year T-Bill Index. The Scheme is in existence for more than 1 year but less than 3 years. The scheme is managed by Mr. Anupam Joshi since inception.
HDFC FMP 1145D MARCH 2018 (1) NAV as on May 31, 2019 ` 10.9137
Date Period Scheme Returns
(%)
Benchmark Returns
(%)#
Additional Benchmark
Returns (%) ##
Value of ` 10,000 invested
Scheme (`)
Benchmark (`)#
Additional Benchmark
(`)##
May 31, 18 Last 1 Year 9.73 10.68 7.86 10,973 11,068 10,786Mar 23, 18 Since Inception 7.63 8.66 7.44 10,914 11,038 10,891
# CRISIL Composite Bond Fund Index ## CRISIL 1 year T-Bill Index. The Scheme is in existence for more than 1 year but less than 3 years. The scheme is managed by Mr. Anupam Joshi since inception.
HDFC FMP 1177D MARCH 2018 (1) NAV as on May 31, 2019 ` 10.8053
Date Period Scheme Returns
(%)
Benchmark Returns
(%)#
Additional Benchmark
Returns (%) ##
Value of ` 10,000 invested
Scheme (`)
Benchmark (`)#
Additional Benchmark
(`)##
May 31, 18 Last 1 Year 8.42 10.68 7.86 10,842 11,068 10,786Mar 28, 18 Since Inception 6.81 7.95 7.32 10,805 10,941 10,865
# CRISIL Composite Bond Fund Index ## CRISIL 1 year T-Bill Index. The Scheme is in existence for more than 1 year but less than 3 years. The scheme is managed by Mr. Anupam Joshi since inception.
HDFC FMP 1183D APRIL 2018 (1) NAV as on May 31, 2019 ` 10.8598
Date Period Scheme Returns
(%)
Benchmark Returns
(%)#
Additional Benchmark
Returns (%) ##
Value of ` 10,000 invested
Scheme (`)
Benchmark (`)#
Additional Benchmark
(`)##
May 31, 18 Last 1 Year 9.90 10.68 7.86 10,990 11,068 10,786Apr 17, 18 Since Inception 7.64 8.37 7.38 10,860 10,942 10,831
# CRISIL Composite Bond Fund Index ## CRISIL 1 year T-Bill Index. The Scheme is in existence for more than 1 year but less than 3 years. The scheme is managed by Mr. Anupam Joshi since inception.
SRINIVAS RAO RAVURI
HDFC EOF - II - 1126D MAy 2017 (1) NAV as on May 31, 2019 ` 10.9480
Date Period Scheme Returns
(%)
Benchmark Returns
(%)#
Additional Benchmark
Returns (%) ##
Value of ` 10,000 invested
Scheme (`)
Benchmark (`)#
Additional Benchmark
(`)##
May 31, 18 Last 1 Year 9.11 12.43 13.70 10,911 11,243 11,370Jun 15, 17 Since Inception 4.73 13.27 14.67 10,948 12,764 13,075
# nIFTY 50 (Total Returns Index) ## S&P BSE SEnSEx (Total Returns Index). The Scheme is in existence for more than 1 year but less than 3 years. The scheme is managed by Mr. Srinivas Rao Ravuri since inception.
HDFC EOF - II - 1100D JUNE 2017 (1) NAV as on May 31, 2019 ` 10.5600
Date Period Scheme Returns
(%)
Benchmark Returns
(%)#
Additional Benchmark
Returns (%) ##
Value of ` 10,000 invested
Scheme (`)
Benchmark (`)#
Additional Benchmark
(`)##
May 31, 18 Last 1 Year 7.74 12.43 13.70 10,774 11,243 11,370Jul 17, 17 Since Inception 2.95 11.64 13.24 10,560 12,289 12,619
# nIFTY 50 (Total Returns Index) ## S&P BSE SEnSEx (Total Returns Index). The Scheme is in existence for more than 1 year but less than 3 years. The scheme is managed by Mr. Srinivas Rao Ravuri since inception.
HDFC HOF - I - 1140D NOVEMBER 2017 (1) NAV as on May 31, 2019 ` 9.8810
Date Period Scheme Returns
(%)
Benchmark Returns
(%)#
Additional Benchmark
Returns (%) ##
Value of ` 10,000 invested
Scheme (`)
Benchmark (`)#
Additional Benchmark
(`)##
May 31, 18 Last 1 Year 4.14 7.46 12.43 10,414 10,746 11,243Dec 06, 17 Since Inception -0.80 8.18 13.66 9,881 11,235 12,089
# India Housing & Allied Businesses Index ## nIFTY 50 (Total Returns Index). The Scheme is in existence for more than 1 year but less than 3 years. The scheme is managed by Mr. Srinivas Rao Ravuri since inception.

May 2019 57
SCHEME PERFORMANCE - REGULAR PLAN - GROWTH OPTION (FUND MANAGER-WISE)
Past performance may or may not be sustained in the future. Returns greater than 1 year period are compounded annualized (CAGR). Different plans viz. Regular Plan and Direct Plan have a different expense structure. The expenses of the Direct Plan under the Scheme will be lower to the extent of the distribution expenses / commission charged in the Regular Plan. Load is not taken into consideration for computation of performance. n.A.: not Available
Performance of close-ended Scheme is not strictly comparable with that of open-ended schemes since the investment strategy for close-ended schemes is primarily buy and hold whereas open ended schemes are actively managed.
CO-MANAGED By MITEN LATHIA & ANIL BAMBOLI
HDFC DyNAMIC PE RATIO FUND OF FUNDS NAV as on May 31, 2019 ` 19.0602
Date Period Scheme Returns
(%)
Benchmark Returns
(%)#
Additional Benchmark
Returns (%) ##
Value of ` 10,000 invested
Scheme (`)
Benchmark (`)#
Additional Benchmark
(`)##
May 31, 18 Last 1 Year 7.86 11.95 12.43 10,786 11,195 11,243May 31, 16 Last 3 Years 11.33 12.54 14.99 13,798 14,253 15,203May 30, 14 Last 5 Years 9.61 10.97 11.92 15,833 16,838 17,571Feb 06, 12 Since Inception 9.21 11.54 12.94 19,060 22,233 24,361
# nIFTY 50 Hybrid Composite Debt 65:35 Index ## nIFTY 50 (Total Returns Index). Scheme performance may not strictly be comparable with that of its Additional Benchmark in view of hybrid nature of the scheme where a portion of scheme’s investments are made in equity instruments. The scheme is co-managed by Mr. Miten Lathia & Mr. Anil Bamboli since June 28, 2014.
CO-MANAGED ByKRISHAN KUMAR DAGA & ANIL BAMBOLI
HDFC DAF - III - 1304D AUGUST 2016 NAV as on May 31, 2019 ` 11.7162
Date Period Scheme Returns
(%)
Benchmark Returns
(%)#
Additional Benchmark
Returns (%) ##
Value of ` 10,000 invested
Scheme (`)
Benchmark (`)#
Additional Benchmark
(`)##
May 31, 18 Last 1 Year 7.09 10.61 7.86 10,709 11,061 10,786Sep 12, 16 Since Inception 6.01 9.92 6.69 11,716 12,929 11,922
# nIFTY 50 Hybrid Short Duration Debt 40:60 Index ## CRISIL 1 year T-Bill Index. The Scheme is in existence for more than 1 year but less than 3 years. The scheme is co-managed by Mr. Krishan Kumar Daga & Anil Bamboli since inception.
HDFC DAF - III - 1267D OCTOBER 2016 NAV as on May 31, 2019 ` 11.5358
Date Period Scheme Returns
(%)
Benchmark Returns
(%)#
Additional Benchmark
Returns (%) ##
Value of ` 10,000 invested
Scheme (`)
Benchmark (`)#
Additional Benchmark
(`)##
May 31, 18 Last 1 Year 7.13 10.61 7.86 10,713 11,061 10,786Oct 25, 16 Since Inception 5.65 10.17 6.63 11,536 12,862 11,814
# nIFTY 50 Hybrid Short Duration Debt 40:60 Index ## CRISIL 1 year T-Bill Index. The Scheme is in existence for more than 1 year but less than 3 years. The scheme is co-managed by Mr. Krishan Kumar Daga & Anil Bamboli since inception.
HDFC DAF - III - 1224D NOVEMBER 2016 NAV as on May 31, 2019 ` 11.4590
Date Period Scheme Returns
(%)
Benchmark Returns
(%)#
Additional Benchmark
Returns (%) ##
Value of ` 10,000 invested
Scheme (`)
Benchmark (`)#
Additional Benchmark
(`)##
May 31, 18 Last 1 Year 7.11 10.06 7.86 10,711 11,006 10,786Dec 07, 16 Since Inception 5.65 9.76 6.61 11,459 12,596 11,721
# nIFTY 50 Hybrid Short Duration Debt 25:75 Index ## CRISIL 1 year T-Bill Index. The Scheme is in existence for more than 1 year but less than 3 years. The scheme is co-managed by Mr. Krishan Kumar Daga & Mr. Anil Bamboli since inception.
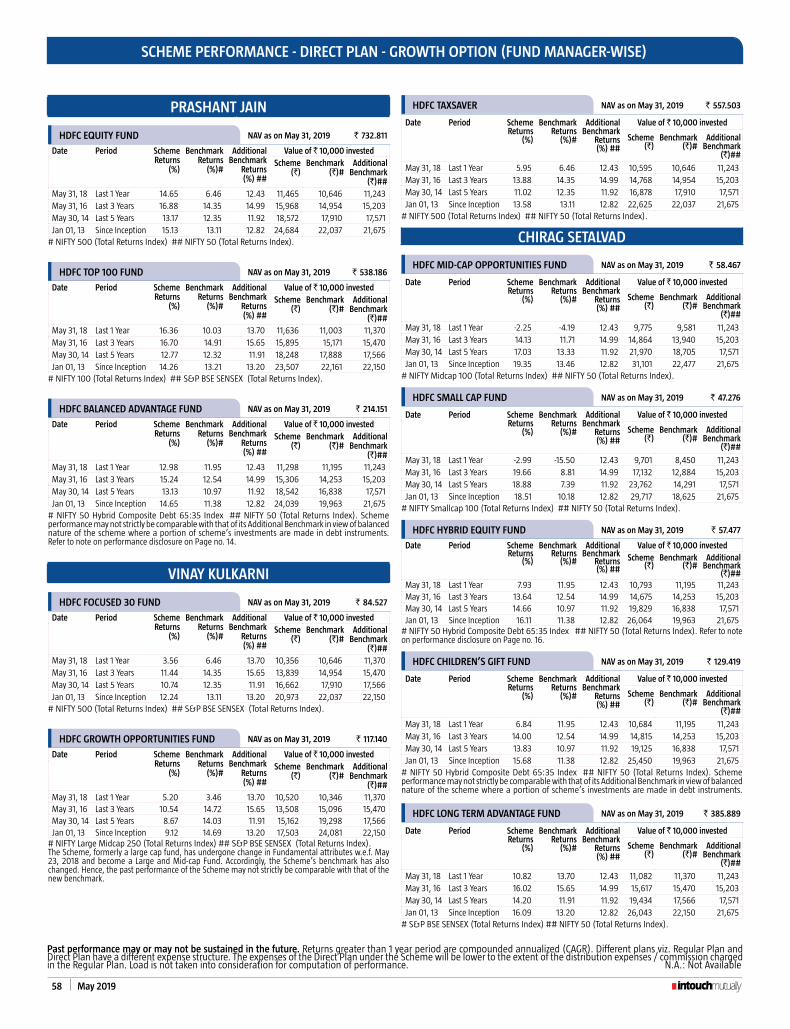
58 May 2019
SCHEME PERFORMANCE - DIRECT PLAN - GROWTH OPTION (FUND MANAGER-WISE)
PRASHANT JAIN
HDFC EQUITy FUND NAV as on May 31, 2019 ` 732.811
Date Period Scheme Returns
(%)
Benchmark Returns
(%)#
Additional Benchmark
Returns (%) ##
Value of ` 10,000 invested Scheme
(`)Benchmark
(`)#Additional
Benchmark (`)##
May 31, 18 Last 1 Year 14.65 6.46 12.43 11,465 10,646 11,243May 31, 16 Last 3 Years 16.88 14.35 14.99 15,968 14,954 15,203May 30, 14 Last 5 Years 13.17 12.35 11.92 18,572 17,910 17,571Jan 01, 13 Since Inception 15.13 13.11 12.82 24,684 22,037 21,675
# nIFTY 500 (Total Returns Index) ## nIFTY 50 (Total Returns Index).
HDFC TOP 100 FUND NAV as on May 31, 2019 ` 538.186
Date Period Scheme Returns
(%)
Benchmark Returns
(%)#
Additional Benchmark
Returns (%) ##
Value of ` 10,000 invested Scheme
(`)Benchmark
(`)#Additional
Benchmark (`)##
May 31, 18 Last 1 Year 16.36 10.03 13.70 11,636 11,003 11,370May 31, 16 Last 3 Years 16.70 14.91 15.65 15,895 15,171 15,470May 30, 14 Last 5 Years 12.77 12.32 11.91 18,248 17,888 17,566Jan 01, 13 Since Inception 14.26 13.21 13.20 23,507 22,161 22,150
# nIFTY 100 (Total Returns Index) ## S&P BSE SEnSEx (Total Returns Index).
HDFC BALANCED ADVANTAGE FUND NAV as on May 31, 2019 ` 214.151
Date Period Scheme Returns
(%)
Benchmark Returns
(%)#
Additional Benchmark
Returns (%) ##
Value of ` 10,000 invested Scheme
(`)Benchmark
(`)#Additional
Benchmark (`)##
May 31, 18 Last 1 Year 12.98 11.95 12.43 11,298 11,195 11,243May 31, 16 Last 3 Years 15.24 12.54 14.99 15,306 14,253 15,203May 30, 14 Last 5 Years 13.13 10.97 11.92 18,542 16,838 17,571Jan 01, 13 Since Inception 14.65 11.38 12.82 24,039 19,963 21,675
# nIFTY 50 Hybrid Composite Debt 65:35 Index ## nIFTY 50 (Total Returns Index). Scheme performance may not strictly be comparable with that of its Additional Benchmark in view of balanced nature of the scheme where a portion of scheme’s investments are made in debt instruments. Refer to note on performance disclosure on Page no. 14.
VINAy KULKARNI
HDFC FOCUSED 30 FUND NAV as on May 31, 2019 ` 84.527
Date Period Scheme Returns
(%)
Benchmark Returns
(%)#
Additional Benchmark
Returns (%) ##
Value of ` 10,000 invested Scheme
(`)Benchmark
(`)#Additional
Benchmark (`)##
May 31, 18 Last 1 Year 3.56 6.46 13.70 10,356 10,646 11,370May 31, 16 Last 3 Years 11.44 14.35 15.65 13,839 14,954 15,470May 30, 14 Last 5 Years 10.74 12.35 11.91 16,662 17,910 17,566Jan 01, 13 Since Inception 12.24 13.11 13.20 20,973 22,037 22,150
# nIFTY 500 (Total Returns Index) ## S&P BSE SEnSEx (Total Returns Index).
HDFC GROWTH OPPORTUNITIES FUND NAV as on May 31, 2019 ` 117.140
Date Period Scheme Returns
(%)
Benchmark Returns
(%)#
Additional Benchmark
Returns (%) ##
Value of ` 10,000 invested Scheme
(`)Benchmark
(`)#Additional
Benchmark (`)##
May 31, 18 Last 1 Year 5.20 3.46 13.70 10,520 10,346 11,370May 31, 16 Last 3 Years 10.54 14.72 15.65 13,508 15,096 15,470May 30, 14 Last 5 Years 8.67 14.03 11.91 15,162 19,298 17,566Jan 01, 13 Since Inception 9.12 14.69 13.20 17,503 24,081 22,150
# nIFTY Large Midcap 250 (Total Returns Index) ## S&P BSE SEnSEx (Total Returns Index). The Scheme, formerly a large cap fund, has undergone change in Fundamental attributes w.e.f. May 23, 2018 and become a Large and Mid-cap Fund. Accordingly, the Scheme’s benchmark has also changed. Hence, the past performance of the Scheme may not strictly be comparable with that of the new benchmark.
HDFC TAXSAVER NAV as on May 31, 2019 ` 557.503
Date Period Scheme Returns
(%)
Benchmark Returns
(%)#
Additional Benchmark
Returns (%) ##
Value of ` 10,000 invested
Scheme (`)
Benchmark (`)#
Additional Benchmark
(`)##
May 31, 18 Last 1 Year 5.95 6.46 12.43 10,595 10,646 11,243May 31, 16 Last 3 Years 13.88 14.35 14.99 14,768 14,954 15,203May 30, 14 Last 5 Years 11.02 12.35 11.92 16,878 17,910 17,571Jan 01, 13 Since Inception 13.58 13.11 12.82 22,625 22,037 21,675
# nIFTY 500 (Total Returns Index) ## nIFTY 50 (Total Returns Index).
CHIRAG SETALVAD
HDFC MID-CAP OPPORTUNITIES FUND NAV as on May 31, 2019 ` 58.467
Date Period Scheme Returns
(%)
Benchmark Returns
(%)#
Additional Benchmark
Returns (%) ##
Value of ` 10,000 invested
Scheme (`)
Benchmark (`)#
Additional Benchmark
(`)##
May 31, 18 Last 1 Year -2.25 -4.19 12.43 9,775 9,581 11,243May 31, 16 Last 3 Years 14.13 11.71 14.99 14,864 13,940 15,203May 30, 14 Last 5 Years 17.03 13.33 11.92 21,970 18,705 17,571Jan 01, 13 Since Inception 19.35 13.46 12.82 31,101 22,477 21,675
# nIFTY Midcap 100 (Total Returns Index) ## nIFTY 50 (Total Returns Index).
HDFC SMALL CAP FUND NAV as on May 31, 2019 ` 47.276
Date Period Scheme Returns
(%)
Benchmark Returns
(%)#
Additional Benchmark
Returns (%) ##
Value of ` 10,000 invested
Scheme (`)
Benchmark (`)#
Additional Benchmark
(`)##
May 31, 18 Last 1 Year -2.99 -15.50 12.43 9,701 8,450 11,243May 31, 16 Last 3 Years 19.66 8.81 14.99 17,132 12,884 15,203May 30, 14 Last 5 Years 18.88 7.39 11.92 23,762 14,291 17,571Jan 01, 13 Since Inception 18.51 10.18 12.82 29,717 18,625 21,675
# nIFTY Smallcap 100 (Total Returns Index) ## nIFTY 50 (Total Returns Index).
HDFC HyBRID EQUITy FUND NAV as on May 31, 2019 ` 57.477
Date Period Scheme Returns
(%)
Benchmark Returns
(%)#
Additional Benchmark
Returns (%) ##
Value of ` 10,000 invested Scheme
(`)Benchmark
(`)#Additional
Benchmark (`)##
May 31, 18 Last 1 Year 7.93 11.95 12.43 10,793 11,195 11,243May 31, 16 Last 3 Years 13.64 12.54 14.99 14,675 14,253 15,203May 30, 14 Last 5 Years 14.66 10.97 11.92 19,829 16,838 17,571Jan 01, 13 Since Inception 16.11 11.38 12.82 26,064 19,963 21,675
# nIFTY 50 Hybrid Composite Debt 65:35 Index ## nIFTY 50 (Total Returns Index). Refer to note on performance disclosure on Page no. 16.
HDFC CHILDREN’S GIFT FUND NAV as on May 31, 2019 ` 129.419
Date Period Scheme Returns
(%)
Benchmark Returns
(%)#
Additional Benchmark
Returns (%) ##
Value of ` 10,000 invested
Scheme (`)
Benchmark (`)#
Additional Benchmark
(`)##
May 31, 18 Last 1 Year 6.84 11.95 12.43 10,684 11,195 11,243May 31, 16 Last 3 Years 14.00 12.54 14.99 14,815 14,253 15,203May 30, 14 Last 5 Years 13.83 10.97 11.92 19,125 16,838 17,571Jan 01, 13 Since Inception 15.68 11.38 12.82 25,450 19,963 21,675
# nIFTY 50 Hybrid Composite Debt 65:35 Index ## nIFTY 50 (Total Returns Index). Scheme performance may not strictly be comparable with that of its Additional Benchmark in view of balanced nature of the scheme where a portion of scheme’s investments are made in debt instruments.
HDFC LONG TERM ADVANTAGE FUND NAV as on May 31, 2019 ` 385.889
Date Period Scheme Returns
(%)
Benchmark Returns
(%)#
Additional Benchmark
Returns (%) ##
Value of ` 10,000 invested
Scheme (`)
Benchmark (`)#
Additional Benchmark
(`)##
May 31, 18 Last 1 Year 10.82 13.70 12.43 11,082 11,370 11,243May 31, 16 Last 3 Years 16.02 15.65 14.99 15,617 15,470 15,203May 30, 14 Last 5 Years 14.20 11.91 11.92 19,434 17,566 17,571Jan 01, 13 Since Inception 16.09 13.20 12.82 26,043 22,150 21,675
# S&P BSE SEnSEx (Total Returns Index) ## nIFTY 50 (Total Returns Index).
Past performance may or may not be sustained in the future. Returns greater than 1 year period are compounded annualized (CAGR). Different plans viz. Regular Plan and Direct Plan have a different expense structure. The expenses of the Direct Plan under the Scheme will be lower to the extent of the distribution expenses / commission charged in the Regular Plan. Load is not taken into consideration for computation of performance. n.A.: not Available

May 2019 59
SCHEME PERFORMANCE - DIRECT PLAN - GROWTH OPTION (FUND MANAGER-WISE)
SHOBHIT MEHROTRA
HDFC INCOME FUND NAV as on May 31, 2019 ` 42.9238
Date Period Scheme Returns
(%)
Benchmark Returns
(%)#
Additional Benchmark
Returns (%) ##
Value of ` 10,000 invested
Scheme (`)
Benchmark (`)#
Additional Benchmark
(`)##
May 31, 18 Last 1 Year 8.73 10.68 12.20 10,873 11,068 11,220May 31, 16 Last 3 Years 6.68 7.95 6.75 12,142 12,579 12,165May 30, 14 Last 5 Years 8.37 8.98 8.23 14,954 15,377 14,859Jan 01, 13 Since Inception 7.83 8.46 6.97 16,215 16,830 15,404
# CRISIL Composite Bond Fund Index ## CRISIL 10 year Gilt Index.
HDFC MEDIUM TERM DEBT FUND NAV as on May 31, 2019 ` 38.8814
Date Period Scheme Returns
(%)
Benchmark Returns
(%)#
Additional Benchmark
Returns (%) ##
Value of ` 10,000 invested
Scheme (`)
Benchmark (`)#
Additional Benchmark
(`)##
May 31, 18 Last 1 Year 9.31 9.24 7.86 10,931 10,924 10,786May 31, 16 Last 3 Years 8.35 7.64 6.79 12,721 12,470 12,180May 30, 14 Last 5 Years 8.76 8.25 7.31 15,223 14,874 14,238Jan 01, 13 Since Inception 8.77 8.42 7.17 17,144 16,791 15,587
# CRISIL Short Term Bond Fund Index ## CRISIL 1 year T-Bill Index.
HDFC FLOATING RATE DEBT FUND NAV as on May 31, 2019 ` 33.1707
Date Period Scheme Returns
(%)
Benchmark Returns
(%)#
Additional Benchmark
Returns (%) ##
Value of ` 10,000 invested
Scheme (`)
Benchmark (`)#
Additional Benchmark
(`)##
May 31, 18 Last 1 Year 8.56 7.73 7.86 10,856 10,773 10,786May 31, 16 Last 3 Years 7.83 7.19 6.79 12,536 12,316 12,180May 30, 14 Last 5 Years 8.30 7.65 7.31 14,904 14,465 14,238Jan 01, 13 Since Inception 8.52 8.00 7.17 16,898 16,384 15,587
# CRISIL Liquid Fund Index ## CRISIL 1 year T-Bill Index.
HDFC CREDIT RISK DEBT FUND NAV as on May 31, 2019 ` 16.1416
Date Period Scheme Returns
(%)
Benchmark Returns
(%)#
Additional Benchmark
Returns (%) ##
Value of ` 10,000 invested
Scheme (`)
Benchmark (`)#
Additional Benchmark
(`)##
May 31, 18 Last 1 Year 8.55 9.24 12.20 10,855 10,924 11,220May 31, 16 Last 3 Years 8.34 7.64 6.75 12,717 12,470 12,165May 30, 14 Last 5 Years 9.49 8.25 8.23 15,742 14,874 14,859Mar 25, 14 Since Inception 9.67 8.36 8.44 16,142 15,168 15,224
# CRISIL Short Term Bond Fund Index ## CRISIL 10 year Gilt Index. Refer to note on performance disclosure on Page no. 38.
HDFC FMP 3360D MARCH 2014 (1) NAV as on May 31, 2019 ` 14.4089
Date Period Scheme Returns
(%)
Benchmark Returns
(%)#
Additional Benchmark
Returns (%) ##
Value of ` 10,000 invested
Scheme (`)
Benchmark (`)#
Additional Benchmark
(`)##
May 31, 18 Last 1 Year 11.08 10.68 12.20 11,108 11,068 11,220May 31, 16 Last 3 Years 8.37 7.95 6.75 12,727 12,579 12,165May 30, 14 Last 5 Years 7.77 8.98 8.23 14,543 15,377 14,859Mar 26, 14 Since Inception 7.30 9.31 8.43 14,409 15,861 15,215
# CRISIL Composite Bond Fund Index ## CRISIL 10 year Gilt Index. The scheme is managed by Mr. Shobhit Mehrotra since inception.
HDFC FMP 1168D FEBRUARy 2016 (1) NAV as on May 31, 2019 ` 13.5219
Date Period Scheme Returns
(%)
Benchmark Returns
(%)#
Additional Benchmark
Returns (%) ##
Value of ` 10,000 invested
Scheme (`)
Benchmark (`)#
Additional Benchmark
(`)##
May 31, 18 Last 1 Year 8.23 10.68 7.86 10,823 11,068 10,786May 31, 16 Last 3 Years 9.41 7.95 6.79 13,096 12,579 12,180Feb 03, 16 Since Inception 9.50 8.35 6.86 13,522 13,053 12,466
# CRISIL Composite Bond Fund Index ## CRISIL 1 year T-Bill Index. The Scheme is in existence for more than 3 years but less than 5 years. The scheme is managed by Mr. Shobhit Mehrotra since inception.
HDFC FMP 1213D MARCH 2017 (1) NAV as on May 31, 2019 ` 11.8056
Date Period Scheme Returns
(%)
Benchmark Returns
(%)#
Additional Benchmark
Returns (%) ##
Value of ` 10,000 invested
Scheme (`)
Benchmark (`)#
Additional Benchmark
(`)##
May 31, 18 Last 1 Year 8.28 10.68 7.86 10,828 11,068 10,786Mar 23, 17 Since Inception 7.88 6.88 6.65 11,806 11,568 11,514
# CRISIL Composite Bond Fund Index ## CRISIL 1 year T-Bill Index. The Scheme is in existence for more than 1 year but less than 3 years. The scheme is managed by Mr. Shobhit Mehrotra since inception.
HDFC FMP 1188D MARCH 2017 (1) NAV as on May 31, 2019 ` 11.7352
Date Period Scheme Returns
(%)
Benchmark Returns
(%)#
Additional Benchmark
Returns (%) ##
Value of ` 10,000 invested
Scheme (`)
Benchmark (`)#
Additional Benchmark
(`)##
May 31, 18 Last 1 Year 7.82 10.68 7.86 10,782 11,068 10,786Mar 30, 17 Since Inception 7.65 6.66 6.67 11,735 11,501 11,504
# CRISIL Composite Bond Fund Index ## CRISIL 1 year T-Bill Index. The Scheme is in existence for more than 1 year but less than 3 years. The scheme is managed by Mr. Shobhit Mehrotra since inception.
HDFC FMP 1172D APRIL 2017 (1) NAV as on May 31, 2019 ` 11.6373
Date Period Scheme Returns
(%)
Benchmark Returns
(%)#
Additional Benchmark
Returns (%) ##
Value of ` 10,000 invested
Scheme (`)
Benchmark (`)#
Additional Benchmark
(`)##
May 31, 18 Last 1 Year 9.10 10.68 7.86 10,910 11,068 10,786Apr 11, 17 Since Inception 7.35 6.82 6.70 11,637 11,515 11,487
# CRISIL Composite Bond Fund Index ## CRISIL 1 year T-Bill Index. The Scheme is in existence for more than 1 year but less than 3 years. The scheme is managed by Mr. Shobhit Mehrotra since inception.
HDFC FMP 1165D APRIL 2017 (1) NAV as on May 31, 2019 ` 11.6197
Date Period Scheme Returns
(%)
Benchmark Returns
(%)#
Additional Benchmark
Returns (%) ##
Value of ` 10,000 invested
Scheme (`)
Benchmark (`)#
Additional Benchmark
(`)##
May 31, 18 Last 1 Year 9.04 10.68 7.86 10,904 11,068 10,786Apr 18, 17 Since Inception 7.35 6.73 6.78 11,620 11,480 11,490
# CRISIL Composite Bond Fund Index ## CRISIL 1 year T-Bill Index. The Scheme is in existence for more than 1 year but less than 3 years. The scheme is managed by Mr. Shobhit Mehrotra since inception.
HDFC FMP 1166D MAy 2017 (1) NAV as on May 31, 2019 ` 11.6456
Date Period Scheme Returns
(%)
Benchmark Returns
(%)#
Additional Benchmark
Returns (%) ##
Value of ` 10,000 invested
Scheme (`)
Benchmark (`)#
Additional Benchmark
(`)##
May 31, 18 Last 1 Year 8.19 10.68 7.86 10,819 11,068 10,786May 09, 17 Since Inception 7.67 6.87 6.86 11,646 11,467 11,464
# CRISIL Composite Bond Fund Index ## CRISIL 1 year T-Bill Index. The Scheme is in existence for more than 1 year but less than 3 years. The scheme is managed by Mr. Shobhit Mehrotra since inception.
HDFC FMP 1136D JUNE 2017 (1) NAV as on May 31, 2019 ` 11.4773
Date Period Scheme Returns
(%)
Benchmark Returns
(%)#
Additional Benchmark
Returns (%) ##
Value of ` 10,000 invested
Scheme (`)
Benchmark (`)#
Additional Benchmark
(`)##
May 31, 18 Last 1 Year 7.68 10.68 7.86 10,768 11,068 10,786Jun 08, 17 Since Inception 7.21 5.94 6.86 11,477 11,208 11,402
# CRISIL Composite Bond Fund Index ## CRISIL 1 year T-Bill Index. The Scheme is in existence for more than 1 year but less than 3 years. The scheme is managed by Mr. Shobhit Mehrotra since inception.
HDFC FMP 1430D JULy 2017 (1) NAV as on May 31, 2019 ` 11.2817
Date Period Scheme Returns
(%)
Benchmark Returns
(%)#
Additional Benchmark
Returns (%) ##
Value of ` 10,000 invested
Scheme (`)
Benchmark (`)#
Additional Benchmark
(`)##
May 31, 18 Last 1 Year 10.09 10.68 7.86 11,009 11,068 10,786Aug 01, 17 Since Inception 6.81 5.68 6.89 11,282 11,064 11,297
# CRISIL Composite Bond Fund Index ## CRISIL 1 year T-Bill Index. The Scheme is in existence for more than 1 year but less than 3 years. The scheme is managed by Mr. Shobhit Mehrotra since inception.
Past performance may or may not be sustained in the future. Returns greater than 1 year period are compounded annualized (CAGR). Different plans viz. Regular Plan and Direct Plan have a different expense structure. The expenses of the Direct Plan under the Scheme will be lower to the extent of the distribution expenses / commission charged in the Regular Plan. Load is not taken into consideration for computation of performance. n.A.: not Available
Performance of close-ended schemes, being close-ended in nature, is not strictly comparable with that of open-ended schemes since the investment strategy for close-ended schemes is primarily buy-and-hold whereas open-ended schemes are actively managed.
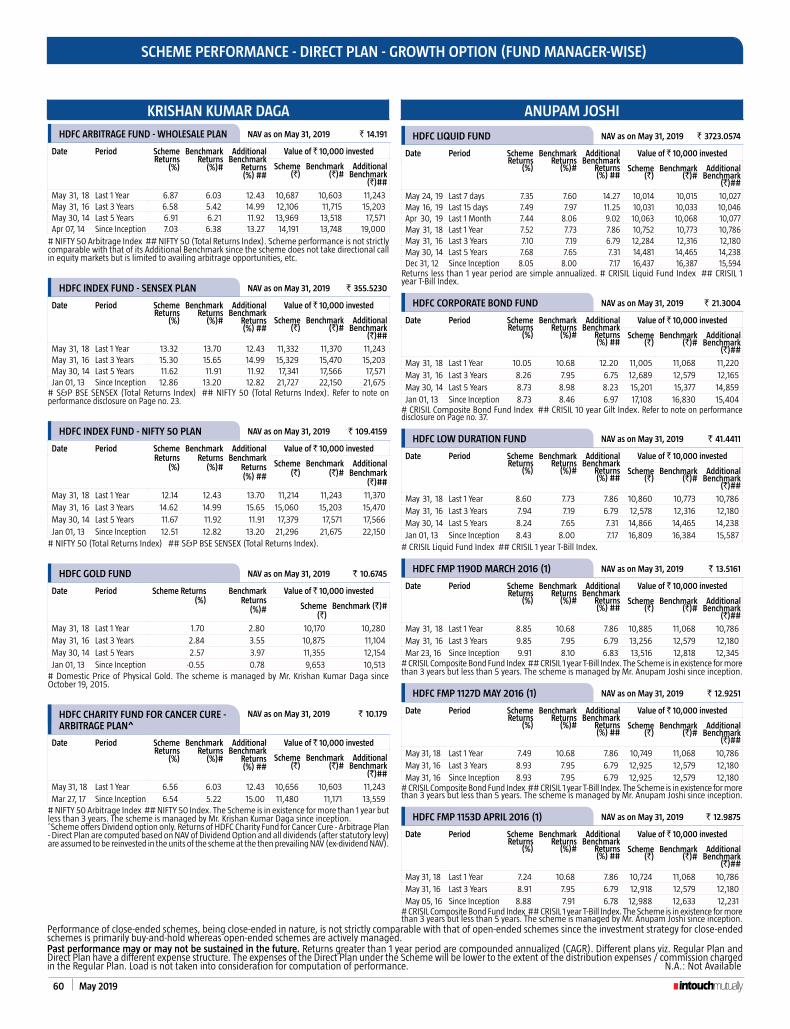
60 May 2019
SCHEME PERFORMANCE - DIRECT PLAN - GROWTH OPTION (FUND MANAGER-WISE)
KRISHAN KUMAR DAGA
HDFC ARBITRAGE FUND - WHOLESALE PLAN NAV as on May 31, 2019 ` 14.191
Date Period Scheme Returns
(%)
Benchmark Returns
(%)#
Additional Benchmark
Returns (%) ##
Value of ` 10,000 invested
Scheme (`)
Benchmark (`)#
Additional Benchmark
(`)##
May 31, 18 Last 1 Year 6.87 6.03 12.43 10,687 10,603 11,243May 31, 16 Last 3 Years 6.58 5.42 14.99 12,106 11,715 15,203May 30, 14 Last 5 Years 6.91 6.21 11.92 13,969 13,518 17,571Apr 07, 14 Since Inception 7.03 6.38 13.27 14,191 13,748 19,000
# nIFTY 50 Arbitrage Index ## nIFTY 50 (Total Returns Index). Scheme performance is not strictly comparable with that of its Additional Benchmark since the scheme does not take directional call in equity markets but is limited to availing arbitrage opportunities, etc.
HDFC INDEX FUND - SENSEX PLAN NAV as on May 31, 2019 ` 355.5230
Date Period Scheme Returns
(%)
Benchmark Returns
(%)#
Additional Benchmark
Returns (%) ##
Value of ` 10,000 invested
Scheme (`)
Benchmark (`)#
Additional Benchmark
(`)##
May 31, 18 Last 1 Year 13.32 13.70 12.43 11,332 11,370 11,243May 31, 16 Last 3 Years 15.30 15.65 14.99 15,329 15,470 15,203May 30, 14 Last 5 Years 11.62 11.91 11.92 17,341 17,566 17,571Jan 01, 13 Since Inception 12.86 13.20 12.82 21,727 22,150 21,675
# S&P BSE SEnSEx (Total Returns Index) ## nIFTY 50 (Total Returns Index). Refer to note on performance disclosure on Page no. 23.
HDFC INDEX FUND - NIFTy 50 PLAN NAV as on May 31, 2019 ` 109.4159
Date Period Scheme Returns
(%)
Benchmark Returns
(%)#
Additional Benchmark
Returns (%) ##
Value of ` 10,000 invested
Scheme (`)
Benchmark (`)#
Additional Benchmark
(`)##
May 31, 18 Last 1 Year 12.14 12.43 13.70 11,214 11,243 11,370May 31, 16 Last 3 Years 14.62 14.99 15.65 15,060 15,203 15,470May 30, 14 Last 5 Years 11.67 11.92 11.91 17,379 17,571 17,566Jan 01, 13 Since Inception 12.51 12.82 13.20 21,296 21,675 22,150
# nIFTY 50 (Total Returns Index) ## S&P BSE SEnSEx (Total Returns Index).
HDFC GOLD FUND NAV as on May 31, 2019 ` 10.6745
Date Period Scheme Returns (%)
Benchmark Returns
(%)#
Value of ` 10,000 invested
Scheme (`)
Benchmark (`)#
May 31, 18 Last 1 Year 1.70 2.80 10,170 10,280May 31, 16 Last 3 Years 2.84 3.55 10,875 11,104May 30, 14 Last 5 Years 2.57 3.97 11,355 12,154Jan 01, 13 Since Inception -0.55 0.78 9,653 10,513
# Domestic Price of Physical Gold. The scheme is managed by Mr. Krishan Kumar Daga since October 19, 2015.
HDFC CHARITy FUND FOR CANCER CURE - ARBITRAGE PLAN^
NAV as on May 31, 2019 ` 10.179
Date Period Scheme Returns
(%)
Benchmark Returns
(%)#
Additional Benchmark
Returns (%) ##
Value of ` 10,000 invested
Scheme (`)
Benchmark (`)#
Additional Benchmark
(`)##
May 31, 18 Last 1 Year 6.56 6.03 12.43 10,656 10,603 11,243Mar 27, 17 Since Inception 6.54 5.22 15.00 11,480 11,171 13,559
# nIFTY 50 Arbitrage Index ## nIFTY 50 Index. The Scheme is in existence for more than 1 year but less than 3 years. The scheme is managed by Mr. Krishan Kumar Daga since inception. ^Scheme offers Dividend option only. Returns of HDFC Charity Fund for Cancer Cure - Arbitrage Plan - Direct Plan are computed based on nAV of Dividend Option and all dividends (after statutory levy) are assumed to be reinvested in the units of the scheme at the then prevailing nAV (ex-dividend nAV).
ANUPAM JOSHI
HDFC LIQUID FUND NAV as on May 31, 2019 ` 3723.0574
Date Period Scheme Returns
(%)
Benchmark Returns
(%)#
Additional Benchmark
Returns (%) ##
Value of ` 10,000 invested
Scheme (`)
Benchmark (`)#
Additional Benchmark
(`)##
May 24, 19 Last 7 days 7.35 7.60 14.27 10,014 10,015 10,027May 16, 19 Last 15 days 7.49 7.97 11.25 10,031 10,033 10,046Apr 30, 19 Last 1 Month 7.44 8.06 9.02 10,063 10,068 10,077May 31, 18 Last 1 Year 7.52 7.73 7.86 10,752 10,773 10,786May 31, 16 Last 3 Years 7.10 7.19 6.79 12,284 12,316 12,180May 30, 14 Last 5 Years 7.68 7.65 7.31 14,481 14,465 14,238Dec 31, 12 Since Inception 8.05 8.00 7.17 16,437 16,387 15,594
Returns less than 1 year period are simple annualized. # CRISIL Liquid Fund Index ## CRISIL 1 year T-Bill Index.
HDFC CORPORATE BOND FUND NAV as on May 31, 2019 ` 21.3004
Date Period Scheme Returns
(%)
Benchmark Returns
(%)#
Additional Benchmark
Returns (%) ##
Value of ` 10,000 invested
Scheme (`)
Benchmark (`)#
Additional Benchmark
(`)##
May 31, 18 Last 1 Year 10.05 10.68 12.20 11,005 11,068 11,220May 31, 16 Last 3 Years 8.26 7.95 6.75 12,689 12,579 12,165May 30, 14 Last 5 Years 8.73 8.98 8.23 15,201 15,377 14,859Jan 01, 13 Since Inception 8.73 8.46 6.97 17,108 16,830 15,404
# CRISIL Composite Bond Fund Index ## CRISIL 10 year Gilt Index. Refer to note on performance disclosure on Page no. 37.
HDFC LOW DURATION FUND NAV as on May 31, 2019 ` 41.4411
Date Period Scheme Returns
(%)
Benchmark Returns
(%)#
Additional Benchmark
Returns (%) ##
Value of ` 10,000 invested
Scheme (`)
Benchmark (`)#
Additional Benchmark
(`)##
May 31, 18 Last 1 Year 8.60 7.73 7.86 10,860 10,773 10,786May 31, 16 Last 3 Years 7.94 7.19 6.79 12,578 12,316 12,180May 30, 14 Last 5 Years 8.24 7.65 7.31 14,866 14,465 14,238Jan 01, 13 Since Inception 8.43 8.00 7.17 16,809 16,384 15,587
# CRISIL Liquid Fund Index ## CRISIL 1 year T-Bill Index.
HDFC FMP 1190D MARCH 2016 (1) NAV as on May 31, 2019 ` 13.5161
Date Period Scheme Returns
(%)
Benchmark Returns
(%)#
Additional Benchmark
Returns (%) ##
Value of ` 10,000 invested
Scheme (`)
Benchmark (`)#
Additional Benchmark
(`)##
May 31, 18 Last 1 Year 8.85 10.68 7.86 10,885 11,068 10,786May 31, 16 Last 3 Years 9.85 7.95 6.79 13,256 12,579 12,180Mar 23, 16 Since Inception 9.91 8.10 6.83 13,516 12,818 12,345
# CRISIL Composite Bond Fund Index ## CRISIL 1 year T-Bill Index. The Scheme is in existence for more than 3 years but less than 5 years. The scheme is managed by Mr. Anupam Joshi since inception.
HDFC FMP 1127D MAy 2016 (1) NAV as on May 31, 2019 ` 12.9251
Date Period Scheme Returns
(%)
Benchmark Returns
(%)#
Additional Benchmark
Returns (%) ##
Value of ` 10,000 invested
Scheme (`)
Benchmark (`)#
Additional Benchmark
(`)##
May 31, 18 Last 1 Year 7.49 10.68 7.86 10,749 11,068 10,786May 31, 16 Last 3 Years 8.93 7.95 6.79 12,925 12,579 12,180May 31, 16 Since Inception 8.93 7.95 6.79 12,925 12,579 12,180
# CRISIL Composite Bond Fund Index ## CRISIL 1 year T-Bill Index. The Scheme is in existence for more than 3 years but less than 5 years. The scheme is managed by Mr. Anupam Joshi since inception.
HDFC FMP 1153D APRIL 2016 (1) NAV as on May 31, 2019 ` 12.9875
Date Period Scheme Returns
(%)
Benchmark Returns
(%)#
Additional Benchmark
Returns (%) ##
Value of ` 10,000 invested
Scheme (`)
Benchmark (`)#
Additional Benchmark
(`)##
May 31, 18 Last 1 Year 7.24 10.68 7.86 10,724 11,068 10,786May 31, 16 Last 3 Years 8.91 7.95 6.79 12,918 12,579 12,180May 05, 16 Since Inception 8.88 7.91 6.78 12,988 12,633 12,231
# CRISIL Composite Bond Fund Index ## CRISIL 1 year T-Bill Index. The Scheme is in existence for more than 3 years but less than 5 years. The scheme is managed by Mr. Anupam Joshi since inception.
Past performance may or may not be sustained in the future. Returns greater than 1 year period are compounded annualized (CAGR). Different plans viz. Regular Plan and Direct Plan have a different expense structure. The expenses of the Direct Plan under the Scheme will be lower to the extent of the distribution expenses / commission charged in the Regular Plan. Load is not taken into consideration for computation of performance. n.A.: not Available
Performance of close-ended schemes, being close-ended in nature, is not strictly comparable with that of open-ended schemes since the investment strategy for close-ended schemes is primarily buy-and-hold whereas open-ended schemes are actively managed.

May 2019 61
SCHEME PERFORMANCE - DIRECT PLAN - GROWTH OPTION (FUND MANAGER-WISE)
HDFC FMP 1113D JUNE 2016 (1) NAV as on May 31, 2019 ` 12.5414
Date Period Scheme Returns
(%)
Benchmark Returns
(%)#
Additional Benchmark
Returns (%) ##
Value of ` 10,000 invested
Scheme (`)
Benchmark (`)#
Additional Benchmark
(`)##
May 31, 18 Last 1 Year 8.00 10.68 7.86 10,800 11,068 10,786Jun 08, 16 Since Inception 7.90 7.96 6.78 12,541 12,563 12,159
# CRISIL Composite Bond Fund Index ## CRISIL 1 year T-Bill Index. The Scheme is in existence for more than 1 year but less than 3 years. The scheme is managed by Mr. Anupam Joshi since inception.
HDFC FMP 1127D JUNE 2016 (1) NAV as on May 31, 2019 ` 12.5248
Date Period Scheme Returns
(%)
Benchmark Returns
(%)#
Additional Benchmark
Returns (%) ##
Value of ` 10,000 invested
Scheme (`)
Benchmark (`)#
Additional Benchmark
(`)##
May 31, 18 Last 1 Year 8.24 10.68 7.86 10,824 11,068 10,786Jun 21, 16 Since Inception 7.95 7.98 6.78 12,525 12,535 12,129
# CRISIL Composite Bond Fund Index ## CRISIL 1 year T-Bill Index. The Scheme is in existence for more than 1 year but less than 3 years. The scheme is managed by Mr. Anupam Joshi since inception.
HDFC FMP 1128D JUNE 2016 (1) NAV as on May 31, 2019 ` 12.8847
Date Period Scheme Returns
(%)
Benchmark Returns
(%)#
Additional Benchmark
Returns (%) ##
Value of ` 10,000 invested
Scheme (`)
Benchmark (`)#
Additional Benchmark
(`)##
May 31, 18 Last 1 Year 7.88 10.68 7.86 10,788 11,068 10,786Jun 29, 16 Since Inception 9.07 7.86 6.77 12,885 12,472 12,108
# CRISIL Composite Bond Fund Index ## CRISIL 1 year T-Bill Index. The Scheme is in existence for more than 1 year but less than 3 years. The scheme is managed by Mr. Anupam Joshi since inception.
HDFC FMP 1112D JUNE 2016 (1) NAV as on May 31, 2019 ` 12.4292
Date Period Scheme Returns
(%)
Benchmark Returns
(%)#
Additional Benchmark
Returns (%) ##
Value of ` 10,000 invested
Scheme (`)
Benchmark (`)#
Additional Benchmark
(`)##
May 31, 18 Last 1 Year 7.86 10.68 7.86 10,786 11,068 10,786Jul 07, 16 Since Inception 7.79 7.70 6.75 12,429 12,399 12,085
# CRISIL Composite Bond Fund Index ## CRISIL 1 year T-Bill Index. The Scheme is in existence for more than 1 year but less than 3 years. The scheme is managed by Mr. Anupam Joshi since inception.
HDFC FMP 1161D JULy 2016 (1) NAV as on May 31, 2019 ` 12.7741
Date Period Scheme Returns
(%)
Benchmark Returns
(%)#
Additional Benchmark
Returns (%) ##
Value of ` 10,000 invested
Scheme (`)
Benchmark (`)#
Additional Benchmark
(`)##
May 31, 18 Last 1 Year 8.64 10.68 7.86 10,864 11,068 10,786Jul 27, 16 Since Inception 8.99 7.36 6.72 12,774 12,238 12,033
# CRISIL Composite Bond Fund Index ## CRISIL 1 year T-Bill Index. The Scheme is in existence for more than 1 year but less than 3 years. The scheme is managed by Mr. Anupam Joshi since inception.
HDFC FMP 1158D FEBRUARy 2018 (1) NAV as on May 31, 2019 ` 11.0581
Date Period Scheme Returns
(%)
Benchmark Returns
(%)#
Additional Benchmark
Returns (%) ##
Value of ` 10,000 invested
Scheme (`)
Benchmark (`)#
Additional Benchmark
(`)##
May 31, 18 Last 1 Year 9.95 10.68 7.86 10,995 11,068 10,786Feb 27, 18 Since Inception 8.35 9.11 7.49 11,058 11,156 10,948
# CRISIL Composite Bond Fund Index ## CRISIL 1 year T-Bill Index. The Scheme is in existence for more than 1 year but less than 3 years. The scheme is managed by Mr. Anupam Joshi since inception.
HDFC FMP 1150D MARCH 2018 (1) NAV as on May 31, 2019 ` 11.0257
Date Period Scheme Returns
(%)
Benchmark Returns
(%)#
Additional Benchmark
Returns (%) ##
Value of ` 10,000 invested
Scheme (`)
Benchmark (`)#
Additional Benchmark
(`)##
May 31, 18 Last 1 Year 9.91 10.68 7.86 10,991 11,068 10,786Mar 07, 18 Since Inception 8.24 9.15 7.51 11,026 11,140 10,934
# CRISIL Composite Bond Fund Index ## CRISIL 1 year T-Bill Index. The Scheme is in existence for more than 1 year but less than 3 years. The scheme is managed by Mr. Anupam Joshi since inception.
HDFC FMP 1208D MARCH 2018 (1) NAV as on May 31, 2019 ` 10.7984
Date Period Scheme Returns
(%)
Benchmark Returns
(%)#
Additional Benchmark
Returns (%) ##
Value of ` 10,000 invested
Scheme (`)
Benchmark (`)#
Additional Benchmark
(`)##
May 31, 18 Last 1 Year 7.77 10.68 7.86 10,777 11,068 10,786Mar 16, 18 Since Inception 6.56 8.68 7.43 10,798 11,058 10,904
# CRISIL Composite Bond Fund Index ## CRISIL 1 year T-Bill Index. The Scheme is in existence for more than 1 year but less than 3 years. The scheme is managed by Mr. Anupam Joshi since inception.
HDFC FMP 1143D MARCH 2018 (1) NAV as on May 31, 2019 ` 10.9867
Date Period Scheme Returns
(%)
Benchmark Returns
(%)#
Additional Benchmark
Returns (%) ##
Value of ` 10,000 invested
Scheme (`)
Benchmark (`)#
Additional Benchmark
(`)##
May 31, 18 Last 1 Year 10.00 10.68 7.86 11,000 11,068 10,786Mar 13, 18 Since Inception 8.04 9.01 7.45 10,987 11,106 10,914
# CRISIL Composite Bond Fund Index ## CRISIL 1 year T-Bill Index. The Scheme is in existence for more than 1 year but less than 3 years. The scheme is managed by Mr. Anupam Joshi since inception.
HDFC FMP 1147D MARCH 2018 (1) NAV as on May 31, 2019 ` 10.9523
Date Period Scheme Returns
(%)
Benchmark Returns
(%)#
Additional Benchmark
Returns (%) ##
Value of ` 10,000 invested
Scheme (`)
Benchmark (`)#
Additional Benchmark
(`)##
May 31, 18 Last 1 Year 10.00 10.68 7.86 11,000 11,068 10,786Mar 22, 18 Since Inception 7.93 8.73 7.44 10,952 11,048 10,893
# CRISIL Composite Bond Fund Index ## CRISIL 1 year T-Bill Index. The Scheme is in existence for more than 1 year but less than 3 years. The scheme is managed by Mr. Anupam Joshi since inception.
HDFC FMP 1145D MARCH 2018 (1) NAV as on May 31, 2019 ` 10.9461
Date Period Scheme Returns
(%)
Benchmark Returns
(%)#
Additional Benchmark
Returns (%) ##
Value of ` 10,000 invested
Scheme (`)
Benchmark (`)#
Additional Benchmark
(`)##
May 31, 18 Last 1 Year 10.00 10.68 7.86 11,000 11,068 10,786Mar 23, 18 Since Inception 7.90 8.66 7.44 10,946 11,038 10,891
# CRISIL Composite Bond Fund Index ## CRISIL 1 year T-Bill Index. The Scheme is in existence for more than 1 year but less than 3 years. The scheme is managed by Mr. Anupam Joshi since inception.
HDFC FMP 1177D MARCH 2018 (1) NAV as on May 31, 2019 ` 10.8446
Date Period Scheme Returns
(%)
Benchmark Returns
(%)#
Additional Benchmark
Returns (%) ##
Value of ` 10,000 invested
Scheme (`)
Benchmark (`)#
Additional Benchmark
(`)##
May 31, 18 Last 1 Year 8.74 10.68 7.86 10,874 11,068 10,786Mar 28, 18 Since Inception 7.14 7.95 7.32 10,845 10,941 10,865
# CRISIL Composite Bond Fund Index ## CRISIL 1 year T-Bill Index. The Scheme is in existence for more than 1 year but less than 3 years. The scheme is managed by Mr. Anupam Joshi since inception.
HDFC FMP 1183D APRIL 2018 (1) NAV as on May 31, 2019 ` 10.8902
Date Period Scheme Returns
(%)
Benchmark Returns
(%)#
Additional Benchmark
Returns (%) ##
Value of ` 10,000 invested
Scheme (`)
Benchmark (`)#
Additional Benchmark
(`)##
May 31, 18 Last 1 Year 10.18 10.68 7.86 11,018 11,068 10,786Apr 17, 18 Since Inception 7.91 8.37 7.38 10,890 10,942 10,831
# CRISIL Composite Bond Fund Index ## CRISIL 1 year T-Bill Index. The Scheme is in existence for more than 1 year but less than 3 years. The scheme is managed by Mr. Anupam Joshi since inception.
ANIL BAMBOLI
HDFC DyNAMIC DEBT FUND NAV as on May 31, 2019 ` 62.7970
Date Period Scheme Returns
(%)
Benchmark Returns
(%)#
Additional Benchmark
Returns (%) ##
Value of ` 10,000 invested
Scheme (`)
Benchmark (`)#
Additional Benchmark
(`)##
May 31, 18 Last 1 Year 3.65 10.68 12.20 10,365 11,068 11,220May 31, 16 Last 3 Years 5.63 7.95 6.75 11,785 12,579 12,165May 30, 14 Last 5 Years 7.85 8.98 8.23 14,597 15,377 14,859Jan 01, 13 Since Inception 7.94 8.46 6.97 16,323 16,830 15,404
# CRISIL Composite Bond Fund Index ## CRISIL 10 year Gilt Index.
Past performance may or may not be sustained in the future. Returns greater than 1 year period are compounded annualized (CAGR). Different plans viz. Regular Plan and Direct Plan have a different expense structure. The expenses of the Direct Plan under the Scheme will be lower to the extent of the distribution expenses / commission charged in the Regular Plan. Load is not taken into consideration for computation of performance. n.A.: not Available
Performance of close-ended schemes, being close-ended in nature, is not strictly comparable with that of open-ended schemes since the investment strategy for close-ended schemes is primarily buy-and-hold whereas open-ended schemes are actively managed.
ANUPAM JOSHI....CONTINUED

62 May 2019
SCHEME PERFORMANCE - DIRECT PLAN - GROWTH OPTION (FUND MANAGER-WISE)
ANUPAM JOSHI....CONTINUED
HDFC SHORT TERM DEBT FUND NAV as on May 31, 2019 ` 21.1320
Date Period Scheme Returns
(%)
Benchmark Returns
(%)#
Additional Benchmark
Returns (%) ##
Value of ` 10,000 invested
Scheme (`)
Benchmark (`)#
Additional Benchmark
(`)##
May 31, 18 Last 1 Year 9.02 9.24 7.86 10,902 10,924 10,786May 31, 16 Last 3 Years 7.85 7.64 6.79 12,544 12,470 12,180May 30, 14 Last 5 Years 8.42 8.25 7.31 14,987 14,874 14,238Jan 01, 13 Since Inception 8.60 8.42 7.17 16,977 16,791 15,587
# CRISIL Short Term Bond Fund Index ## CRISIL 1 year T-Bill Index.
HDFC GILT FUND NAV as on May 31, 2019 ` 38.8427
Date Period Scheme Returns
(%)
Benchmark Returns
(%)#
Additional Benchmark
Returns (%) ##
Value of ` 10,000 invested
Scheme (`)
Benchmark (`)#
Additional Benchmark
(`)##
May 31, 18 Last 1 Year 9.54 11.93 12.20 10,954 11,193 11,220May 31, 16 Last 3 Years 7.59 7.74 6.75 12,453 12,505 12,165May 30, 14 Last 5 Years 9.48 9.02 8.23 15,738 15,406 14,859Jan 01, 13 Since Inception 8.53 8.11 6.97 16,904 16,486 15,404
# CRISIL Dynamic Gilt Index ## CRISIL 10 year Gilt Index.
HDFC BANKING AND PSU DEBT FUND NAV as on May 31, 2019 ` 15.4929
Date Period Scheme Returns
(%)
Benchmark Returns
(%)#
Additional Benchmark
Returns (%) ##
Value of ` 10,000 invested
Scheme (`)
Benchmark (`)#
Additional Benchmark
(`)##
May 31, 18 Last 1 Year 10.01 9.24 7.86 11,001 10,924 10,786May 31, 16 Last 3 Years 8.26 7.64 6.79 12,690 12,470 12,180May 30, 14 Last 5 Years 8.75 8.25 7.31 15,219 14,874 14,238Mar 26, 14 Since Inception 8.81 8.37 7.38 15,493 15,167 14,461
# CRISIL Short Term Bond Fund Index ## CRISIL 1 year T-Bill Index.
HDFC MONEy MARKET FUND NAV as on May 31, 2019 ` 3972.7088
Date Period Scheme Returns
(%)
Benchmark Returns
(%)#
Additional Benchmark
Returns (%) ##
Value of ` 10,000 invested
Scheme (`)
Benchmark (`)#
Additional Benchmark
(`)##
May 31, 18 Last 1 Year 8.39 7.73 7.86 10,839 10,773 10,786May 31, 16 Last 3 Years 7.40 7.19 6.79 12,387 12,316 12,180May 30, 14 Last 5 Years 7.86 7.65 7.31 14,602 14,465 14,238Dec 31, 12 Since Inception 8.18 8.00 7.17 16,558 16,387 15,594
# CRISIL Liquid Fund Index ## CRISIL 1 year T-Bill Index.
HDFC OVERNIGHT FUND NAV as on May 31, 2019 ` 2850.1154
Date Period Scheme Returns
(%)
Benchmark Returns
(%)#
Additional Benchmark
Returns (%) ##
Value of ` 10,000 invested
Scheme (`)
Benchmark (`)#
Additional Benchmark
(`)##
May 24, 19 Last 7 days 5.82 5.94 14.27 10,011 10,011 10,027May 16, 19 Last 15 days 5.81 5.95 11.25 10,024 10,024 10,046Apr 30, 19 Last 1 Month 5.83 5.93 9.02 10,050 10,050 10,077May 31, 18 Last 1 Year 6.29 6.34 7.86 10,629 10,634 10,786May 31, 16 Last 3 Years 6.12 6.15 6.79 11,952 11,961 12,180May 30, 14 Last 5 Years 6.66 6.73 7.31 13,810 13,856 14,238Dec 31, 12 Since Inception 7.02 7.10 7.17 15,452 15,527 15,594
Returns less than 1 year period are simple annualized. # CRISIL Overnight Index ## CRISIL 1 year T-Bill Index.
HDFC CHARITy FUND FOR CANCER CURE - DEBT PLAN^
NAV as on May 31, 2019 ` 10.1882
Date Period Scheme Returns
(%)
Benchmark Returns
(%)#
Additional Benchmark
Returns (%) ##
Value of ` 10,000 invested
Scheme (`)
Benchmark (`)#
Additional Benchmark
(`)##
May 31, 18 Last 1 Year 8.56 9.24 7.86 10,856 10,924 10,786Mar 27, 17 Since Inception 7.36 7.07 6.66 11,674 11,604 11,507
# CRISIL Short Term Bond Fund Index ## CRISIL 1 year T-Bill Index. The Scheme is in existence for more than 1 year but less than 3 years. The scheme is managed by Mr. Anil Bamboli since inception. ^ Scheme offers Dividend option only. Returns of HDFC Charity Fund for Cancer Cure - Debt Plan - Direct Plan are computed based on nAV of Dividend Option and all dividends (after statutory levy) are assumed to be reinvested in the units of the scheme at the then prevailing nAV (ex-dividend nAV).
HDFC FMP 1846D AUGUST 2013 (1) NAV as on May 31, 2019 ` 16.4336
Date Period Scheme Returns
(%)
Benchmark Returns
(%)#
Additional Benchmark
Returns (%) ##
Value of ` 10,000 invested
Scheme (`)
Benchmark (`)#
Additional Benchmark
(`)##
May 31, 18 Last 1 Year 7.83 10.68 7.86 10,783 11,068 10,786May 31, 16 Last 3 Years 7.46 7.95 6.79 12,409 12,579 12,180May 30, 14 Last 5 Years 8.28 8.98 7.31 14,890 15,377 14,238Aug 14, 13 Since Inception 8.95 9.40 7.54 16,434 16,833 15,244
# CRISIL Composite Bond Fund Index ## CRISIL 1 year T-Bill Index. The scheme is managed by Mr. Anil Bamboli since inception.
HDFC FMP 1111D SEPTEMBER 2016 (1) NAV as on May 31, 2019 ` 12.5551
Date Period Scheme Returns
(%)
Benchmark Returns
(%)#
Additional Benchmark
Returns (%) ##
Value of ` 10,000 invested
Scheme (`)
Benchmark (`)#
Additional Benchmark
(`)##
May 31, 18 Last 1 Year 8.17 10.68 7.86 10,817 11,068 10,786Sep 15, 16 Since Inception 8.77 6.88 6.70 12,555 11,974 11,919
# CRISIL Composite Bond Fund Index ## CRISIL 1 year T-Bill Index. The Scheme is in existence for more than 1 year but less than 3 years. The scheme is managed by Mr. Anil Bamboli since inception.
HDFC FMP 1175D JANUARy 2014 (1) NAV as on May 31, 2019 ` 16.1346
Date Period Scheme Returns
(%)
Benchmark Returns
(%)#
Additional Benchmark
Returns (%) ##
Value of ` 10,000 invested
Scheme (`)
Benchmark (`)#
Additional Benchmark
(`)##
May 31, 18 Last 1 Year 8.31 10.68 7.86 10,831 11,068 10,786May 31, 16 Last 3 Years 7.65 7.95 6.79 12,476 12,579 12,180May 30, 14 Last 5 Years 9.12 8.98 7.31 15,477 15,377 14,238Feb 05, 14 Since Inception 9.41 9.33 7.43 16,135 16,066 14,637
# CRISIL Short Composite Fund Index ## CRISIL 1 year T-Bill Index. The scheme is managed by Mr. Anil Bamboli since inception.
HDFC FMP 370D MARCH 2014 (1) NAV as on May 31, 2019 ` 15.1170
Date Period Scheme Returns
(%)
Benchmark Returns
(%)#
Additional Benchmark
Returns (%) ##
Value of ` 10,000 invested
Scheme (`)
Benchmark (`)#
Additional Benchmark
(`)##
May 31, 18 Last 1 Year 9.09 9.24 7.86 10,909 10,924 10,786May 31, 16 Last 3 Years 7.46 7.64 6.79 12,409 12,470 12,180May 30, 14 Last 5 Years 8.00 8.25 7.31 14,699 14,874 14,238Mar 05, 14 Since Inception 8.20 8.44 7.42 15,117 15,291 14,550
# CRISIL Short Term Bond Fund Index ## CRISIL 1 year T-Bill Index. The scheme is managed by Mr. Anil Bamboli since inception.
HDFC FMP 793D FEBRUARy 2014 (1) NAV as on May 31, 2019 ` 15.5364
Date Period Scheme Returns
(%)
Benchmark Returns
(%)#
Additional Benchmark
Returns (%) ##
Value of ` 10,000 invested
Scheme (`)
Benchmark (`)#
Additional Benchmark
(`)##
May 31, 18 Last 1 Year 9.12 9.24 7.86 10,912 10,924 10,786May 31, 16 Last 3 Years 7.42 7.64 6.79 12,395 12,470 12,180May 30, 14 Last 5 Years 8.60 8.25 7.31 15,113 14,874 14,238Feb 26, 14 Since Inception 8.74 8.45 7.41 15,536 15,325 14,568
# CRISIL Short Term Bond Fund Index ## CRISIL 1 year T-Bill Index. The scheme is managed by Mr. Anil Bamboli since inception.
Past performance may or may not be sustained in the future. Returns greater than 1 year period are compounded annualized (CAGR). Different plans viz. Regular Plan and Direct Plan have a different expense structure. The expenses of the Direct Plan under the Scheme will be lower to the extent of the distribution expenses / commission charged in the Regular Plan. Load is not taken into consideration for computation of performance. n.A.: not Available
Performance of close-ended schemes, being close-ended in nature, is not strictly comparable with that of open-ended schemes since the investment strategy for close-ended schemes is primarily buy-and-hold whereas open-ended schemes are actively managed.
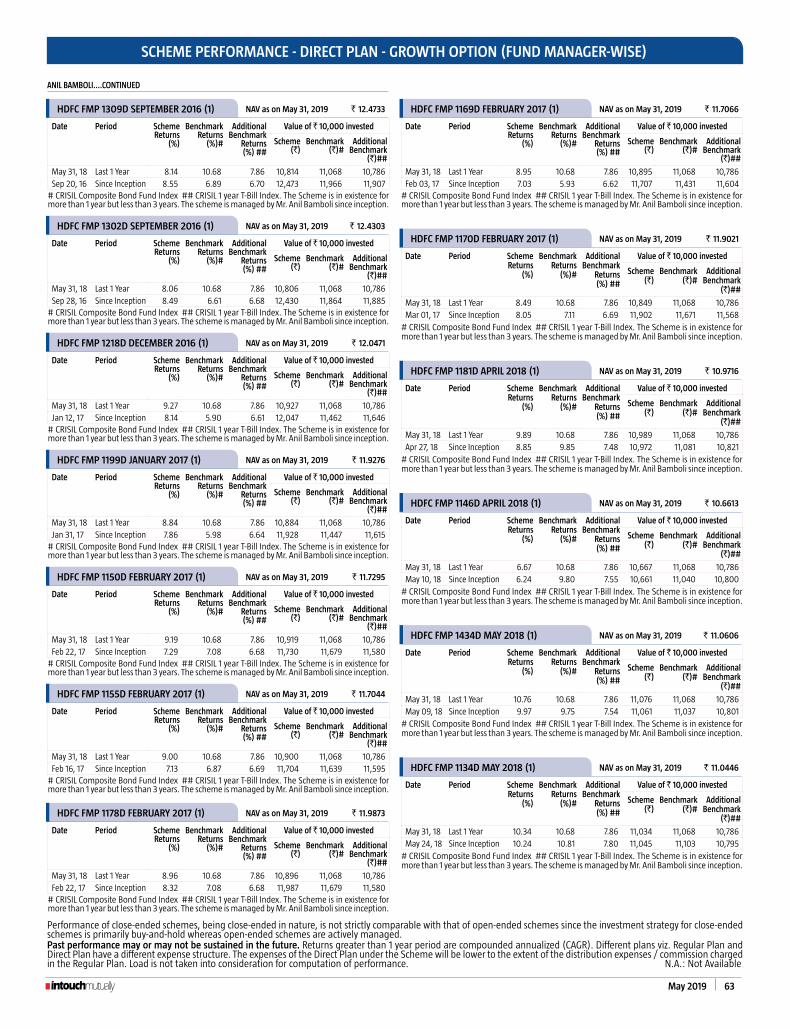
May 2019 63
SCHEME PERFORMANCE - DIRECT PLAN - GROWTH OPTION (FUND MANAGER-WISE)
HDFC FMP 1309D SEPTEMBER 2016 (1) NAV as on May 31, 2019 ` 12.4733
Date Period Scheme Returns
(%)
Benchmark Returns
(%)#
Additional Benchmark
Returns (%) ##
Value of ` 10,000 invested
Scheme (`)
Benchmark (`)#
Additional Benchmark
(`)##
May 31, 18 Last 1 Year 8.14 10.68 7.86 10,814 11,068 10,786Sep 20, 16 Since Inception 8.55 6.89 6.70 12,473 11,966 11,907
# CRISIL Composite Bond Fund Index ## CRISIL 1 year T-Bill Index. The Scheme is in existence for more than 1 year but less than 3 years. The scheme is managed by Mr. Anil Bamboli since inception.
HDFC FMP 1302D SEPTEMBER 2016 (1) NAV as on May 31, 2019 ` 12.4303
Date Period Scheme Returns
(%)
Benchmark Returns
(%)#
Additional Benchmark
Returns (%) ##
Value of ` 10,000 invested
Scheme (`)
Benchmark (`)#
Additional Benchmark
(`)##
May 31, 18 Last 1 Year 8.06 10.68 7.86 10,806 11,068 10,786Sep 28, 16 Since Inception 8.49 6.61 6.68 12,430 11,864 11,885
# CRISIL Composite Bond Fund Index ## CRISIL 1 year T-Bill Index. The Scheme is in existence for more than 1 year but less than 3 years. The scheme is managed by Mr. Anil Bamboli since inception.
HDFC FMP 1218D DECEMBER 2016 (1) NAV as on May 31, 2019 ` 12.0471
Date Period Scheme Returns
(%)
Benchmark Returns
(%)#
Additional Benchmark
Returns (%) ##
Value of ` 10,000 invested
Scheme (`)
Benchmark (`)#
Additional Benchmark
(`)##
May 31, 18 Last 1 Year 9.27 10.68 7.86 10,927 11,068 10,786Jan 12, 17 Since Inception 8.14 5.90 6.61 12,047 11,462 11,646
# CRISIL Composite Bond Fund Index ## CRISIL 1 year T-Bill Index. The Scheme is in existence for more than 1 year but less than 3 years. The scheme is managed by Mr. Anil Bamboli since inception.
HDFC FMP 1199D JANUARy 2017 (1) NAV as on May 31, 2019 ` 11.9276
Date Period Scheme Returns
(%)
Benchmark Returns
(%)#
Additional Benchmark
Returns (%) ##
Value of ` 10,000 invested
Scheme (`)
Benchmark (`)#
Additional Benchmark
(`)##
May 31, 18 Last 1 Year 8.84 10.68 7.86 10,884 11,068 10,786Jan 31, 17 Since Inception 7.86 5.98 6.64 11,928 11,447 11,615
# CRISIL Composite Bond Fund Index ## CRISIL 1 year T-Bill Index. The Scheme is in existence for more than 1 year but less than 3 years. The scheme is managed by Mr. Anil Bamboli since inception.
HDFC FMP 1150D FEBRUARy 2017 (1) NAV as on May 31, 2019 ` 11.7295
Date Period Scheme Returns
(%)
Benchmark Returns
(%)#
Additional Benchmark
Returns (%) ##
Value of ` 10,000 invested
Scheme (`)
Benchmark (`)#
Additional Benchmark
(`)##
May 31, 18 Last 1 Year 9.19 10.68 7.86 10,919 11,068 10,786Feb 22, 17 Since Inception 7.29 7.08 6.68 11,730 11,679 11,580
# CRISIL Composite Bond Fund Index ## CRISIL 1 year T-Bill Index. The Scheme is in existence for more than 1 year but less than 3 years. The scheme is managed by Mr. Anil Bamboli since inception.
HDFC FMP 1155D FEBRUARy 2017 (1) NAV as on May 31, 2019 ` 11.7044
Date Period Scheme Returns
(%)
Benchmark Returns
(%)#
Additional Benchmark
Returns (%) ##
Value of ` 10,000 invested
Scheme (`)
Benchmark (`)#
Additional Benchmark
(`)##
May 31, 18 Last 1 Year 9.00 10.68 7.86 10,900 11,068 10,786Feb 16, 17 Since Inception 7.13 6.87 6.69 11,704 11,639 11,595
# CRISIL Composite Bond Fund Index ## CRISIL 1 year T-Bill Index. The Scheme is in existence for more than 1 year but less than 3 years. The scheme is managed by Mr. Anil Bamboli since inception.
HDFC FMP 1178D FEBRUARy 2017 (1) NAV as on May 31, 2019 ` 11.9873
Date Period Scheme Returns
(%)
Benchmark Returns
(%)#
Additional Benchmark
Returns (%) ##
Value of ` 10,000 invested
Scheme (`)
Benchmark (`)#
Additional Benchmark
(`)##
May 31, 18 Last 1 Year 8.96 10.68 7.86 10,896 11,068 10,786Feb 22, 17 Since Inception 8.32 7.08 6.68 11,987 11,679 11,580
# CRISIL Composite Bond Fund Index ## CRISIL 1 year T-Bill Index. The Scheme is in existence for more than 1 year but less than 3 years. The scheme is managed by Mr. Anil Bamboli since inception.
HDFC FMP 1169D FEBRUARy 2017 (1) NAV as on May 31, 2019 ` 11.7066
Date Period Scheme Returns
(%)
Benchmark Returns
(%)#
Additional Benchmark
Returns (%) ##
Value of ` 10,000 invested
Scheme (`)
Benchmark (`)#
Additional Benchmark
(`)##
May 31, 18 Last 1 Year 8.95 10.68 7.86 10,895 11,068 10,786Feb 03, 17 Since Inception 7.03 5.93 6.62 11,707 11,431 11,604
# CRISIL Composite Bond Fund Index ## CRISIL 1 year T-Bill Index. The Scheme is in existence for more than 1 year but less than 3 years. The scheme is managed by Mr. Anil Bamboli since inception.
HDFC FMP 1170D FEBRUARy 2017 (1) NAV as on May 31, 2019 ` 11.9021
Date Period Scheme Returns
(%)
Benchmark Returns
(%)#
Additional Benchmark
Returns (%) ##
Value of ` 10,000 invested
Scheme (`)
Benchmark (`)#
Additional Benchmark
(`)##
May 31, 18 Last 1 Year 8.49 10.68 7.86 10,849 11,068 10,786Mar 01, 17 Since Inception 8.05 7.11 6.69 11,902 11,671 11,568
# CRISIL Composite Bond Fund Index ## CRISIL 1 year T-Bill Index. The Scheme is in existence for more than 1 year but less than 3 years. The scheme is managed by Mr. Anil Bamboli since inception.
HDFC FMP 1181D APRIL 2018 (1) NAV as on May 31, 2019 ` 10.9716
Date Period Scheme Returns
(%)
Benchmark Returns
(%)#
Additional Benchmark
Returns (%) ##
Value of ` 10,000 invested
Scheme (`)
Benchmark (`)#
Additional Benchmark
(`)##
May 31, 18 Last 1 Year 9.89 10.68 7.86 10,989 11,068 10,786Apr 27, 18 Since Inception 8.85 9.85 7.48 10,972 11,081 10,821
# CRISIL Composite Bond Fund Index ## CRISIL 1 year T-Bill Index. The Scheme is in existence for more than 1 year but less than 3 years. The scheme is managed by Mr. Anil Bamboli since inception.
HDFC FMP 1146D APRIL 2018 (1) NAV as on May 31, 2019 ` 10.6613
Date Period Scheme Returns
(%)
Benchmark Returns
(%)#
Additional Benchmark
Returns (%) ##
Value of ` 10,000 invested
Scheme (`)
Benchmark (`)#
Additional Benchmark
(`)##
May 31, 18 Last 1 Year 6.67 10.68 7.86 10,667 11,068 10,786May 10, 18 Since Inception 6.24 9.80 7.55 10,661 11,040 10,800
# CRISIL Composite Bond Fund Index ## CRISIL 1 year T-Bill Index. The Scheme is in existence for more than 1 year but less than 3 years. The scheme is managed by Mr. Anil Bamboli since inception.
HDFC FMP 1434D MAy 2018 (1) NAV as on May 31, 2019 ` 11.0606
Date Period Scheme Returns
(%)
Benchmark Returns
(%)#
Additional Benchmark
Returns (%) ##
Value of ` 10,000 invested
Scheme (`)
Benchmark (`)#
Additional Benchmark
(`)##
May 31, 18 Last 1 Year 10.76 10.68 7.86 11,076 11,068 10,786May 09, 18 Since Inception 9.97 9.75 7.54 11,061 11,037 10,801
# CRISIL Composite Bond Fund Index ## CRISIL 1 year T-Bill Index. The Scheme is in existence for more than 1 year but less than 3 years. The scheme is managed by Mr. Anil Bamboli since inception.
HDFC FMP 1134D MAy 2018 (1) NAV as on May 31, 2019 ` 11.0446
Date Period Scheme Returns
(%)
Benchmark Returns
(%)#
Additional Benchmark
Returns (%) ##
Value of ` 10,000 invested
Scheme (`)
Benchmark (`)#
Additional Benchmark
(`)##
May 31, 18 Last 1 Year 10.34 10.68 7.86 11,034 11,068 10,786May 24, 18 Since Inception 10.24 10.81 7.80 11,045 11,103 10,795
# CRISIL Composite Bond Fund Index ## CRISIL 1 year T-Bill Index. The Scheme is in existence for more than 1 year but less than 3 years. The scheme is managed by Mr. Anil Bamboli since inception.
Past performance may or may not be sustained in the future. Returns greater than 1 year period are compounded annualized (CAGR). Different plans viz. Regular Plan and Direct Plan have a different expense structure. The expenses of the Direct Plan under the Scheme will be lower to the extent of the distribution expenses / commission charged in the Regular Plan. Load is not taken into consideration for computation of performance. n.A.: not Available
ANIL BAMBOLI....CONTINUED
Performance of close-ended schemes, being close-ended in nature, is not strictly comparable with that of open-ended schemes since the investment strategy for close-ended schemes is primarily buy-and-hold whereas open-ended schemes are actively managed.
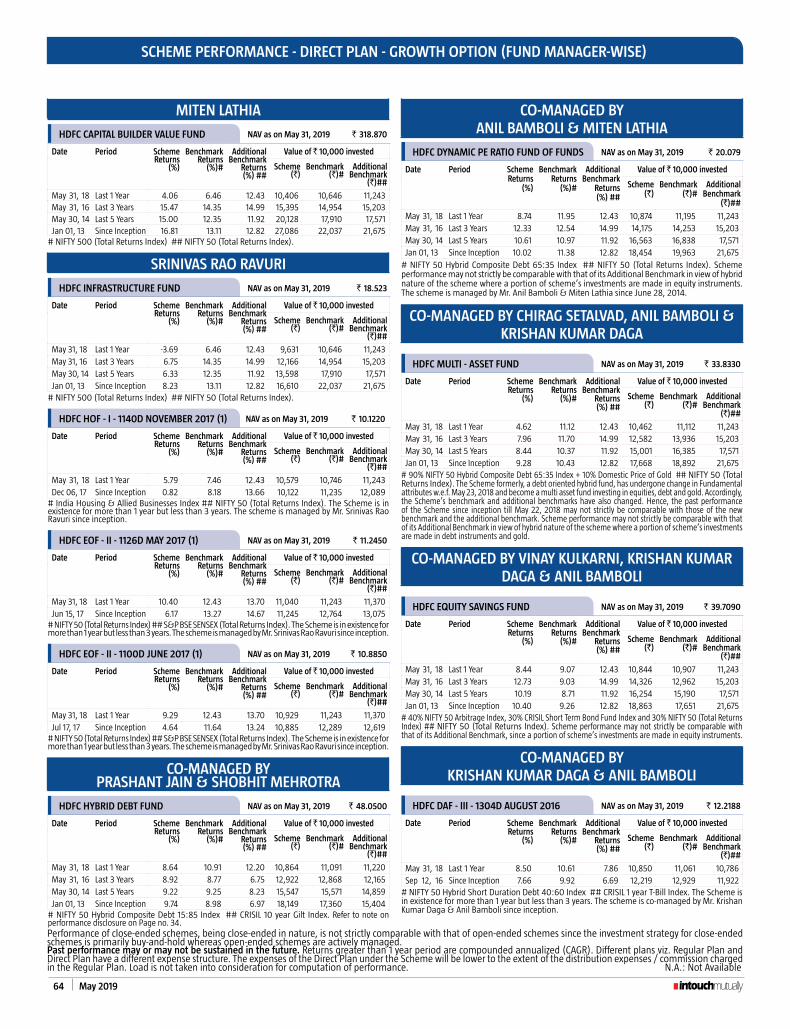
64 May 2019
SCHEME PERFORMANCE - DIRECT PLAN - GROWTH OPTION (FUND MANAGER-WISE)
MITEN LATHIA
HDFC CAPITAL BUILDER VALUE FUND NAV as on May 31, 2019 ` 318.870
Date Period Scheme Returns
(%)
Benchmark Returns
(%)#
Additional Benchmark
Returns (%) ##
Value of ` 10,000 invested
Scheme (`)
Benchmark (`)#
Additional Benchmark
(`)##
May 31, 18 Last 1 Year 4.06 6.46 12.43 10,406 10,646 11,243May 31, 16 Last 3 Years 15.47 14.35 14.99 15,395 14,954 15,203May 30, 14 Last 5 Years 15.00 12.35 11.92 20,128 17,910 17,571Jan 01, 13 Since Inception 16.81 13.11 12.82 27,086 22,037 21,675
# nIFTY 500 (Total Returns Index) ## nIFTY 50 (Total Returns Index).
SRINIVAS RAO RAVURI
HDFC INFRASTRUCTURE FUND NAV as on May 31, 2019 ` 18.523
Date Period Scheme Returns
(%)
Benchmark Returns
(%)#
Additional Benchmark
Returns (%) ##
Value of ` 10,000 invested
Scheme (`)
Benchmark (`)#
Additional Benchmark
(`)##
May 31, 18 Last 1 Year -3.69 6.46 12.43 9,631 10,646 11,243May 31, 16 Last 3 Years 6.75 14.35 14.99 12,166 14,954 15,203May 30, 14 Last 5 Years 6.33 12.35 11.92 13,598 17,910 17,571Jan 01, 13 Since Inception 8.23 13.11 12.82 16,610 22,037 21,675
# nIFTY 500 (Total Returns Index) ## nIFTY 50 (Total Returns Index).
HDFC HOF - I - 1140D NOVEMBER 2017 (1) NAV as on May 31, 2019 ` 10.1220
Date Period Scheme Returns
(%)
Benchmark Returns
(%)#
Additional Benchmark
Returns (%) ##
Value of ` 10,000 invested
Scheme (`)
Benchmark (`)#
Additional Benchmark
(`)##
May 31, 18 Last 1 Year 5.79 7.46 12.43 10,579 10,746 11,243Dec 06, 17 Since Inception 0.82 8.18 13.66 10,122 11,235 12,089
# India Housing & Allied Businesses Index ## nIFTY 50 (Total Returns Index). The Scheme is in existence for more than 1 year but less than 3 years. The scheme is managed by Mr. Srinivas Rao Ravuri since inception.
HDFC EOF - II - 1126D MAy 2017 (1) NAV as on May 31, 2019 ` 11.2450
Date Period Scheme Returns
(%)
Benchmark Returns
(%)#
Additional Benchmark
Returns (%) ##
Value of ` 10,000 invested
Scheme (`)
Benchmark (`)#
Additional Benchmark
(`)##
May 31, 18 Last 1 Year 10.40 12.43 13.70 11,040 11,243 11,370Jun 15, 17 Since Inception 6.17 13.27 14.67 11,245 12,764 13,075
# nIFTY 50 (Total Returns Index) ## S&P BSE SEnSEx (Total Returns Index). The Scheme is in existence for more than 1 year but less than 3 years. The scheme is managed by Mr. Srinivas Rao Ravuri since inception.
HDFC EOF - II - 1100D JUNE 2017 (1) NAV as on May 31, 2019 ` 10.8850
Date Period Scheme Returns
(%)
Benchmark Returns
(%)#
Additional Benchmark
Returns (%) ##
Value of ` 10,000 invested
Scheme (`)
Benchmark (`)#
Additional Benchmark
(`)##
May 31, 18 Last 1 Year 9.29 12.43 13.70 10,929 11,243 11,370Jul 17, 17 Since Inception 4.64 11.64 13.24 10,885 12,289 12,619
# nIFTY 50 (Total Returns Index) ## S&P BSE SEnSEx (Total Returns Index). The Scheme is in existence for more than 1 year but less than 3 years. The scheme is managed by Mr. Srinivas Rao Ravuri since inception.
CO-MANAGED By PRASHANT JAIN & SHOBHIT MEHROTRA
HDFC HyBRID DEBT FUND NAV as on May 31, 2019 ` 48.0500
Date Period Scheme Returns
(%)
Benchmark Returns
(%)#
Additional Benchmark
Returns (%) ##
Value of ` 10,000 invested
Scheme (`)
Benchmark (`)#
Additional Benchmark
(`)##
May 31, 18 Last 1 Year 8.64 10.91 12.20 10,864 11,091 11,220May 31, 16 Last 3 Years 8.92 8.77 6.75 12,922 12,868 12,165May 30, 14 Last 5 Years 9.22 9.25 8.23 15,547 15,571 14,859Jan 01, 13 Since Inception 9.74 8.98 6.97 18,149 17,360 15,404
# nIFTY 50 Hybrid Composite Debt 15:85 Index ## CRISIL 10 year Gilt Index. Refer to note on performance disclosure on Page no. 34.
CO-MANAGED By ANIL BAMBOLI & MITEN LATHIA
HDFC DyNAMIC PE RATIO FUND OF FUNDS NAV as on May 31, 2019 ` 20.079
Date Period Scheme Returns
(%)
Benchmark Returns
(%)#
Additional Benchmark
Returns (%) ##
Value of ` 10,000 invested
Scheme (`)
Benchmark (`)#
Additional Benchmark
(`)##
May 31, 18 Last 1 Year 8.74 11.95 12.43 10,874 11,195 11,243May 31, 16 Last 3 Years 12.33 12.54 14.99 14,175 14,253 15,203May 30, 14 Last 5 Years 10.61 10.97 11.92 16,563 16,838 17,571Jan 01, 13 Since Inception 10.02 11.38 12.82 18,454 19,963 21,675
# nIFTY 50 Hybrid Composite Debt 65:35 Index ## nIFTY 50 (Total Returns Index). Scheme performance may not strictly be comparable with that of its Additional Benchmark in view of hybrid nature of the scheme where a portion of scheme’s investments are made in equity instruments. The scheme is managed by Mr. Anil Bamboli & Miten Lathia since June 28, 2014.
CO-MANAGED By CHIRAG SETALVAD, ANIL BAMBOLI & KRISHAN KUMAR DAGA
HDFC MULTI - ASSET FUND NAV as on May 31, 2019 ` 33.8330
Date Period Scheme Returns
(%)
Benchmark Returns
(%)#
Additional Benchmark
Returns (%) ##
Value of ` 10,000 invested
Scheme (`)
Benchmark (`)#
Additional Benchmark
(`)##
May 31, 18 Last 1 Year 4.62 11.12 12.43 10,462 11,112 11,243May 31, 16 Last 3 Years 7.96 11.70 14.99 12,582 13,936 15,203May 30, 14 Last 5 Years 8.44 10.37 11.92 15,001 16,385 17,571Jan 01, 13 Since Inception 9.28 10.43 12.82 17,668 18,892 21,675
# 90% nIFTY 50 Hybrid Composite Debt 65:35 Index + 10% Domestic Price of Gold ## nIFTY 50 (Total Returns Index). The Scheme formerly, a debt oriented hybrid fund, has undergone change in Fundamental attributes w.e.f. May 23, 2018 and become a multi asset fund investing in equities, debt and gold. Accordingly, the Scheme’s benchmark and additional benchmarks have also changed. Hence, the past performance of the Scheme since inception till May 22, 2018 may not strictly be comparable with those of the new benchmark and the additional benchmark. Scheme performance may not strictly be comparable with that of its Additional Benchmark in view of hybrid nature of the scheme where a portion of scheme’s investments are made in debt instruments and gold.
CO-MANAGED By VINAy KULKARNI, KRISHAN KUMAR DAGA & ANIL BAMBOLI
HDFC EQUITy SAVINGS FUND NAV as on May 31, 2019 ` 39.7090
Date Period Scheme Returns
(%)
Benchmark Returns
(%)#
Additional Benchmark
Returns (%) ##
Value of ` 10,000 invested
Scheme (`)
Benchmark (`)#
Additional Benchmark
(`)##
May 31, 18 Last 1 Year 8.44 9.07 12.43 10,844 10,907 11,243May 31, 16 Last 3 Years 12.73 9.03 14.99 14,326 12,962 15,203May 30, 14 Last 5 Years 10.19 8.71 11.92 16,254 15,190 17,571Jan 01, 13 Since Inception 10.40 9.26 12.82 18,863 17,651 21,675
# 40% nIFTY 50 Arbitrage Index, 30% CRISIL Short Term Bond Fund Index and 30% nIFTY 50 (Total Returns Index) ## nIFTY 50 (Total Returns Index). Scheme performance may not strictly be comparable with that of its Additional Benchmark, since a portion of scheme’s investments are made in equity instruments.
CO-MANAGED By KRISHAN KUMAR DAGA & ANIL BAMBOLI
HDFC DAF - III - 1304D AUGUST 2016 NAV as on May 31, 2019 ` 12.2188
Date Period Scheme Returns
(%)
Benchmark Returns
(%)#
Additional Benchmark
Returns (%) ##
Value of ` 10,000 invested
Scheme (`)
Benchmark (`)#
Additional Benchmark
(`)##
May 31, 18 Last 1 Year 8.50 10.61 7.86 10,850 11,061 10,786Sep 12, 16 Since Inception 7.66 9.92 6.69 12,219 12,929 11,922
# nIFTY 50 Hybrid Short Duration Debt 40:60 Index ## CRISIL 1 year T-Bill Index. The Scheme is in existence for more than 1 year but less than 3 years. The scheme is co-managed by Mr. Krishan Kumar Daga & Anil Bamboli since inception.
Past performance may or may not be sustained in the future. Returns greater than 1 year period are compounded annualized (CAGR). Different plans viz. Regular Plan and Direct Plan have a different expense structure. The expenses of the Direct Plan under the Scheme will be lower to the extent of the distribution expenses / commission charged in the Regular Plan. Load is not taken into consideration for computation of performance. n.A.: not Available
Performance of close-ended schemes, being close-ended in nature, is not strictly comparable with that of open-ended schemes since the investment strategy for close-ended schemes is primarily buy-and-hold whereas open-ended schemes are actively managed.

May 2019 65
SCHEME PERFORMANCE - DIRECT PLAN - GROWTH OPTION (FUND MANAGER-WISE)
HDFC DAF - III - 1267D OCTOBER 2016 NAV as on May 31, 2019 ` 12.0492
Date Period Scheme Returns
(%)
Benchmark Returns
(%)#
Additional Benchmark
Returns (%) ##
Value of ` 10,000 invested
Scheme (`)
Benchmark (`)#
Additional Benchmark
(`)##
May 31, 18 Last 1 Year 8.74 10.61 7.86 10,874 11,061 10,786Oct 25, 16 Since Inception 7.44 10.17 6.63 12,049 12,862 11,814
# nIFTY 50 Hybrid Short Duration Debt 40:60 Index ## CRISIL 1 year T-Bill Index. The Scheme is in existence for more than 1 year but less than 3 years. The scheme is co-managed by Mr. Krishan Kumar Daga & Anil Bamboli since inception.
HDFC DAF - III - 1224D NOVEMBER 2016 NAV as on May 31, 2019 ` 11.9416
Date Period Scheme Returns
(%)
Benchmark Returns
(%)#
Additional Benchmark
Returns (%) ##
Value of ` 10,000 invested
Scheme (`)
Benchmark (`)#
Additional Benchmark
(`)##
May 31, 18 Last 1 Year 8.89 10.06 7.86 10,889 11,006 10,786Dec 07, 16 Since Inception 7.42 9.76 6.61 11,942 12,596 11,721
# nIFTY 50 Hybrid Short Duration Debt 25:75 Index ## CRISIL 1 year T-Bill Index. The Scheme is in existence for more than 1 year but less than 3 years. The scheme is co-managed by Mr. Krishan Kumar Daga & Anil Bamboli since inception.
CO-MANAGED By CHIRAG SETALVAD & SHOBHIT MEHROTRA
HDFC RETIREMENT SAVINGS FUND - EQUITy PLAN
NAV as on May 31, 2019 ` 18.262
Date Period Scheme Returns
(%)
Benchmark Returns
(%)#
Additional Benchmark
Returns (%) ##
Value of ` 10,000 invested
Scheme (`)
Benchmark (`)#
Additional Benchmark
(`)##
May 31, 18 Last 1 Year 3.93 6.46 12.43 10,393 10,646 11,243May 31, 16 Last 3 Years 15.56 14.35 14.99 15,433 14,954 15,203Feb 25, 16 Since Inception 20.27 18.81 19.46 18,262 17,551 17,866
# nIFTY 500 (Total Returns Index) ## nIFTY 50 (Total Returns Index). The Scheme is in existence for more than 3 years but less than 5 years
HDFC RETIREMENTSAVINGS FUND - HyBRID EQUITy PLAN
NAV as on May 31, 2019 ` 18.054
Date Period Scheme Returns
(%)
Benchmark Returns
(%)#
Additional Benchmark
Returns (%) ##
Value of ` 10,000 invested
Scheme (`)
Benchmark (`)#
Additional Benchmark
(`)##
May 31, 18 Last 1 Year 8.86 11.95 12.43 10,886 11,195 11,243May 31, 16 Last 3 Years 16.20 12.54 14.99 15,691 14,253 15,203Feb 25, 16 Since Inception 19.85 15.69 19.46 18,054 16,089 17,866
# nIFTY 50 Hybrid Composite Debt 65:35 Index ## nIFTY 50 (Total Returns Index). The Scheme is in existence for more than 3 years but less than 5 years
HDFC RETIREMENT SAVINGS FUND - HyBRID DEBT PLAN
NAV as on May 31, 2019 ` 13.9871
Date Period Scheme Returns
(%)
Benchmark Returns
(%)#
Additional Benchmark
Returns (%) ##
Value of ` 10,000 invested
Scheme (`)
Benchmark (`)#
Additional Benchmark
(`)##
May 31, 18 Last 1 Year 7.70 10.91 12.20 10,770 11,091 11,220May 31, 16 Last 3 Years 9.87 8.77 6.75 13,264 12,868 12,165Feb 26, 16 Since Inception 10.84 10.04 7.51 13,987 13,659 12,661
# nIFTY 50 Hybrid Composite Debt 15:85 Index ## CRISIL 10 Year Gilt Index. The Scheme is in existence for more than 3 years but less than 5 years
Past performance may or may not be sustained in the future. Returns greater than 1 year period are compounded annualized (CAGR). Different plans viz. Regular Plan and Direct Plan have a different expense structure. The expenses of the Direct Plan under the Scheme will be lower to the extent of the distribution expenses / commission charged in the Regular Plan. Load is not taken into consideration for computation of performance. n.A.: not Available
Performance of close-ended schemes, being close-ended in nature, is not strictly comparable with that of open-ended schemes since the investment strategy for close-ended schemes is primarily buy-and-hold whereas open-ended schemes are actively managed.
Managing Portfolio Since
Returns (%) (As on May 31, 2019)
Last 1 year (%) Last 3 years (%) Last 5 years (%)
Category I - FPI Portfolio (managed under a bilateral agreement under Regulation 24(b) and subject to applicable laws)
March 22, 2016 19.90 16.01 n.A.
Benchmark- MSCI India (Total Returns) 10.63 12.45 n.A.Past performance may or may not be sustained in the future. Returns greater than 1 year period are compounded annualised (CAGR). The above returns are computed using the Time Weighted Rate of Return (TWRR) methodology, to make them more comparable with the mutual fund scheme's returns. Inception date is March 22, 2016. The performance is not comparable with the performance of the aforementioned scheme(s) of HDFC Mutual Fund due to differing investment objective/s and fundamental differences in asset allocation, investment strategy and the regulatory environment. The said disclosure is pursuant to SEBI Circular no. Cir/IMD/DF/7/2012 dated February 28, 2012 pertaining to Regulation 24(b) of SEBI (Mutual Funds) Regulations, 1996. FPI - Foreign Portfolio Investor.
PERFORMANCE OF CATEGORy I - FPI PORTFOLIO (MANAGED By PRASHANT JAIN)
KRISHAN KUMAR DAGA & ANIL BAMBOLI....CONTINUED
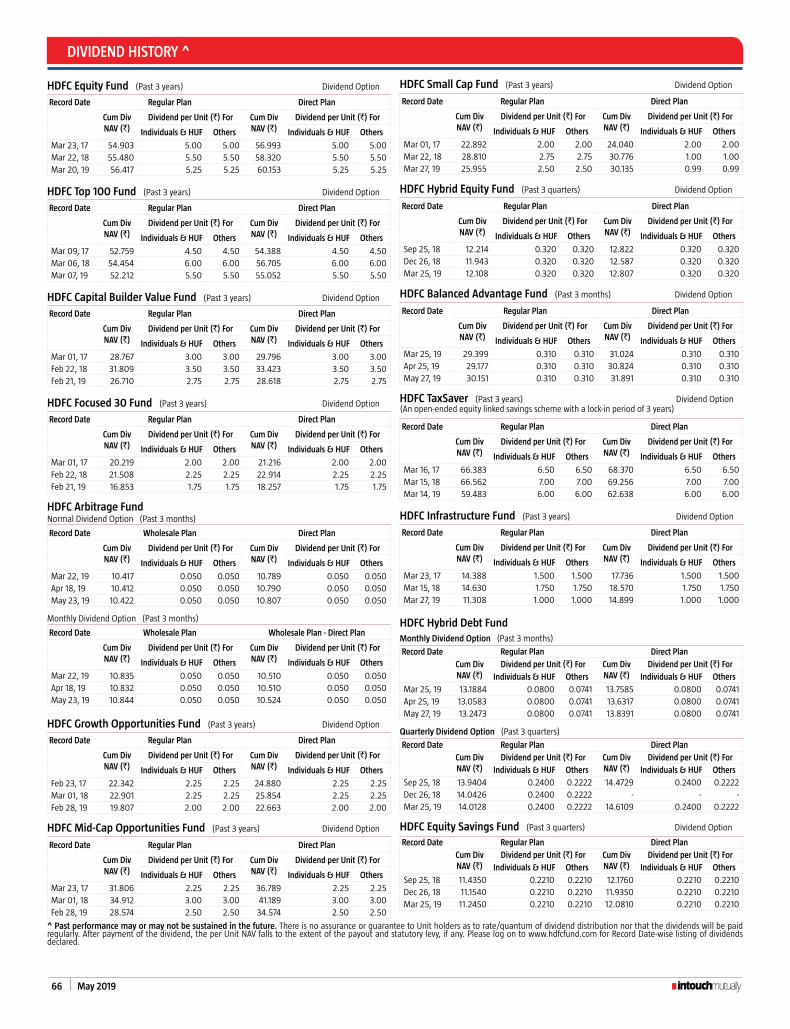
66 May 2019
DIVIDEND HISTORy ^
^ Past performance may or may not be sustained in the future. There is no assurance or guarantee to Unit holders as to rate/quantum of dividend distribution nor that the dividends will be paid regularly. After payment of the dividend, the per Unit nAV falls to the extent of the payout and statutory levy, if any. Please log on to www.hdfcfund.com for Record Date-wise listing of dividends declared.
HDFC Equity Fund (Past 3 years) Dividend Option
Record Date Regular Plan Direct Plan
Cum Div NAV (`)
Dividend per Unit (`) For Cum Div NAV (`)
Dividend per Unit (`) For
Individuals & HUF Others Individuals & HUF Others
Mar 23, 17 54.903 5.00 5.00 56.993 5.00 5.00Mar 22, 18 55.480 5.50 5.50 58.320 5.50 5.50Mar 20, 19 56.417 5.25 5.25 60.153 5.25 5.25
HDFC Top 100 Fund (Past 3 years) Dividend Option
Record Date Regular Plan Direct Plan
Cum Div NAV (`)
Dividend per Unit (`) For Cum Div NAV (`)
Dividend per Unit (`) For
Individuals & HUF Others Individuals & HUF Others
Mar 09, 17 52.759 4.50 4.50 54.388 4.50 4.50Mar 06, 18 54.454 6.00 6.00 56.705 6.00 6.00Mar 07, 19 52.212 5.50 5.50 55.052 5.50 5.50
HDFC Capital Builder Value Fund (Past 3 years) Dividend Option
Record Date Regular Plan Direct Plan
Cum Div NAV (`)
Dividend per Unit (`) For Cum Div NAV (`)
Dividend per Unit (`) For
Individuals & HUF Others Individuals & HUF Others
Mar 01, 17 28.767 3.00 3.00 29.796 3.00 3.00Feb 22, 18 31.809 3.50 3.50 33.423 3.50 3.50Feb 21, 19 26.710 2.75 2.75 28.618 2.75 2.75
HDFC Focused 30 Fund (Past 3 years) Dividend Option
Record Date Regular Plan Direct Plan
Cum Div NAV (`)
Dividend per Unit (`) For Cum Div NAV (`)
Dividend per Unit (`) For
Individuals & HUF Others Individuals & HUF Others
Mar 01, 17 20.219 2.00 2.00 21.216 2.00 2.00Feb 22, 18 21.508 2.25 2.25 22.914 2.25 2.25Feb 21, 19 16.853 1.75 1.75 18.257 1.75 1.75
HDFC Arbitrage Fundnormal Dividend Option (Past 3 months)
Record Date Wholesale Plan Direct Plan
Cum Div NAV (`)
Dividend per Unit (`) For Cum Div NAV (`)
Dividend per Unit (`) For
Individuals & HUF Others Individuals & HUF Others
Mar 22, 19 10.417 0.050 0.050 10.789 0.050 0.050Apr 18, 19 10.412 0.050 0.050 10.790 0.050 0.050 May 23, 19 10.422 0.050 0.050 10.807 0.050 0.050
Monthly Dividend Option (Past 3 months)
Record Date Wholesale Plan Wholesale Plan - Direct Plan
Cum Div NAV (`)
Dividend per Unit (`) For Cum Div NAV (`)
Dividend per Unit (`) For
Individuals & HUF Others Individuals & HUF Others
Mar 22, 19 10.835 0.050 0.050 10.510 0.050 0.050Apr 18, 19 10.832 0.050 0.050 10.510 0.050 0.050 May 23, 19 10.844 0.050 0.050 10.524 0.050 0.050
HDFC Growth Opportunities Fund (Past 3 years) Dividend Option
Record Date Regular Plan Direct Plan
Cum Div NAV (`)
Dividend per Unit (`) For Cum Div NAV (`)
Dividend per Unit (`) For
Individuals & HUF Others Individuals & HUF Others
Feb 23, 17 22.342 2.25 2.25 24.880 2.25 2.25Mar 01, 18 22.901 2.25 2.25 25.854 2.25 2.25Feb 28, 19 19.807 2.00 2.00 22.663 2.00 2.00
HDFC Mid-Cap Opportunities Fund (Past 3 years) Dividend Option
Record Date Regular Plan Direct Plan
Cum Div NAV (`)
Dividend per Unit (`) For Cum Div NAV (`)
Dividend per Unit (`) For
Individuals & HUF Others Individuals & HUF Others
Mar 23, 17 31.806 2.25 2.25 36.789 2.25 2.25Mar 01, 18 34.912 3.00 3.00 41.189 3.00 3.00Feb 28, 19 28.574 2.50 2.50 34.574 2.50 2.50
HDFC Small Cap Fund (Past 3 years) Dividend Option
Record Date Regular Plan Direct Plan
Cum Div NAV (`)
Dividend per Unit (`) For Cum Div NAV (`)
Dividend per Unit (`) For
Individuals & HUF Others Individuals & HUF Others
Mar 01, 17 22.892 2.00 2.00 24.040 2.00 2.00Mar 22, 18 28.810 2.75 2.75 30.776 1.00 1.00Mar 27, 19 25.955 2.50 2.50 30.135 0.99 0.99
HDFC Hybrid Equity Fund (Past 3 quarters) Dividend Option
Record Date Regular Plan Direct Plan
Cum Div NAV (`)
Dividend per Unit (`) For Cum Div NAV (`)
Dividend per Unit (`) For
Individuals & HUF Others Individuals & HUF Others
Sep 25, 18 12.214 0.320 0.320 12.822 0.320 0.320 Dec 26, 18 11.943 0.320 0.320 12.587 0.320 0.320Mar 25, 19 12.108 0.320 0.320 12.807 0.320 0.320
HDFC Balanced Advantage Fund (Past 3 months) Dividend Option
Record Date Regular Plan Direct Plan
Cum Div NAV (`)
Dividend per Unit (`) For Cum Div NAV (`)
Dividend per Unit (`) For
Individuals & HUF Others Individuals & HUF Others
Mar 25, 19 29.399 0.310 0.310 31.024 0.310 0.310Apr 25, 19 29.177 0.310 0.310 30.824 0.310 0.310 May 27, 19 30.151 0.310 0.310 31.891 0.310 0.310
HDFC TaxSaver (Past 3 years) Dividend Option(An open-ended equity linked savings scheme with a lock-in period of 3 years)
Record Date Regular Plan Direct Plan
Cum Div NAV (`)
Dividend per Unit (`) For Cum Div NAV (`)
Dividend per Unit (`) For
Individuals & HUF Others Individuals & HUF Others
Mar 16, 17 66.383 6.50 6.50 68.370 6.50 6.50Mar 15, 18 66.562 7.00 7.00 69.256 7.00 7.00Mar 14, 19 59.483 6.00 6.00 62.638 6.00 6.00
HDFC Infrastructure Fund (Past 3 years) Dividend Option
Record Date Regular Plan Direct Plan
Cum Div NAV (`)
Dividend per Unit (`) For Cum Div NAV (`)
Dividend per Unit (`) For
Individuals & HUF Others Individuals & HUF Others
Mar 23, 17 14.388 1.500 1.500 17.736 1.500 1.500Mar 15, 18 14.630 1.750 1.750 18.570 1.750 1.750Mar 27, 19 11.308 1.000 1.000 14.899 1.000 1.000
HDFC Hybrid Debt Fund Monthly Dividend Option (Past 3 months)
Record Date Regular Plan Direct Plan
Cum Div NAV (`)
Dividend per Unit (`) For Cum Div NAV (`)
Dividend per Unit (`) For
Individuals & HUF Others Individuals & HUF Others
Mar 25, 19 13.1884 0.0800 0.0741 13.7585 0.0800 0.0741Apr 25, 19 13.0583 0.0800 0.0741 13.6317 0.0800 0.0741 May 27, 19 13.2473 0.0800 0.0741 13.8391 0.0800 0.0741
Quarterly Dividend Option (Past 3 quarters)
Record Date Regular Plan Direct Plan
Cum Div NAV (`)
Dividend per Unit (`) For Cum Div NAV (`)
Dividend per Unit (`) For
Individuals & HUF Others Individuals & HUF Others
Sep 25, 18 13.9404 0.2400 0.2222 14.4729 0.2400 0.2222 Dec 26, 18 14.0426 0.2400 0.2222 - - -Mar 25, 19 14.0128 0.2400 0.2222 14.6109 0.2400 0.2222
HDFC Equity Savings Fund (Past 3 quarters) Dividend Option
Record Date Regular Plan Direct Plan
Cum Div NAV (`)
Dividend per Unit (`) For Cum Div NAV (`)
Dividend per Unit (`) For
Individuals & HUF Others Individuals & HUF Others
Sep 25, 18 11.4350 0.2210 0.2210 12.1760 0.2210 0.2210 Dec 26, 18 11.1540 0.2210 0.2210 11.9350 0.2210 0.2210Mar 25, 19 11.2450 0.2210 0.2210 12.0810 0.2210 0.2210
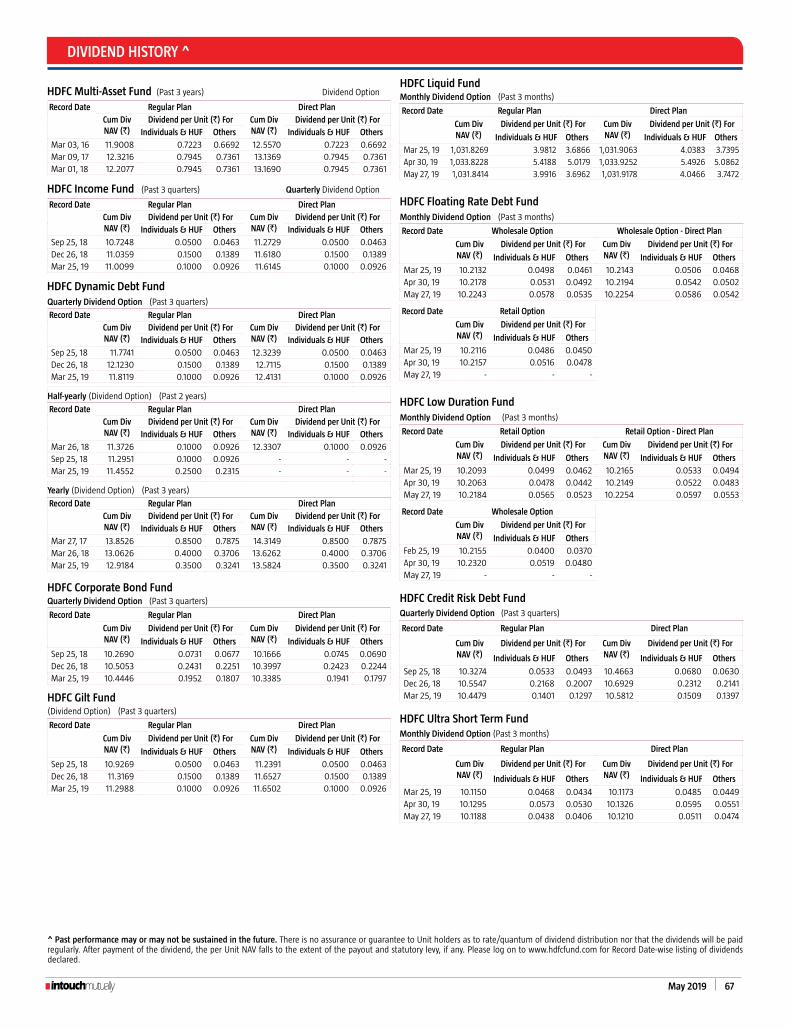
May 2019 67
DIVIDEND HISTORy ^
^ Past performance may or may not be sustained in the future. There is no assurance or guarantee to Unit holders as to rate/quantum of dividend distribution nor that the dividends will be paid regularly. After payment of the dividend, the per Unit nAV falls to the extent of the payout and statutory levy, if any. Please log on to www.hdfcfund.com for Record Date-wise listing of dividends declared.
HDFC Multi-Asset Fund (Past 3 years) Dividend Option
Record Date Regular Plan Direct Plan
Cum Div NAV (`)
Dividend per Unit (`) For Cum Div NAV (`)
Dividend per Unit (`) For
Individuals & HUF Others Individuals & HUF Others
Mar 03, 16 11.9008 0.7223 0.6692 12.5570 0.7223 0.6692Mar 09, 17 12.3216 0.7945 0.7361 13.1369 0.7945 0.7361Mar 01, 18 12.2077 0.7945 0.7361 13.1690 0.7945 0.7361
HDFC Income Fund (Past 3 quarters) Quarterly Dividend Option
Record Date Regular Plan Direct Plan
Cum Div NAV (`)
Dividend per Unit (`) For Cum Div NAV (`)
Dividend per Unit (`) For
Individuals & HUF Others Individuals & HUF Others
Sep 25, 18 10.7248 0.0500 0.0463 11.2729 0.0500 0.0463 Dec 26, 18 11.0359 0.1500 0.1389 11.6180 0.1500 0.1389Mar 25, 19 11.0099 0.1000 0.0926 11.6145 0.1000 0.0926
HDFC Dynamic Debt FundQuarterly Dividend Option (Past 3 quarters)
Record Date Regular Plan Direct Plan
Cum Div NAV (`)
Dividend per Unit (`) For Cum Div NAV (`)
Dividend per Unit (`) For
Individuals & HUF Others Individuals & HUF Others
Sep 25, 18 11.7741 0.0500 0.0463 12.3239 0.0500 0.0463 Dec 26, 18 12.1230 0.1500 0.1389 12.7115 0.1500 0.1389Mar 25, 19 11.8119 0.1000 0.0926 12.4131 0.1000 0.0926
Half-yearly (Dividend Option) (Past 2 years)
Record Date Regular Plan Direct Plan
Cum Div NAV (`)
Dividend per Unit (`) For Cum Div NAV (`)
Dividend per Unit (`) For
Individuals & HUF Others Individuals & HUF Others
Mar 26, 18 11.3726 0.1000 0.0926 12.3307 0.1000 0.0926Sep 25, 18 11.2951 0.1000 0.0926 - - -Mar 25, 19 11.4552 0.2500 0.2315 - - -
yearly (Dividend Option) (Past 3 years)
Record Date Regular Plan Direct Plan
Cum Div NAV (`)
Dividend per Unit (`) For Cum Div NAV (`)
Dividend per Unit (`) For
Individuals & HUF Others Individuals & HUF Others
Mar 27, 17 13.8526 0.8500 0.7875 14.3149 0.8500 0.7875Mar 26, 18 13.0626 0.4000 0.3706 13.6262 0.4000 0.3706Mar 25, 19 12.9184 0.3500 0.3241 13.5824 0.3500 0.3241
HDFC Corporate Bond FundQuarterly Dividend Option (Past 3 quarters)
Record Date Regular Plan Direct Plan
Cum Div NAV (`)
Dividend per Unit (`) For Cum Div NAV (`)
Dividend per Unit (`) For
Individuals & HUF Others Individuals & HUF Others
Sep 25, 18 10.2690 0.0731 0.0677 10.1666 0.0745 0.0690 Dec 26, 18 10.5053 0.2431 0.2251 10.3997 0.2423 0.2244Mar 25, 19 10.4446 0.1952 0.1807 10.3385 0.1941 0.1797
HDFC Gilt Fund(Dividend Option) (Past 3 quarters)
Record Date Regular Plan Direct Plan
Cum Div NAV (`)
Dividend per Unit (`) For Cum Div NAV (`)
Dividend per Unit (`) For
Individuals & HUF Others Individuals & HUF Others
Sep 25, 18 10.9269 0.0500 0.0463 11.2391 0.0500 0.0463 Dec 26, 18 11.3169 0.1500 0.1389 11.6527 0.1500 0.1389Mar 25, 19 11.2988 0.1000 0.0926 11.6502 0.1000 0.0926
HDFC Liquid FundMonthly Dividend Option (Past 3 months)
Record Date Regular Plan Direct Plan
Cum Div NAV (`)
Dividend per Unit (`) For Cum Div NAV (`)
Dividend per Unit (`) For
Individuals & HUF Others Individuals & HUF Others
Mar 25, 19 1,031.8269 3.9812 3.6866 1,031.9063 4.0383 3.7395Apr 30, 19 1,033.8228 5.4188 5.0179 1,033.9252 5.4926 5.0862 May 27, 19 1,031.8414 3.9916 3.6962 1,031.9178 4.0466 3.7472
HDFC Floating Rate Debt FundMonthly Dividend Option (Past 3 months)
Record Date Wholesale Option Wholesale Option - Direct Plan
Cum Div NAV (`)
Dividend per Unit (`) For Cum Div NAV (`)
Dividend per Unit (`) For
Individuals & HUF Others Individuals & HUF Others
Mar 25, 19 10.2132 0.0498 0.0461 10.2143 0.0506 0.0468Apr 30, 19 10.2178 0.0531 0.0492 10.2194 0.0542 0.0502 May 27, 19 10.2243 0.0578 0.0535 10.2254 0.0586 0.0542
Record Date Retail Option
Cum Div NAV (`)
Dividend per Unit (`) For
Individuals & HUF Others
Mar 25, 19 10.2116 0.0486 0.0450Apr 30, 19 10.2157 0.0516 0.0478 May 27, 19 - - -
HDFC Low Duration FundMonthly Dividend Option (Past 3 months)
Record Date Retail Option Retail Option - Direct Plan
Cum Div NAV (`)
Dividend per Unit (`) For Cum Div NAV (`)
Dividend per Unit (`) For
Individuals & HUF Others Individuals & HUF Others
Mar 25, 19 10.2093 0.0499 0.0462 10.2165 0.0533 0.0494Apr 30, 19 10.2063 0.0478 0.0442 10.2149 0.0522 0.0483 May 27, 19 10.2184 0.0565 0.0523 10.2254 0.0597 0.0553
Record Date Wholesale Option
Cum Div NAV (`)
Dividend per Unit (`) For
Individuals & HUF Others
Feb 25, 19 10.2155 0.0400 0.0370Apr 30, 19 10.2320 0.0519 0.0480 May 27, 19 - - -
HDFC Credit Risk Debt FundQuarterly Dividend Option (Past 3 quarters)
Record Date Regular Plan Direct Plan
Cum Div NAV (`)
Dividend per Unit (`) For Cum Div NAV (`)
Dividend per Unit (`) For
Individuals & HUF Others Individuals & HUF Others
Sep 25, 18 10.3274 0.0533 0.0493 10.4663 0.0680 0.0630 Dec 26, 18 10.5547 0.2168 0.2007 10.6929 0.2312 0.2141Mar 25, 19 10.4479 0.1401 0.1297 10.5812 0.1509 0.1397
HDFC Ultra Short Term FundMonthly Dividend Option (Past 3 months)
Record Date Regular Plan Direct Plan
Cum Div NAV (`)
Dividend per Unit (`) For Cum Div NAV (`)
Dividend per Unit (`) For
Individuals & HUF Others Individuals & HUF Others
Mar 25, 19 10.1150 0.0468 0.0434 10.1173 0.0485 0.0449Apr 30, 19 10.1295 0.0573 0.0530 10.1326 0.0595 0.0551 May 27, 19 10.1188 0.0438 0.0406 10.1210 0.0511 0.0474

68 May 2019
Disclaimer: The views expressed herein are based on internal data, publicly available information and other sources believed to be reliable, but involve uncertainties that could cause actual events to differ materially
from those expressed or implied in such statements. The document is given for general and information purpose and is neither an investment advice nor an offer to sell nor a solicitation. While due care has been
exercised while preparing this document, HDFC Asset Management Company Limited (“HDFC AMC”) does not warrant the completeness or accuracy of the information. neither HDFC AMC, nor any person connected
with it, accepts any liability arising from the use of this material. The recipient of this material should rely on their investigations and take their own professional advice.
HDFC SEnSEx ETF, HDFC Index Fund - SEnSEx Plan (“Schemes”) is based on the S&P BSE SEnSEx Index. S&P® is a registered trademark of S&P Financial Services Limited (S&P). BSE® and SEnSEx® are registered trademarks
of BSE Limited. The Schemes is not sponsored, endorsed marketed or promoted by S&P, BSE or their respective affiliates. Please refer to the Scheme Information Document for disclaimers w.r.t. S&P BSE SENSEX Index.
For HDFC nIFTY 50 ETF & HDFC Index Fund - nIFTY 50 Plan: The Scheme of HDFC Mutual Fund (the “Product(s)”) are not sponsored, endorsed, sold or promoted by India Index Services & Products Limited (“IISL”).
IISL does not make any representation or warranty, express or implied, to the owners of the Product(s) or any member of the public regarding the advisability of investing in securities generally or in the Product(s)
particularly or the ability of the nIFTY Indices to track general stock market performance in India. The relationship of IISL with HDFC Asset Management Company Limited (“the Issuer/Licensee”) is only in respect of
the licensing of the Indices and certain trademarks and trade names associated with such Indices which is determined, composed and calculated by IISL without regard to the Issuer /Licensee or the Product(s). IISL
does not have any obligation to take the needs of the Issuer/Licensee or the owners of the Product(s) into consideration in determining, composing or calculating the nIFTY Indices. IISL is not responsible for or has
participated in the determination of the timing of, prices at, or quantities of the Product(s) to be issued or in the determination or calculation of the equation by which the Product(s) is to be converted into cash. IISL
has no obligation or liability in connection with the administration, marketing or trading of the Product(s).
IISL is engaged in the business of developing, constructing, compiling, computing and maintaining various equity indices. The relationship of IISL to HDFC AMC is only in respect of the rights granted to use certain
trademarks and trade names of the Index in connection with the utilisation of the Index data relating to such Index. The Index is determined, composed and calculated by IISL without regard to HDFC AMC. IISL has
no obligation to take the needs of HDFC AMC into consideration in determining, composing or calculating the nIFTY Indices.
IISL do not guarantee the accuracy and/or the completeness of nIFTY Indices or any data included therein and they shall have no liability for any errors, omissions, or interruptions therein. IISL make no warranty,
express or implied, as to results to be obtained by HDFC AMC or any other person or entity from the use of nIFTY Indices or any data included therein. IISL make no express or implied warranties, and expressly disclaim
all warranties of merchantability or fitness for a particular purpose or use with respect to the Index or any data included therein. Without limiting any of the foregoing, IISL expressly disclaim any and all liability for
any damages or losses arising out of the use of NIFTY Indices or any data included therein by any third party, including any and all direct, special, punitive, indirect, or consequential damages (including lost profits),
even if notified of the possibility of such damages. An investor, by subscribing or purchasing an interest in the Product(s), will be regarded as having acknowledged, understood and accepted the disclaimer referred
to in Clauses above and will be bound by it.
WANT TO HAVE THE LATEST INFORMATION ABOUT US?
Visit us at www.hdfcfund.com
Telephone ServicesToll-free number: 1800 3010 6767 / 1800 419 7676
For any query or suggestions:-
Investors may contact us at:[email protected]
Distributors may contact us at:[email protected]
SMS: HDFCMF to 56767
Registered Office: HDFC House, 2nd Floor, H.T. Parekh Marg, 165-166 Backbay Reclamation, Churchgate, Mumbai - 400 020.
MUTUAL FUND INVESTMENTS ARE SUBJECT TO MARKET RISKS, READ ALL SCHEME RELATED DOCUMENTS CAREFULLy.


