May 24-Month Study Date: May 9, 2013 From: Water Resources Group, Salt Lake City To: All Colorado River Annual Operating Plan (AOP) Recipients Current Reservoir Status Reservoir April Inflow (unregulated) (acre-feet) Percent of Average (%) May 8 Midnight Elevation (feet) Reservoir Storage (acre-feet) Fontenelle 51,000 60 6472.10 127,000 Flaming Gorge 69,000 51 6020.63 3,002,000 Blue Mesa 43,000 56 7454.99 341,000 Navajo 71,000 42 6023.41 944,000 Powell 353,000 33 3596.04 11,376,000 _______________________________________________________________________ Expected Operations The operation of Lake Powell and Lake Mead in this May 2013 24-Month Study is pursuant to the December 2007 Record of Decision on Colorado River Interim Guidelines for Lower Basin Shortages and the Coordinated Operations of Lake Powell and Lake Mead (Interim Guidelines), and reflects the 2013 Annual Operating Plan (AOP). Pursuant to the Interim Guidelines, the August 2012 24-Month Study projections of the January 1, 2013, system storage and reservoir water surface elevations set the operational tier for the coordinated operation of Lake Powell and Lake Mead during 2013. Consistent with Section 6.B of the Interim Guidelines, the Lake Powell operational tier for water year 2013 is the Upper Elevation Balancing Tier. Since the April 2013 24- Month Study projected end of water year elevation at Lake Powell was below the 2013 Equalization Elevation of 3,646.0 feet and the projected end of water year elevation at Lake Mead was above elevation 1,075.0 feet, Section 6.B.1 and 6.B.4. of the Interim Guidelines provide for an annual release volume of 8.23 million acre-feet (maf) from Lake Powell during water year 2013. Consistent with Section 2.B.5 of the Interim Guidelines, the Intentionally Created Surplus (ICS) Surplus Condition is the criterion governing the operation of Lake Mead for calendar year 2013.
Transcript
May 24-Month Study Date: May 9, 2013
From: Water Resources Group, Salt Lake City To: All Colorado River Annual Operating Plan (AOP) Recipients Current Reservoir Status
_______________________________________________________________________ Expected Operations The operation of Lake Powell and Lake Mead in this May 2013 24-Month Study is pursuant to the December 2007 Record of Decision on Colorado River Interim Guidelines for Lower Basin Shortages and the Coordinated Operations of Lake Powell and Lake Mead (Interim Guidelines), and reflects the 2013 Annual Operating Plan (AOP). Pursuant to the Interim Guidelines, the August 2012 24-Month Study projections of the January 1, 2013, system storage and reservoir water surface elevations set the operational tier for the coordinated operation of Lake Powell and Lake Mead during 2013. Consistent with Section 6.B of the Interim Guidelines, the Lake Powell operational tier for water year 2013 is the Upper Elevation Balancing Tier. Since the April 2013 24-Month Study projected end of water year elevation at Lake Powell was below the 2013 Equalization Elevation of 3,646.0 feet and the projected end of water year elevation at Lake Mead was above elevation 1,075.0 feet, Section 6.B.1 and 6.B.4. of the Interim Guidelines provide for an annual release volume of 8.23 million acre-feet (maf) from Lake Powell during water year 2013. Consistent with Section 2.B.5 of the Interim Guidelines, the Intentionally Created Surplus (ICS) Surplus Condition is the criterion governing the operation of Lake Mead for calendar year 2013.
Consistent with Section 6.C.1 of the Interim Guidelines, if the August 24-Month study projects the January 1, 2014, Lake Powell elevation to be less than 3,575.0 feet and at or above 3,525.0 feet and the Lake Mead elevation to be at or above 1,025.0 feet, the operational tier for Lake Powell in water year 2014 would be the Mid-Elevation Release Tier and the water year release volume from Lake Powell would be 7.48 maf. This May 2013 24-Month study projects that, with an 8.23 maf annual release pattern in water year 2014, the January 1, 2014, Lake Powell elevation would be 3,577.27 feet and the Lake Mead elevation would be 1,107.47 feet. Therefore, the 2014 Lake Powell operational tier is not currently projected to be the Mid-Elevation Release Tier. Based on analysis of a range of inflow scenarios, the current probability of realizing an inflow volume that would result in the Mid-Elevation Release Tier in 2014 is approximately 45 percent. The Interim Guidelines are available for download at http://www.usbr.gov/lc/region/programs/strategies/RecordofDecision.pdf. The 2013 AOP is available for download at http://www.usbr.gov/uc/water/rsvrs/ops/aop/AOP13_final.pdf. Fontenelle Reservoir – Inflows to Fontenelle Reservoir for the month of April were 50,600 acre-feet (AF), or 78 percent of average. The reservoir elevation is 6472.2 feet, 38 percent of live capacity and decreasing. Inflows are averaging 750 cubic feet per second (cfs) and are expected to increase over the next few weeks as spring runoff flows enter the reservoir. Reservoir releases remain at 850 cfs and will likely remain close to this level this spring, with a small possibility of a spring peak occurring sometime in July.
Inflows for the next three months are projected to be below average: with May, June and July forecasted inflow volumes at 80,000 AF (49% of average), 165,000 AF (55% of average), and 85,000 AF (48% of average), respectively. The Colorado Basin River Forecast Center has issued the official water supply forecast for the April through July unregulated inflow volume which is 380,000 af or 52 percent of the 1981-2010 thirty-year average.
The next Fontenelle Working Group meeting is scheduled for August 22, 2013, at 10:00 am at the Joint Powers and Water Board in Green River, Wyoming. The Fontenelle Working Group is an open public forum for information exchange between Reclamation and other parties associated with the operation of Fontenelle Reservoir. The spring Fontenelle Working Group meeting was held on April 25, 2013 at Seedskadee National Wildlife Refuge. Minutes from the meeting will be posted on the Working Group webpages.
Flaming Gorge Reservoir – Unregulated inflow into Flaming Gorge Reservoir during the month of April was 68,700 acre-feet (af), or 63 percent of average. The reservoir elevation is 6020.57 feet and increasing. Observed inflows are approximately 1,025 cubic feet per second (cfs).
Forecasts remain below average and Flaming Gorge Dam is in the moderately dry hydrologic classification as outlined in the Record of Decision. Flaming Gorge Dam releases are currently steady at approximately 820 cfs, and are expected to remain at this level until spring runoff begins sometime in late May or early June. Information on spring releases will be updated throughout the next few months.
The Colorado Basin River Forecast Center has issued the official May water supply forecast for the April through July unregulated inflow volume which is 480,000 af or 49 percent of the 1981-2010 thirty-year average.
Reclamation will be involved in a cooperative experimental program this year where the capture of endangered larval razorback sucker is the “trigger” to increase releases from Flaming Gorge Dam this spring. Reclamation plans to coordinate with scientists involved in real-time monitoring on the river to determine the first appearance of larval razorback sucker. Reclamation anticipates at least 2 days notification in the event larval presence is reported and Flaming Gorge Dam releases are increased.
The spring hydrologic classification is officially in the moderately dry classification. Snowpack continues to be below average in both basins and spring weather has large impacts on runoff. Additionally, timing of the Yampa River spring peak flows and emergence of larval razor fish may not occur simultaneously, as evidenced by larval presence historically occurring as the Yampa River decreases to base flows. At this time, Reclamation is recommending operating conservatively and continuing to exercise the flexibility in the Record of Decision to operate one classification lower than indicated in the Flow Recommendations while being prepared to adjust if conditions warrant. Reclamation is currently operating in the dry hydrologic classification.
The next Flaming Gorge Working Group meeting is scheduled for August 21, 2013, at 11:00 a.m. at the new Utah Department of Natural Resources building in Vernal, Utah, located at 318 North Vernal Avenue. The Flaming Gorge Working Group is an open public forum for information exchange between Reclamation and the stake holders of Flaming Gorge Dam. The public is encouraged to attend and comment on the operations and plans presented by Reclamation at these meetings. For more information on this group and these meetings please contact Ed Vidmar at 801-379-1182.
Aspinall Unit Reservoirs – April unregulated inflow into Blue Mesa Reservoir was 43,000 acre-feet or 56 percent of average. Precipitation during April was 120 percent of average. The current inflow rate into Blue Mesa Reservoir is about 1200 cfs while reservoir releases are averaging about 1100 cfs. The reservoir elevation is currently at 7455.00 feet, which corresponds to a storage content of about 341,000 acre-feet. The latest Water Supply Forecast for Water Year 2013 has been issued and the April through July unregulated inflow is forecasted to be at 335,000 acre-feet (50% of average), this is 20,000 acre-feet higher than last month’s forecast. The May 1st forecast officially set the senior Black Canyon Water Right. Using this forecast calls for a one
day spring peak flow of 685 cfs below the tunnel diversion. Also using this same forecast for the determining the flow recommendations from the Aspinall ROD at Whitewater gage, the peak flow at that point should be 900 cfs for one day. At this time Reclamation plans to continue to operate the Aspinall Unit to meet both the Black Canyon water right and ROD recommendations. Based on this forecast and the combination of meeting water right and ROD this coming spring, Blue Mesa Reservoir is projected to not fill this runoff season. The projected fill is calculated to be about 7466.7 feet, or about 53 feet and 418,000 acre-feet short of top of active conservation pool, elevation 7519.4 feet. Releases from Crystal are currently set at 1300 cfs. The Gunnison Diversion Tunnel is currently diverting about 1,000 cfs, which results in a river flow below the diversion tunnel of approximately 300 cfs. This lower flow is a result of Reclamation trying to conserve reservoir storage for what is forecasted to be a very dry year. The last meeting of the "Aspinall Unit Working Group" was held on Thursday, April 25, 2013 starting at 1:00 PM in Reclamation’s Grand Junction Office. At this meeting, review of this winter’s reservoir operations, and plans for this spring and summer operations were discussed. These meetings are open forum discussions on the Aspinall Unit reservoir operations with many interested groups participating. Anyone needing further information about these meetings should contact Dan Crabtree in the Grand Junction Area Office at (970) 248-0652. Navajo Reservoir – As a result of increased runoff in the San Juan River Basin, the Bureau of Reclamation decreased the release from Navajo Reservoir from 350 cubic feet per second (cfs) to 250 cfs on Tuesday, May 7th. Releases are made for the authorized purposes of the Navajo Unit, and to attempt to maintain a target base flow through the endangered fish critical habitat reach of the San Juan River (Farmington to Lake Powell). The San Juan River Basin Recovery Implementation Program recommends a target base flow of between 500 cfs and 1,000 cfs through the critical habitat area. The target base flow is calculated as the weekly average of gaged flows throughout the critical habitat area. As of May 9th, the San Juan River basin above Navajo snowpack is 37% of average snow water equivalent (SWE). For the Animas River Basin it is 36%. Precipitation for the month of April throughout the San Juan River basin ranged from 50% to 70% of average. The seasonal peak SWE above Navajo was reached on March 13th and was 13.9 inches (74% of average). Observed inflow into Navajo Reservoir during the month of April was 52,524 acre-feet. Modified-unregulated inflow volume was 71,104 af, which was 49% of average. Currently, the daily observed inflow is averaging 2000 cfs. NIIP is diverting 550 cfs per day (average of the past week). The reservoir water surface elevation is at 6023 feet, which corresponds to a storage content of about 939,500 acre-feet (55% full).
The most probable modified unregulated inflow forecast for April through July at Navajo is 325,000 acre-ft (44% of average). The minimum probable modified unregulated inflow forecast for April through July at Navajo is 265,000 acre-ft (36% of average). The maximum probable modified unregulated inflow forecast for April through July at Navajo is 420,000 acre-ft (56% of average). No spring peak release will be conducted in 2013. The most recent public meeting was held April 23rd, 2013 at 1:00 PM at the Civic Center in Farmington, New Mexico (200 West Arrington Street). At this meeting, a review of forecasted hydrology, and plans for this spring and summer 2013 operations were discussed. The next public meeting is scheduled for August 27th, 2013. These meetings are open forum discussions on the operation of Navajo Reservoir with many interested groups participating. Anyone interested in the general operation of the reservoir is encouraged to attend. Please contact Ryan Christianson in Reclamation's Durango, Colorado Office at (970) 385-6590 for information about these meetings or the daily operation of Navajo Reservoir. Glen Canyon Dam / Lake Powell – Current Status The unregulated inflow volume to Lake Powell in April was 355 thousand acre-feet (kaf) (34% of average). The release volume from Glen Canyon Dam in March was 551 kaf. The end of April elevation and storage of Lake Powell were 3596.5 feet (103.5 feet from full pool) and 11.42 million acre-feet (maf) (47% of full capacity). The reservoir elevation is expected to remain within several feet of the current elevation throughout spring and summer as inflow from runoff roughly matches reservoir releases. In late summer, the reservoir elevation will begin to decline again. Current Operations The operating tier for 2013 is the Upper Elevation Balancing Tier, as establish in August 2012 and pursuant to the Interim Guidelines. Since the April projected end of water year elevation at Lake Powell was below the 2013 Equalization Elevation of 3,646.0 feet and the projected end of water year elevation at Lake Mead was above elevation 1,075.0 feet, Section 6.B.1 and 6.B.4 of the Interim Guidelines provide for an annual release volume of 8.23 maf from Lake Powell during water year 2013. Reclamation will schedule operations at Glen Canyon Dam to achieve as practicably as possible an 8.23 maf annual release volume by September 30, 2013.
Releases from Glen Canyon Dam in May are currently averaging approximately 10,000 cfs with daily fluctuations between approximately 7,500 cfs at nighttime and approximately 13,000 cfs during the daytime and consistent with the Glen Canyon Operating Criteria (Federal Register, Volume 62, No. 41, March 3, 1997). The scheduled release volume for May 2013 is 600 kaf. To accommodate airborne data collection, steady releases of approximately 8,000 cfs are planned to begin the evening of Friday May 24th and last for about one week, depending on weather and the progress of the data collection.
In June, the release volume will likely be about 800 kaf, with daily fluctuations for hydropower between approximately 9,000 cfs in the nighttime and approximately 17,000 cfs in the daytime. In July, the release volume will likely be about 848 kaf with daily fluctuations between approximately 10,000 cfs and 18,000 cfs. In addition to daily scheduled fluctuations for power generation, the instantaneous releases from Glen Canyon Dam may also fluctuate to provide 40 MW of system regulation. These instantaneous release adjustments stabilize the electrical generation and transmission system and translate to a range of about 1,100 cfs above or below the hourly scheduled release rate. Typically, fluctuations for system regulation are very short lived and balance out over the hour and do not have noticeable impacts on downstream river flow conditions. Releases from Glen Canyon Dam can also fluctuate beyond scheduled fluctuations for power generation when called upon as a partner that shares reserve requirements within the electrical generator community (i.e. balancing area). Reserves provide system reliability in the event of an unscheduled outage. Glen Canyon Dam typically maintains 43 MW of reserves (approximately 1,100 cfs). Reserve calls can be maintained for a maximum of 2 hours after which time the generation rate should be returned to the original schedule. If reserves from Glen Canyon Dam are called upon, releases from the dam can exceed scheduled levels and can have a noticeable impact on the river downstream from Glen Canyon Dam. Calls for reserves are fairly infrequent and typically are for much less than 43 MW. Inflow Forecasts and Model Projections The hydrologic forecast for Lake Powell for the April to July water supply season projects that the most probable (median) unregulated inflow volume will be 3.0 maf (42% of average based on the period 1981-2010). Due to late season snow storms over the region, the forecast increased slightly (by 0.3 maf) from last month; however, the overall water supply outlook remains significantly below average this year. The minimum probable and maximum probable forecasts are 1.75 maf (24%) and 4.25 maf (59%), respectively. Based on the current forecast, the May 24-Month study projects Lake Powell elevation will decline approximately 10 feet throughout the spring and summer and end the water year at 3587.7 feet with 10.60 maf in storage (44% capacity). The annual release volume from Lake Powell during water year 2013 is scheduled to be 8.23 maf. Reclamation will schedule operations at Glen Canyon Dam to achieve as practicably as possible an 8.23 maf annual release volume by September 30, 2013. Consistent with Section 6.C.1 of the Interim Guidelines, if the August 2013 24-Month study projects the January 1, 2014, Lake Powell elevation to be at or above 3,575.00 feet and below the equalization level of 3648.00 feet and the Lake Mead elevation to be at or above 1,075.00 feet, the operational tier for Lake Powell in water year 2014 will be the Upper Elevation Balancing Tier and the water year release volume from Lake Powell will be 8.23 maf. This May 2013 24-Month study projects that, with an 8.23 maf annual release pattern in water year 2014, the January 1, 2014 Lake Powell elevation would be 3,577.27 feet and the Lake Mead elevation would be 1,107.47 feet. Therefore, the 2014
Lake Powell operational tier is currently projected to be the Upper Elevation Balancing Tier with an annual release volume of 8.23 maf and no projected shift in April to the Equalization Tier. However, if hydrology should become slightly drier than is currently projected and the August 24-Month Study projects the January 1, 2013 Lake Powell elevation to be less than 3,575.00 feet, the Mid-Elevation Release Tier will govern and the annual release volume from Lake Powell will be 7.48 maf. Based on analysis of a range of inflow scenarios, the current probability of realizing an inflow volume that would result in the Upper Elevation Balancing Tier and an 8.23 maf annual release is approximately 55 percent and the probability for the Mid-Elevation Release Tier and a 7.48 maf annual release is approximately 45 percent. Upper Colorado River Basin Hydrology – Since 2005, the Upper Colorado River Basin has experienced significant year to year hydrologic variability. The unregulated inflow to Lake Powell, which is a good measure of hydrologic conditions in the Colorado River Basin, has averaged a water year volume of 10.22 maf (94% of average (period 1981-2010)) during the period from 2005 through 2012. The hydrologic variability during this period has been from a low water year unregulated inflow volume of 4.91 maf (45% of average) in water year 2012 to a high water year unregulated inflow volume of 15.97 maf (147% of average) in water year 2011. Based on observed inflows and current forecasts, water year 2013 unregulated inflow is expected to be 4.83 maf (45% of average), which would be the second below-average year in a row. At the beginning of water year 2013, overall reservoir storage in the Colorado River Basin had increased by approximately 4 maf compared with water year 2005, which was an improvement over the persistent drought conditions of 2000 through 2004. Total reservoir storage in the Colorado River Basin had increased from 29.8 maf (50% of capacity) at the beginning of 2005 to 33.9 maf (57 % of capacity) at the beginning of 2013. However, during this period, total Colorado Basin storage experienced year to year increases and decreases in response to wet and dry hydrology. In addition, conditions in both 2012 and 2013 have been significantly drier than average and given observed inflows and current forecasts, the projected end of water year 2013 total reservoir storage is approximately 29.4 maf (49% of capacity).
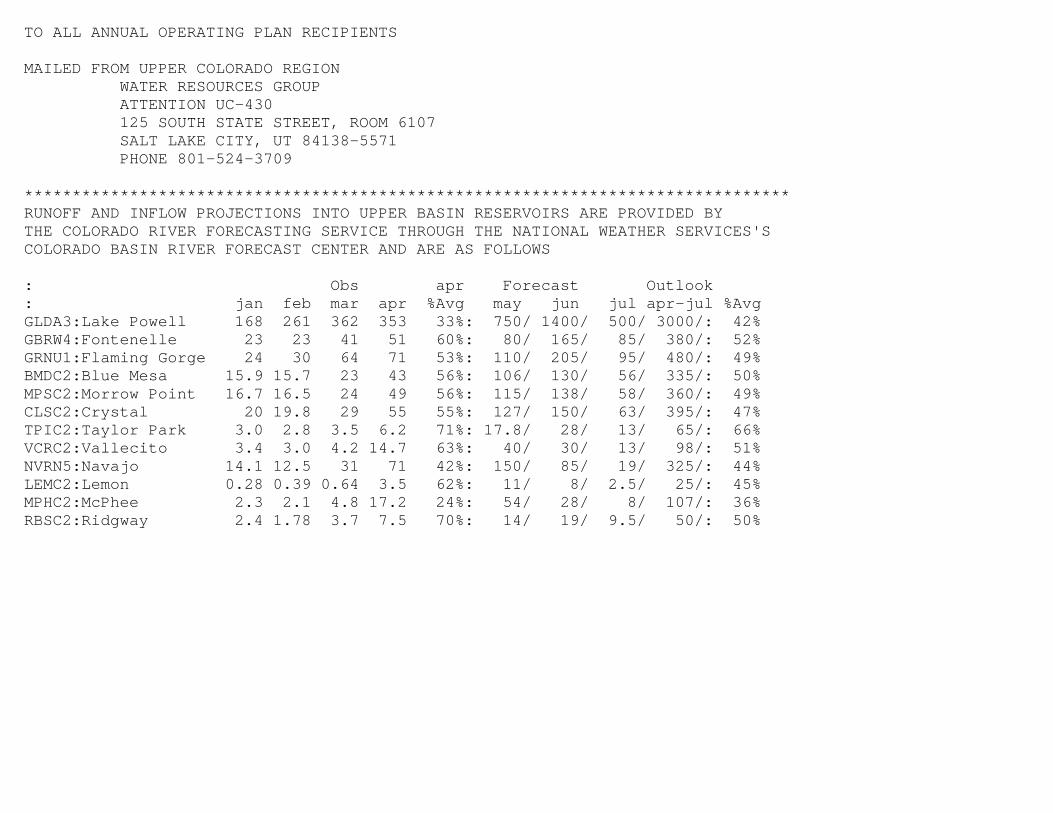
TO ALL ANNUAL OPERATING PLAN RECIPIENTS MAILED FROM UPPER COLORADO REGION WATER RESOURCES GROUP ATTENTION UC-430 125 SOUTH STATE STREET, ROOM 6107 SALT LAKE CITY, UT 84138-5571 PHONE 801-524-3709 ******************************************************************************** RUNOFF AND INFLOW PROJECTIONS INTO UPPER BASIN RESERVOIRS ARE PROVIDED BY THE COLORADO RIVER FORECASTING SERVICE THROUGH THE NATIONAL WEATHER SERVICES'S COLORADO BASIN RIVER FORECAST CENTER AND ARE AS FOLLOWS : Obs apr Forecast Outlook : jan feb mar apr %Avg may jun jul apr-jul %Avg GLDA3:Lake Powell 168 261 362 353 33%: 750/ 1400/ 500/ 3000/: 42% GBRW4:Fontenelle 23 23 41 51 60%: 80/ 165/ 85/ 380/: 52% GRNU1:Flaming Gorge 24 30 64 71 53%: 110/ 205/ 95/ 480/: 49% BMDC2:Blue Mesa 15.9 15.7 23 43 56%: 106/ 130/ 56/ 335/: 50% MPSC2:Morrow Point 16.7 16.5 24 49 56%: 115/ 138/ 58/ 360/: 49% CLSC2:Crystal 20 19.8 29 55 55%: 127/ 150/ 63/ 395/: 47% TPIC2:Taylor Park 3.0 2.8 3.5 6.2 71%: 17.8/ 28/ 13/ 65/: 66% VCRC2:Vallecito 3.4 3.0 4.2 14.7 63%: 40/ 30/ 13/ 98/: 51% NVRN5:Navajo 14.1 12.5 31 71 42%: 150/ 85/ 19/ 325/: 44% LEMC2:Lemon 0.28 0.39 0.64 3.5 62%: 11/ 8/ 2.5/ 25/: 45% MPHC2:McPhee 2.3 2.1 4.8 17.2 24%: 54/ 28/ 8/ 107/: 36% RBSC2:Ridgway 2.4 1.78 3.7 7.5 70%: 14/ 19/ 9.5/ 50/: 50%
Most Probable Inflow*
May 2013 24-Month Study
Fontenelle Reservoir
OPERATION PLAN FOR COLORADO RIVER SYSTEM RESERVOIRS
Reservoir Elev
End of Month
(Ft)
Live
Storage
(1000 Ac-Ft)
Total
Release
(1000 Ac-Ft)
Regulated
Inflow
(1000 Ac-Ft)Date
Evap
Losses
(1000 Ac-Ft)
Power
Release
(1000 Ac-Ft)
Bypass
Release
(1000 Ac-Ft)
130 62 6489.92 227 1 61 0May 2012*
189 99 6502.11 315 2 83 16Jun 2012H
92 75 6503.94 329 3 72 3Jul 2012I
36 68 6499.56 296 2 68 0Aug 2012S
23 54 6495.11 263 2 46 8Sep 2012T
825 845 15 750 94WY 2012
29 53 6491.56 238 1 25 28Oct 2012O
35 51 6489.08 221 1 22 28Nov 2012R
28 52 6485.19 196 1 52 0Dec 2012I
23 53 6479.94 166 1 53 0Jan 2013C
23 48 6475.03 141 0 48 0Feb 2013A
41 52 6472.41 129 0 52 0Mar 2013L
51 51 6472.25 128 1 51 0Apr 2013*
80 52 6477.83 155 1 52 0May 2013
165 51 6495.76 268 2 51 0Jun 2013
85 52 6499.88 298 3 52 0Jul 2013
42 54 6497.96 284 2 54 0Aug 2013
30 59 6493.72 253 2 59 0Sep 2013
631 627 14 571 56WY 2013
37 61 6490.06 229 1 48 13Oct 2013
37 59 6486.77 207 1 59 0Nov 2013
32 61 6481.97 178 1 61 0Dec 2013
30 61 6476.14 147 1 61 0Jan 2014
28 55 6470.11 120 0 55 0Feb 2014
53 64 6467.36 108 0 64 0Mar 2014
85 78 6468.95 115 1 78 0Apr 2014
164 123 6477.69 155 1 97 25May 2014
299 167 6498.17 285 2 101 65Jun 2014
178 121 6505.24 340 3 102 19Jul 2014
77 83 6504.13 331 2 83 0Aug 2014
46 77 6499.80 297 2 36 41Sep 2014
1066 1007 14 844 163WY 2014
49 70 6496.72 275 1 70 0Oct 2014
42 68 6492.99 248 1 68 0Nov 2014
32 70 6487.14 209 1 70 0Dec 2014
30 70 6480.41 169 1 70 0Jan 2015
28 63 6473.14 133 1 63 0Feb 2015
53 72 6468.48 113 0 72 0Mar 2015
85 80 6469.62 118 1 80 0Apr 2015
* Based on the Colorado River Basin Forecast Center's Most Probable Water Supply Forecast Model Run ID: 2145 Processed On: 5/9/2013 12:32:23PM
Most Probable Inflow*
May 2013 24-Month Study
Flaming Gorge Reservoir
OPERATION PLAN FOR COLORADO RIVER SYSTEM RESERVOIRS
Reservoir Elev
End of Month
(Ft)
Live
Storage
(1000 Ac-Ft)
Total
Release
(1000 Ac-Ft)
Evap
Losses
(1000 Ac-Ft)Date
Bank
Storage
(1000 Ac-Ft)
Power
Release
(1000 Ac-Ft)
Unreg
Inflow
(1000 Ac-Ft)
Jensen
Flow
(1000 Ac-Ft)
Bypass
Release
(1000 Ac-Ft)
Reg
Inflow
(1000 Ac-Ft)
159 6023.57 178 385 3108 125 8 19May 2012* 153 85
87 6023.59 87 154 3108 125 10 0Jun 2012H 188 98
84 6023.04 84 99 3088 124 12 0Jul 2012I 93 76
80 6022.19 80 90 3058 123 12 0Aug 2012S 29 60
68 6021.43 68 79 3030 122 10 0Sep 2012T 19 50
1366 1386 2278 78 20WY 2012 990 1010
52 6021.15 52 71 3020 122 7 0Oct 2012O 24 48
49 6021.23 49 75 3023 122 3 0Nov 2012R 39 55
70 6020.63 70 110 3002 121 2 0Dec 2012I 25 50
74 6020.03 74 398 2981 120 2 0Jan 2013C 24 53
67 6019.65 67 388 2967 119 2 0Feb 2013A 30 55
53 6020.19 53 109 2986 120 3 0Mar 2013L 64 76
50 6020.57 50 150 3000 121 5 0Apr 2013* 69 69
50 6021.23 50 50 3023 122 7 0May 2013 110 82
147 6019.45 147 147 2960 119 10 0Jun 2013 205 91
50 6019.43 50 50 2960 119 12 0Jul 2013 95 62
50 6019.30 50 50 2955 119 12 0Aug 2013 45 57
49 6019.29 49 49 2954 119 10 0Sep 2013 30 59
761 761 1647 75 0WY 2013 760 757
50 6019.48 50 50 2961 119 7 0Oct 2013 41 64
49 6019.83 49 49 2974 120 3 0Nov 2013 43 65
50 6020.14 50 50 2985 120 2 0Dec 2013 35 63
50 6020.64 50 50 3002 121 2 0Jan 2014 40 71
46 6021.29 46 46 3025 122 2 0Feb 2014 45 72
50 6022.89 50 50 3083 124 3 0Mar 2014 102 113
49 6024.81 49 49 3153 127 5 0Apr 2014 134 126
104 6027.20 104 104 3242 130 8 0May 2014 245 204
155 6029.52 155 155 3330 134 10 0Jun 2014 390 257
104 6030.41 104 104 3365 135 14 0Jul 2014 210 153
104 6029.88 104 104 3345 134 13 0Aug 2014 89 95
100 6029.26 100 100 3321 134 11 0Sep 2014 55 87
911 911 911 79 0WY 2014 1429 1370
104 6028.50 104 104 3291 132 7 0Oct 2014 59 81
100 6027.82 100 100 3266 131 3 0Nov 2014 51 77
104 6026.99 104 104 3234 130 2 0Dec 2014 35 73
104 6026.35 104 104 3210 129 2 0Jan 2015 40 80
94 6025.95 94 94 3195 129 2 0Feb 2015 45 80
104 6026.34 104 104 3210 129 3 0Mar 2015 102 122
100 6026.94 100 100 3232 130 5 0Apr 2015 134 128
* Based on the Colorado River Basin Forecast Center's Most Probable Water Supply Forecast Model Run ID: 2145 Processed On: 5/9/2013 12:32:23PM
Most Probable Inflow*
May 2013 24-Month Study
Taylor Park Reservoir
OPERATION PLAN FOR COLORADO RIVER SYSTEM RESERVOIRS
Reservoir Elev
End of Month
(Ft)
Live
Storage
(1000 Ac-Ft)
Total
Release
(1000 Ac-Ft)
Regulated
Inflow
(1000 Ac-Ft)Date
* May 2012 15 8 9316.40 81
H Jun 2012 9 15 9312.87 75
I Jul 2012 6 14 9307.53 66
S Aug 2012 4 12 9302.28 58
T Sep 2012 4 6 9300.80 56
WY 2012 80 95
O Oct 2012 4 4 9301.04 57
R Nov 2012 3 3 9301.07 57
I Dec 2012 3 3 9301.09 57
C Jan 2013 3 3 9301.07 57
A Feb 2013 3 3 9301.01 57
L Mar 2013 3 3 9301.27 57
* Apr 2013 6 4 9302.94 59
May 2013 18 6 9310.60 71
Jun 2013 28 13 9319.51 86
Jul 2013 13 15 9318.17 84
Aug 2013 8 15 9313.71 76
Sep 2013 5 12 9309.46 69
WY 2013 97 84
Oct 2013 5 5 9309.86 70
Nov 2013 5 5 9309.90 70
Dec 2013 5 5 9310.01 70
Jan 2014 4 5 9309.92 70
Feb 2014 4 5 9309.48 69
Mar 2014 4 5 9309.44 69
Apr 2014 9 12 9307.35 66
May 2014 28 16 9314.95 78
Jun 2014 42 20 9326.77 100
Jul 2014 20 20 9326.85 100
Aug 2014 10 20 9321.77 90
Sep 2014 7 20 9314.67 78
WY 2014 144 135
Oct 2014 7 14 9310.21 70
Nov 2014 5 6 9309.65 69
Dec 2014 5 6 9308.81 68
Jan 2015 4 6 9307.75 66
Feb 2015 4 6 9306.30 64
Mar 2015 4 6 9305.26 63
Apr 2015 9 6 9307.10 65
* Based on the Colorado River Basin Forecast Center's Most Probable Water Supply Forecast Model Run ID: 2145 Processed On: 5/9/2013 12:32:23PM
Most Probable Inflow*
May 2013 24-Month Study
Blue Mesa Reservoir
OPERATION PLAN FOR COLORADO RIVER SYSTEM RESERVOIRS
Reservoir Elev
End of Month
(Ft)
Live
Storage
(1000 Ac-Ft)
Total
Release
(1000 Ac-Ft)
Regulated
Inflow
(1000 Ac-Ft)Date
Evap
Losses
(1000 Ac-Ft)
Power
Release
(1000 Ac-Ft)
Bypass
Release
(1000 Ac-Ft)
UnReg
Inflow
(1000 Ac-Ft)
* May 2012 66 71 7482.82 527 1 71 0 74
H Jun 2012 50 93 7476.82 483 1 93 0 45
I Jul 2012 39 90 7469.29 431 1 90 0 30
S Aug 2012 36 79 7462.48 387 1 79 0 28
T Sep 2012 21 67 7454.82 340 1 67 0 19
WY 2012 442 793 7 793 0 427
O Oct 2012 20 33 7452.55 327 0 33 0 20
R Nov 2012 19 19 7452.39 326 0 19 0 19
I Dec 2012 18 16 7452.65 328 0 16 0 18
C Jan 2013 16 15 7452.77 328 0 15 0 16
A Feb 2013 16 15 7452.95 329 0 15 0 16
L Mar 2013 23 16 7454.12 336 0 0 23
* Apr 2013 41 38 7454.46 338 1 38 0 43
May 2013 94 62 7459.73 370 1 62 0 106
Jun 2013 115 70 7466.70 414 1 70 0 130
Jul 2013 58 95 7460.79 376 1 95 0 56
Aug 2013 43 95 7451.86 323 1 95 0 35
Sep 2013 35 69 7445.55 288 1 69 0 28
WY 2013 497 543 6 527 0 510
Oct 2013 31 43 7443.18 276 0 43 0 32
Nov 2013 28 14 7445.87 290 0 14 0 28
Dec 2013 25 15 7447.79 300 0 15 0 26
Jan 2014 24 15 7449.48 310 0 15 0 24
Feb 2014 23 13 7451.26 320 0 13 0 22
Mar 2014 36 16 7454.69 339 0 16 0 36
Apr 2014 80 28 7463.25 392 1 28 0 77
May 2014 209 118 7476.60 481 1 118 0 221
Jun 2014 239 36 7502.68 684 1 36 0 261
Jul 2014 117 94 7505.27 705 1 94 0 117
Aug 2014 73 121 7499.39 656 1 121 0 63
Sep 2014 51 89 7494.53 617 1 89 0 38
WY 2014 937 601 8 601 0 946
Oct 2014 46 52 7493.66 610 1 52 0 38
Nov 2014 32 23 7494.76 619 0 23 0 31
Dec 2014 27 64 7490.00 581 0 64 0 26
Jan 2015 26 67 7484.61 540 0 67 0 24
Feb 2015 25 60 7479.80 505 0 60 0 22
Mar 2015 38 32 7480.51 510 0 32 0 36
Apr 2015 74 54 7483.17 529 1 54 0 77
* Based on the Colorado River Basin Forecast Center's Most Probable Water Supply Forecast Model Run ID: 2145 Processed On: 5/9/2013 12:32:23PM
Most Probable Inflow*
May 2013 24-Month Study
Morrow Point Reservoir
OPERATION PLAN FOR COLORADO RIVER SYSTEM RESERVOIRS
Reservoir Elev
End of Month
(Ft)
Total
Release
(1000 Ac-Ft)
Blue Mesa
Release
(1000 Ac-Ft)Date
Side
Inflow
(1000 Ac-Ft)
Power
Release
(1000 Ac-Ft)
Bypass
Release
(1000 Ac-Ft)
Unreg
Inflow
(1000 Ac-Ft)
Live
Storage
(1000 Ac-Ft)
Total
Inflow
(1000 Ac-Ft)
76 112 7154.07 79 79 6 71 0May 2012* 80
93 113 7154.59 93 93 1 93 0Jun 2012H 45
90 114 7155.86 89 89 0 90 0Jul 2012I 31
80 113 7154.84 80 80 0 79 0Aug 2012S 28
68 109 7150.03 71 71 0 67 0Sep 2012T 19
814 811 811 21 793 0WY 2012 447
34 104 7142.80 40 40 1 33 0Oct 2012O 22
20 108 7148.49 16 16 1 19 0Nov 2012R 20
17 106 7146.50 18 18 1 16 0Dec 2012I 18
16 105 7144.75 17 17 1 15 0Jan 2013C 17
15 105 7144.30 16 16 1 15 0Feb 2013A 17
17 105 7144.36 17 17 1 16 0Mar 2013L 24
44 107 7146.71 42 42 6 38 0Apr 2013* 49
71 112 7153.73 66 66 9 62 0May 2013 115
78 112 7153.73 78 78 8 70 0Jun 2013 138
97 112 7153.73 97 97 2 95 0Jul 2013 58
98 112 7153.73 98 98 3 95 0Aug 2013 38
71 112 7153.73 71 71 2 69 0Sep 2013 30
578 575 575 35 543 0WY 2013 545
45 112 7153.73 45 45 2 43 0Oct 2013 34
16 112 7153.73 16 16 2 14 0Nov 2013 30
17 112 7153.73 17 17 2 15 0Dec 2013 28
17 112 7153.73 17 17 2 15 0Jan 2014 27
16 112 7153.73 16 16 3 13 0Feb 2014 25
20 112 7153.73 20 20 4 16 0Mar 2014 40
39 112 7153.73 39 39 11 28 0Apr 2014 88
144 112 7153.73 144 144 26 118 0May 2014 247
56 112 7153.73 56 56 20 36 0Jun 2014 281
100 112 7153.73 100 100 6 94 0Jul 2014 123
124 112 7153.73 124 124 3 121 0Aug 2014 67
92 112 7153.73 92 92 3 89 0Sep 2014 41
686 686 686 85 601 0WY 2014 1030
55 112 7153.73 55 55 3 52 0Oct 2014 41
25 112 7153.73 25 25 2 23 0Nov 2014 33
66 112 7153.73 66 66 2 64 0Dec 2014 28
69 112 7153.73 69 69 2 67 0Jan 2015 27
63 112 7153.73 63 63 3 60 0Feb 2015 25
36 112 7153.73 36 36 4 32 0Mar 2015 40
65 112 7153.73 65 65 11 54 0Apr 2015 88
* Based on the Colorado River Basin Forecast Center's Most Probable Water Supply Forecast Model Run ID: 2145 Processed On: 5/9/2013 12:32:23PM
Most Probable Inflow*
May 2013 24-Month Study
Crystal Reservoir
OPERATION PLAN FOR COLORADO RIVER SYSTEM RESERVOIRS