Overview The consumer durables industry is one of the most dynamic and fastest growing industries in India and is considered to be one of the largest in the world. Indian Consumer Durables sector is vast in scope – including a range of household and industrial electronics – air conditioners, televisions, washing machines, refrigerators, air coolers, laptops and personal computers and a wide range of other household/domestic appliances & conveniences. Approximately over 65% of the total revenue for the sector is generated from the urban population and the rest from rural India. The consumer durable market, has in the past registered strong growth of about 16.3% CAGR between FY12 and FY17 to cross Rs 1 trillion (US $ 15.5 billion) in FY17 (IBEF estimate). In FY17 alone, the industry registered a growth of about 24% y-o-y. However exports of major durables registered a decline of over 11% y-o-y during the year. Also, in FY18, consumer electronics exports from India reached Rs 2,334 crore vis-à-vis Rs 3,913 crore during the same period last year registering a decline of over 40%. The consumer durables index (which has a broader set of commodities include including some automobiles) under the Index of Industrial Production (IIP) grew 8.6% in FY18 (Apr-Feb) vis-à-vis a 0.1% growth registered during the same period last year. Outlook: Historically, growth in consumer durables has closely related with the growth in GDP. Going forward, as country’s GDP is expected to improve to 7.5% in FY19 (CARE Ratings expectations) from 6.6% in FY18, we expect the consumer durables market to register growth of about 6.5-8.5% on back of improvement in domestic consumption. Government’s focus on Housing for all, rural electrification, Power For All with the objective to make affordable housing and power available to all and facilitate 24X7 power supply is expected to be one of the key drivers for strong growth in the consumer durables industry. Also, with growing awareness, easier access to credit, improving standard of living and changing lifestyles, higher disposable incomes and normal monsoon expected during the year, the consumption of durables is expected to register growth going forward. May 7, 2018 I Industry Research Consumer Durables Industry - Structure & Prospects Contact: Madan Sabnavis Chief Economist [email protected]91-22-67543489 Darshini Kansara Research Analyst [email protected]91-22-6754 3679 Mradul Mishra [email protected]91-022-6754 3515 Disclaimer: This report is prepared by CARE Ratings Ltd. CARE Ratings has taken utmost care to ensure accuracy and objectivity while developing this report based on information available in public domain. However, neither the accuracy nor completeness of information contained in this report is guaranteed. CARE Ratings is not responsible for any errors or omissions in analysis/ inferences/ views or for results obtained from the use of information contained in this report and especially states that CARE Ratings has no financial liability whatsoever to the user of this report.
Transcript
Overview
The consumer durables industry is one of the most dynamic and
fastest growing industries in India and is considered to be one of
the largest in the world. Indian Consumer Durables sector is vast
in scope – including a range of household and industrial
electronics – air conditioners, televisions, washing machines,
refrigerators, air coolers, laptops and personal computers and a
wide range of other household/domestic appliances &
conveniences. Approximately over 65% of the total revenue for
the sector is generated from the urban population and the rest
from rural India.
The consumer durable market, has in the past registered strong
growth of about 16.3% CAGR between FY12 and FY17 to cross Rs
1 trillion (US $ 15.5 billion) in FY17 (IBEF estimate). In FY17 alone,
the industry registered a growth of about 24% y-o-y. However
exports of major durables registered a decline of over 11% y-o-y
during the year. Also, in FY18, consumer electronics exports from
India reached Rs 2,334 crore vis-à-vis Rs 3,913 crore during the
same period last year registering a decline of over 40%. The
consumer durables index (which has a broader set of
commodities include including some automobiles) under the
Index of Industrial Production (IIP) grew 8.6% in FY18 (Apr-Feb)
vis-à-vis a 0.1% growth registered during the same period last
year.
Outlook:
Historically, growth in consumer durables has closely related with
the growth in GDP. Going forward, as country’s GDP is expected
to improve to 7.5% in FY19 (CARE Ratings expectations) from
6.6% in FY18, we expect the consumer durables market to
register growth of about 6.5-8.5% on back of improvement in
domestic consumption.
Government’s focus on Housing for all, rural electrification,
Power For All with the objective to make affordable housing and
power available to all and facilitate 24X7 power supply is
expected to be one of the key drivers for strong growth in the
consumer durables industry. Also, with growing awareness,
easier access to credit, improving standard of living and
changing lifestyles, higher disposable incomes and normal
monsoon expected during the year, the consumption of durables
Consumer Durables are a category of consumer products that do not wear out quickly and have to be purchased
frequently because they are made to last for an extended period of time (typically over 3 years). The consumer durable
goods can be broadly classified under 2 categories shown below:
Chart 1: Consumer Durables Industry in India
Source: IBEF, Industry
Under consumer appliances/domestic appliances, the industry is further classified under ‘White goods’ and ‘Brown goods’.
White goods are large household appliances that mainly include Air Conditioners, Washing machines and Refrigerators and
other kitchen appliances while the brown goods have mostly kitchen appliances and other cooking range products.
Consumer Electronics are equipment intended for routine use, most often in entertainment, communications
and workplace productivity.
Consumer Durables
1. Consumer Appliances
A. White Goods
- Washing machines
- Refrigerators
- Air conditioners
B. Brown Goods
- Microwave ovens
- Cooking range
- Mixers & Grinders
- Juicers
- Irons
- Blenders
- Toasters
- Coffee makers
- Sewing machines
- Electric Fans
- Cleaning equipments
- Dryers
- Heating appliances
- Dishwashers
- Vacuum cleaners
- Water coolers
- Water purifiers
- Other Domestic Appliances
2. Consumer Electronics
- Televisions & Home theatre systems
- Audio & Video systems
- Personal computers & peripherals
- Digital Cameras
- Mobile Phones & accessories
- Laptops & accessories
- Tablets
- Gaming Consoles
- DVD & MP3 players
- Audio equipments
- Speakers
Industry Research I Consumer Durables – May 2018
3
Some of the key consumer durables brands in India are: Whirlpool, Blue Star, Carrier, Godrej India, Bajaj Electricals, Orient,
Philips, Samsung, Sony, Hitachi India Limited, Sharp India Limited, Tata, LG, Onida, Toshiba India Private Limited, Videocon,
and Voltas etc.
Note: For analysis purposes, CARE Ratings has excluded consumer durables such as readymade garments, kitchenware like
vessels, automobiles, gold and diamond gems & jewellery, stationery items, footwear, etc that is covered by the Ministry of
Statistics and Programme Implementation in the Index of Industrial Production (IIP). CARE Ratings reference to consumer
durables includes goods that generally are associated with use of electricity.
Major players in the Industry
Player Product range
BlueStar ACs, refrigerators, specialty cooling products including mortuary chambers and cold storage
Daikin ACs and cooling equipment
Godrej Refrigerators, ACs, washing machines, microwave ovens, DVD players, digital-imaging products and audio-visual products
Hitachi ACs and refrigerators
LG TVs, audio-visual solutions, computers, mobile phones, refrigerators, washing machines, microwave ovens, vacuum cleaners and ACs
Onida LCDs, washing machines, DVD players, ACs, microwave ovens, mobile phones, projectors and display products
Philips TVs, home theatre systems, DVD players, audio products, personal care products, household products, computers and phones
Samsung TVs, home theatre systems, DVD players, mobile phones, digital cameras, camcorders, refrigerators, ACs, washing machines, microwave ovens and computers
Sony TVs, projectors, DVD players, audio systems, home theatre systems, digital cameras, camcorders, computers, video-gaming products and recording media
Videocon TVs, DVD players, microwave ovens, refrigerators, washing machines, ACs and power backup solutions
Whirlpool Refrigerators, washing machines, microwave ovens, water purifiers and power backup solutions
Industry Research I Consumer Durables – May 2018
4
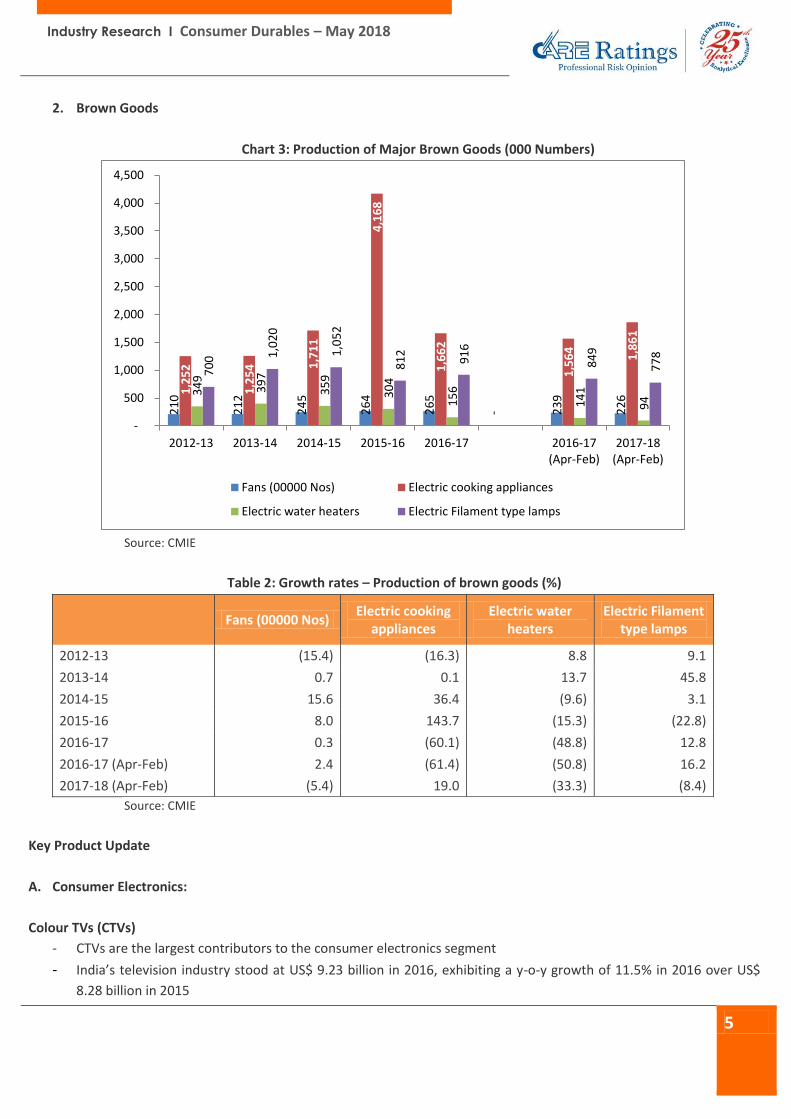
Production of Consumer Durables
1. White Goods
Chart 2: Production of White Goods (000 Numbers)
Source: CMIE
Table 1: Growth rates – Production of white goods (%)
Refrigerators Air Conditioners Washing & Laundry
Machines
2012-13 12.2 -8.5 17.0
2013-14 -4.2 16.4 24.2
2014-15 12.2 26.5 14.4
2015-16 -0.8 -2.0 10.3
2016-17 10.1 10.9 13.2
2016-17 (Apr-Feb) 11.7 12.8 12.6
2017-18 (Apr-Feb) 3.0 4.9 5.1
Source: CMIE
The production of white goods over the last 5 years has shown inconsistent growth rates. While the demand for
refrigerators and air-conditioners depend mainly on the weather, demand for washing and laundry machines depends on
the level of disposable income in the households. In FY18, with near normal monsoon in the country, the demand for
refrigerators and air-conditioners remained subdued.
In terms of ACs, of the total consumption, imports stand at about 45-50% annually while exports remain negligible. For
Refrigerators, imports form a marginal 1-2% share of the total consumption of the country and the exports form a small
Note: For ACs - financial results of 5 listed Air conditioner players, for domestic appliances - financial results of 14 listed domestic
appliance players while for electronics – financial results of 10 listed electronics players has been considered
- Net sales of consumer durables registered only a marginal increase of 1.4% y-o-y in FY18 (Apr-Dec) over a 15%
growth registered last year during the same period, with air-conditioners sales registering a slower growth of
about 13.7% y-o-y (27.8%), domestic appliances sales growing by just about 2.8% y-o-y (20.9%) and sales of
electronics registering a decline of about 11.4% y-o-y (1.2%).
- Operating profits increased by a marginal 2.2% in FY18 (Apr-Dec) vis-à-vis a sharp 22.2% increase registered last
year. Operating profits were skewed by the weak performance of air-conditioners and electronics segment players
during the period. However, domestic appliances players registered a growth, however, lower, of about 9% as
compared with a growth of 16.3% increase in FY17 (Apr-Dec)
- However, contrary to sales and operating profits, net profits have recorded a sharp increase of over 80% during
the period led by performance of air-conditioner players and electronics players, where profits doubled in FY18
(Apr-Dec) period. Also, domestic appliances registered growth of about 33% y-o-y during the period. Lower
depreciation and interest costs supported the net profits growth of durables players.
- Operating margins remained largely stable at 9.6% in FY18 (Apr-Dec) compared with same period last year.
Operating margins of domestic appliances players and electronics players expanded by about 60 basis points
respectively while margins of AC players contracted by about 90 basis points during the period.
- Net margins of consumer durables expanded by over 300 basis points led by an expansion of about 700 basis
points in margins of AC players followed by over 100 basis points expansion in margins of domestic appliances
players and about 75 basis points expansion in margins of the electronics players.
Industry Research I Consumer Durables – May 2018
12
Investments
According to the data released by the Department of Industrial Policy and Promotion (DIPP), the electronics sector attracted foreign direct investment (FDI) worth US$ 1.84 billion between April 2000 and December 2017. Following are some recent investments and developments in the Indian consumer market sector.
A. Chinese phone manufacturer, Xiaomi Corporation, is planning to invest about US$ 1 billion in 100 Indian start-ups
over the coming five years, with an aim to make an ecosystem of apps surrounding its smartphone brand.
B. Japan-based imaging major, Nikon, expects India to be one of its top five markets in the world over the coming 3-4
years as it retains its lead in the DSLR segment and expands its retail presence in India by adding 10-15 Nikon
Experience Zone stores.
C. Intex Technologies will invest around Rs 60 crore (US$ 9.27) in 2018 in technology software and Internet of Things
(IoT) startups in India in order to create an ecosystem for its consumer appliances and mobile devices
D. In May 2017 Havells completed acquisition of Lloyd consumer durables business for an enterprise value of Rs
1,600 crore (US$ 248.2 million)
E. In January 2018, Panasonic started its first refrigerator plant in India with an annual production capacity of 500,000
units with an investment of Rs 115 crore (US$ 17.76 million).
F. In August 2017, V-Guard acquired 49.43 per cent stake in GUTS Electro-Mech
G. In October 2017, Flipkart launched its private label ‘Marq’ for selling large appliances in India.
Source: IBEF, Industry
Duties & Taxes
A. Goods and Services Tax (GST)
With the implementation of the GST from July 1, 2018, the tax rates of various durables has seen varied movements. While
major consumer durables (ACs, refrigerators and washing machines) are included in the highest tax slab of 28% (durables
considered to be a luxury category), several other consumer goods currently fall under the 18% bracket.
Table 4: GST rates of major consumer durables
Product Rate
Refrigerators, freezers and other refrigerating or freezing equipment, electric or other 28%
Air-conditioning machines 28%
Household or laundry-type washing machines 28%
Computer monitors not exceeding 20 inches, Set top Box for Television (TV) 18%
Digital cameras and video camera recorders other than CCTV 28%
Telephones for cellular networks or for other wireless networks 12%
Mobile Phones 18%
Wrist-watches, pocket-watches and other watches 18%
Industry Research I Consumer Durables – May 2018
13
Video games consoles and Machines 28%
Electric instantaneous or storage water heaters and immersion heaters 28%
Stoves, ranges, grates, cookers (including those with subsidiary boilers for central heating), barbecues, braziers, gas-rings, plate warmers and similar non-electric domestic appliances, and parts thereof, of iron or steel
18%
Electro-mechanical domestic appliances 28%
Source: CBEC
- The consumer durables industry has urged the government to look into the revision of rates to 18% for all
appliances and consumer durables to boost demand in the country.
B. Import Duty
In order to give a push to the ‘Make in India’ initiative and curb the rising imports, the government recently (December
2017) increased basic customs duty on major electronic goods.
Table 5: Change in customs duty of major consumer durables
Category Old Rate (%) New Rate (%)
Microwaves, ovens 10 20
Mobile phones, smartphones 10 15
TV cameras, digital camera etc 10 15
CCTV/IP camera 10 15
TV sets 10 20
LED lamps 10 20
Electricity meters 10 15
LCD/LED/OLED/TV panels Exempted 7.5
Source: Industry
In January 2018, consumer durables and home appliance makers have sought upward revision (to 20% from current 10%)
in custom duty of major durables such as air-conditioners, washing machines and refrigerators to encourage local
manufacturing. Also, the Consumer Electronics and Appliances Manufacturers Association (CEAMA) has asked the
government to levy custom duty on the printed circuit board (PCB) so as to encourage domestic manufacturing of
smartphones.
Industry Research I Consumer Durables – May 2018
14
Government Policy & Outlook:
- After registering a muted growth in FY18, the consumer durables industry is expecting reduction in GST rates from
the existing 28% to 18% so as to boost demand for the industry.
- The Government of India's policies and regulatory frameworks such as relaxation of license rules and approval of
51% foreign direct investment (FDI) in multi-brand and 100% in single-brand retail are some of the major growth
drivers for the consumer market
- Demand for durables like refrigerators and other consumer electronic goods are likely to witness growing demand
in the coming years in the rural markets with the government planning to invest significantly in rural
electrification. Under the Budget Scheme FY19, the government retained its focus on rural economy by continuing
the pro-poor and pro-farmer schemes
- The government’s focus on rural electrification under the Deendayal Upadhyayaa Gram Jyoti Yojana (DDUGJY)
with total outlay of Rs 756 bn (US$ 12 billion) over FY14-19 and Power For All (a joint initiative by Government of
India (GoI) and state governments) with the objective to make power available to all and facilitate 24X7 power
supply. This scheme has been one of the key drivers for strong growth in the consumer durables industry. With
increasing number of villages being electrified each year and the government’s target to achieve Power for All by
FY19; CARE Ratings expects demand for consumer durables to register a growth rate of about 6.5-8.5% on back
of expected improvement in GDP during the year.
- Also, with growing awareness, easier access to credit, improving standard of living and changing lifestyles,
higher disposable incomes in the hand of rural population on back of higher MSPs for kharif crops as announced in
the Budget FY19 and normal monsoon expected during the year, the consumption is expected to register a growth
going forward.
CORPORATE OFFICE: CARE RATINGS LIMITED (Formerly known as CREDIT ANALYSIS & RESEARCH LIMITED) Corporate Office: 4th Floor, Godrej Coliseum, Somaiya Hospital Road, Off Eastern Express Highway, Sion (East), Mumbai - 400 022. Tel: +91-22-6754 3456 I Fax: +91-22-6754 3457 E-mail: [email protected] I Website: www.careratings.com