Pilar Zueras: Universitat Autònoma de Barcelona | [email protected]Pau Miret Gamundi: Universitat Autònoma de Barcelona | [email protected]Reis. Rev.Esp.Investig.Sociol. ISSN-L: 0210-5233. Nº 144, Octubre - Diciembre 2013, pp. 139-152 Mayores que viven solos: una panorámica a partir de los censos de 1991 y 2001 Elderly Who Live Alone: An Overview Based on the 1991 and 2001 Censuses Pilar Zueras y Pau Miret Gamundi doi:10.5477/cis/reis.144.139 Palabras clave Cambio demográfico • Características demográficas • Censo • Europa • Personas mayores • Formas de convivencia Resumen El artículo analiza la evolución de la vida en solitario de las personas de 65 a 84 años no casadas y que no cohabitan en pareja entre 1991 y 2001 en siete países europeos (España, Francia, Grecia, Hungría, Portugal, Rumanía y Suiza). Para ello se utilizan microdatos censales procedentes de IPUMS (Integrated Public Use Microdata Series). Se examina el papel de cinco variables en la probabilidad de vivir solo frente a la de corresidir con otras personas y se investiga si la evolución observada se debe a cambios en la composición de la población. Adoptamos la regresión logística como técnica de estandarización con los datos censales. Los resultados muestran que los patrones regionales observados permanecen cuando se controla por todas las variables y que se da un aumento generalizado de la vida en solitario en 2001 en todos los países salvo en Rumanía, donde hubiera disminuido de no ser por los cambios en la composición de la población. La estructura demográfica (sexo, edad y estado civil) no modifica significativamente las proporciones observadas a nivel temporal o regional. En contraste, las variaciones de estructura en cuanto a las variables socioeconómicas (nivel educativo y relación con la actividad) son clave para la explicación de una parte del cambio observado. Key words Population Change • Population Characteristics • Census • Europe • Elderly • Living arrangements Abstract This article analyses the development of single-person living arrangements amongst unmarried people aged between 65 and 84 years old who did not live with a partner between 1991 and 2001 in seven European countries (Spain, France, Greece, Hungary, Portugal, Romania and Switzerland). To do so, census micro data provided by IPUMS (Integrated Public Use Microdata Series) were used. The role of five variables with regard to the probability of living alone versus living with others was examined. It was investigated whether the observed development was due to changes in the population composition. Logistic regression was used as a standardisation technique with the census data. Results showed that, after controlling for all the variables, the observed regional patterns remain the same, and that the proportion of elderly living alone increased in 2001 in all countries but Romania where, if the population composition had not changed, this proportion would have diminished. The demographic structure (by gender, age and marital status) did not significantly modify the observed proportions either over time or at a regional level. In contrast, the variations of the structure regarding the socio-economic variables (educational level and employment status) were key to explain part of the observed change. Cómo citar Zueras, Pilar y Pau Miret Gamundi (2013). «Mayores que viven solos: una panorámica a partir de los censos de 1991 y 2001». Revista Española de Investigaciones Sociológicas, 144: 139-152. (http://dx.doi.org/10.5477/cis/reis.144.139) La versión en inglés de este artículo puede consultarse en http://reis.cis.es y http://reis.metapress.com
Transcript
Pilar Zueras: Universitat Autònoma de Barcelona | [email protected] Miret Gamundi: Universitat Autònoma de Barcelona | [email protected]
Reis. Rev.Esp.Investig.Sociol. ISSN-L: 0210-5233. Nº 144, Octubre - Diciembre 2013, pp. 139-152
Mayores que viven solos: una panorámicaa partir de los censos de 1991 y 2001
Elderly Who Live Alone: An Overview Based on the 1991 and 2001 Censuses
Pilar Zueras y Pau Miret Gamundi
doi:10.5477/cis/reis.144.139
Palabras claveCambio demográfi co• Características demográfi cas • Censo • Europa • Personas mayores • Formas de convivencia
ResumenEl artículo analiza la evolución de la vida en solitario de las personas de 65 a 84 años no casadas y que no cohabitan en pareja entre 1991 y 2001 en siete países europeos (España, Francia, Grecia, Hungría, Portugal, Rumanía y Suiza). Para ello se utilizan microdatos censales procedentes de IPUMS (Integrated Public Use Microdata Series). Se examina el papel de cinco variables en la probabilidad de vivir solo frente a la de corresidir con otras personas y se investiga si la evolución observada se debe a cambios en la composición de la población. Adoptamos la regresión logística como técnica de estandarización con los datos censales. Los resultados muestran que los patrones regionales observados permanecen cuando se controla por todas las variables y que se da un aumento generalizado de la vida en solitario en 2001 en todos los países salvo en Rumanía, donde hubiera disminuido de no ser por los cambios en la composición de la población. La estructura demográfi ca (sexo, edad y estado civil) no modifi ca signifi cativamente las proporciones observadas a nivel temporal o regional. En contraste, las variaciones de estructura en cuanto a las variables socioeconómicas (nivel educativo y relación con la actividad) son clave para la explicación de una parte del cambio observado.
Key wordsPopulation Change• Population Characteristics• Census • Europe• Elderly • Living arrangements
AbstractThis article analyses the development of single-person living arrangements amongst unmarried people aged between 65 and 84 years old who did not live with a partner between 1991 and 2001 in seven European countries (Spain, France, Greece, Hungary, Portugal, Romania and Switzerland). To do so, census micro data provided by IPUMS (Integrated Public Use Microdata Series) were used. The role of fi ve variables with regard to the probability of living alone versus living with others was examined. It was investigated whether the observed development was due to changes in the population composition. Logistic regression was used as a standardisation technique with the census data. Results showed that, after controlling for all the variables, the observed regional patterns remain the same, and that the proportion of elderly living alone increased in 2001 in all countries but Romania where, if the population composition had not changed, this proportion would have diminished. The demographic structure (by gender, age and marital status) did not signifi cantly modify the observed proportions either over time or at a regional level. In contrast, the variations of the structure regarding the socio-economic variables (educational level and employment status) were key to explain part of the observed change.
Cómo citarZueras, Pilar y Pau Miret Gamundi (2013). «Mayores que viven solos: una panorámica a partir de los censos de 1991 y 2001». Revista Española de Investigaciones Sociológicas, 144: 139-152.(http://dx.doi.org/10.5477/cis/reis.144.139)
La versión en inglés de este artículo puede consultarse en http://reis.cis.es y http://reis.metapress.com
Reis. Rev.Esp.Investig.Sociol. ISSN-L: 0210-5233. Nº 144, Octubre - Diciembre 2013, pp. 139-152
140 Mayores que viven solos: una panorámica a partir de los censos de 1991 y 2001
INTRODUCCIÓN1
Numerosos trabajos se han ocupado de las formas de convivencia de los adultos mayo-res en Europa desde una perspectiva com-parada internacional, pero raramente se in-cluye a España. Los estudios previos dibujan una tipología regional en la que se observan diferentes patrones que responden a una gradación desde los países del norte de Euro-pa, donde predominan formas de conviven-cia más independientes (vivir en solitario o solo con la pareja), pasando por los del oes-te y del este hasta los países del sur, donde tiene más peso la cohabitación con hijos o con otras personas.
Este artículo examina los patrones de las formas de convivencia de las personas ma-yores no casadas y sin pareja co-residente en varios países europeos y sitúa a España en este contexto. Para ello se ha trabajado con muestras censales. Se han seleccionado siete países (Francia, Suiza, Hungría, Ruma-nía, Grecia, Portugal y España) en las dos últimas ediciones censales, levantadas alre-dedor de 1991 y de 2001. La muestra anali-zada cuenta con 927.412 casos y está cons-tituida por individuos mayores de 64 años y menores de 85 años, residentes en hogares
1 Este artículo forma parte de la tesis de la primera autora que, bajo la dirección de la Dra. Anna Cabré, se realiza en el marco del Doctorado de Demografía de la Univer-sidad Autónoma de Barcelona. Su elaboración ha sido posible gracias al programa FPU del Ministerio de Cien-cia e Innovación que, asimismo, ha fi nanciado una es-tancia en el Institut National d’Etudes Démographiques (INED) (París), donde se ha desarrollado parte de este estudio, en el marco del Projet Census. El artículo se inscribe dentro del proyecto del plan nacional de I+D+I 2012-2014 con referencia CSO2011-29136 titulado «Da-tos e indicadores para mejorar la estimación de la fe-cundidad del momento», y en el de I+D+I 2011-2013 con referencia CSO2010-21028 (subprograma SOCI) titulado «Dinámica del mercado de trabajo y formación familiar en España durante el cambio de siglo». Agrade-cer también la cesión de los datos al IPUMS-IECM, así como a los organismos estadísticos productores de las fuentes de datos originales. Finalmente, agradecemos a quienes lo han evaluado anónimamente y al consejo editorial por sus preciados comentarios.
privados, que en el momento de la observa-ción no estaban casados ni convivían en pa-reja. El objeto de esta selección es analizar las pautas de convivencia de las personas mayores en ausencia de pareja, es decir, si cuando no conviven con su pareja viven so-los o en compañía de otras personas, sean éstas descendientes, otros familiares o indi-viduos no emparentados.
En defi nitiva, el propósito de este artículo es examinar las pautas de convivencia de los mayores que no conviven en pareja, observar la variabilidad entre países y los cambios que se han producido entre 1991 y 2001. Se ana-liza el efecto de unos factores sociodemográ-fi cos sobre la probabilidad de vivir solo frente a la de convivir con otras personas y se inves-tiga si los cambios en el tiempo se explican por la modifi cación de la estructura de la po-blación. En concreto, las preguntas de inves-tigación son las siguientes: ¿cuáles son las pautas de convivencia de las personas mayo-res que no conviven en pareja en Europa y dónde se sitúa España en este contexto? ¿Cómo ha cambiado la propensión a vivir solo en esos países entre 1991 y 2001? ¿De qué manera inciden las variables sociodemográfi -cas en la propensión a vivir solo? ¿En qué medida el aumento de la proporción de las personas que viven solas se debe a cambios en la estructura de la población?
REVISIÓN BIBLIOGRÁFICA
Las diferencias observadas entre las regio-nes europeas se han intentado explicar des-de dos vertientes: una pone el acento en la polaridad norte-sur en cuanto a los distintos tipos de Estados de bienestar, otra se centra en la debilidad o fortaleza de los lazos fami-liares (Reher, 1998). Ambas perspectivas han sido criticadas por excesivamente simplis-tas, pues no se ajustan a la variabilidad re-gional observada (Gaymu et al., 2006). Los estudios que analizan la evolución temporal confi rman la tendencia similar en todos los
Reis. Rev.Esp.Investig.Sociol. ISSN-L: 0210-5233. Nº 144, Octubre - Diciembre 2013, pp. 139-152
Pilar Zueras y Pau Miret Gamundi 141
países europeos hacia el aumento de la vida en solitario, lo que no desmiente las diferen-cias observadas entre regiones (Palloni, 2001; Pampel, 1992). Tomassini et al. (2004) muestran que entre 1970 y 1990 se observa un aumento en la proporción de personas viviendo solas, mientras que en la década de los años noventa se incrementa la propor-ción de las que viven con su pareja sin otras personas, a pesar de las mayores tasas de divorcio durante este periodo.
La evolución paralela en todos los países europeos mantiene las diferencias que des-de el pasado se han señalado entre regiones europeas: cuando los mayores no viven so-los o con su pareja, la corresidencia con hijos u otras personas es una modalidad más fre-cuente en los países del sur de Europa, mien-tras que en los países del norte de Europa lo es la institucionalización, situándose los paí-ses del centro y del este en posiciones inter-medias (De Jong Gierveld, De Valk y Blom-mesteijn, 2001; Delbès, Gaymu y Springer, 2006; Festy y Rychtarikova, 2008; Tomassini et al., 2004).
En España se ha observado un aumento de la vida en solitario entre los mayores en detrimento de la corresidencia con hijos y con otras personas (Pérez Ortiz, 2006; Abellán et al., 2007). El censo de 1991 recogía un 16,2% de solitarios entre los mayores de 64 años, que en 2001 aumentaron a 19,6% (López Do-blas, 2005). Este estudio destaca que el fenó-meno no se debe a un debilitamiento de los lazos familiares que erosionen la solidaridad intergeneracional en el seno de las familias, sino a una mejora en las condiciones de vida y en el bienestar material de los mayores.
En líneas generales, la literatura coincide en el efecto que las variables demográfi cas tienen en el tipo de hogar formado por las personas de más edad. Así, el tipo de convi-vencia entre sexos es diferente, pues la ma-yor longevidad femenina conlleva un elevado porcentaje de viudedad entre las mujeres, por lo que ellas viven más solas y menos en
pareja. En Europa en 2000 solo un 20% de las mujeres mayores de 74 años vivía en pa-reja, frente a un 65% de los hombres de la misma edad (Delbès et al., 2006). Por ello, las diferencias en función del sexo se difuminan cuando se tiene en cuenta el estado civil. Así, independientemente del sexo, los que están casados conviven muy mayoritariamente en pareja (lo que no deja de ser una explicación endógena, pues los casados residen prácti-camente siempre con su cónyuge), mientras que la situación más común entre los viudos y los divorciados es la vida en solitario, aun-que estas últimas proporciones difi eren sig-nifi cativamente entre los países del norte y del sur de Europa (De Jong Gierveld, De Valk y Blommesteijn, 2001; Delbès, Gaymu y Springer, 2006). Asimismo se percibe una menor propensión a vivir con hijos entre los divorciados (Aquilino, 1990; Pezzin y Scho-ne, 1999), así como una menor probabilidad de vivir solos y mayor de residir en institucio-nes de los solteros (Delbès, Gaymu y Sprin-ger, 2006).
La edad también está relacionada fuerte-mente con las formas de convivencia de los mayores, pues a partir de los 75 años la vida independiente disminuye con la edad. Los motivos que se aducen son variados, así los relativos a la mala salud o a la limitación fun-cional (Festy y Rychtarikova, 2008; Pezzin y Schone, 1999; Zueras y Ajenjo, 2010). Sea por fragilidad o por soledad, los más ancia-nos viven más frecuentemente en institucio-nes o cohabitan con hijos u otras personas. Así, a partir de los 75 años la institucionaliza-ción es una opción cada vez más frecuente con la edad entre las personas que no tienen cónyuge, incluso a igual estado de salud auto-declarado. Sin embargo, la presencia de la institucionalización varía según los países, siendo menor en los del este y del sur de Europa que en los del norte y del oeste (Del-bès, Gaymu y Springer, 2006).
Finalmente, también las características socioeconómicas son discriminantes en las formas de convivencia de los adultos mayo-
Reis. Rev.Esp.Investig.Sociol. ISSN-L: 0210-5233. Nº 144, Octubre - Diciembre 2013, pp. 139-152
142 Mayores que viven solos: una panorámica a partir de los censos de 1991 y 2001
res. Así, un elevado nivel de instrucción o altos ingresos están asociados a una mayor independencia residencial (Palloni, 2001). Aunque es cierto que un nivel educativo ele-vado está relacionado con una mayor espe-ranza de vida libre de discapacidad (Robine, Romieu y Cambois, 1999), se observa el mis-mo efecto entre los mayores de 74 años con discapacidad: la corresidencia con otras per-sonas diferentes de la pareja es menos fre-cuente también entre los que tienen un ma-yor nivel educativo, con independencia de su estado civil (Festy y Rychtarikova, 2008). Otros estudios apuntan que los pensionistas tienen una mayor probabilidad de vivir solos que los que no están percibiendo una pen-sión (Wolf, 1995), lo que sugiere que la inde-pendencia económica favorece la indepen-dencia residencial.
Todas estas variables se han podido tener en cuenta, por lo que nuestro modelo incluirá el sexo, el estado civil, la edad, el nivel de instrucción y la relación con la actividad. Por el contrario, en la fuente de datos utilizada no existe información sobre otros factores deter-minantes de la forma de convivencia entre las personas mayores puestos de relieve en la literatura, como son el estado de salud o la discapacidad funcional (Borsch-Supan, Kot-likoff y Morris, 1988; Worobey y Angel, 1990; Zueras y Ajenjo, 2010), la renta (Bishop, 1986; Mutchler y Burr, 1991) y el haber tenido hijos (Gaymu et al., 2006; Iacovou, 2000).
FUENTES Y METODOLOGÍA
Se trabaja con microdatos censales proce-dentes de IPUMS-IECM (Integrated Public Use Microdata Series - Integrated European Census Microdata). Se han seleccionado los dos últimos censos (levantados alrededor de 1991 y de 2001) de siete países europeos, que podrían agruparse en tres grandes regio-nes: Europa del Oeste (Francia y Suiza), Euro-pa del Este (Hungría y Rumanía) y Europa del Sur (Grecia, Portugal y España).
La principal problemática del método comparativo radica precisamente en la ar-monización de los datos, desde la defi nición de los conceptos básicos (véase Egidi y Fes-ty, 2006). A pesar de las recomendaciones internacionales, la convergencia de los cen-sos europeos hacia un modelo único es complicada, ya que existe un confl icto entre la continuidad temporal intranacional y la comparabilidad transnacional (Eggerickx y Bégeot, 1993).
La población de estudio
La población objeto de estudio son los ma-yores de 64 años y menores de 852, residen-tes en hogares privados3, cuyo estado civil era soltero, divorciado4 o viudo y que no convivían en pareja de hecho en el momento de observación. Se examina la forma de con-vivencia de estos mayores a través del aná-lisis de una variable dicotómica cuyas moda-lidades son: 1) vivir solo o 2) corresidir con otras personas que no son su pareja. La muestra contempla un total de 927.412 indi-viduos. Como podemos ver en la tabla 1, la gran mayoría de la muestra son mujeres, viu-das y pensionistas, de lo que podemos infe-rir que son mujeres que cobran la pensión de viudedad.
2 La razón de no considerar el grupo de edad de 85 y más años estriba en que para el censo español de 1991 éste es un grupo abierto, con lo que no sería posible incluir la variable «edad simple» en el modelo explicati-vo, tal y como es nuestra intención. 3 Se debe tener presente que al no poder considerar los residentes en hogares colectivos existe un fi ltro de selección en la población observada, pues en los paí-ses del oeste la población en peor estado de salud puede que haya salido de observación al ser institucio-nalizada, a diferencia de los países del sur de Europa, donde las normas de solidaridad familiar y cuidado de los mayores revelan una menor aceptación de la insti-tucionalización (Daatland y Herlofson, 2003; Tomassini et al., 2004).4 Como se explicará en el siguiente apartado, en algunos países en la categoría de divorciados se incluye a los separados.
Reis. Rev.Esp.Investig.Sociol. ISSN-L: 0210-5233. Nº 144, Octubre - Diciembre 2013, pp. 139-152
Pilar Zueras y Pau Miret Gamundi 143
Variables independientes
Se ha realizado un análisis multivariado me-diante regresión logística para cada uno de los países, en el que se han incluido las seis variables independientes siguientes:
1. El periodo de observación en dos catego-rías: circa 1991 y circa 2001, puesto que no todos los censos fueron levantados en el mismo momento5.
2. El sexo.
3. La edad. Esta variable ha sido considera-da de manera continua, por ello en la tabla 1 se describe la misma con la media de edad observada en las distintas muestras. En el modelo el efecto de la edad se capta a través de dos factores: la edad simple (edad a edad) y la edad al cuadrado.
4. El estado civil, distinguiendo solteros, viudos y divorciados.
El tratamiento del estado civil no es ho-mogéneo en todos los censos empleados en este estudio. En gran parte de los países se recoge la situación legal. Salvo Portugal, donde se retiene la situación de facto, y España, Grecia y Hungría, que incluyen la posibilidad de declararse separado6. Así, para Portugal y España en ambos censos, y para Grecia y Hungría en 2001, la pobla-ción separada está dentro del ámbito de estudio. En el resto de países está fuera.
5. El nivel educativo se ha reducido a tres categorías: bajo (que agrupa a los que no han completado la educación primaria), medio (que engloba a los que tienen es-tudios primarios o secundarios comple-
5 La mayor parte de estos censos data de 1991 y 2001, excepto los de Francia (que son de 1990 y 1999), Suiza (1990 y 2000) y Rumanía (1992 y 2002).6 El IPUMS ofrece información detallada sobre el pro-ceso de armonización de las variables y su comparabi-lidad, así como de las variables originales. La informa-ción referente al estado civil está disponible en https://international.ipums.org/international-action/varia-bles/173763.
tos) y alto (para los que han completado estudios universitarios).
El uso del nivel de instrucción también ha supuesto tomar algunas decisiones y trabajar en el proceso de armonización de variables. Estamos estudiando a indi-viduos de generaciones antiguas, que se escolarizaron en un periodo previo a la gran expansión educativa, cuando el fi -nalizar estudios primarios ya suponía una sensible diferencia y la obtención de una titulación universitaria era muy poco fre-cuente (véase la tabla 1). Hubiera sido preferible considerar cuatro categorías (distinguiendo los que han completado los estudios primarios de los que han fi -nalizado los secundarios), sin embargo, la diversidad, tanto en la recogida de la in-formación como en los sistemas educati-vos para esta variable, imposibilitó la dis-tinción de estas cuatro categorías para todas las muestras censales.
6. Finalmente, la relación con la actividad, que considera tres diferentes posibilida-des: recibir una pensión, estar empleado u otra situación. También en esta variable la armonización entre países no ha sido sencilla.
Se considera pensionista a quien está per-cibiendo una pensión de jubilación, viudedad, discapacidad u otras que estén destinadas al mismo fi n. No se incluye a los que viven de rentas de su patrimonio, royalties, etc., que se recogen en la categoría de «otra situación», junto a los que se declaran amas de casa, dependientes de otros entes públicos o priva-dos, o inactivos por otros motivos. Esta divi-sión es consistente en casi todos los censos estudiados, salvo excepciones, las cuales no se han podido subsanar aun recurriendo a las variables originales7.
7 En algunos casos, los institutos estadísticos no facilitan todas las variables. Además, las que ofrecen no son siem-pre las que se derivan directamente del cuestionario, sino que en ocasiones han sido elaboradas a posteriori.
Reis. Rev.Esp.Investig.Sociol. ISSN-L: 0210-5233. Nº 144, Octubre - Diciembre 2013, pp. 139-152
144 Mayores que viven solos: una panorámica a partir de los censos de 1991 y 2001TA
BLA
1.
Est
ruct
ura
de
la m
uest
ra. P
rop
orci
ón d
e p
obla
ción
par
a ca
da
varia
ble
(%)
FR
AN
CIA
GR
EC
IAH
UN
GR
ÍAP
OR
TU
GA
LR
UM
AN
ÍAE
SP
AÑ
AS
UIZ
AE
ST
ÁN
DA
R
1991
2001
1991
2001
1991
2001
1991
2001
1991
2001
1991
2001
1991
2001
Viv
en s
olos
75,3
278
,64
44,6
450
,65
54,5
462
,30
46,0
252
,06
53,6
653
,61
40,5
950
,86
77,2
584
,61
58,9
3
(pp.
dife
renc
ia)
(3.3
1)(6
.01)
(7.7
7)(6
.04)
(-0.
05)
(10.
27)
(7.3
6)
Muj
eres
80,8
778
,61
81,8
181
,17
82,7
582
,64
79,1
979
,41
81,1
580
,11
79,1
977
,32
79,8
978
,67
Eda
d m
edia
75,0
374
,41
74,6
674
,07
74,2
874
,06
74,4
774
,59
74,0
973
,84
74,7
174
,93
74,8
174
,90
79,9
1
Est
ado
civi
l
solte
ro15
,18
17,1
911
,11
12,6
97,
956,
5617
,67
17,4
65,
635,
1723
,05
21,5
121
,36
19,7
214
,10
viud
o77
,94
72,6
085
,94
81,4
084
,18
81,2
977
,22
76,1
690
,12
89,2
375
,54
74,8
468
,89
65,4
779
,78
divo
rcia
do6,
8810
,20
2,95
5,92
7,87
12,1
55,
116,
394,
265,
601,
413,
659,
7414
,82
6,12
Niv
el d
e in
stru
cció
n
Baj
o50
,15
33,8
151
,05
41,9
68,
812,
8168
,67
60,0
322
,70
18,0
661
,45
46,6
61,
246,
0836
,85
Med
io47
,05
61,2
846
,44
54,4
189
,70
92,8
730
,02
37,9
374
,65
78,7
136
,38
51,9
596
,61
90,4
160
,23
Alto
2,80
4,91
2,51
3,63
1,48
4,32
1,32
2,04
2,65
3,23
2,17
1,39
2,15
3,51
2,92
Rel
ació
n co
n la
act
ivid
ad
Pen
sión
78,5
180
,32
89,6
083
,16
93,7
297
,69
86,4
989
,83
84,0
091
,07
88,0
691
,79
95,1
040
,21
85,7
3
Em
plea
do1,
571,
062,
512,
430,
661,
073,
564,
143,
955,
361,
692,
474,
894,
932,
66
Otr
os19
,92
18,6
27,
9014
,41
5,61
1,23
9,94
6,03
12,0
53,
5710
,25
5,73
0,01
54,8
611
,61
N11
2.42
814
1.56
944
.151
53.3
3431
.381
34.1
8724
.248
26.5
1210
0.51
212
2.07
394
.086
109.
280
16.8
5216
.799
927.
412
TM(%
)4,
25,
05,
05,
05,
05,
010
,010
,010
,010
,05,
05,
05,
05,
0
TM (
%):
Tam
año
de
la m
uest
ra c
ensa
l pro
por
cion
ada
por
el I
PU
MS
Fuen
te:
Ela
bor
ació
n p
rop
ia a
par
tir d
e d
atos
de
IPU
MS
-IE
CM
.
Reis. Rev.Esp.Investig.Sociol. ISSN-L: 0210-5233. Nº 144, Octubre - Diciembre 2013, pp. 139-152
Pilar Zueras y Pau Miret Gamundi 145
Las proporciones de población convivien-do sola pueden estar afectadas por una dife-rente composición en la estructura de la po-blación mayor de 64 años en cada uno de los periodos y de los países. La tabla 1 presenta la estructura de las muestras para cada una de las variables consideradas, en cada país y periodo. En este sentido, apenas se aprecian cambios entre la muestra de 1991 y la de 2001 en cuanto a la composición por sexo y la estructura por edad. Sin embargo, en gene-ral, entre los diez años que separan uno y otro recuento censal se aprecia un incremento en el número relativo de divorciados; de manera complementaria el porcentaje de viudos dis-minuye ligeramente y el de solteros se man-tiene bastante estable. Pero la evolución más destacada se observa en el nivel de instruc-ción, con un mayor peso del nivel medio y un leve aumento del nivel alto, salvo en Suiza (donde se incrementa el nivel educativo bajo y desciende el medio) y en España, donde disminuye un poco el nivel alto. Asimismo, otra variación signifi cativa es el aumento de pensionistas, excepto en Grecia y en Suiza. En defi nitiva, puesto que la composición por sexo, edad y estado civil es muy similar en 1991 y 2001, son los cambios en las otras variables, a saber, la estructura por nivel edu-cativo y relación con la actividad los que po-drían explicar parte de los cambios en la pre-valencia de la vida en solitario.
Metodología de análisis
El análisis multivariado mediante regresión logística permite obtener el efecto neto de cada una de las variables una vez controlado por el resto de variables incluidas en el mode-lo. Se calcula la probabilidad de vivir en soli-tario frente a la de corresidir con otras perso-nas, en función de cada una de las variables independientes. Asimismo, permite obtener proporciones estandarizadas del fenómeno estudiado, es decir, una vez que se ha elimi-nado el efecto de estructura según las otras variables independientes consideradas en el modelo (Jovell, 1995; Menacho, 2002).
RESULTADOS
Vivir solo: el modelo de cada país
Vemos así que la ordenación en la probabili-dad de una persona entre 65 y 84 años de vivir sola una vez controlados los efectos de estructura hubiese sido idéntica a la obser-vada: en un primer grupo la Europa central, con Suiza y Francia (con proporciones del 78 y 75% respectivamente); en un segundo grupo Europa oriental, con Hungría y Ruma-nía (con proporciones del 62 y 57% respec-tivamente); y en tercer lugar, Europa del sur, Grecia, Portugal y España (con proporciones del 51, 47 y 38% respectivamente). Unas proporciones que en la tabla 2 están estan-darizadas dentro de cada país, es decir, cuya razón no cabe buscar en absoluto en la variación de ningún factor de los que in-tervienen en el modelo. En conclusión, las posiciones regionales no se ven en absoluto corregidas por la estructura por sexo, edad, estado civil, nivel de instrucción o relación con la actividad de los distintos países.
En segundo lugar, ante la observación de que la proporción de gente mayor convivien-do sola se ha incrementado entre 1991 y 2001 en todos los países analizados con excepción de Rumanía, donde se ha mantenido estable (tabla 1), se puede afi rmar ahora que esta ma-yor propensión a vivir solo fue fruto de un cambio en el patrón cultural en toda Europa, pues de haberse mantenido una estructura estable en relación a todas las demás varia-bles consideradas, el incremento hubiese sido muy similar (tabla 2). A pesar de lo com-probado para Rumanía, este país no supone una excepción, pues aunque la estructura so-ciodemográfi ca presionó para que las propor-ciones disminuyeran (ya que de haberse man-tenido una estructura estable, las proporciones estandarizadas hubiesen caído del 58 al 56%, tal y como se deduce de la tabla 2), las pro-porciones observadas se mantuvieron esta-bles (tabla 1): en defi nitiva, el patrón cultural superó el efecto de la estructura.
Reis. Rev.Esp.Investig.Sociol. ISSN-L: 0210-5233. Nº 144, Octubre - Diciembre 2013, pp. 139-152
146 Mayores que viven solos: una panorámica a partir de los censos de 1991 y 2001
Cuando focalizamos la atención en el gé-nero, vemos que España se sitúa afín a un modelo centroeuropeo y distante al sudeuro-peo. Así, mientras que el modelo francés, suizo y español presenta una mayor proba-bilidad por parte de las mujeres a vivir solas (una vez se ha controlado por el resto de las variables incluidas en el modelo), por el con-trario, en el resto de países la mayor proba-bilidad de vivir en soledad se da entre los varones (tabla 2).
En general, el patrón por edad es similar para todos los países y señala un ligero aumen-to en la probabilidad de vivir solo hasta los 75 años, edad a partir de la cual la probabi-lidad disminuye, con la excepción de Francia y Suiza, para los que se estabiliza. Por ello, el ranking que se ha establecido entre un país y otro se mantiene para todas las eda-
des del abanico de observación, desde los 65 a los 84 años, sin excepción.
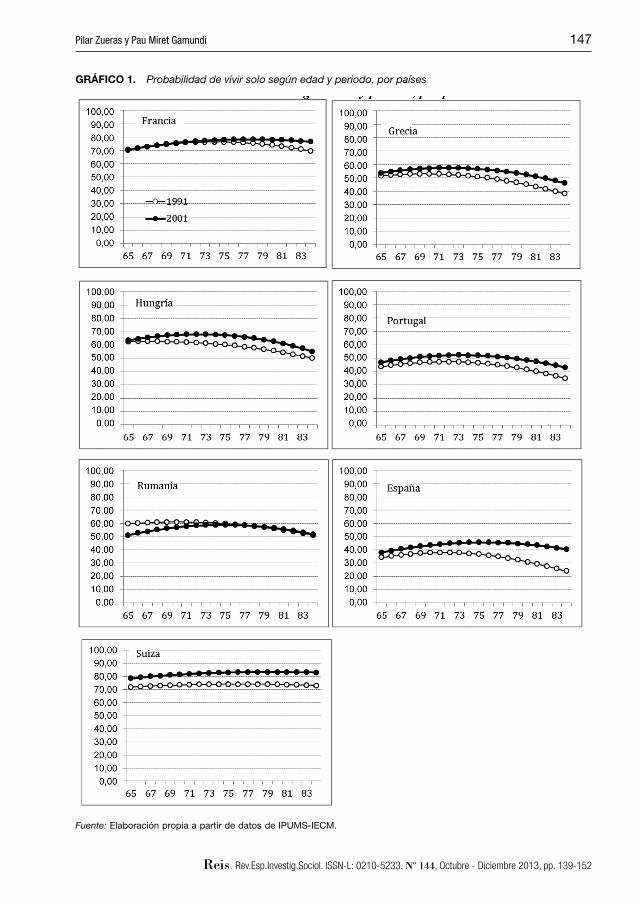
No obstante, mientras que en la tabla 2 se asume que el efecto de la edad es similar en ambos periodos, en los valores represen-tados en el gráfi co 1 se ha sustituido la edad y el momento como variables separadas por su interacción, con el objetivo de examinar si existe un efecto cohorte: ¿es plausible pen-sar que parte del cambio observado se deba a un reemplazo generacional, es decir, al he-cho de que las generaciones más recientes presenten un comportamiento diferente al de las más antiguas? La conclusión general es que no existe interacción sustancial entre la edad y el periodo: a grandes trazos, la pro-babilidad de vivir solo entre 1991 y 2001 aumenta para todos los grupos de edad. Así, el incremento en las proporciones estandari-
TABLA 2. Proporción estandarizada intrarregional de vivir solo y no corresidir con otras personas diferentesdel cónyuge o pareja
Francia Grecia Hungría Portugal Rumania España Suiza
Fuente: Elaboración propia a partir de datos de IPUMS-IECM.
Reis. Rev.Esp.Investig.Sociol. ISSN-L: 0210-5233. Nº 144, Octubre - Diciembre 2013, pp. 139-152
Pilar Zueras y Pau Miret Gamundi 147
GRÁ FICO 1. Pr obabilidad de vivir solo según edad y periodo, por países
Fuente: Elaboración propia a partir de datos de IPUMS-IECM.
Reis. Rev.Esp.Investig.Sociol. ISSN-L: 0210-5233. Nº 144, Octubre - Diciembre 2013, pp. 139-152
148 Mayores que viven solos: una panorámica a partir de los censos de 1991 y 2001
zadas de gente mayor viviendo sola en lugar de convivir con otras personas se produjo en Suiza, Grecia y Portugal de manera idéntica sea cual sea el grupo de edad considerado. Aun así, se observa que en Francia, Hungría y, muy en especialmente, en España el aumen-to ha sido mayor cuanta más edad tenía la población observada, hasta el punto de que en el primer país las diferencias solo son sig-nifi cativas entre los más mayores (gráfi co 1). Finalmente, en el caso de Rumanía la menor proporción de hogares unipersonales entre 1991 y 2001 se aprecia únicamente entre quienes tenían entre 65 y 71 años.
Lo más interesante en España es el efecto del reemplazo generacional. Si trazamos una línea imaginaria entre los 70 años en 1991 y 80 en 2001 (que pertenecen a una misma cohorte), o entre los de 74 años en 1991 y 84 en 2001, vemos que para una misma genera-ción la proporción de los que viven en solitario no ha disminuido con la edad. En conclusión, en España, para las generaciones más recien-tes y dentro de una misma cohorte, se ha mantenido en el ciclo vital la proporción de los que viven en solitario.
En relación al estado civil, el modelo compartido por Francia, Suiza, España y Portugal apunta a la menor probabilidad de vivir solo para los solteros, una intermedia para la viudedad y la mayor para los divor-ciados. En contraste en Grecia y Rumanía la menor probabilidad se observó entre los viudos y la mayor, esta sí como en el mode-lo anterior, entre los divorciados. Finalmen-te, el modelo húngaro en la relación entre vivir solo y el estado civil es idiosincrático: estar divorciado no presenta una probabili-dad signifi cativamente diferente a estar sol-tero, y los viudos tienen una probabilidad menor de vivir en un hogar unipersonal que los otros estados.
El nivel educativo tiene un efecto positivo en todos los países, de tal manera que cuan-to mayor grado de instrucción, mayor proba-bilidad de vivir solo. La importancia de esta
variable fue menor en Portugal y en España, pues las diferencias entre quienes tenían ba-jos estudios y aquellos con estudios medios no fueron tan contrastadas como en los de-más países. Además de posibles interpreta-ciones sobre la preferencia por una mayor independencia entre aquellos más educa-dos, esta relación puede deberse en parte a la combinación de otros fenómenos que aquí no se han podido controlar. Así, un mayor nivel de instrucción está relacionado con una mayor esperanza de vida libre de discapaci-dad y con un estatus socioeconómico más elevado, lo que supone el acceso a mayor renta, condiciones ambas favorecedoras de la independencia residencial.
Menos uniforme es el efecto de la rela-ción con la actividad laboral: de hecho, esta variable es la que señala más las diferencias de comportamiento entre la Europa central, la del este y la del sur. En el sur se da una gradación de mayor a menor en la probabili-dad de vivir solo de quienes disfrutan de una pensión, los empleados y aquellos fuera de estas dos categorías. En el caso específi co de España la probabilidad de vivir solo de los pensionistas es extraordinariamente superior a la de los otros dos grupos. Europa central coincide con el anterior modelo en que la mayor probabilidad es entre los pensionis-tas, pero los empleados muestran una menor proporción de solitarios que la categoría de «otros», en contraste con lo que sucedía en la Europa del Sur. Por último, la Europa del Este se caracteriza por la sustancialmente mayor probabilidad de vivir solo de emplea-dos frente a pensionistas, presentando tam-bién la menor quienes no están ni en una ni en la otra categoría.
Factores asociados a los distintos patrones de residencia en solitario
Una vez descritos los modelos específi cos para cada país y para explicar estos patro-nes diferenciales se ha procedido a estanda-rizar, variable a variable, las proporciones
Reis. Rev.Esp.Investig.Sociol. ISSN-L: 0210-5233. Nº 144, Octubre - Diciembre 2013, pp. 139-152
Pilar Zueras y Pau Miret Gamundi 149
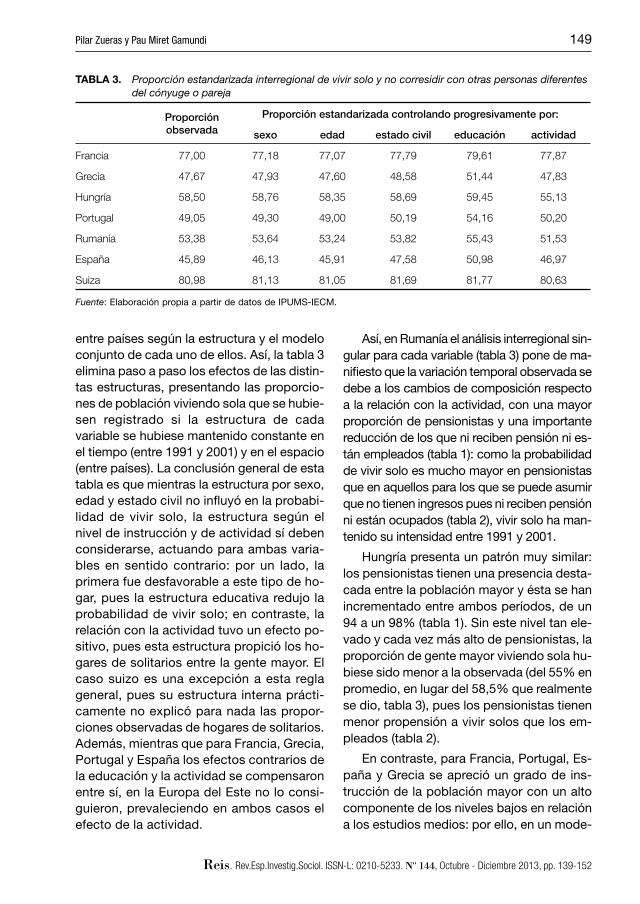
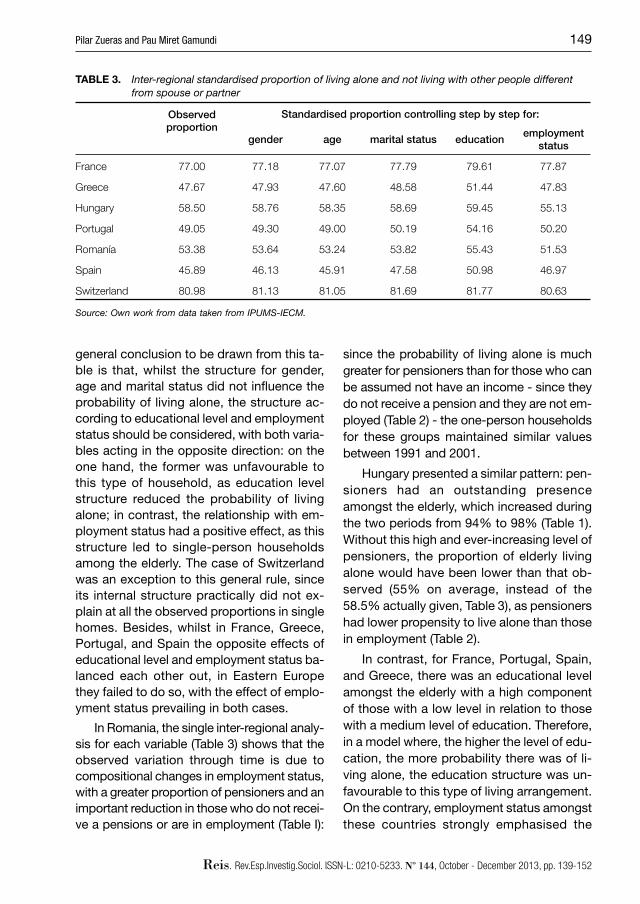
entre países según la estructura y el modelo conjunto de cada uno de ellos. Así, la tabla 3 elimina paso a paso los efectos de las distin-tas estructuras, presentando las proporcio-nes de población viviendo sola que se hubie-sen registrado si la estructura de cada variable se hubiese mantenido constante en el tiempo (entre 1991 y 2001) y en el espacio (entre países). La conclusión general de esta tabla es que mientras la estructura por sexo, edad y estado civil no infl uyó en la probabi-lidad de vivir solo, la estructura según el nivel de instrucción y de actividad sí deben considerarse, actuando para ambas varia-bles en sentido contrario: por un lado, la primera fue desfavorable a este tipo de ho-gar, pues la estructura educativa redujo la probabilidad de vivir solo; en contraste, la relación con la actividad tuvo un efecto po-sitivo, pues esta estructura propició los ho-gares de solitarios entre la gente mayor. El caso suizo es una excepción a esta regla general, pues su estructura interna prácti-camente no explicó para nada las propor-ciones observadas de hogares de solitarios. Además, mientras que para Francia, Grecia, Portugal y España los efectos contrarios de la educación y la actividad se compensaron entre sí, en la Europa del Este no lo consi-guieron, prevaleciendo en ambos casos el efecto de la actividad.
Así, en Rumanía el análisis interregional sin-gular para cada variable (tabla 3) pone de ma-nifi esto que la variación temporal observada se debe a los cambios de composición respecto a la relación con la actividad, con una mayor proporción de pensionistas y una importante reducción de los que ni reciben pensión ni es-tán empleados (tabla 1): como la probabilidad de vivir solo es mucho mayor en pensionistas que en aquellos para los que se puede asumir que no tienen ingresos pues ni reciben pensión ni están ocupados (tabla 2), vivir solo ha man-tenido su intensidad entre 1991 y 2001.
Hungría presenta un patrón muy similar: los pensionistas tienen una presencia desta-cada entre la población mayor y ésta se han incrementado entre ambos períodos, de un 94 a un 98% (tabla 1). Sin este nivel tan ele-vado y cada vez más alto de pensionistas, la proporción de gente mayor viviendo sola hu-biese sido menor a la observada (del 55% en promedio, en lugar del 58,5% que realmente se dio, tabla 3), pues los pensionistas tienen menor propensión a vivir solos que los em-pleados (tabla 2).
En contraste, para Francia, Portugal, Es-paña y Grecia se apreció un grado de ins-trucción de la población mayor con un alto componente de los niveles bajos en relación a los estudios medios: por ello, en un mode-
TABLA 3. Proporción estandarizada interregional de vivir solo y no corresidir con otras personas diferentes del cónyuge o pareja
Fuente: Elaboración propia a partir de datos de IPUMS-IECM.
Reis. Rev.Esp.Investig.Sociol. ISSN-L: 0210-5233. Nº 144, Octubre - Diciembre 2013, pp. 139-152
150 Mayores que viven solos: una panorámica a partir de los censos de 1991 y 2001
lo en que a mayor nivel de instrucción, mayor residencia en solitario, la estructura educati-va fue desfavorable a dicha situación en el hogar. Por el contrario, en la relación con la actividad estos países destacan por la fuerte presencia de pensionistas, hecho que favo-rece la soledad. Como indicamos, uno y otro efecto se anulan para las generaciones ob-servadas; sin embargo, en el plausible esce-nario de que entre las nuevas generaciones se incremente el nivel de instrucción y el ac-ceso a la pensión es de prever un incremen-to de hogares unipersonales.
CONCLUSIONES
El principal propósito de este artículo es do-ble: por un lado, investigar la prevalencia de la vida en solitario de las personas de 65 a 84 años en ausencia de pareja en Europa y su evolución temporal y, por otro lado, cono-cer la situación relativa de España en el con-texto europeo. Su principal aportación es la de neutralizar los efectos de las principales variables socioeconómicas y eliminar los efectos de estructura de la población en el análisis temporal.
En línea con los trabajos previos de Pam-pel (1992) y Palloni (2001), la proporción de personas que viven solas entre aquellas con 65 a 84 años sobre las que ni están casadas en matrimonio ni en pareja consensual se ha incrementado en Europa entre 1991 y 2001. Rumanía es una excepción, pues este indica-dor apenas ha variado durante este periodo, pero ello se debe a una desfavorable compo-sición de la población mayor. Además, a pe-sar de haber controlado por las variables es-tructurales de sexo, edad, estado civil, nivel de instrucción y relación con la actividad, las diferencias entre países en la propensión a vivir solo de las personas mayores de 64 años y menores de 85 años permanece, si-guiendo también la distribución territorial planteada en la revisión teórica por De Jong Gierveld et al. (2001), Delbès et al. (2006) y
Festy et al. (2008), la probabilidad es clara-mente superior en Suiza y Francia, en un pun-to medio aparece el este (Hungría y Rumanía) y, fi nalmente, el sur de Europa, con Grecia, Portugal y España, siendo este último el país donde se convive en mayor medida con otras personas. En defi nitiva, la distancia interre-gional observada para este fenómeno no se debe a diferencias estructurales entre países. No hemos podido desvelar, sin embargo, hasta qué punto este indicador se asocia a la alta institucionalización de las personas ma-yores cuando se quedan solas en el norte y centro de Europa (en comparación con el este y el sur). Por todo ello afi rmamos que la diversidad regional centro/este/sur de Euro-pa se confi rma, estableciéndose un progresi-vo descenso en las probabilidades de vivir solo, con independencia de las variables so-ciodemográfi cas consideradas.
Se ha examinado el efecto de las variables independientes en la probabilidad de vivir solo. La única variable que actúa de manera similar en todos los países analizados es el grado educativo. En consonancia con Palloni (2001) y Festy et al. (2008), a mayor nivel de instrucción, mayor probabilidad de vivir en soledad en lugar de con otras personas entre quienes no están unidos. Es posible que esta variable recoja el efecto de otras no incluidas en nuestra fuente de datos, como podría ser el estatus socioeconómico, pues la renta está directamente relacionada con la capacidad de vivir solo. En este sentido, tener recursos económicos, ya sea en forma de pensión o de renta por trabajo, incrementa la probabilidad de vivir solo. Por ello, ser pensionista es la situación que más favorece este tipo de hogar en Europa, con excepción de Hungría y Ru-manía, en donde la mayor soledad se da entre los que aún se encuentran trabajando más allá de los 65 años.
Las demás variables independientes in-cluidas en el modelo afectan de distinta ma-nera según el área considerada. Así, una vez se controla por todas las demás co-varia-bles, mientras que las mujeres tienen mayor
Reis. Rev.Esp.Investig.Sociol. ISSN-L: 0210-5233. Nº 144, Octubre - Diciembre 2013, pp. 139-152
Pilar Zueras y Pau Miret Gamundi 151
probabilidad de vivir solas en España y en los países del oeste europeo (Suiza y Francia), en el resto de países la relación es la inversa, es decir, son los hombres quienes registran la mayor probabilidad de residir en un hogar en solitario.
Por otro lado, mientras que en el sur y el este europeo, a mayor edad, menor probabi-lidad de vivir solo, en el oeste la relación entre estas dos variables tiene una forma de U in-vertida, registrándose la mayor probabilidad a los 75-79 años. Sin embargo, entre los mayo-res de 85 años y en todo el territorio se apre-cia una menor probabilidad de vivir solo, por lo que podemos intuir que a edades avanza-das se precisa residir con otras personas, sea por cuestiones de falta de autonomía o de mayor vulnerabilidad de los ancianos.
En general, estar divorciado supone la mayor probabilidad de vivir solo en lugar de estar conviviendo con otras personas, con excepción de Hungría, donde ésta la deten-tan los solteros. En el otro polo, la mayor probabilidad de convivir con otros se registra entre los solteros en Francia, Suiza, Portugal y España, mientras que es para los viudos en el caso de Hungría, Rumanía y Grecia. No acertamos a elaborar un patrón explicativo con esta variable, ya que es demasiado di-versa entre países.
Con este análisis se ha propuesto arrojar luz sobre las formas de convivencia en Espa-ña respecto de otros países europeos. A la luz de los resultados obtenidos podemos de-cir que el patrón observado en España se asemeja al de Grecia y Portugal: la prevalen-cia de la vida en solitario es similar en los países del sur aunque, de hecho, España muestra las proporciones más bajas en 1991 y el ascenso más pronunciado en 2001, con un aumento de casi once puntos porcentua-les. Sin embargo, el caso español difi ere en algunos aspectos de los otros países del sur: ser mujer está asociado a una mayor propen-sión a vivir sola, son los solteros quienes tie-nen la mayor probabilidad de corresidir con
otros que no sean su pareja y el aumento de la vida en solitario ha sido mayor en los gru-pos de edades más avanzadas. Finalmente, en España percibir o no una pensión es lo que establece mayores diferencias en la pro-babilidad de vivir solo y, de acuerdo con los estudios que señalaban que la prevalencia de la vida en solitario se debía a una mejora del bienestar material de los mayores (López Doblas, 2005), hemos constatado que parte del gran aumento observado en 2001 se debe al mayor acceso a la pensión entre los más mayores.
BIBLIOGRAFÍA
Abellán, A. et al. (2007). A propósito de las condicio-nes de vida de las personas mayores. Madrid: IMSERSO.
Aquilino, William S. (1990). «The Likelihood of Parent-adult Child Coresidence: Effects of Family Struc-ture and Parental Characteristics». Journal of Marriage and the Family, 52: 405-419.
Bishop, C. E. (1986). «Living Arrangement Choices of Elderly Singles: Effects of Income and Disabi-lity». Health Care Financ Rev., 7(3): 65-73.
Borsch-Supan, Axel; Laurence J. Kotlikoff y John N. Morris (1988). «The Dynamics of Living Arrange-ments of the Elderly». National Bureau of Econo-mic Research, NBER Working Paper W2787. Disponible en SSRN: http://ssrn.com/abs-tract=268189, último acceso 23 de octubre de 2010.
Daatland, Svein O. y Katharina Herlofson (2003). «‘Lost Solidarity’or ‘Changed Solidarity’: A Com-parative European View of Normative Family So-lidarity». Ageing and Society, 23(05): 537-560.
De Jong Gierveld, Jenny; Helga de Valk y Marieke Blommesteijn (2001). «Living Arrangements of Older Persons and Family Support in More De-veloped Countries». Population Bulletin of the United Nations. Living Arrangements of Older Persons: Critical Issues and Policy Responses, 42/43: 193-214.
Delbès, Christiane; Joëlle Gaymu y Sabine Springer (2006). «Les femmes vieillissent seules, les hommes vieillissent à deux. Un bilan européen». Population et Sociètès, 1: 419.
Reis. Rev.Esp.Investig.Sociol. ISSN-L: 0210-5233. Nº 144, Octubre - Diciembre 2013, pp. 139-152
152 Mayores que viven solos: una panorámica a partir de los censos de 1991 y 2001
Eggerickx, Thierry y François Bégeot (1993). «Les recensements en Europe dans les années 1990. De la diversité des pratiques nationales à la com-parabilité internationale des résultats». Popula-tion (French Edition), 48(6): 1705-1732.
Egidi, Viviana y Patrick Festy (2006). «Comparer pour comprendre». En: G. Caselli, J. Vallin y G. Wunsch (eds.), Démographie. Analyse et synthèse (Vol. VIII). Paris: INED.
Festy, Patrick y Jitka Rychtarikova (2008). «Living Conditions for the Elderly in the Late Twentieth Century». En: J. Gaymu, P. Festy, M. Poulain y G. Beets (eds.), Future Elderly Living Conditions in Europe. Paris: INED.
Gaymu, Joëlle et al. (2006). «Determinants of the Living Arrangements of Older People in Euro-pe». European Journal of Population, 22(3): 241-262.
— y Sabine Springer (2010). MAGGIE project (Major Ageing and Gender Issues in Europe) (en línea) http://www.maggie-project.org/, último acceso 13 de septiembre de 2010.
IPUMS-IECM. Minnesota Population Center. Integra-ted Public Use Microdata Series, International: Version 6.0 [Machine-readable database] (2010). Minneapolis: University of Minnesota.
Jovell, Albert J. (1995). Análisis de regresión logística. Madrid: Centro de Investigaciones Sociológicas.
Iacovou, Maria (2000). «Health, Wealth and Progeny: Explaining the Living Arrangements of Older Eu-ropean Women». Institute for Social and Econo-mic Research Essex University, (Paper 8) (en lí-nea) http://www.iser.essex.ac.uk/publications/working-papers/iser/2000-08.pdf, último acceso 2 de marzo de 2011.
López Doblas, J. (2005). Personas mayores viviendo solas. La autonomía como valor en alza. Madrid: IMSERSO.
Menacho, Teresa (2002). Los tipos de estandarización en demografía. Aplicación al estudio de las dife-rencias regionales de la actividad y desempleo en España, 1990-2000. Memoria de Investigación presentada en el Departamento de Geografía de la Universitat Autònoma de Barcelona.
Mutchler, Jan E. y Jeffrey A. Burr (1991). «A Longitudi-nal Analysis of Household and Nonhousehold Li-
ving Arrangements in Later Life». Demography, 28(3): 375-390.
Palloni, Alberto (2001). «Living Arrangements of Older Persons». Population Bulletin of the United Na-tions. Living Arrangements of Older Persons: Cri-tical Issues and Policy Responses, 42-43: 54-110.
Pampel, Fred C. (1992). «Trends in Living Alone among the Elderly in Europe». Elderly Migration and Population Redistribution: 97-117.
Pérez Ortiz, L. (2006): La estructura social de la vejez en España. Nuevas y viejas formas de envejecer. Madrid: IMSERSO.
Pezzin, Liliana E. y Barbara S. Schone (1999). «Pa-rental Marital Disruption and Intergenerational Transfers: An Analysis of Lone Elderly Parents and their Children». Demography, 36(3): 287-297.
Reher, David S. (1998). «Family Ties in Western Euro-pe: Persistent Contrasts». Population and Deve-lopment Review, 24(2): 203-234.
Robine, Jean-Marie; Isabelle Romieu y Emmanuelle Cam-bois (1999). «Health Expectancy Indicators». Bulletin of the World Health Organization, 77 (2): 181-185.
Tomassini, Cecilia et al. (2004). «Living Arrangements among Older People: An Overview of Trends in Europe and the USA». Further Release of 2001 Census Data, 1329: 24-64.
United Nations (2005). Living arrangements of older persons around the world, (New York ed.) United Nations. Department of Economic and Social Affairs. Population Division (en línea) http://www.un.org/esa/population/publications/livingarran-gement/TMP7s4uhvrit7.htm, último acceso 20 de octubre de 2010.
Wolf, David A. (1995). «Changes in the Living Arran-gements of Older Women: An International Stu-dy». The Gerontologist, 35(6): 724.
Worobey, Jacqueline L. y Ronald J. Angel (1990). «Functional Capacity and Living Arrangements of Unmarried Elderly Persons». Journal of Geronto-logy, 45(3): 95-101.
Zueras, Pilar y Marc Ajenjo Cosp (2010). «Modelos de convivencia de las personas mayores en Ca-taluña. Impacto del deterioro de la salud en la independencia residencial». Revista Española de
Pilar Zueras: Universitat Autònoma de Barcelona | [email protected] Miret Gamundi: Universitat Autònoma de Barcelona | [email protected]
Reis. Rev.Esp.Investig.Sociol. ISSN-L: 0210-5233. Nº 144, October - December 2013, pp. 139-152
Elderly Who Live Alone: An Overview Based on the 1991 and 2001 Censuses
Mayores que viven solos: una panorámica a partir de los censos de 1991 y 2001
Pilar Zueras and Pau Miret Gamundi
doi:10.5477/cis/reis.144.139
Key wordsPopulation Change• Population Characteristics• Census • Europe• Elderly• Living arrangements
AbstractThis article analyses the development of single-person living arrangements amongst unmarried people aged between 65 and 84 years old who did not live with a partner between 1991 and 2001 in seven European countries (Spain, France, Greece, Hungary, Portugal, Romania and Switzerland). To do so, census micro data provided by IPUMS (Integrated Public Use Microdata Series) were used. The role of fi ve variables with regard to the probability of living alone versus living with others was examined. It was investigated whether the observed development was due to changes in the population composition. Logistic regression was used as a standardisation technique with the census data. Results showed that, after controlling for all the variables, the observed regional patterns remain the same, and that the proportion of elderly living alone increased in 2001 in all countries but Romania where, if the population composition had not changed, this proportion would have diminished. The demographic structure (by gender, age and marital status) did not signifi cantly modify the observed proportions either over time or at a regional level. In contrast, the variations of the structure regarding the socio-economic variables (educational level and employment status) were key to explain part of the observed change.
Palabras claveCambio demográfi co• Características demográfi cas • Censo • Europa • Personas mayores • Formas de convivencia
ResumenEl artículo analiza la evolución de la vida en solitario de las personas de 65 a 84 años no casadas y que no cohabitan en pareja entre 1991 y 2001 en siete países europeos (España, Francia, Grecia, Hungría, Portugal, Rumanía y Suiza). Para ello se utilizan microdatos censales procedentes de IPUMS (Integrated Public Use Microdata Series). Se examina el papel de cinco variables en la probabilidad de vivir solo frente a la de corresidir con otras personas y se investiga si la evolución observada se debe a cambios en la composición de la población. Adoptamos la regresión logística como técnica de estandarización con los datos censales. Los resultados muestran que los patrones regionales observados permanecen cuando se controla por todas las variables y que se da un aumento generalizado de la vida en solitario en 2001 en todos los países salvo en Rumanía, donde hubiera disminuido de no ser por los cambios en la composición de la población. La estructura demográfi ca (sexo, edad y estado civil) no modifi ca signifi cativamente las proporciones observadas a nivel temporal o regional. En contraste, las variaciones de estructura en cuanto a las variables socioeconómicas (nivel educativo y relación con la actividad) son clave para la explicación de una parte del cambio observado.
CitationZueras, Pilar and Pau Miret Gamundi (2013). “Elderly Who Live Alone: An Overview based on the 1991 and 2001 Censuses. Revista Española de Investigaciones Sociológicas, 144: 139-152.(http://dx.doi.org/10.5477/cis/reis.144.139)
Reis. Rev.Esp.Investig.Sociol. ISSN-L: 0210-5233. Nº 144, October - December 2013, pp. 139-152
140 Elderly Who Live Alone: An Overview Based on the 1991 and 2001 Censuses
INTRODUCTION1
Abundant research has been undertaken on the living arrangements of the elderly in Euro-pe from an international comparative pers-pective, but Spain has rarely been included. Previous studies draw a picture of a regional typology in which different patterns are ob-served that show a gradation ranging from the Northern European countries, where more independent living arrangements pre-dominate (living alone, or just with a partner), going through the Western and Eastern Euro-pean countries, through to the Southern countries, where there is a greater predomi-nance of household arrangements in which the elderly live with their children, or with other people.
This paper examines the patterns of the living arrangements of unmarried elderly people with no live-in partner in various Eu-ropean countries, placing Spain within this context. This has been done by using census samples. Seven countries were selected (France, Switzerland, Hungary, Romania, Greece, Portugal and Spain) from the two last censuses, which were taken around 1991 and 2001. The analysed sample consis-
1 This paper is part of the main author’s thesis, which was completed as part of the Doctorate in Demographics programme at the Autonomous University of Barcelona under the direction of Dr. Anna Cabré. It was possible thanks to the Training Programme for University Lectu-rers (FPU) of the Spanish Ministry of Science and Inno-vation, which also fi nanced a stay at the Institut National d’Etudes Démographiques (INED), Paris, where part of this study was conducted, under the auspices of the Projet Census. This paper is included in the scope of the 2012-2014 R&D&I national plan, with reference number CS02011-29136, entitled “Data and Indicators for Im-proving the Current Estimation of Fertility”, and in the scope of the 2011-2013 R&D&I national plan, with refe-rence CS02010-21028 (SOCI Sub-programme) entitled “The Dynamics of the Labour Market and Family Edu-cation in Spain at the Turn of the Century”.
We are also grateful for the use of the data provided by the IPUMS-IECM, as well as by the statistical agencies that were the sources of the original data. Finally, we wish to thank the anonymous assessors and the editorial board, for their valuable comments on this paper.
ted of 927,412 cases and was made up of individuals who were over 64 and under 85 years old, living in their private homes, who at the time of the census were not married or living with a partner. The purpose of this se-lection was to investigate the living arrange-ment patterns of the elderly who do not have a partner, that is, whether, when they do not have a partner, they live alone or with other people, be they descendants, other family members, or individuals to whom they are not related.
This paper is intended to examine the li-ving arrangement patterns of the elderly with no live-in partners, observing the variation among countries and the changes that occu-rred between 1991 and 2001. The effect of some socio-demographic factors on the pro-bability of living alone compared to that of living with others was analysed, as well as investigating whether the changes over time are explained by the changing structure of the population. Specifi cally, the research questions are the following: What are the li-ving arrangement patterns of the elderly who do not have a live-in partner in Europe, and where is Spain placed in this context? How did the propensity to live alone in these coun-tries change between 1991 and 2001? In what way do the socio-demographic varia-bles infl uence the propensity to live alone? To what extent is the increase in the proportion of people living alone due to changes in po-pulation structure?
LITERATURE REVIEW
Attempts to explain the differences observed amongst European regions have been made from two points of view: one emphasises the North-South divide in terms of the different types of welfare states, and the other is more focused on the weakness or strength of fa-mily ties (Reher, 1998). Both perspectives have been criticised for being overly simplis-tic, as they do not match the observed regio-
Reis. Rev.Esp.Investig.Sociol. ISSN-L: 0210-5233. Nº 144, October - December 2013, pp. 139-152
Pilar Zueras and Pau Miret Gamundi 141
nal variability (Gaymu et al., 2006). Those studies which analyse changes over time have confi rmed that there is a similar trend in all European countries towards an increase in living alone, which does not deny the diffe-rences observed among regions (Palloni, 2001; Pampel, 1992). Tomassini et al. (2004) showed that, between 1970 and 1990, an increase was observed in the proportion of people living alone, whilst in the 1990s there was an increase in people living with their partner without other people, despite higher rates of divorce during this period.
The parallel development in all European countries maintained the differences that had been noted in the past: when the elderly do not live alone or with their partner, the most frequent modality in Southern Europe is for them to live with their children or with other people, whilst in Northern European coun-tries is more common for them to be institu-tionalised, with Central and Eastern Euro-pean countries lying somewhere between the two ends (de Jong Gierveld, de Valk, and Blommesteijn, 2001; Delbès, Gaymu, and Springer, 2006; Festy and Rychtarikova, 2008; Tomassini et al., 2004).
In Spain, an increase in elderly people li-ving alone has been noticed, with a decline in the pattern of living with their children or with other people (Pérez Ortiz, 2006; Abellán et al., 2007). The 1991 census showed that 16.2% of people over the age of 64 lived alo-ne, and by 2001 this had increased to 19.6% (López Doblas, 2005). This study emphasises that the phenomenon is not due to a weake-ning of family ties, which erodes the inter-generational solidarity within families, but rather, that it is due to an improvement in li-ving conditions and support for the material well-being of the elderly.
In general, the literature agrees on the effect that demographic variables have on the household type of the elderly. The living arrangement patterns differ for men and wo-men, as females living longer than males in-
volves a higher rate of widowhood amongst women, and therefore more of them live alo-ne and fewer with a partner. In 2000 in Euro-pe only 20% of women over 74 lived with a partner, as opposed to 65% of men of the same age (Delbès et al., 2006). These gender differences are lessened when marital status is taken into account. Regardless of gender, the large majority of those who are married live with their partner (this is an endogenous explanation, as those who are married prac-tically always live with their partner), whilst the most common situation for divorcees or widows is to live alone, although the latter proportions differ signifi cantly between the Northern and Southern European countries (de Jong Gierveld, de Valk, and Blommestei-jn, 2001; Delbès, Gaymu and Springer, 2006). A lower propensity to live with their children is seen amongst divorcees (Aquilino, 1990; Pezzin and Schone, 1999), as well as there being a lower likelihood that single people would live alone and a higher likelihood that they would live in institutions (Delbès, Gaymu and Springer, 2006).
Age is also strongly related to the living arrangements of the elderly. After the age of 75, the number of people living alone decrea-ses with age. There are various reasons for this, including those related to bad health or functional limitations (Festy and Rychtarikova, 2008; Pezzin and Schone, 1999; Zueras and Ajenjo, 2010). Whether because of fragility or loneliness, the most elderly frequently live in institutions or live with their children or with other people. After the age of 75, institutiona-lisation becomes a more frequent option for those without a partner, even with the same self-reported health status. However, the pre-sence of institutionalisation as an option va-ries according to the country, and it is lower in Eastern and Southern European countries than in Northern and Western European coun-tries (Delbès, Gaymu y Springer, 2006).
Finally, socio-economic characteristics constitute a discriminating feature in terms of elderly people’s living arrangements. A high
Reis. Rev.Esp.Investig.Sociol. ISSN-L: 0210-5233. Nº 144, October - December 2013, pp. 139-152
142 Elderly Who Live Alone: An Overview Based on the 1991 and 2001 Censuses
educational level and high income are factors associated with greater residential indepen-dence (Palloni, 2001). Whilst it is true that a high educational level is related to a higher level of life expectancy free from disability (Robine, Romieu and Cambois, 1999), the same effect can be seen amongst people older than 74 with disability: living with others who are not their partner is less frequent as well amongst those with a higher education level, regardless of their marital status (Festy and Rychtarikova, 2008). Other studies show that pensioners have a greater probability of living alone than those who are not receiving a pension (Wolf, 1995), which suggests that economic indepen-dence promotes residential independence.
All these variables have been capable of being taken into account, and therefore our model includes gender, marital status, age, educational level, and employment status. However, in the data source used there was no information about other determining fac-tors for the living arrangements among the elderly that are mentioned in the literature, such as the person’s health condition or functional disability (Borsch-Supan, Kotlikoff and Morris, 1988; Worobey and Angel, 1990; Zueras and Ajenjo, 2010), income (Bishop, 1986; Mutchler and Burr, 1991), and whether or not they have children (Gaymu et al., 2006; Iacovou, 2000).
SOURCES AND METHODOLOGY
The study uses census microdata from the IPUMUS-ICEM (Integrated Public Use Micro-data Series - Integrated European Census Mi-crodata). The last two censuses were selected (taken around 1991 and 2001) in seven Euro-pean countries, with these being grouped into three large regions: Western Europe (France and Switzerland), Eastern Europe (Hungary and Romania), and Southern Europe (Greece, Portugal and Spain).
The main methodological problem of the comparative method was the harmonisation
of data, starting from the very defi nition of the basic concepts (see Egidi and Festy, 2006). Despite international recommenda-tions, the convergence of European censu-ses towards a single model is complicated, as there is a confl ict between intra-national temporal continuity and transnational com-parability (Eggerickx and Bégeot, 1993).
The study population
The population being studied were over 64 and under 85 years-old2, resident in their private homes3, their marital status was sin-gle, divorced4 or widowed, and they did not live with a common-law partner at the time of observation. The living arrangements of these elderly people were examined by way of a dichotomous variable analysis, with two modalities: 1) living alone or 2) living with people who were not their partner. The sam-ple consisted of 927,412 individuals. As can be seen in Table 1, the great majority of the sample were widows who were pensioners, from which it can be inferred that they are women who are receiving a widow’s pen-sion.
Independent variables
A multivariate analysis was carried out using a logistic regression analysis for each of the
2 The reason for not considering the 85 year-old-and-above group was that in the Spanish 1991 survey this was an open group. As a result, it would not have been possible to include the “simple age” variable in the ex-planatory model, as was our intention.3 It should be noted that, as a result of the inability to consider the residents in old people’s homes, there is a selection fi lter in the observed population, as in Western European countries, those in poorer health may have ceased to be observed when becoming institutionalised, unlike the situation in Southern European countries, whe-re family solidarity and the care of the elderly reveal a lower acceptance of institutionalisation (Daatland and Herlofson, 2003; Tomassini et al., 2004).4 As will be explained in the next section, in some coun-tries couples who are separated are included in the “di-vorced” category.
Reis. Rev.Esp.Investig.Sociol. ISSN-L: 0210-5233. Nº 144, October - December 2013, pp. 139-152
Pilar Zueras and Pau Miret Gamundi 143
countries, which included the following six independent variables:
1. The observation period in two categories: circa 1991 and circa 2001, as not all of the censuses were taken at the same time5.
2. Gender.
3. Age. This variable was considered as a continuous variable, which is why Table 1 describes it with the average age obser-ved in the different samples. In the model the effect of age was captured in two ways: age (age to age) and age squared.
4. Marital status, distinguishing between single, widowed and divorcees.
The treatment of marital status was not homogenous in all of the censuses em-ployed in this study. The majority of coun-tries collected information on marital status, with the exception of Portugal, where the de facto situation was recor-ded, and Spain, Greece and Hungary, which included the possibility that people would declare themselves separated6. Thus for Portugal and Spain in both cen-suses, and for Greece and Hungary for the 2001 census, the separated popula-tion was included in the scope of the stu-dy. For the rest of the countries, it is out-side the scope of the study.
5. Educational level. Educational level was reduced to three categories: low (those who did not complete primary education), medium (including those who completed primary and secondary education), and high (those who completed university education).
5 The majority of these censuses date from 1991 and 2001, except those for France (which were dated 1990 and 1999), Switzerland (dated 1990 and 2000) and Ro-mania (dated 1992 and 2002).6 The IPUMS offers detailed information concerning the process of harmonising the variables and their compa-rability, as well as of the original variables. Information regarding marital status is available here: https://inter-na t iona l . ipums.org/ in te r nat iona l -ac t ion/var i -ables/173763.
The use of educational level also meant that certain decisions had to be taken and some work had to be done on harmoni-sing the variables. We are studying indivi-duals from older generations, who went to school in a period before the great ex-pansion of education, when fi nishing pri-mary education already made a conside-rable difference, and the earning of a university degree was very infrequent (see Table 1). It would have been prefera-ble to have considered four categories (distinguishing those who had completed primary education from those who had completed secondary education); howe-ver, the diversity both in the data collec-tion and in the education systems made it impossible to make a distinction among these four categories for all of the census samples.
6. Employment status. Three different pos-sibilities were considered: receiving a pension, being employed, or another si-tuation. The harmonisation of this varia-ble among countries was no easy task either.
Pensioners are considered to be those who receive a retirement pension, a widow’s pension, a disability pension, or any others with the same purpose. This does not include those who live on income from their own wealth, royalties, etc., who are grouped toge-ther under the category of “other situation”, together with those who report to be housewives, those dependent on other pu-blic or private institutions, or those not em-ployed for other reasons. This division is con-sistent in nearly all of the censuses studied, with some exceptions which could not be remedied even by resorting to the original variables7.
7 In some cases, the statistical institutes did not provide all of the variables. Besides, those that were offered were not always taken directly from the questionnaire, but were sometimes developed later.
Reis. Rev.Esp.Investig.Sociol. ISSN-L: 0210-5233. Nº 144, October - December 2013, pp. 139-152
144 Elderly Who Live Alone: An Overview Based on the 1991 and 2001 CensusesTA
BLE
1.
Sam
ple
str
uctu
re. P
rop
ortio
n of
the
pop
ulat
ion
for
each
var
iab
le (%
)
Sou
rce:
Ow
n w
ork
from
dat
a ta
ken
from
IP
UM
S-I
EC
M.
Fran
ceG
reec
eH
unga
ryP
ortu
gal
Rom
ania
Sp
ain
Sw
itzer
land
Est
and
ard
ised
1991
2001
1991
2001
1991
2001
1991
2001
1991
2001
1991
2001
1991
2001
Live
alo
ne75
.32
78.6
444
.64
50.6
554
.54
62.3
046
.02
52.0
653
.66
53.6
140
.59
50.8
677
.25
84.6
158
.93
(%pt
. diff
eren
ce)
(3.3
1)(6
.01)
(7.7
7)(6
.04)
(-0.
05)
(10.
27)
(7.3
6)
Wom
en80
.87
78.6
181
.81
81.1
782
.75
82.6
479
.19
79.4
181
.15
80.1
179
.19
77.3
279
.89
78.6
7
Ave
rage
age
75.0
374
.41
74.6
674
.07
74.2
874
.06
74.4
774
.59
74.0
973
.84
74.7
174
.93
74.8
174
.90
79.9
1
Mar
ital s
tatu
s
sing
le15
.18
17.1
911
.11
12.6
97.
956.
5617
.67
17.4
65.
635.
1723
.05
21.5
121
.36
19.7
214
.10
wid
owed
77.9
472
.60
85.9
481
.40
84.1
881
.29
77.2
276
.16
90.1
289
.23
75.5
474
.84
68.8
965
.47
79.7
8
divo
rced
6.88
10.2
02.
955.
927.
8712
.15
5.11
6.39
4.26
5.60
1.41
3.65
9.74
14.8
26.
12
Edu
catio
nal l
evel
low
50.1
533
.81
51.0
541
.96
8.81
2.81
68.6
760
.03
22.7
018
.06
61.4
546
.66
1.24
6.08
36.8
5
med
ium
47.0
561
.28
46.4
454
.41
89.7
092
.87
30.0
237
.93
74.6
578
.71
36.3
851
.95
96.6
190
.41
60.2
3
high
2.80
4.91
2.51
3.63
1.48
4.32
1.32
2.04
2.65
3.23
2.17
1.39
2.15
3.51
2.92
Em
ploy
men
t sta
tus
Pen
sion
78.5
180
.32
89.6
083
.16
93.7
297
.69
86.4
989
.83
84.0
091
.07
88.0
691
.79
95.1
040
.21
85.7
3
Em
ploy
ed1.
571.
062.
512.
430.
661.
073.
564.
143.
955.
361.
692.
474.
894.
932.
66
Oth
er19
.92
18.6
27.
9014
.41
5.61
1.23
9.94
6.03
12.0
53.
5710
.25
5.73
0.01
54.8
611
.61
N11
2,42
814
1,56
944
,151
53,3
3431
,381
34,1
8724
,248
26,5
1210
0,51
212
2,07
394
,086
109,
280
16,8
5216
,799
927,
412
SS
(%)
4.2
5.0
5.0
5.0
5.0
5.0
10.0
10.0
10.0
10.0
5.0
5.0
5.0
5.0
Reis. Rev.Esp.Investig.Sociol. ISSN-L: 0210-5233. Nº 144, October - December 2013, pp. 139-152
Pilar Zueras and Pau Miret Gamundi 145
The size of the population who live alone may be affected by a different composition of the over 64 age group in each of the periods and countries. Table 1 shows the structure of the sample for each of the variables conside-red, for each country and each period. There are hardly any changes in the samples bet-ween 1991 and 2001 in terms of gender composition and age structure. However, in general, in the ten years separating the two censuses, an increase could be seen in the number of divorced people; complementa-rily, the number of widowed individuals de-creased slightly, whilst the number of single people remained fairly stable. But the most outstanding development was seen in edu-cational level, with a greater weight of the medium level and a slight increase in the high level, except in Switzerland (where there was an increase in the low level and a decrease in the medium level) and in Spain, where the high level decreased slightly. Another signifi -cant variation is the increase in pensioners, except in Greece and Switzerland. To sum up, given that the composition for gender, age and marital status is very similar bet-ween 1991 and 2001, it is the changes in the other variables, namely, structure by educa-tional level and employment status, that could partly explain the changes in the pre-valence of living alone.
Methodology of the analysis
The multivariate analysis using logistic re-gression allowed the net effect of each of the variables to be obtained once controlled for the rest of the variables included in the mo-del. The probability of living alone, as oppo-sed to living with other people, was calcula-ted according to each of the independent variables. This made it possible to obtain standardised sizes of the studied phenome-non, that is, once the structure effect had been eliminated according to the other inde-pendent variables under consideration in the model (Jovell, 1995; Menacho, 2002).
RESULTS
Living Alone: the Model for Each Country
Firstly, it can be seen that the order in the probability that a person between 65 and 84 years old would be living alone, after contro-lling for structural effects, would have been identical to that observed: in the fi rst group, Central Europe, including Switzerland and France (with proportions of 78% and 75%, respectively); in the second group, Eastern Europe, with Hungary and Romania (with proportions of 62% and 57%, respectively); and in the third group, Southern Europe, Greece, Portugal, and Spain (with propor-tions of 51%, 47%, and 38%, respectively). These proportions are standardised in Table 2 within each country, that is, it is in no way necessary to seek their basis in any varia-tions in the factors involved in the model. In conclusion, the regional positions are not co-rrected at all by the structure for gender, age, marital status, educational level or employ-ment status in the various countries.
Secondly, concerning the observation that the proportion of elderly people living alone increased between 1991 and 2001 in all of the countries analysed with the excep-tion of Romania, which stayed the same (Ta-ble 1), it can be now affi rmed that the greater propensity for living alone was the fruit of a change in cultural patterns throughout Euro-pe; if a stable structure had remained in rela-tion to all of the other variables considered, the increase would have been very similar (Table 2). Despite the fi ndings in Romania, this country was no exception since, despite the fact that the socio-demographic structu-re put pressure to diminish the proportions (if the structure had remained stable, the stan-dardised proportions would have dropped from 58% to 56%, as can be seen in Table 2), the observed proportions remained stable (Table 1). Consequently, the cultural pattern overcame the effect of the structure.
Reis. Rev.Esp.Investig.Sociol. ISSN-L: 0210-5233. Nº 144, October - December 2013, pp. 139-152
146 Elderly Who Live Alone: An Overview Based on the 1991 and 2001 Censuses
Focusing our attention on gender, we see that Spain conforms to the Central European model and is different from the Southern Euro-pean countries. Whilst the French, Swiss and Spanish models show a greater probability that women would live alone (once controlled for the rest of the variables included in the model), the rest of the countries show a greater proba-bility that men would live alone (Table 2).
In general, the age pattern is similar for all countries and shows a slight increase in the probability of living alone up to the age of 75. After this age the probability goes down, with the exception of France and Switzerland, where it becomes stable. The ranking esta-blished between one country and another stays the same throughout the age ranges, from the age of 65 to 84, without exception.
However, whilst in Table 2 it was assumed that the effect of age was similar in both pe-
riods, the values shown in Figure 1 have substituted age and the specifi c period as separate variables due to their interaction, in order to examine whether there is a cohort effect: is it plausible to think that part of the observed change is due to a generational re-placement, in other words, to the fact that more recent generations show a different be-haviour than older ones? The general conclu-sion is that there is no substantial interaction between age and the period: in broad terms, the probability of living alone between 1991 and 2001 increases for all age groups. The increase in the standardised proportions of elderly people living alone instead of living with others was the same in Switzerland, Greece and Portugal, regardless all of the age groups considered. Still, it was noted that in France, Hungary and, in particular, in Spain, the increase was greater the older the population studied, to the extent that in the
TABLE 2. Inter-regional standardised proportion of living alone and not living with other people different from spouse or partner
France Greece Hungary Portugal Romania Spain Swizertland
Note: *** p<0.01; ** p<0.05; * p<0.10, ns not signifi cantSource: Own work from data taken from IPUMS-IECM
Reis. Rev.Esp.Investig.Sociol. ISSN-L: 0210-5233. Nº 144, October - December 2013, pp. 139-152
Pilar Zueras and Pau Miret Gamundi 147
GRAPH 1. Probability of living alone according to age and period, by country
Source: Own work from data taken from IPUMS-IECM.
Reis. Rev.Esp.Investig.Sociol. ISSN-L: 0210-5233. Nº 144, October - December 2013, pp. 139-152
148 Elderly Who Live Alone: An Overview Based on the 1991 and 2001 Censuses
case of France, the differences were only sig-nifi cant amongst the most elderly (Graph 1). Finally, in the case of Romania, the lower pro-portion of single-person households between 1991 and 2001 was seen only amongst the 65 to 71 age group.
What is most interesting in Spain is the effect of generational replacement. If an ima-ginary line is drawn between the 70 year-olds in 1991 and the 80 year-olds in 2001 (who belong to the same cohort), or between the 74 year-olds in 1991 and the 84 year-olds in 2001, we see that in the same generation, the proportion of those living alone has not de-creased with age. In conclusion, in Spain, for more recent generations and within the same cohort, the proportion of those living alone has remained steady in the life cycle under consideration.
With regard to marital status, the model shared by France, Switzerland, Spain and Portugal indicates the lower probability of li-ving alone for single people, medium proba-bility for the widowed and the greatest for divorcees. In contrast, in Greece and Roma-nia the lowest probability was observed amongst the widowed, and the greatest, just as in the previous model, amongst divorcees. Finally, in the Hungarian model, the relation-ship between living alone and marital status is idiosyncratic. Being divorced does not in-dicate a signifi cant probability different from being single, and the widowed have a lower probability of living in a single-person house-hold than the other marital statuses.
Educational level had a positive effect on all the countries, such that the higher the le-vel of education, the greater the probability of living alone. This variable was less impor-tant in both Portugal and Spain, since the differences between those with low educa-tion and those with a medium level of educa-tion were not as great as in other countries. In addition to possible interpretations about the preference for those with higher levels of study to have more independence, this rela-
tionship could be in part due to a combina-tion of factors that were not able to be con-trolled for in this study. Thus, a higher level of education is related to a greater life expec-tancy free from disability, and to a higher socio-economic status, which involves hig-her income, both of which are favourable to an independent living arrangement.
Less uniform is the effect of the relation-ship to employment status: in fact, this varia-ble is the one that highlights most the diffe-rences in behaviour between Central Europe, Eastern Europe and Southern Europe. In the South, the tendency to live alone is highest amongst pensioners, followed by emplo-yees, and fi nally, by those outside these two categories. In the specifi c case of Spain, the probability that pensioners would be living alone is markedly higher than those in the other two groups. Central Europe coincides with the earlier model in that there is a greater probability of living alone amongst pensio-ners, but employees show a lower proportion of living alone than those in the “others” ca-tegory, in contrast to what happens in Southern Europe. Lastly, Eastern Europe is characterised by the substantially greater probability of employees living alone with respect to pensioners, with the lowest likeli-hood being found amongst those who were not in either category.
Factors Associated with the Different Patterns of Living Alone
Once the country-specifi c models have been described, and in order to explain these di-fferential patterns, the proportions between countries according to their structure and model, variable by variable, were standardi-sed for each country. Table 3 eliminates, step by step, the effects of the different structu-res, and presents the proportions of the po-pulation living alone that would have been recorded if the structure of each variable had remained constant over time (between 1991 and 2001) and space (among countries). The
Reis. Rev.Esp.Investig.Sociol. ISSN-L: 0210-5233. Nº 144, October - December 2013, pp. 139-152
Pilar Zueras and Pau Miret Gamundi 149
general conclusion to be drawn from this ta-ble is that, whilst the structure for gender, age and marital status did not infl uence the probability of living alone, the structure ac-cording to educational level and employment status should be considered, with both varia-bles acting in the opposite direction: on the one hand, the former was unfavourable to this type of household, as education level structure reduced the probability of living alone; in contrast, the relationship with em-ployment status had a positive effect, as this structure led to single-person households among the elderly. The case of Switzerland was an exception to this general rule, since its internal structure practically did not ex-plain at all the observed proportions in single homes. Besides, whilst in France, Greece, Portugal, and Spain the opposite effects of educational level and employment status ba-lanced each other out, in Eastern Europe they failed to do so, with the effect of emplo-yment status prevailing in both cases.
In Romania, the single inter-regional analy-sis for each variable (Table 3) shows that the observed variation through time is due to compositional changes in employment status, with a greater proportion of pensioners and an important reduction in those who do not recei-ve a pensions or are in employment (Table I):
since the probability of living alone is much greater for pensioners than for those who can be assumed not have an income - since they do not receive a pension and they are not em-ployed (Table 2) - the one-person households for these groups maintained similar values between 1991 and 2001.
Hungary presented a similar pattern: pen-sioners had an outstanding presence amongst the elderly, which increased during the two periods from 94% to 98% (Table 1). Without this high and ever-increasing level of pensioners, the proportion of elderly living alone would have been lower than that ob-served (55% on average, instead of the 58.5% actually given, Table 3), as pensioners had lower propensity to live alone than those in employment (Table 2).
In contrast, for France, Portugal, Spain, and Greece, there was an educational level amongst the elderly with a high component of those with a low level in relation to those with a medium level of education. Therefore, in a model where, the higher the level of edu-cation, the more probability there was of li-ving alone, the education structure was un-favourable to this type of living arrangement. On the contrary, employment status amongst these countries strongly emphasised the
TABLE 3. Inter-regional standardised proportion of living alone and not living with other people different from spouse or partner
Observedproportion
Standardised proportion controlling step by step for:
gender age marital status educationemployment
status
France 77.00 77.18 77.07 77.79 79.61 77.87
Greece 47.67 47.93 47.60 48.58 51.44 47.83
Hungary 58.50 58.76 58.35 58.69 59.45 55.13
Portugal 49.05 49.30 49.00 50.19 54.16 50.20
Romanía 53.38 53.64 53.24 53.82 55.43 51.53
Spain 45.89 46.13 45.91 47.58 50.98 46.97
Switzerland 80.98 81.13 81.05 81.69 81.77 80.63
Source: Own work from data taken from IPUMS-IECM.
Reis. Rev.Esp.Investig.Sociol. ISSN-L: 0210-5233. Nº 144, October - December 2013, pp. 139-152
150 Elderly Who Live Alone: An Overview Based on the 1991 and 2001 Censuses
high number of pensioners, which favoured one-person households. As indicated earlier, each of those effects was neutralised for the generations observed; however, there is a plausible scenario that the newer genera-tions have a higher educational level and greater access to a pension, which is likely to increase single-person households.
CONCLUSIONS
The main aim of this paper was two-fold: fi rstly, to investigate the prevalence of one-person households amongst people aged 65 to 84 without a partner in Europe and its de-velopment over time; and, secondly, to fi nd out the relative position of Spain within the European context. Its main contribution is to neutralise the effects of major socio-econo-mic variables and to eliminate the effects of population structure in the temporal analysis.
In line with previous studies by Pampel (1992) and Palloni (2001), the proportion of people living alone within the 65 to 84 year-old age group and are neither married, nor in a common-law partnership, has increased in Europe between 1991 and 2001.
Romania is an exception, as the above indicator has hardly changed during this pe-riod, but this is due to an unfavourable com-position of the population. Besides, despite having controlled for the structural variables of gender, age, marital status, level of educa-tion, and employment status, the differences among countries in the propensity to live alo-ne amongst people over 64 years old and under 85 years old remains; also following the territorial distribution presented in the theoretical review by de Jong Gierveld et al.(2001), Delbès et al.(2006) and Festy et al.(2008), the probability of living alone is clearly higher in Switzerland and France, with Eastern Europe (Hungary and Romania) in the middle, and, fi nally, Southern Europe, with Greece, Portugal and Spain, the latter being the country where more elderly live
with other people. Finally, the inter-regional distances observed for this phenomenon are not due to structural differences among countries. We were unable to uncover, howe-ver, to what extent this indicator is associa-ted with the high institutionalisation of the elderly when they are alone in Northern and Central Europe (in comparison to the East and South). As a result, we note that the re-gional diversity between Central/Eastern/Southern Europe has been confi rmed, thus establishing a progressive decrease in the likelihood of living alone, regardless of the socio-demographic variables considered.
The effect of the independent variables on the probability of living alone was exami-ned. The only variable that acted in a similar way in all of the countries analysed is that of the educational level. This is consistent with Palloni (2001) and Festy et al. (2008) in that the higher the educational level, the greater the probability of living alone instead of living with others amongst those who are not in a relationship. It is possible that this variable is infl uenced by variables that were not inclu-ded in our data source, such as socio-eco-nomic status, as income is directly related to the ability to live alone. Having economic re-sources is directly related to the ability to live alone. Economic resources, whether in the form of a pension, or income from work, in-crease the likelihood of living alone. That is why being a pensioner is the situation that most favours this type of living arrangement in Europe, with the exception of Hungary and Romania, where the majority of those who live alone are found amongst people are wor-king after the age of 65.
The other independent variables included in the model have a different effect depen-ding on the area being considered. Once controlled for all of the other co-variables, whilst women have a greater likelihood of li-ving alone in Spain, as in Western Europe (Switzerland and France), the opposite is true in the other countries, where it is men who have a higher likelihood of living alone.
Reis. Rev.Esp.Investig.Sociol. ISSN-L: 0210-5233. Nº 144, October - December 2013, pp. 139-152
Pilar Zueras and Pau Miret Gamundi 151
On the other hand, whilst in Southern and Eastern Europe, the greater the age, the lower the probability of living alone, in the West the relationship between these two va-riables has an inverted U-shape, showing a greater probability of living alone amongst the 75-79 year-old age group. However, for those over 85 years old there is a lower like-lihood of living alone in all the countries stu-died, and therefore we can only guess that this is due to the fact that, with advanced old age, it is more necessary to live with others, whether for reasons of lack of autonomy or increasing frailty.
In general, being divorced increases the probability of living alone instead of living with others, the exception to this being Hun-gary, where those who never married have the greatest probability. At the other extreme, the greater probability of living with others is found amongst single people in France, Switzerland, Portugal and Spain, whilst this is found more amongst the widowed in Hun-gary, Romania and Greece. We were unable to fi nd an explanatory pattern for this varia-ble, because there are too many differences between countries.
This analysis was aimed at shedding light on the living arrangements in Spain as oppo-sed to in other European countries. In light of the results obtained, we can say that the pat-tern observed in Spain resembles that of Greece and Portugal: the prevalence of one-person households is similar in all of the Southern countries, although in fact, Spain had the lowest proportions in 1991 and the most pronounced rise by 2001, with an in-crease of almost 11%. However, the Spanish case differs in some aspects from the other Southern countries: women have a greater propensity to live alone; unmarried people have the greatest probability of living with others who are not their partner; and the in-crease of one-person households has been greater amongst the most elderly. Finally, in Spain, receiving or not a pension is the factor that shows the greatest differences in the pro-
bability of living alone. According to studies that indicated that the prevalence of living alo-ne was due to the improved material well-being of older people (López Doblas, 2005), we have found that part of the large increase seen in 2001 is due to the increased access to pensions amongst the most elderly.
REFERENCES
Abellán, A. et al. (2007). A propósito de las condicio-nes de vida de las personas mayores. Madrid: IMSERSO.
Aquilino, William S. (1990). “The Likelihood of Parent-adult Child Coresidence: Effects of Family Struc-ture and Parental Characteristics”. Journal of Marriage and the Family, 52: 405-419.
Bishop, C. E. (1986). “Living Arrangement Choices of Elderly Singles: Effects of Income and Dis-ability”. Health Care Financ Rev., 7(3): 65-73.
Borsch-Supan, Axel; Laurence J. Kotlikoff and John N. Morris (1988). “The Dynamics of Living Arrange-ments of the Elderly”. National Bureau of Eco-nomic Research, NBER Working Paper W2787. (On-line) http://ssrn.com/abstract=268189, last access 23 October 2010.
Daatland, Svein O. and Katharina Herlofson (2003). “‘Lost Solidarity’or ‘Changed Solidarity’: A Com-parative European View of Normative Family Solidarity”. Ageing and Society, 23(05): 537-560.
De Jong Gierveld, Jenny; Helga de Valk and Marieke Blommesteijn (2001). “Living Arrangements of Older Persons and Family Support in More De-veloped Countries”. Population Bulletin of the United Nations. Living Arrangements of Older Persons: Critical Issues and Policy Responses, 42/43: 193-214.
Delbès, Christiane; Joëlle Gaymu and Sabine Sprin-ger (2006). “Les femmes vieillissent seules, les hommes vieillissent à deux. Un bilan européen”. Population et Sociètès, 1: 419.
Eggerickx, Thierry and François Bégeot (1993). “ Les recensements en Europe dans les années 1990. De la diversité des pratiques nationales à la com-parabilité internationale des résultats”. Popula-tion (French Edition), 48(6) : 1705-1732.
Egidi, Viviana and Patrick Festy (2006). “Comparer pour comprendre”. In : G. Caselli, J. Vallin and G.
Reis. Rev.Esp.Investig.Sociol. ISSN-L: 0210-5233. Nº 144, October - December 2013, pp. 139-152
152 Elderly Who Live Alone: An Overview Based on the 1991 and 2001 Censuses
Wunsch (eds.). Démographie. Analyse et synthèse (Vol. VIII). Paris: INED.
Festy, Patrick and Jitka Rychtarikova (2008). “Living Conditions for the Elderly in the Late Twentieth Century”. In: J. Gaymu, P. Festy, M. Poulain and G. Beets (eds.), Future Elderly Living Conditions in Europe. Paris: INED.
Gaymu, Joëlle et al. (2006). “Determinants of the Liv-ing Arrangements of Older People in Europe”. European Journal of Population, 22(3): 241-262.
Gaymu, Joëlle and Sabine Springer (2010). MAGGIE project (Major Ageing and Gender Issues in Eu-rope) (on line) http://www.maggie-project.org/, last access 13 September 2010.
IPUMS-IECM. Minnesota Population Center. Integra-ted Public Use Microdata Series, International: Version 6.0 [Machine-readable database] (2010). Minneapolis: University of Minnesota.
Jovell, Albert J. (1995). Análisis de regresión logística. Madrid: Centro de Investigaciones Sociológicas.
Lacovou, Maria (2000). “Health, Wealth and Progeny: Explaining the Living Arrangements of Older Eu-ropean Women”. Institute for Social and Eco-nomic Research Essex University, (Paper 8) (on line) http://www.iser.essex.ac.uk/publications/working-papers/iser/2000-08.pdf, last access 2 March 2011.
López Doblas, J. (2005). Personas mayores viviendo solas. La autonomía como valor en alza. Madrid: IMSERSO.
Menacho, Teresa (2002). Los tipos de estandarización en demografía. Aplicación al estudio de las dife-rencias regionales de la actividad y desempleo en España, 1990-2000. Research Report presen-ted in the Department of Geography Universitat Autònoma de Barcelona.
Mutchler, Jan E. and Jeffrey A. Burr (1991). “A Lon-gitudinal Analysis of Household and Nonhouse-hold Living Arrangements in Later Life”. Demo-graphy, 28(3): 375-390.
Palloni, Alberto (2001). “Living Arrangements of Older Persons”. Population Bulletin of the Unit-ed Nations. Living Arrangements of Older Per-
sons: Critical Issues and Policy Responses, 42-43: 54-110.
Pampel, Fred C. (1992). “Trends in Living Alone among the Elderly in Europe”. Elderly Migration and Population Redistribution: 97-117.
Pérez Ortiz, L. (2006): La estructura social de la vejez en España. Nuevas y viejas formas de envejecer. Madrid: IMSERSO.
Pezzin, Liliana E. and Barbara S. Schone (1999). “Pa-rental Marital Disruption and Intergenerational Transfers: An Analysis of Lone Elderly Parents and their Children”. Demography, 36(3): 287-297.
Reher, David S. (1998). “Family Ties in Western Eu-rope: Persistent Contrasts”. Population and De-velopment Review, 24(2): 203-234.
Robine, Jean-Marie; Isabelle Romieu and Emmanu-elle Cambois (1999). “Health Expectancy Indica-tors”. Bulletin of the World Health Organization, 77 (2): 181-185.
Tomassini, Cecilia et al. (2004). “Living Arrangements among Older People: An Overview of Trends in Europe and the USA”. Further Release of 2001 Census Data, 1329: 24-64.
United Nations (2005). Living arrangements of older persons around the world, (New York ed.) United Nations. Department of Economic and Social Af-fairs. Population Division (on line) http://www.un.org/esa/population/publications/livingar-rangement/TMP7s4uhvrit7.htm, last access 20 October 2010.
Wolf, David A. (1995). “Changes in the Living Arrange-ments of Older Women: An International Study”. The Gerontologist, 35(6): 724.
Worobey, Jacqueline L. and Ronald J. Angel (1990). “Functional Capacity and Living Arrangements of Unmarried Elderly Persons”. Journal of Geronto-logy, 45(3): 95-101.
Zueras, Pilar and Marc Ajenjo Cosp (2010). “Modelos de convivencia de las personas mayores en Cataluña. Impacto del deterioro de la salud en la independencia residencial”. Revista Española de Geriatría y Gerontología, 45(5): 259-266.
RECEPTION: October 1, 2012REVIEW: November 21, 2012ACCEPTANCE: January 10, 2013