26
MBA 604 Financial Analysis Project By: Yasir Rashid, Omar Alaqeel, Ronald Davis, Laurie Davis, & Darren Southard
| Date post: | 28-Dec-2015 |
| Category: |
Documents |
| Upload: | alan-floyd |
| View: | 215 times |
| Download: | 1 times |

MBA 604 Financial Analysis ProjectBy:
Yasir Rashid, Omar Alaqeel, Ronald Davis, Laurie Davis, & Darren Southard
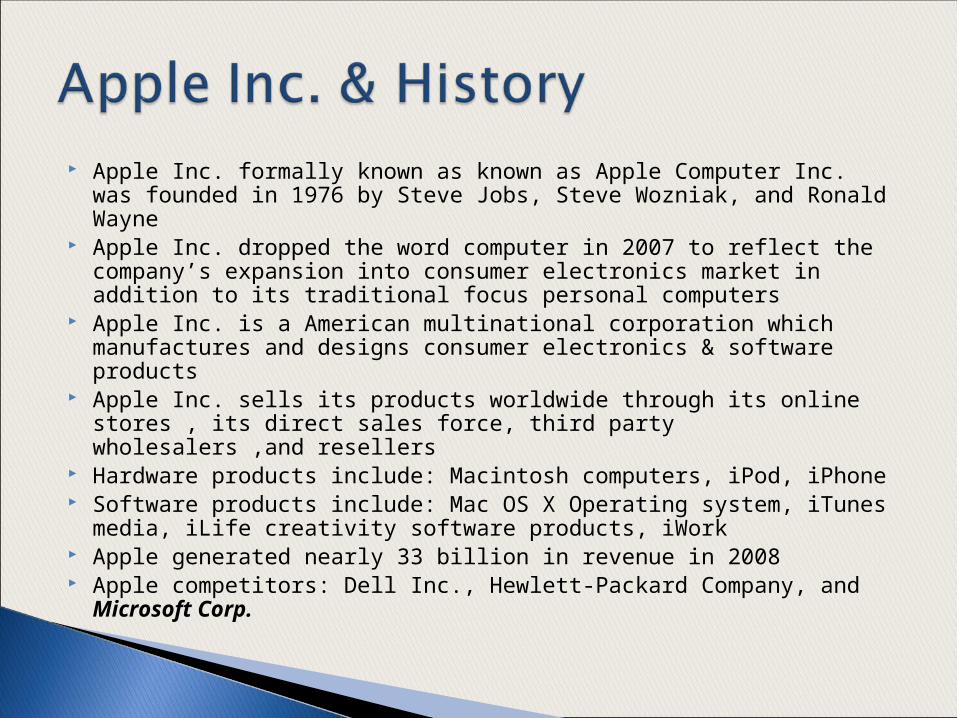
Apple Inc. formally known as known as Apple Computer Inc. was founded in 1976 by Steve Jobs, Steve Wozniak, and Ronald Wayne
Apple Inc. dropped the word computer in 2007 to reflect the company’s expansion into consumer electronics market in addition to its traditional focus personal computers
Apple Inc. is a American multinational corporation which manufactures and designs consumer electronics & software products
Apple Inc. sells its products worldwide through its online stores , its direct sales force, third party wholesalers ,and resellers
Hardware products include: Macintosh computers, iPod, iPhone Software products include: Mac OS X Operating system, iTunes
media, iLife creativity software products, iWork Apple generated nearly 33 billion in revenue in 2008 Apple competitors: Dell Inc., Hewlett-Packard Company, and
Microsoft Corp.

Microsoft corporation was founded in 1975 by Bill Gates and Paul Allen
Multinational computer technology corporation which develops, manufactures, licenses, and supports a wide range of products for computing devices.
Microsoft hardware products include: Xbox, Xbox 360, Mouse/keyboards and Zune.
Microsoft software products include: Microsoft windows, Microsoft Office (i.e. Excel, PowerPoint, Word, etc.), PC/Xbox software games
Microsoft generated 61.98 billion in revenue in 2008

Apple (Ticker: AAPL) Microsoft (Ticker: MSFT)
Earnings Per Share (EPS)=Net Income/No. of Shares outstanding
Q1 (12/2008) EPS: 1605.00/890.42 = $1.80
Q4 (09/2008) EPS: 1136.00/888.33 = $1.28
Annual EPS (09/2008): 4,834.00/888.33 = $5.44
Q2 (12/2008) EPS: 4,174.00/8,889.00 = $0.47
Q1 (09/2008) EPS: 4,373.00/8,977.00 = $0.49
Annual EPS (06/2008): 17,681.00/9,151.00 = $1.93

Apple Microsoft
Price Earnings Ratio=Market Price Per Share/Net Income Per Share
Q1 (12/2008) P/E: $85.35/1.81 = 47.2 times
Q4 (09/2008) P/E: $113.66/1.28 = 88.8
Annual P/E (09/2008): $113.66/5.04 = 20.7
Q2 (12/2008) P/E: $19.44/0.47 = 41.4 times
Q1 (09/2008) P/E: 26.29/0.48 = 54.8
Annual P/E (06/2008): 19.44/1.87 = 10.4

Apple Microsoft
Book value Per Share=Total Shareholders Equity/Total outstanding shares
Q1 (12/2008) BVPS: 19,878.00/890.42 = $22.32
Q4 (09/2008) BVPS: 21,030.00/888.33 = $23.67
Annual BVPS (09/2008): 21,030.00/888.33 = $23.67
Q2 (12/2008) BVPS: 34,478.00/8,889.00 = $3.88
Q1 (09/2008) BVPS: 33,594.00/8,977.00 = $3.74
Annual BVPS (06/2008): 36,286.00/9,151.00 = $3.97

Apple
Sept. 2008 – Q4 SG&A = (999.00 * 1,000,000) / Revenue = (7,895.00 * 1,000,000) = 0.1265 * 100 = 12.65%
Dec. 2008 – Q1 SG&A = (1,091.00 * 1,000,000) / Revenue = (10,167.00 * 1,000,000) = 0.1073 * 100 = 10.73%
Year Ending Sept. 2008 SG&A = (3,761 * 1,000,000) / Revenue = (32,749 * 1,000,000) = 0.1148 * 100 = 11.48%
Microsoft
Sept. 2008 – Q1 SG&A = (3,931.00 * 1,000,000) / Revenue = (15,061.00 * 1,000,000) = 0.2610 * 100 = 26.10%
Dec. 2008 – Q2 SG&A = (4,493.00 * 1,000,000) / Revenue = (16,629.00 * 1,000,000) = 0.2702 * 100 = 27.02%
Year Ending June 2008 SG&A = (18,166 * 1,000,000) / Revenue = (60,420 * 1,000,000) = 0.3007 * 100 = 30.07%

Apple
Sept. 2008 – Q4 Revenues = (7,895 * 1,000,000) / Avg. Quarterly Assets = ((39,572 *
1,000,000) + (31,709 * 1,000,000)) / 2 = 35,640,500,000
Asset Turnover = 0.22 Dec. 2008 – Q1
Revenues = (10,167 * 1,000,000) / Avg. Quarterly Assets = ((42,787 *
1,000,000) + (39,572 * 1,000,000)) / 2 = 41,179,500,000
Asset Turnover = 0.25
Microsoft
Sept. 2008 – Q1 Revenues = (15,061 * 1,000,000) / Avg. Quarterly Assets = ((65,117 *
1,000,000) + (72,793 * 1,000,000)) / 2 = 68,955,000,000
Asset Turnover = 0.22 Dec. 2008 – Q2
Revenues = (16,629 * 1,000,000) / Avg. Quarterly Assets = ((65,786 *
1,000,000) + (65,117 * 1,000,000)) / 2 = 65,451,500,000
Asset Turnover = 0.25

Apple
Sept. 2008 – Q4 Cost of sales = (5,022 * 1,000,000) / Avg. Quarterly Inventory = ((509 *
1,000,000) + (545 * 1,000,000)) / 2 = 527,000,000
Inventory Turnover = 9.53 Dec. 2008 – Q1
Cost of sales = (6,477 * 1,000,000) / Avg. Quarterly Inventory = ((396 *
1,000,000) + (509 * 1,000,000)) / 2 = 452,500,000
Inventory Turnover = 14.31
Microsoft
Sept. 2008 – Q1 Cost of sales = (2,263 * 1,000,000) / Avg. Quarterly Inventory = ((1,640 *
1,000,000) + (985 * 1,000,000)) / 2 = 1,312,500,000
Inventory Turnover = 1.72 Dec. 2008 – Q2
Cost of sales = (3,275 * 1,000,000) / Avg. Quarterly Inventory = ((968 *
1,000,000) + (1640 * 1,000,000)) / 2 = 1,304,000,000
Inventory Turnover = 2.51
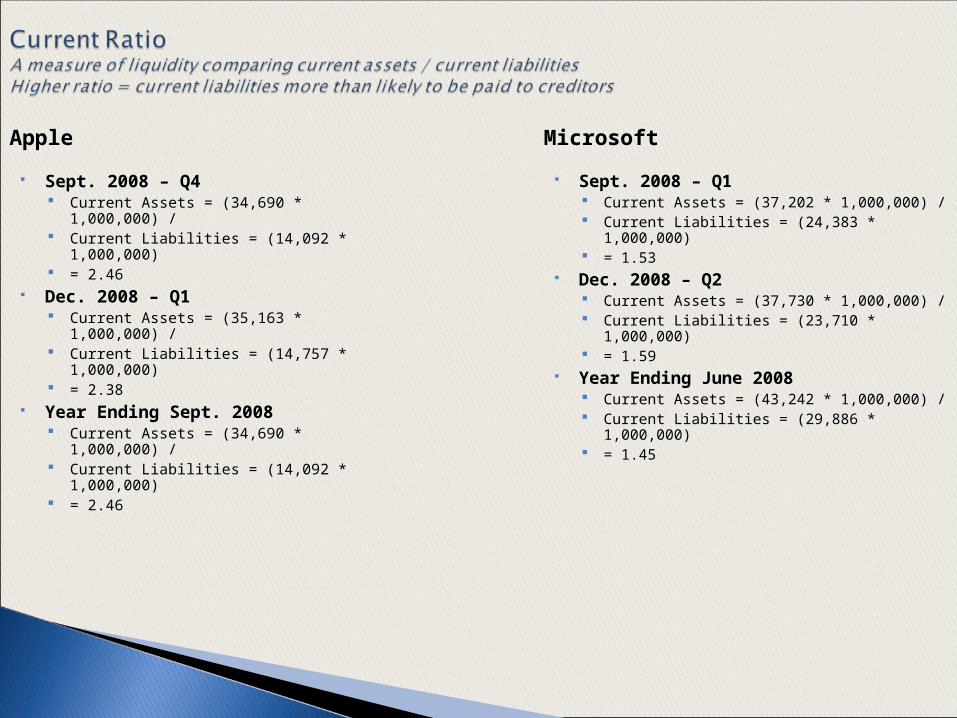
Apple
Sept. 2008 – Q4 Current Assets = (34,690 * 1,000,000) / Current Liabilities = (14,092 * 1,000,000) = 2.46
Dec. 2008 – Q1 Current Assets = (35,163 * 1,000,000) / Current Liabilities = (14,757 * 1,000,000) = 2.38
Year Ending Sept. 2008 Current Assets = (34,690 * 1,000,000) / Current Liabilities = (14,092 * 1,000,000) = 2.46
Microsoft
Sept. 2008 – Q1 Current Assets = (37,202 * 1,000,000) / Current Liabilities = (24,383 * 1,000,000) = 1.53
Dec. 2008 – Q2 Current Assets = (37,730 * 1,000,000) / Current Liabilities = (23,710 * 1,000,000) = 1.59
Year Ending June 2008 Current Assets = (43,242 * 1,000,000) / Current Liabilities = (29,886 * 1,000,000) = 1.45

Apple (Q1) Microsoft (Q2)
Profit margin of 36%: Gross margin(3,690) /
Net sales revenues (10,167)= 0.362
Return on assets of
3.75%: Net income (1,605) + interest
(1-.30) / Total assets (42,787)
= 1,605+(1-.30)/42,787= .0375
Profit margin of 80%: Gross margin /
Net sales revenues 13354 / 16629 = 0.803
Return on assets of 13%: Net income (8547) + interest
(1-Tax rate) / Total assets (65,786)
= 8547 + 195.00(mil)(1-0.26) /
65,787= 0.13

Apple (Q1) Microsoft (Q2)
Return on common equityOf 7%:
Net income (1,605) / Shareholders’ equity
(22,909) = 0.07006
Cost of goods sold (6,477)/
sales (10,167)= 0.637061 (64%)
Return on common equity
of 12%: Net income (8,547) / Shareholders’ equity
(34,478) = 0.1214
Cost of goods sold
(3,275)/sales (16,629)
= 0.196945 (20%)
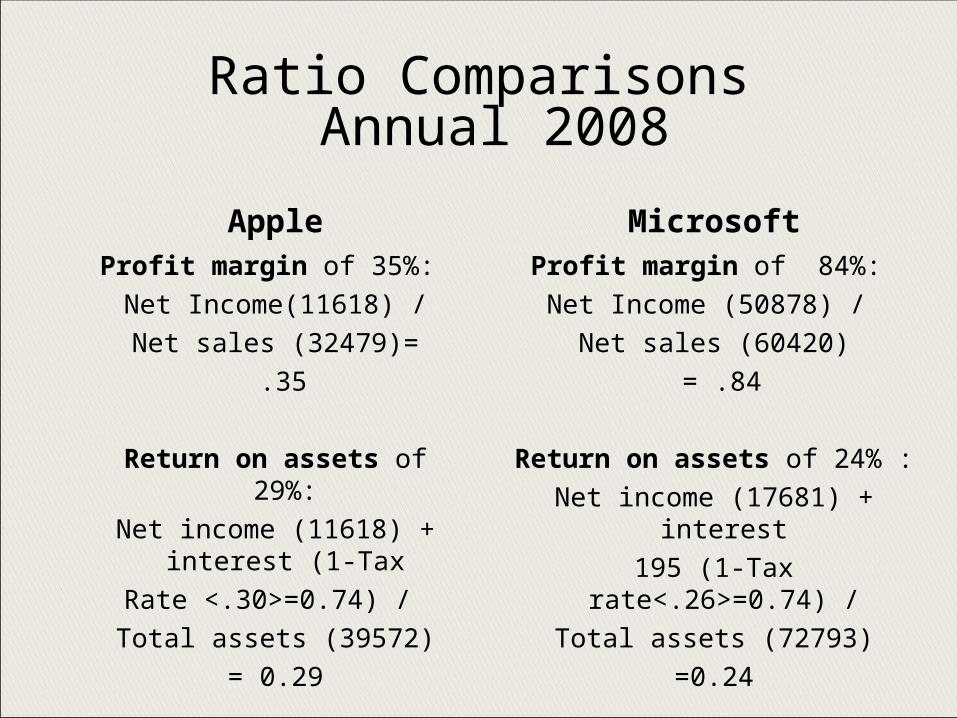
Ratio Comparisons Annual 2008
AppleProfit margin of 35%: Net Income(11618) /
Net sales (32479)= .35
Return on assets of 29%:
Net income (11618) + interest (1-Tax Rate <.30>=0.74) / Total assets (39572)
= 0.29
MicrosoftProfit margin of 84%: Net Income (50878) /
Net sales (60420) = .84
Return on assets of 24% :
Net income (17681) + interest 195 (1-Tax rate<.26>=0.74) /
Total assets (72793)=0.24

Apple Microsoft
Return on common equityOf 23%:
Net income (4834) / Shareholders’ equity
(21030) = 0.229
Cost of goods sold
(20861)/sales (32479)= .642 or 64%
Return on common equityOf 49%:
Net income (17681) / Shareholders’ equity
(36286) = 0.487
Cost of goods sold (9542)/
sales (60420)= 0.157 or 16%

Apple IncCommon Size Income Statement
QTR Ending Dec-08 Percent of Sep-08 Percent of
Net sales 10,167.00 Net sales 7,895.00 Net sales
Cost of sales 6,477.00 63.71% 5,022.00 63.61%
Gross Margin 3,690.00 36.29% 2,873.00 36.39%
R&D 315.00 298.00
SG&A 1,091.00 999.00
Operating income 2,284.00 22.46% 1,576.00 19.96%
Depreciation 158.00 134.00
Op income W/DP 2,126.00 20.91% 1,442.00 18.26%
Other Income 158.00 140.00
Income Before Tax 2,284.00 22.46% 1,582.00 20.04%
Tax 679.00 446.00
Income After Tax 1,605.00 15.79% 1,136.00 14.39%
Items as percent of net sales (in millions)

Microsoft CorpCommon Size Income Statement
QTR Ending Dec-08 Percent of Sep-08 Percent of
Net sales 16,629.00 Net sales 15,061.00 Net sales
Cost of sales 3,275.00 19.69% 2,263.00 15.03%
Gross Margin 13,354.00 80.31% 12,798.00 84.97%
R&D 2,290.00 2,283.00
SG&A 4,493.00 3,931.00
Operating income 6,571.00 39.52% 6,584.00 43.72%
Depreciation 632.00 585.00
Op income W/DP 5,939.00 35.71% 5,999.00 39.83%
Other Income -476.00 -215.00
Interst Income 175.00 207.00
Income Before Tax 5,638.00 33.90% 5,991.00 39.78%
Tax 1,464.00 1,618.00
Income After Tax 4,174.00 25.10% 4,373.00 29.04%
Items as percent of net sales (in millions)

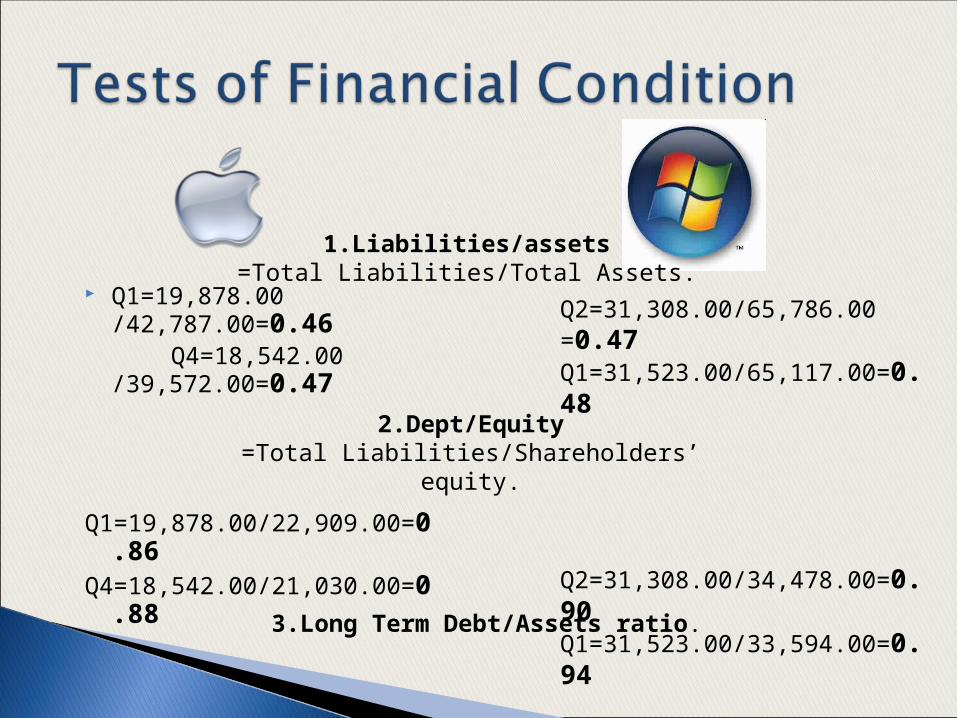
Q1=19,878.00 /42,787.00=0.46
Q4=18,542.00 /39,572.00=0.47
Q1=19,878.00/22,909.00=0.86
Q4=18,542.00/21,030.00=0.88
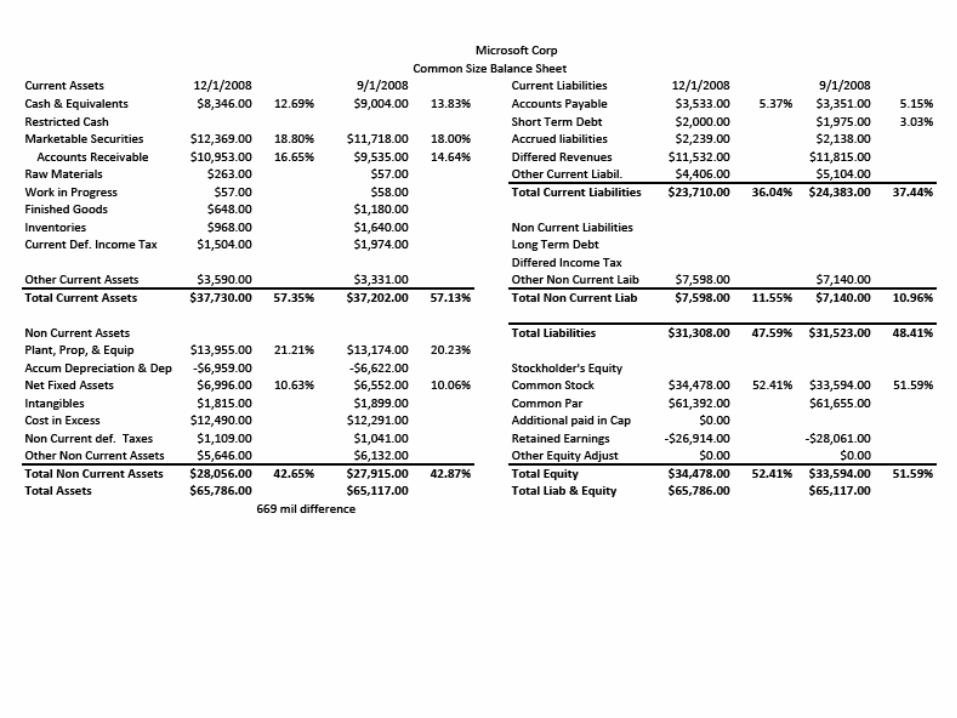
Q2=31,308.00/65,786.00 =0.47Q1=31,523.00/65,117.00=0.48
Q2=31,308.00/34,478.00=0.90Q1=31,523.00/33,594.00=0.94
1.Liabilities/assets=Total Liabilities/Total Assets.
2.Dept/Equity=Total Liabilities/Shareholders’ equity.
3.Long Term Debt/Assets ratio.

1.Acid-test (Quick)=(Current Assets - Inventory)/Current Liabilities.
2.Days’ Receivables=Accounts Receivable/(Sales/365).
Q1=(35,163.00-396)/14,757.00=2.36 Q4=(34,690.00-509)/14,092.00=2.42
Q2=(37,730.00-968.00)/23,710.00=1.55Q1=(37,202.00-1,640.00)/24,383.00=1.45
Q1=2,196.00/(10,167.00/365)=78Q4=2,422.00/(7,895.00/365)=111
Q2=10,953.00/(16,629.00/365)=240Q1=9,535.00/(15,061.00/365)=231

Depreciation Method: Apple & Microsoft both utilize straight line method of depreciation.
Depreciation is computed principally on the straight-line method over the estimated useful lives of the assets.
Inventory Method: Inventories are stated at the lower of cost, computed using the first-in,
first-out method, or market. If the cost of the inventories exceeds their market value, provisions are made currently for the difference between the cost and the market value. The Company’s inventories consist primarily of finished goods for all periods presented.

Apple 10K report revealed that the auditors (KPMG) opinion is Unqualified opinion on the consolidated financial statements.

Apple SG&A = 11.48% Asset Turnover (Q1)= 0.25 Inventory T/O = 14.31 (Q1) Current Ratio = 2.46 (Earnings Per Share =
$5.44) P/E = 20.7
Microsoft SG&A = 30.7% Asset Turnover (Q1)= 0.25 Inventory T/O= 2.51 (Q2) Current Ratio = 1.45 (Earnings Per Share =
$1.93) P/E = 10.4

Apple, Inc. References:1) Apple, Inc., Annual Balance Sheet Retrieved May 9, 2009, from
http://www.marketwatch.com/tools/quotes/financials.asp?symb=AAPL&sid=609&report=2&freq=1
2) Apple, Inc., Annual Income Statement Retrieved May 9, 2009, from http://www.marketwatch.com/tools/quotes/financials.asp?symb=AAPL&sid=609&report=1&freq=1
3) Apple, Inc., Quarterly Income Statement Retrieved May 9, 2009, from http://www.marketwatch.com/tools/quotes/financials.asp?symb=AAPL&sid=609&report=1&freq=2
4) Apple, Inc., Quarterly Balance Sheet Retrieved May 9, 2009, from http://www.marketwatch.com/tools/quotes/financials.asp?symb=AAPL&sid=609&report=2&freq=2

Microsoft, Inc. References:5) Microsoft, Inc., Annual Balance Sheet Retrieved May 9, 2009, from
http://www.marketwatch.com/tools/quotes/financials.asp?symb=MSFT&sid=3140&report=2&freq=1
6) Microsoft, Inc., Annual Income Statement Retrieved May 9, 2009, from http://www.marketwatch.com/tools/quotes/financials.asp?symb=MSFT&sid=3140&report=1&freq=1
7) Microsoft, Inc., Quarterly Income Statement Retrieved May 9, 2009, from http://www.marketwatch.com/tools/quotes/financials.asp?symb=MSFT&sid=3140&report=1&freq=2
8) Microsoft, Inc., Quarterly Balance Sheet Retrieved May 9, 2009, from http://www.marketwatch.com/tools/quotes/financials.asp?symb=MSFT&sid=3140&report=2&freq=2

Ratio Definitions:9) Selling, General & Administrative Expense, Retrieved May 9, 2009, from
http://www.investopdeia.com/terms/s/sga.asp
10) Asset Turnover, Retrieved May 9, 2009, from http://www.investopedia.com/terms/a/assetturnover.asp
11) Inventory Turnover, Retrieved May 9, 2009, from http://www.investopedia.com/terms/i/inventoryturnover.asp
12) Current Ratio, Retrieved May 9, 2009, from http://www.investopedia.com/terms/c/currentratio.asp


