MBRRACE-UK Perinatal Mortality Surveillance Report UK Perinatal Deaths for births from January to December 2013 Supplementary Report UK Trusts and Health Boards December 2015 Maternal, Newborn and Infant Clinical Outcome Review Programme
UK Perinatal Deaths for births from January to December 2013
Supplementary Report UK Trusts and Health Boards
December 2015
Maternal, Newborn and Infant Clinical Outcome Review Programme
December 2015
Department of Health Sciences University of Leicester 22-28 Princess Road West Leicester, LE1 6TP
Maternal, Newborn and Infant Clinical Outcome Review Programme
Bradley N Manktelow, Lucy K Smith, T Alun Evans, Pauline Hyman-Taylor, Jennifer J Kurinczuk, David J Field, Peter W Smith, Frances Mielewczyk, Elizabeth S Draper
UK Perinatal Deaths for births from January to December 2013
Supplementary Report UK Trusts and Health Boards
Design by: Sarah Chamberlain and Andy Kirk
Cover Artist: Tana West
This report should be cited as:
Manktelow BM, Smith LK, Evans TA, Hyman-Taylor P, Kurinczuk JJ, Field DJ, Smith PW, Mielewczyk F, Draper ES, on behalf of the MBRRACE-UK collaboration. MBRRACE-UK Perinatal Mortality Surveillance Report UK Perinatal Death for Births from January to December 2013 – Supplementary Report: UK Trusts and Health Boards. Leicester: The Infant Mortality and Morbidity Studies Group, Department of Health Sciences, University of Leicester, 2015.
FundingThe Maternal, Newborn and Infant Clinical Outcome Review Programme, delivered by MBRRACE-UK, is commissioned by the Healthcare Quality Improvement Partnership (HQIP) on behalf of NHS England, NHS Wales, the Scottish Government Health and Social Care Directorate, The Northern Ireland Department of Health, Social Services and Public Safety (DHSSPS), the States of Guernsey, the States of Jersey, and the Isle of Man Government.
MBRRACE-UK - UK Perinatal Deaths for Births from January to December 2013 - Supplementary Report UK Trusts and Health Boards 1
Introduction to this supplementary reportThis is the first perinatal mortality surveillance report produced by MBRRACE-UK in which perinatal mortality is reported for Trusts and Health Boards in the UK. This is a Supplement to the MBRRACE UK perinatal mortality surveillance report for births in 2013 published in June 2015 https://www.npeu.ox.ac.uk/mbrrace-uk/reports
The purpose of this Supplement is to summarise the stillbirth, neonatal death and extended perinatal death rates reported in the recently released reports to individual Trusts and Health Boards for babies born within their hospitals. These reports were released to enable individual Trusts and Health Boards to check the number of deaths identified as occurring to babies born in their Trust or Health Board and were made available to local MBRRACE-UK registered reporters through the MBRRACE-UK on-line reporting system.
Although for births in 2013, stillbirth, neonatal death and extended perinatal death rates for Trusts and Health Boards appear in this supplement to the main MBRRACE-UK perinatal surveillance report, for future years this information will be reported in the main MBRRACE-UK perinatal surveillance report.
Deaths reported to MBRRACE-UK
Deaths to be reported to MBRRACE-UK for births since January 2013 are:
• Late fetal losses: a baby delivered between 22+0 and 23+6 weeks gestational age showing no signs of life, irrespective of when the death occurred.
• Stillbirths: a baby delivered at or after 24+0 weeks gestational age showing no signs of life, irrespective of when the death occurred.
• Neonatal deaths: a live born baby (born at 20+0 weeks gestational age or later or, with a birthweight of 400g or more where an accurate estimate of gestation is not available) who died before 28 completed days after birth.
Deaths included in reported mortality rates
In this report rates of stillbirth, neonatal death and extended perinatal death (i.e. stillbirths and neonatal deaths) are reported for births in the UK in 2013. In order to ensure comparability of mortality rates between organisations, births less than 24+0 weeks gestational age and terminations of pregnancy are excluded from the reported mortality rates. This avoids the influence of the wide disparity in the classification of babies born before 24+0 weeks gestational age as a neonatal death or a fetal loss (discussed in more detail in Chapter 5 in the main report – https://www.npeu.ox.ac.uk/mbrrace-uk/reports) and the known variation in the rate of termination of pregnancy for congenital anomaly between different sections of the population (see Section 7.3 of the main report – https://www.npeu.ox.ac.uk/mbrrace-uk/reports).
The intention for subsequent MBRRACE-UK reports is to account for all deaths from 22+0 weeks gestational age and, additionally, to identify the influence of deaths due to congenital anomalies. In order to achieve this it is essential that all Trusts and Health Boards provide data for all fetal losses between 22+0 and 23+6 weeks gestational age and work with MBRRACE-UK to improve the cause of death classification.
In this report the neonatal deaths are reported by place of birth irrespective of where the death occurred.
MBRRACE-UK - UK Perinatal Deaths for Births from January to December 2013 - Supplementary Report UK Trusts and Health Boards2
Data sources
Deaths were reported directly to MBRRACE-UK by the Trust or Health Board where the death occurred, while the information on births was obtained from routine sources, including the Office for National Statistics, NHS Numbers for Babies (England & Wales), National Records of Scotland, Information Services Division (Scotland) and Northern Ireland Maternal and Child Health HSC Public Health Agency.
Births are attributed to the Trusts and Health Boards according to their configuration on 1st September 2015, incorporating any changes since 2013. Home births are included where the birth was attributable to a Trust or Health Board from the routine data source.
Crude mortality and stabilised & adjusted mortality rates
Three mortality outcomes are reported for each organisation: stillbirth, neonatal death, and extended perinatal death. These mortality rates are presented in two different ways: as a ‘crude’ mortality rate and as a ‘stabilised & adjusted’ mortality rate.
The crude mortality rate is the number of deaths for every 1,000 births (or 1,000 live births for neonatal mortality) and is a snapshot of mortality for births in 2013. However, this can be misleading as a measure of the underlying (or long-term) mortality rate due to chance variation and differences between Trusts and Health Boards in the proportion of high risk pregnancies.
The stabilised & adjusted mortality rate is also reported which provides a more reliable estimate of the underlying mortality rate, accounting for mother’s age, socio-economic deprivation, baby’s sex and ethnicity, multiplicity and gestational age at birth (neonatal deaths only). In addition, to account for the wide variation in case-mix, all Trusts and Health Boards have been classified hierarchically into five mutually exclusive comparator groups by their level of service provision:
(i) Neonatal surgical provision and Level 3 Neonatal Intensive Care Unit;
(ii) Level 3 Neonatal Intensive Care Unit;
(iii) 4,000 or more births per annum at 24 weeks or later;
(iv) 2,000-3,999 births per annum at 24 weeks or later;
(v) Under 2,000 births per annum at 24 weeks or later.
While it is not possible to adjust for all potential risk factors, the adjustment measures and grouping of Trusts and Health Boards allow for more appropriate comparison based on the risk profile of the population of women served.
For further details of the stabilisation and adjustment methodology please see pages 18-19 and 95-96 of the main Perinatal Mortality Surveillance Report (June 2015)
https://www.npeu.ox.ac.uk/mbrrace-uk/reports
Suppression of rates calculated when there are few deaths
In order to avoid disclosure of information which could identify individuals, crude mortality rates based on very small numbers of deaths have not been included in line with guidance from ONS and Government Statistical Service (GSS). In subsequent reports this should affect fewer organisations as more data will be available by combining years.
MBRRACE-UK - UK Perinatal Deaths for Births from January to December 2013 - Supplementary Report UK Trusts and Health Boards 3
Identifying potentially high and low rates of death
The crude and the stabilised & adjusted stillbirth, neonatal mortality and extended perinatal mortality rates for UK Trusts and Health Boards are presented in the tables in this report, categorised by the five comparator groups. The average mortality rate used in each of the five tables is that of the relevant comparator group: for example, the reported mortality rates of Trusts and Health Boards with neonatal surgical provision and Level 3 neonatal intensive care units are compared to the average mortality rates derived from all of the Trust and Health Boards providing this level of care. Thus we present five different average comparators. This is in contrast to the main report published in June 2015 where the comparator was the overall national average mortality rate.
In the tables each Trust and Health Board has been colour coded based on their stabilised & adjusted extended perinatal mortality rate:
● more than 10% lower than the average for the comparator group● up to 10% lower than the average for the comparator group● up to 10% higher than the average for the comparator group● more than 10% higher than the average for the comparator group
How local organisations should respond to these data
These data are intended to give local teams an insight into clinical performance based not just on crude mortality rates but also having taken account of at least some important socio-demographic factors that influence pregnancy outcomes.
MBRRACE-UK recommend that:
All Trusts and Health boards which have been identified as having a stabilised & adjusted stillbirth, neonatal or extended perinatal mortality rate that falls in the red band ● should conduct a local review in order to identify factors which might be responsible for their reported high stabilised & adjusted mortality rate.
Trusts and Health Boards whose stabilised & adjusted stillbirth, neonatal or extended perinatal mortality rate falls within the amber band ● should similarly consider carrying out a local review.
For those who are in the yellow band ● (and perhaps even green ●) any additional local review would be justified if the local aspiration is not simply to be average but to seek levels of clinical performance that compare with those achieved in other parts of the developed world, particularly the Nordic countries.
MBRRACE-UK - UK Perinatal Deaths for Births from January to December 2013 - Supplementary Report UK Trusts and Health Boards4
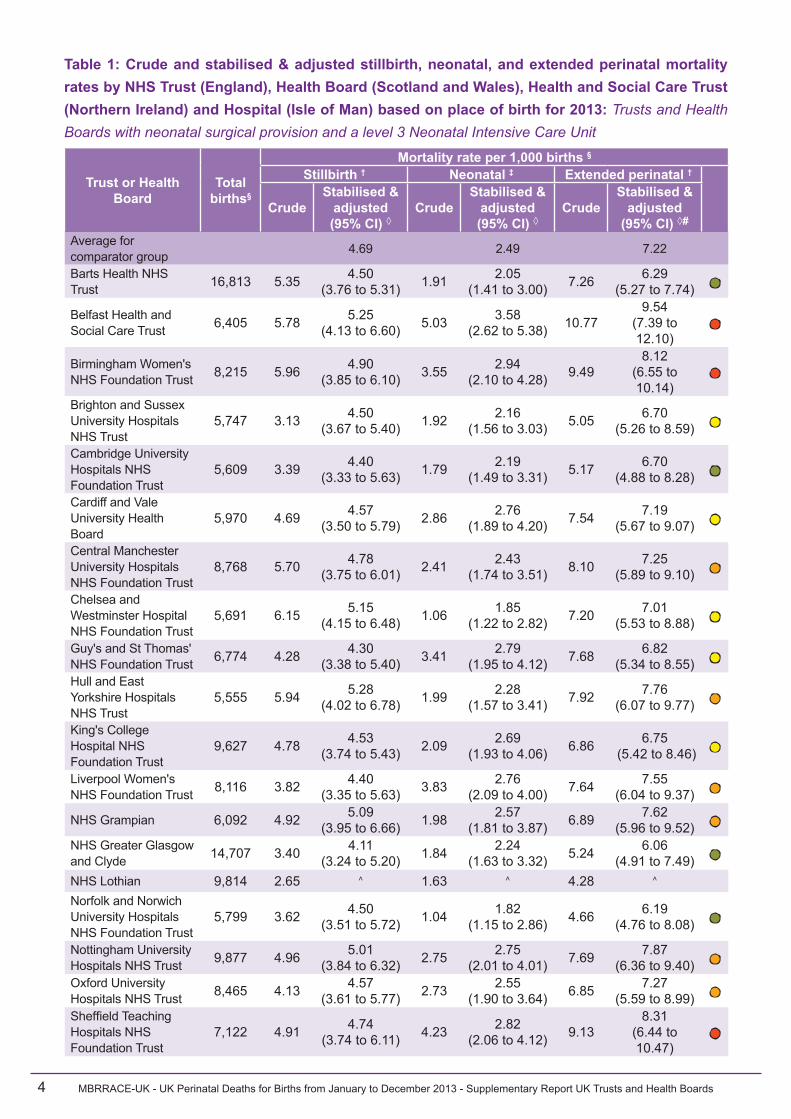
Table 1: Crude and stabilised & adjusted stillbirth, neonatal, and extended perinatal mortality rates by NHS Trust (England), Health Board (Scotland and Wales), Health and Social Care Trust (Northern Ireland) and Hospital (Isle of Man) based on place of birth for 2013: Trusts and Health Boards with neonatal surgical provision and a level 3 Neonatal Intensive Care Unit
Trust or Health Board
Total births§
Mortality rate per 1,000 births §
Stillbirth † Neonatal ‡ Extended perinatal †
CrudeStabilised &
adjusted(95% CI) ◊
CrudeStabilised &
adjusted(95% CI) ◊
CrudeStabilised &
adjusted(95% CI) ◊#
Average for comparator group 4.69 2.49 7.22
Barts Health NHS Trust 16,813 5.35 4.50
(3.76 to 5.31) 1.91 2.05 (1.41 to 3.00) 7.26 6.29
(5.27 to 7.74) ●Belfast Health and Social Care Trust 6,405 5.78 5.25
(4.13 to 6.60) 5.03 3.58 (2.62 to 5.38) 10.77
9.54 (7.39 to 12.10)
●
Birmingham Women's NHS Foundation Trust 8,215 5.96 4.90
(3.85 to 6.10) 3.55 2.94 (2.10 to 4.28) 9.49
8.12 (6.55 to 10.14)
●Brighton and Sussex University Hospitals NHS Trust
5,747 3.13 4.50 (3.67 to 5.40) 1.92 2.16
(1.56 to 3.03) 5.05 6.70 (5.26 to 8.59) ●
Cambridge University Hospitals NHS Foundation Trust
5,609 3.39 4.40 (3.33 to 5.63) 1.79 2.19
(1.49 to 3.31) 5.17 6.70 (4.88 to 8.28) ●
Cardiff and Vale University Health Board
5,970 4.69 4.57 (3.50 to 5.79) 2.86 2.76
(1.89 to 4.20) 7.54 7.19 (5.67 to 9.07) ●
Central Manchester University Hospitals NHS Foundation Trust
8,768 5.70 4.78 (3.75 to 6.01) 2.41 2.43
(1.74 to 3.51) 8.10 7.25 (5.89 to 9.10) ●
Chelsea and Westminster Hospital NHS Foundation Trust
5,691 6.15 5.15 (4.15 to 6.48) 1.06 1.85
(1.22 to 2.82) 7.20 7.01 (5.53 to 8.88) ●
Guy's and St Thomas' NHS Foundation Trust 6,774 4.28 4.30
(3.38 to 5.40) 3.41 2.79 (1.95 to 4.12) 7.68 6.82
(5.34 to 8.55) ●Hull and East Yorkshire Hospitals NHS Trust
5,555 5.94 5.28 (4.02 to 6.78) 1.99 2.28
(1.57 to 3.41) 7.92 7.76 (6.07 to 9.77) ●
King's College Hospital NHS Foundation Trust
9,627 4.78 4.53 (3.74 to 5.43) 2.09 2.69
(1.93 to 4.06) 6.86 6.75 (5.42 to 8.46) ●
Liverpool Women's NHS Foundation Trust 8,116 3.82 4.40
(3.35 to 5.63) 3.83 2.76 (2.09 to 4.00) 7.64 7.55
(6.04 to 9.37) ●NHS Grampian 6,092 4.92 5.09
(3.95 to 6.66) 1.98 2.57 (1.81 to 3.87) 6.89 7.62
(5.96 to 9.52) ●NHS Greater Glasgow and Clyde 14,707 3.40 4.11
Norfolk and Norwich University Hospitals NHS Foundation Trust
5,799 3.62 4.50 (3.51 to 5.72) 1.04 1.82
(1.15 to 2.86) 4.66 6.19 (4.76 to 8.08) ●
Nottingham University Hospitals NHS Trust 9,877 4.96 5.01
(3.84 to 6.32) 2.75 2.75 (2.01 to 4.01) 7.69 7.87
(6.36 to 9.40) ●Oxford University Hospitals NHS Trust 8,465 4.13 4.57
(3.61 to 5.77) 2.73 2.55 (1.90 to 3.64) 6.85 7.27
(5.59 to 8.99) ●Sheffield Teaching Hospitals NHS Foundation Trust
7,122 4.91 4.74 (3.74 to 6.11) 4.23 2.82
(2.06 to 4.12) 9.138.31
(6.44 to 10.47)
●
MBRRACE-UK - UK Perinatal Deaths for Births from January to December 2013 - Supplementary Report UK Trusts and Health Boards 5
Trust or Health Board
Total births§
Mortality rate per 1,000 births §
Stillbirth † Neonatal ‡ Extended perinatal †
CrudeStabilised &
adjusted(95% CI) ◊
CrudeStabilised &
adjusted(95% CI) ◊
CrudeStabilised &
adjusted(95% CI) ◊#
St George's University Hospitals NHS Foundation Trust
4,939 5.06 4.80 (3.76 to 6.05) 2.24 2.17
(1.53 to 3.34) 7.29 7.15 (5.58 to 9.15) ●
The Leeds Teaching Hospitals NHS Trust 9,820 5.30 4.93
(3.88 to 6.03) 2.76 2.73 (1.99 to 3.86) 8.04 7.71
(6.20 to 9.37) ●The Newcastle upon Tyne Hospitals NHS Foundation Trust
7,363 5.84 5.38 (4.19 to 6.97) 1.78 2.08
(1.44 to 3.19) 7.61 7.75 (6.23 to 9.63) ●
University College London Hospitals NHS Foundation Trust
6,141 4.40 4.49 (3.50 to 5.64) 3.76 2.39
(1.66 to 3.48) 8.14 7.14 (5.65 to 8.96) ●
University Hospital Southampton NHS Foundation Trust
5,715 4.37 4.63 (3.57 to 5.80) 2.28 2.44
(1.70 to 3.78) 6.65 7.17 (5.63 to 9.02) ●
University Hospitals Bristol NHS Foundation Trust
5,334 4.31 4.55 (3.59 to 5.87) 3.58 2.90
(1.95 to 4.35) 7.87 7.29 (5.76 to 9.20) ●
University Hospitals of Leicester NHS Trust 10,041 4.48 4.55
(3.62 to 5.79) 2.70 2.65 (1.95 to 3.97) 7.17 7.12
(5.73 to 8.77) ●Wirral University Teaching Hospital NHS Foundation Trust
3,443 4.36 4.80 (3.72 to 6.17) 2.04 2.44
(1.66 to 3.67) 6.39 7.35 (5.71 to 9.31) ●
† per 1,000 total births‡ per 1,000 live births§ excluding terminations of pregnancy and births <24+0 weeks gestational age◊ excluding births January 2013 births for England, Wales and Isle of Man due to unavailability of NN4B data for that month* entry suppressed because of small numbers# colours represent variation from average extended perinatal mortality rate for group˄ stabilised & adjusted rates not reported due to particular concerns over the unavailability of full birth records (http://www.isdscotland.org/Health-Topics/Maternity-and-Births/Births/Background.asp)
MBRRACE-UK - UK Perinatal Deaths for Births from January to December 2013 - Supplementary Report UK Trusts and Health Boards6
Table 2: Crude and stabilised & adjusted stillbirth, neonatal, and extended perinatal mortality rates by NHS Trust (England), Health Board (Scotland and Wales), Health and Social Care Trust (Northern Ireland) and Hospital (Isle of Man) based on place of birth for 2013: Trusts and Health Boards with a level 3 Neonatal Intensive Care Unit
Trust or Health Board
Total births§
Mortality rate per 1,000 births §
Stillbirth † Neonatal ‡ Extended perinatal †
CrudeStabilised &
adjusted(95% CI) ◊
CrudeStabilised &
adjusted(95% CI) ◊
CrudeStabilised &
adjusted(95% CI) ◊#
Average for comparator group 4.75 2.09 6.88
Abertawe Bro Morgannwg University Health Board
5,773 3.98 4.53 (3.58 to 5.87) 1.74 1.96
(1.35 to 2.97) 5.72 6.38 (5.05 to 8.08) ●
Aneurin Bevan University Health Board
6,019 3.66 4.60 (3.67 to 5.87) 2.17 2.17
(1.52 to 3.25) 5.81 6.65 (4.99 to 8.81) ●
Ashford and St Peter's Hospitals NHS Foundation Trust
3,965 5.04 4.91 (3.82 to 6.33) 2.28 2.04
(1.42 to 3.14) 7.31 7.27 (5.59 to 9.34) ●
Bolton NHS Foundation Trust 5,908 5.08 4.79
(3.75 to 6.07) 1.53 1.83 (1.23 to 2.83) 6.60 6.56
(5.17 to 8.49) ●Bradford Teaching Hospitals NHS Foundation Trust
5,745 8.18 5.73 (4.33 to 7.44) 2.28 2.13
(1.51 to 3.32) 10.448.20
(6.47 to 10.29)
●City Hospitals Sunderland NHS Foundation Trust
3,246 6.16 5.17 (3.98 to 6.69) 3.10 2.46
(1.67 to 4.18) 9.247.96
(6.28 to 10.33)
●East Kent Hospitals University NHS Foundation Trust
6,981 3.58 4.28 (3.31 to 5.53) 1.29 1.95
(1.35 to 2.99) 4.87 5.90 (4.54 to 7.84) ●
East Lancashire Hospitals NHS Trust 6,605 5.30 4.84
(3.90 to 6.12) 2.28 2.24 (1.52 to 3.43) 7.57 7.04
(5.48 to 8.92) ●Heart of England NHS Foundation Trust 10,379 4.14 4.27
(3.32 to 5.41) 1.93 2.25 (1.56 to 3.31) 6.07 6.04
(4.78 to 7.67) ●Homerton University Hospital NHS Foundation Trust
5,904 5.76 4.74 (3.72 to 5.97) 3.07 2.00
(1.42 to 2.97) 8.81 7.09 (5.63 to 9.15) ●
Imperial College Healthcare NHS Trust 9,703 6.08 5.12
(4.12 to 6.47) 4.15 2.64 (1.88 to 3.90) 10.20
8.19 (6.65 to 10.18)
●Lancashire Teaching Hospitals NHS Foundation Trust
4,437 5.41 5.24 (4.09 to 6.79) 1.36 1.85
(1.24 to 2.92) 6.76 7.38 (5.89 to 9.47) ●
Luton and Dunstable University Hospital NHS Foundation Trust
●University Hospitals Coventry and Warwickshire NHS Trust
5,830 4.29 4.62 (3.74 to 5.90) 1.89 2.02
(1.36 to 3.11) 6.17 6.53 (5.23 to 8.58) ●
University Hospitals of North Midlands NHS Trust
7,469 3.88 4.45 (3.43 to 5.72) 1.88 2.05
(1.37 to 3.08) 5.76 6.23 (5.03 to 8.00) ●
† per 1,000 total births‡ per 1,000 live births§ excluding terminations of pregnancy and births <24+0 weeks gestational age◊ excluding births January 2013 births for England, Wales and Isle of Man due to unavailability of NN4B data for that month* entry suppressed because of small numbers# colours represent variation from average extended perinatal mortality rate for group
MBRRACE-UK - UK Perinatal Deaths for Births from January to December 2013 - Supplementary Report UK Trusts and Health Boards8
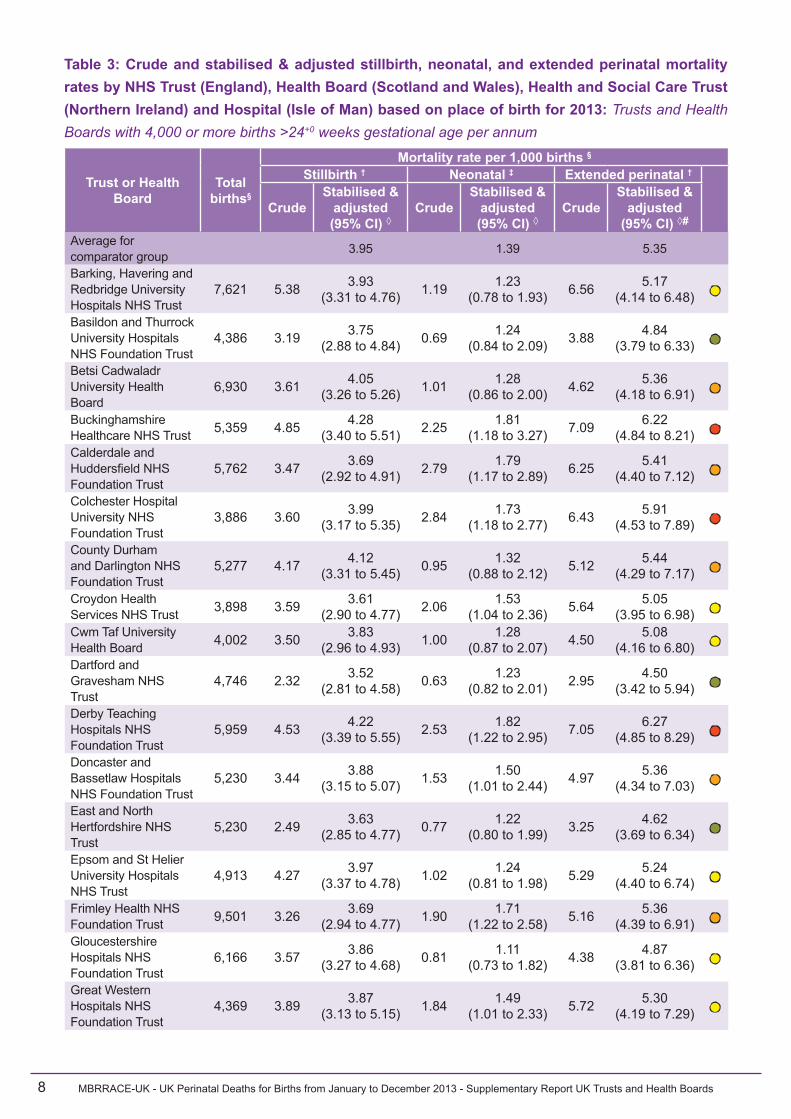
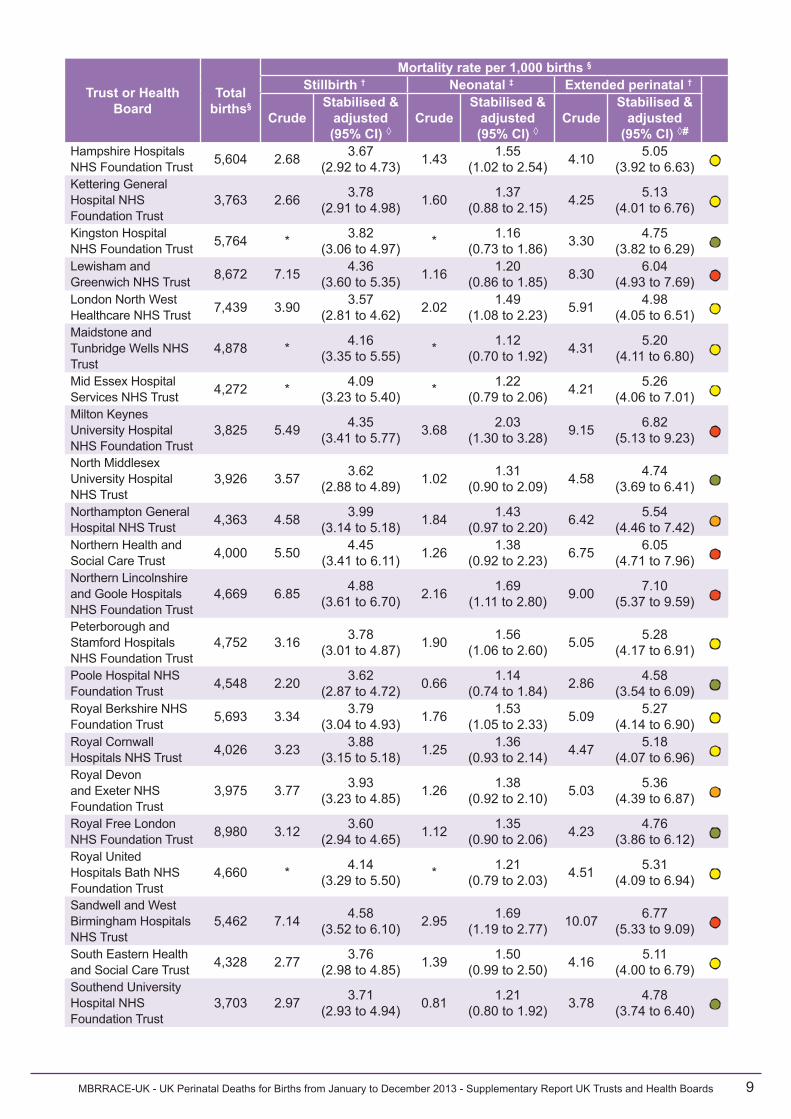
Table 3: Crude and stabilised & adjusted stillbirth, neonatal, and extended perinatal mortality rates by NHS Trust (England), Health Board (Scotland and Wales), Health and Social Care Trust (Northern Ireland) and Hospital (Isle of Man) based on place of birth for 2013: Trusts and Health Boards with 4,000 or more births >24+0 weeks gestational age per annum
Trust or Health Board
Total births§
Mortality rate per 1,000 births §
Stillbirth † Neonatal ‡ Extended perinatal †
CrudeStabilised &
adjusted(95% CI) ◊
CrudeStabilised &
adjusted(95% CI) ◊
CrudeStabilised &
adjusted(95% CI) ◊#
Average for comparator group 3.95 1.39 5.35
Barking, Havering and Redbridge University Hospitals NHS Trust
7,621 5.38 3.93 (3.31 to 4.76) 1.19 1.23
(0.78 to 1.93) 6.56 5.17 (4.14 to 6.48) ●
Basildon and Thurrock University Hospitals NHS Foundation Trust
(4.32 to 7.23) ●York Teaching Hospital NHS Foundation Trust
4,875 5.13 4.27 (3.34 to 5.63) 2.47 1.69
(1.14 to 2.86) 7.59 6.28 (4.94 to 8.27) ●
† per 1,000 total births‡ per 1,000 live births§ excluding terminations of pregnancy and births <24+0 weeks gestational age◊ excluding births January 2013 births for England, Wales and Isle of Man due to unavailability of NN4B data for that month* entry suppressed because of small numbers# colours represent variation from average extended perinatal mortality rate for group
MBRRACE-UK - UK Perinatal Deaths for Births from January to December 2013 - Supplementary Report UK Trusts and Health Boards 11
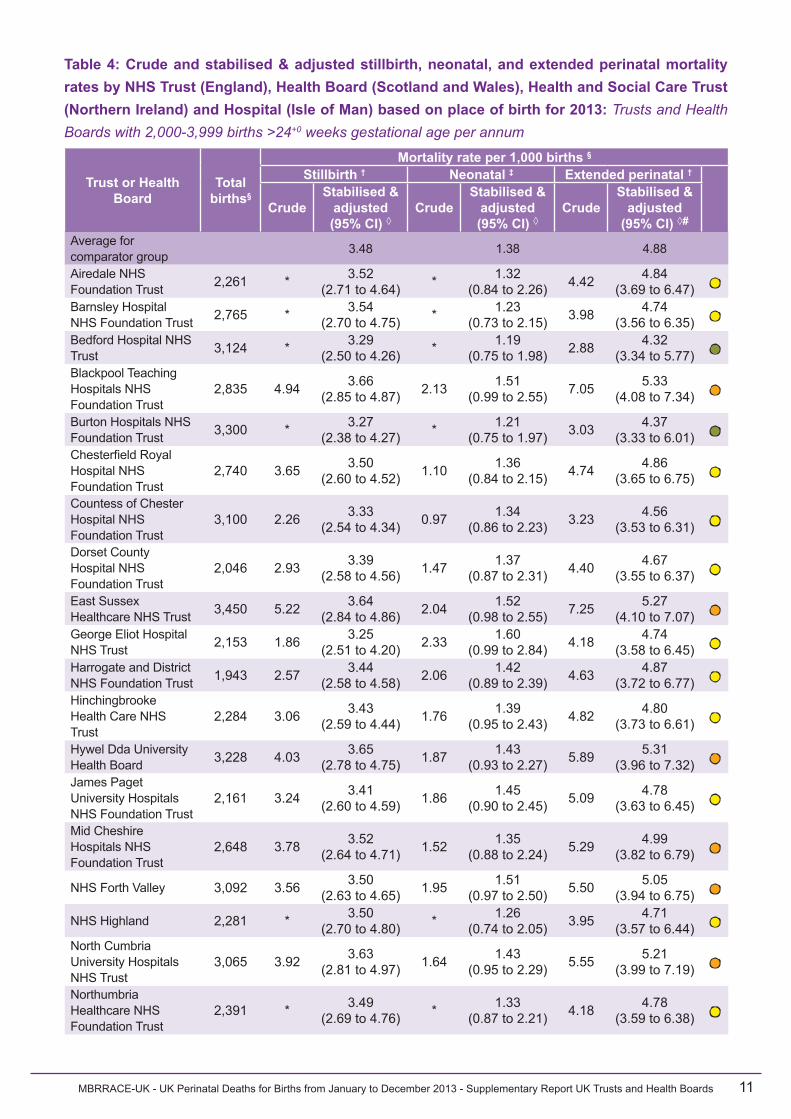
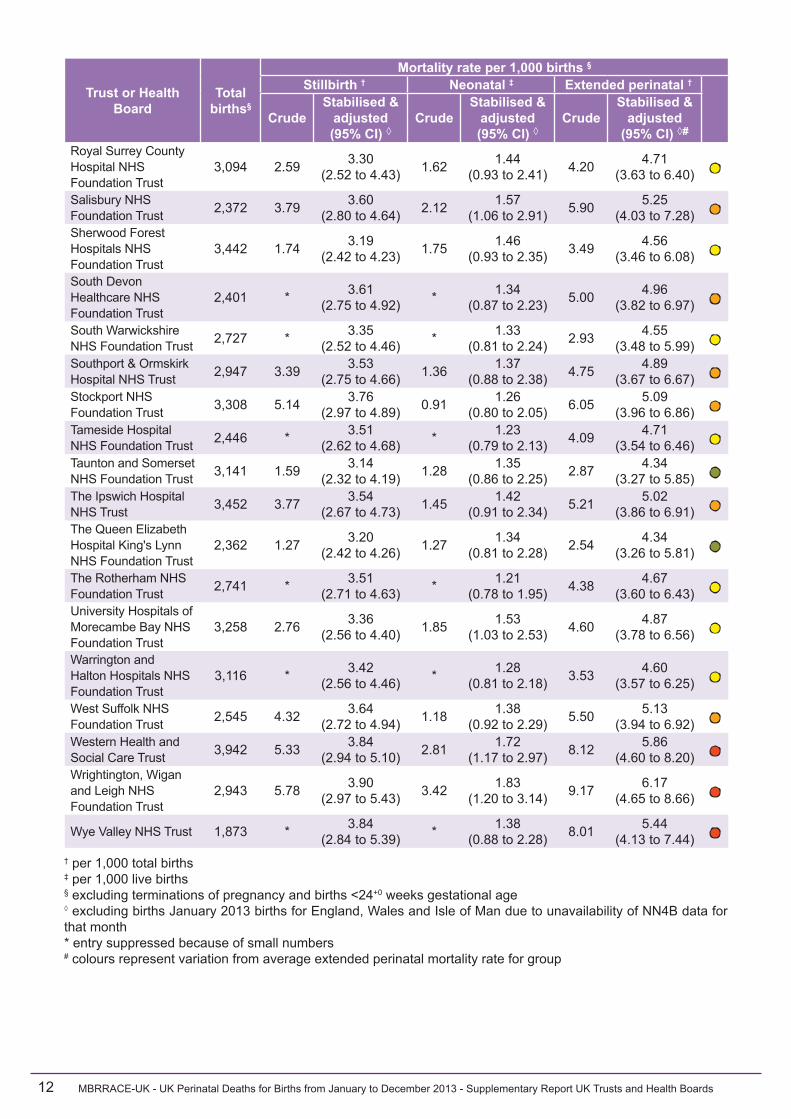
Table 4: Crude and stabilised & adjusted stillbirth, neonatal, and extended perinatal mortality rates by NHS Trust (England), Health Board (Scotland and Wales), Health and Social Care Trust (Northern Ireland) and Hospital (Isle of Man) based on place of birth for 2013: Trusts and Health Boards with 2,000-3,999 births >24+0 weeks gestational age per annum
Trust or Health Board
Total births§
Mortality rate per 1,000 births §
Stillbirth † Neonatal ‡ Extended perinatal †
CrudeStabilised &
adjusted(95% CI) ◊
CrudeStabilised &
adjusted(95% CI) ◊
CrudeStabilised &
adjusted(95% CI) ◊#
Average for comparator group 3.48 1.38 4.88
Airedale NHS Foundation Trust 2,261 * 3.52
(2.71 to 4.64) * 1.32 (0.84 to 2.26) 4.42 4.84
(3.69 to 6.47) ●Barnsley Hospital NHS Foundation Trust 2,765 * 3.54
(2.70 to 4.75) * 1.23 (0.73 to 2.15) 3.98 4.74
(3.56 to 6.35) ●Bedford Hospital NHS Trust 3,124 * 3.29
(2.50 to 4.26) * 1.19 (0.75 to 1.98) 2.88 4.32
(3.34 to 5.77) ●Blackpool Teaching Hospitals NHS Foundation Trust
2,835 4.94 3.66 (2.85 to 4.87) 2.13 1.51
(0.99 to 2.55) 7.05 5.33 (4.08 to 7.34) ●
Burton Hospitals NHS Foundation Trust 3,300 * 3.27
(2.38 to 4.27) * 1.21 (0.75 to 1.97) 3.03 4.37
(3.33 to 6.01) ●Chesterfield Royal Hospital NHS Foundation Trust
(3.86 to 6.91) ●The Queen Elizabeth Hospital King's Lynn NHS Foundation Trust
2,362 1.27 3.20 (2.42 to 4.26) 1.27 1.34
(0.81 to 2.28) 2.54 4.34 (3.26 to 5.81) ●
The Rotherham NHS Foundation Trust 2,741 * 3.51
(2.71 to 4.63) * 1.21 (0.78 to 1.95) 4.38 4.67
(3.60 to 6.43) ●University Hospitals of Morecambe Bay NHS Foundation Trust
3,258 2.76 3.36 (2.56 to 4.40) 1.85 1.53
(1.03 to 2.53) 4.60 4.87 (3.78 to 6.56) ●
Warrington and Halton Hospitals NHS Foundation Trust
3,116 * 3.42 (2.56 to 4.46) * 1.28
(0.81 to 2.18) 3.53 4.60 (3.57 to 6.25) ●
West Suffolk NHS Foundation Trust 2,545 4.32 3.64
(2.72 to 4.94) 1.18 1.38 (0.92 to 2.29) 5.50 5.13
(3.94 to 6.92) ●Western Health and Social Care Trust 3,942 5.33 3.84
(2.94 to 5.10) 2.81 1.72 (1.17 to 2.97) 8.12 5.86
(4.60 to 8.20) ●Wrightington, Wigan and Leigh NHS Foundation Trust
2,943 5.78 3.90 (2.97 to 5.43) 3.42 1.83
(1.20 to 3.14) 9.17 6.17 (4.65 to 8.66) ●
Wye Valley NHS Trust 1,873 * 3.84 (2.84 to 5.39) * 1.38
(0.88 to 2.28) 8.01 5.44 (4.13 to 7.44) ●
† per 1,000 total births‡ per 1,000 live births§ excluding terminations of pregnancy and births <24+0 weeks gestational age◊ excluding births January 2013 births for England, Wales and Isle of Man due to unavailability of NN4B data for that month* entry suppressed because of small numbers# colours represent variation from average extended perinatal mortality rate for group
MBRRACE-UK - UK Perinatal Deaths for Births from January to December 2013 - Supplementary Report UK Trusts and Health Boards 13
Table 5: Crude and stabilised & adjusted stillbirth, neonatal, and extended perinatal mortality rates by NHS Trust (England), Health Board (Scotland and Wales), Health and Social Care Trust (Northern Ireland) and Hospital (Isle of Man) based on place of birth for 2013: Trusts and Health Boards with under 2,000 births >24+0 weeks gestational age per annum
Trust or Health Board
Total births§
Mortality rate per 1,000 births §
Stillbirth † Neonatal ‡ Extended perinatal †
CrudeStabilised &
adjusted(95% CI) ◊
CrudeStabilised &
adjusted(95% CI) ◊
CrudeStabilised &
adjusted(95% CI) ◊#
Average for comparator group 3.31 1.14 4.47
East Cheshire NHS Trust 1,741 * 3.37
(2.22 to 5.11) * 1.08 (0.39 to 2.18) 4.02 4.50
(3.03 to 6.50) ●Gateshead Health NHS Foundation Trust 1,765 3.40 3.26
(2.24 to 4.78) 2.27 1.27 (0.67 to 2.63) 5.67 4.59
(3.19 to 7.09) ●Isle of Man Department of Health and Social Care
743 * 3.33 (2.27 to 5.08) * 1.08
(0.35 to 2.19) 4.04 4.41 (2.76 to 6.52) ●
Isle of Wight NHS Trust 1,241 3.22 3.18
(2.04 to 4.65) 3.23 1.28 (0.69 to 2.80) 6.45 4.52
(3.10 to 6.87) ●NHS Borders 1,086 * 3.29
(2.22 to 4.69) * 1.15 (0.48 to 2.28) 3.68 4.42
(2.93 to 6.33) ●NHS Dumfries & Galloway 1,259 * 3.56
(3.35 to 7.15) ●Powys Teaching Health Board 191 * 3.27
(2.05 to 4.90) * 1.14 (0.42 to 2.04) * 4.38
(2.90 to 6.41) ●South Tyneside NHS Foundation Trust 1,394 * 3.39
(2.35 to 5.14) * 1.13 (0.44 to 2.18) 5.02 4.55
(3.03 to 6.62) ●The Royal Bournemouth and Christchurch Hospitals NHS Foundation Trust
304 * 3.24 (2.06 to 4.70) * 1.13
(0.42 to 2.21) * 4.33 (2.90 to 6.29) ●
Weston Area Health NHS Trust 207 * 3.27
(2.05 to 4.87) * 1.21 (0.49 to 2.47) * 4.49
(3.01 to 6.79) ●Yeovil District Hospital NHS Foundation Trust 1,565 * 3.21
(2.08 to 4.67) * 1.04 (0.36 to 1.92) 1.92 4.17
(2.64 to 5.93) ●† per 1,000 total births‡ per 1,000 live births§ excluding terminations of pregnancy and births <24+0 weeks gestational age◊ excluding births January 2013 births for England, Wales and Isle of Man due to unavailability of NN4B data for that month* entry suppressed because of small numbers# colours represent variation from average extended perinatal mortality rate for group
MBRRACE-UK
Department of Health Sciences University of Leicester 22-28 Princess Road West Leicester, LE1 6TP


![MBRRACE-UK Supplementary report on survival up to one year ... · for babies born preterm. Mortality is particularly high for those born before 27 weeks gestational age [1-3]. Information](https://static.documents.pub/doc/80x56/601eb055a7193533fd2ec8f8/mbrrace-uk-supplementary-report-on-survival-up-to-one-year-for-babies-born-preterm.jpg)


