Page 1
8/2/2019 M.C. Douay et al- Diode-Laser Spectroscopy of Alkali Halides: The Sodium Fluoride Molecule
http://slidepdf.com/reader/full/mc-douay-et-al-diode-laser-spectroscopy-of-alkali-halides-the-sodium-fluoride 1/5
Volume 148, number 1 CHEMICAL PHYSICS LETTERS 1 July 1988
DIODE-LASER SPECTROSCOPY OF ALKALI HALIDES:
THE SODIUM FLUORIDE MOLECULE
M.C. DOUAY I, A.M.R.P. BOPEGEDERA, CR. BRAZIER and P.F. BERNATH ’
Department of Chemistry, UniversityofArizona, Tucson, AZ 85 721, USA
Received 2 May 1988
The vibration-rotation spectrum of the sodium fluoride molecule was recorded using a diode laser. A total of 127 rotational
lines were recorded in the first overtone band (2-O) and several hot bands with Au=2. These data, combined with previous
microwave measurements, enabled us to determine ten vibration-rotation constants for NaF including w,= 535.6594( 15)cm-’
and~&=3.57636(68) cm-‘ .
1. Introduction
The alkali halide molecules are prototypical models
for ionic bonding and occur commonly in flames. As
a result of this interest, these molecules have been
studied by many different techniques ranging from
microwave spectroscopy [ 1 to photoelectron spec-
troscopy [ 21. However, there are few high-resolu-
tion infrared observations. We report here on the
vibration-rotation spectrum of NaF obtained by
diode laser spectroscopy.
High-resolution infrared spectra are available for
the lithium halides, LiF [3], LiCl [4,5], LiBr [6]
and LiI [ 71 as well as KF [ 81. For NaF, low-reso-
lution gas phase observations [9] and matrix iso-
lation measurements are published [ 10-121. The
infrared matrix isolation spectra of (NaF), dimers
and polymers were also studied [ 12,13 1.
The rotational constants of NaF are known withgreat precision from the millimeter measurements of
Veazey and Gordy [ 141 and from microwave mea-
surements [ 15,161. The radio frequency and micro-
wave work [ 15,161 also established the dipole
moment of NaF (8.156 D for v=O) and provided
values for additional constants such as the electric
’ Current address: Laboratoire de Spectroscopic des Moltcules
Diatomiques, Universitt? des Sciences et Techniques de Lille,
BLtiment P5,99655 Villeneuve d’ AscqCedex, France.
’ Alfred P. Sloan Fellow; Camille and Henry Dreyfus Teacher-Scholar.
quadrupole hype&e coupling parameters.
The properties of the NaF molecule have been cal-
culated by ab initio [ 17-l 91 and semi-empirical
quantum chemical methods [20]. The empirical
Rittner model [21] and variations on this theme
[ 22-271 provides surprisingly accurate representa-
tions of the ground state potential energy curve.
The ultraviolet absorption and emission spectra of
alkali halides are called the “fluctuation bands”
[28,29]. They are largely of a bound-free nature,
therefore little spectroscopic information can be ex-
tracted. Photofragmentation spectroscopy (see, for
example, ref. [ 301) does provide some information
on the excited state potential energy curves and the
dissociation energy.
The study of alkali halides in hydrogen-oxygen-
nitrogen flames gives estimates of the dissociation
energies ( 12 1 kcal/mol for NaF) [ 311. A chemi-
luminescent flame resulting from the combustion ofalkali metal fuels with halogen oxidisers can also
provide estimates for the dissociation energy [ 321.
The pioneering work of M. Polanyi [ 331 on metal-
halogen flames continues to provide inspiration
[ 34,351.
2. Experimental
NaF vapor was generated in a stainless steel heat
pipe oven. This was a 1 m long, 50 mm diameter tube
0 009-2614/88/$ 03.50 0 Elsevier Science Publishers B,V.
(North-Holland Physics Publishing Division )
1
Page 2
8/2/2019 M.C. Douay et al- Diode-Laser Spectroscopy of Alkali Halides: The Sodium Fluoride Molecule
http://slidepdf.com/reader/full/mc-douay-et-al-diode-laser-spectroscopy-of-alkali-halides-the-sodium-fluoride 2/5
Volume 14 8, number 1 CHEMICAL PHYSICS LETTERS I July 1988
equipped with BaF, windows and electrically heated
over the center 0.6 m section. The ends of the tube
were water cooled to confine the alkali halide vapor
to the central part of the tube. Approximately 50 g
of NaF (Aldrich) was placed on a stainless wire mesh
inside the tube and the cell was pressurized withabout 2 Torr of argon, which acts as a buffer gas to
maintain the NaF v apor in the central part of the cell.
The cell was heated to a bout 1000 °C to obtain a rea-
sonable concentration ( x 100 mTorr) of the NaF
vapor resulting in up to 1% absorption. The sample
could be heated many times over a period of two
weeks without recharging the cell with NaF.
A Pb-Sn-Te diode laser (Laser Analytics) w as
used to record several Au=2 vibration-rotation
bands of the NaF molecule. The laser beam was
passed eight times through the cell providing an ef-fective path length of about 4 m through the NaF va-
por. A 0.33 m mo nochromator was used to select a
single longitudinal mode of the laser. The laser beam
was then im aged on to a liquid-Nz-cooled Hg-C d-
Te detector. The laser diode was frequency modu-
lated at approximately 4 kHz and the NaF absorp-
tion lines were detected using a lock-in amplifier at
twice the modulation frequency. Abso lute frequency
calibration of the lines was provided by placing a 0.2
m cell containing 0.5 Torr of NH3 in the beam path
and com paring with the published spectrum of 14N H3
and “ NH3 (in natural abundance) [36]. A small
portion of the beam was passed through an air-spaced
german ium Fabry-Perot etalon with a free spectral
range of 0.029 85 1 cm-’ to provide relative fre-quency calibration.
The absorption signal (NaF and NH3) and the
etalon signa l were recorded simultaneously on a two-
pen chart recorder. The position of the unblended
rotational lines could be determined with an accu-
racy of about ?0.002 cm-‘.
3. Results and discussion
A total of 1 27 rotational lines in the first overtone,2-0, and the hot bands 3-1, 4-2, 5-3, 6-4, 7-5,
8-6 of the Na-F stretch were recorded in this ex-
periment. The absorption of the fundamental band
l-0, and the hot bands w ith Au = 1 are stronger than
that of the overtone b ands w ith Av= 2 but we had no
diodes in this spectral region. Initiallly the milli-
meter wav e data reported by Veazey and Gordy [ 14 1
and the infrared data reported by Ritchie and Lcw
[ 91 were used to predict the rotational line positions
Fig. 1, The 4-2 band of X ‘Z + state of NaF. No te that near the band head the low J rotational lines going into the band head and the
high J lines coming ou t of the band he ad are accidentally ov erlapped. The relative intensities of the lines arc distorted by the va riation of
the diode laser power.
2
Page 3
8/2/2019 M.C. Douay et al- Diode-Laser Spectroscopy of Alkali Halides: The Sodium Fluoride Molecule
http://slidepdf.com/reader/full/mc-douay-et-al-diode-laser-spectroscopy-of-alkali-halides-the-sodium-fluoride 3/5
Volume 148, number I
Table 1
CHEMICAL PHYSICS LETTERS 1 July 1988
Rotational line positions of the Au=2 transitions of NaF (in cm-‘)
R (J) 2-O band 3-1 band 4-2 band 6-4 band 8-6 band
v 1O’Au v IO’dv u IO’Av u 103Au v 103Au
6
30
31
32
33
34
35
36
37
38
39
40
4142
43
44
45
46
47
48
49
50
51
52
53
54
55
56
57
58
59
60
61
1068.062 -1
1068.344 -1
1069.649 4
1069.798 2
1069.929 1
1070.038 -3
1070.130 -61070.205 -6
1070.264 -4
1070.302 -4
1070.32 I -4
1070.321 -3
1070.302 -3
1070.265 -2
1070.205 -5
1070.130 -4
1070.038 -1
1069.924 -0
1069.791 -0
1069.640 1
1068.319
1068.033
-5
-5
-1P(9) 1041.681
1041.807 -1
1054.551 -I
1054.790 -4
1055.021 3
1055.227 4
1055.415 6
1055.583 6
1055.730 3
1055.854 -3
1055.965 -4
1056.061 -21056.137 -1
1056.193 -1
1056.230 -1
1056.249 0
1056.249 1
1056.230 1
1056.193 1
1056.137 2
1056.061 2
1055.965 0
1055.854 2
1055.722 2
1055.574 5
1055.405 6
1055.214 4
1055.004 I
1054.773 -3
1054.530 -I
1041.377 -1
1041.557 -6
1041.728 -1
1041.875 -2
1042.010 4
1042.120 3
1042.206 -31042.281 -2
1042.336 -3
1042.371 -4
1042.389 -5
1042.389 -4
1042.371 -3
1042.336 -1
1042.281 0
1042.206 0
1042.120 7
1042.006 6
1041.868 -2
1041.722 2
1041.549 -3
1041.367 2
1013.428 2
1013.682 3
1013.916 2
1014.133 2
1014.335 5
1014.518 7
1014.681 7
1014.817 -2
1014.945 -1
1015.052 -3
1015.146 01015.219 0
1015.269 -4
1015.309 -1
1015.326 -2
1015.326 -2
1015.309 -I
1015.269 -4
1015.219 0
1015.146 0
1015.052 -3
1014.945 -I
1014.817 -I
1014.681 9
1014.518 10
1014.331 6
1014.126 1
1013.909 4
1013.671 3
1013.415 3
988.289 2
988.440 -8
988.583 -8
988.719 3
988.826 2
988.916 3988.992 7
989.041 2
989.078 2
989.086 -9
989.086 -9
989.079 0
989.044 -0
988.996 4
988.921 -0
988.832 -1
988.725 -2
988.592 -11
988.449 -13
988.249 -8
of the 2-O band. The 2-O band was then recorded
and the above prediction was used in mak ing the ro-tational assignments. We found that near the band
head, the low J rotational lines going into the band
head and the higher J lines coming out of the band
head were accidentally overlapped. This b lending was
observed in all of the band s that w ere recorded (fig.
1). The rotational line positions of the 2-O band and
the millimeter wave data [ 141 were then fitted to the
Dunham energy level expression [ 37 1
E”J= 5 Ykj(u+ Ik]J(J+ 1) I’.
The improved molecular constants obtained from
this fit were then used to predict the rotational line
positions of the 3-l band, w hich was recorded an d
subsequently fitted. By this repeated process of pre-
diction, recording and fitting, we were able to m ake
the rotational assignments of the measured lines re-
ported in table 1. The rotational line positions of the
5-3 band could not be measured since it was ob-
scured by the presence of what we believe to be a
combination band of the sodium fluoride dimer
[ 12,13,381. The 7-5 band of NaF is in a region where
there are no NH, calibration lines thus these rota-
3
Page 4
8/2/2019 M.C. Douay et al- Diode-Laser Spectroscopy of Alkali Halides: The Sodium Fluoride Molecule
http://slidepdf.com/reader/full/mc-douay-et-al-diode-laser-spectroscopy-of-alkali-halides-the-sodium-fluoride 4/5
Volume 1 48, number 1 CHEMICAL PHYSICS LETTERS 1 July 1988
Table 2
Dunham vibration-rotation constants for the NaF molecule in
the X ‘Z+ state (in cm-‘)
YlO 535.6594(15)8’ Y,, 0.43690108(1 2)
Yzo -3.57636(68) lO’Y,, -4.55801(21)
1o2 Y,, 1.878(11) 105Y*, 2.3006(98)105Y,, -8.55(64) IOSYj, 3.7(11)
106Yo* -1.16349(47)
logy,2 5.491(50)
‘) One standard deviation error in parentheses.
tional lines were not measured. For the final tit all
of the lines reported in table 1 were fitted together
with the three microwave transitions [ 151 and the
ten millimeter wave transitions to obtain the vibra-
tion-rotation constants. of the NaF molecule re-
ported in table 2.
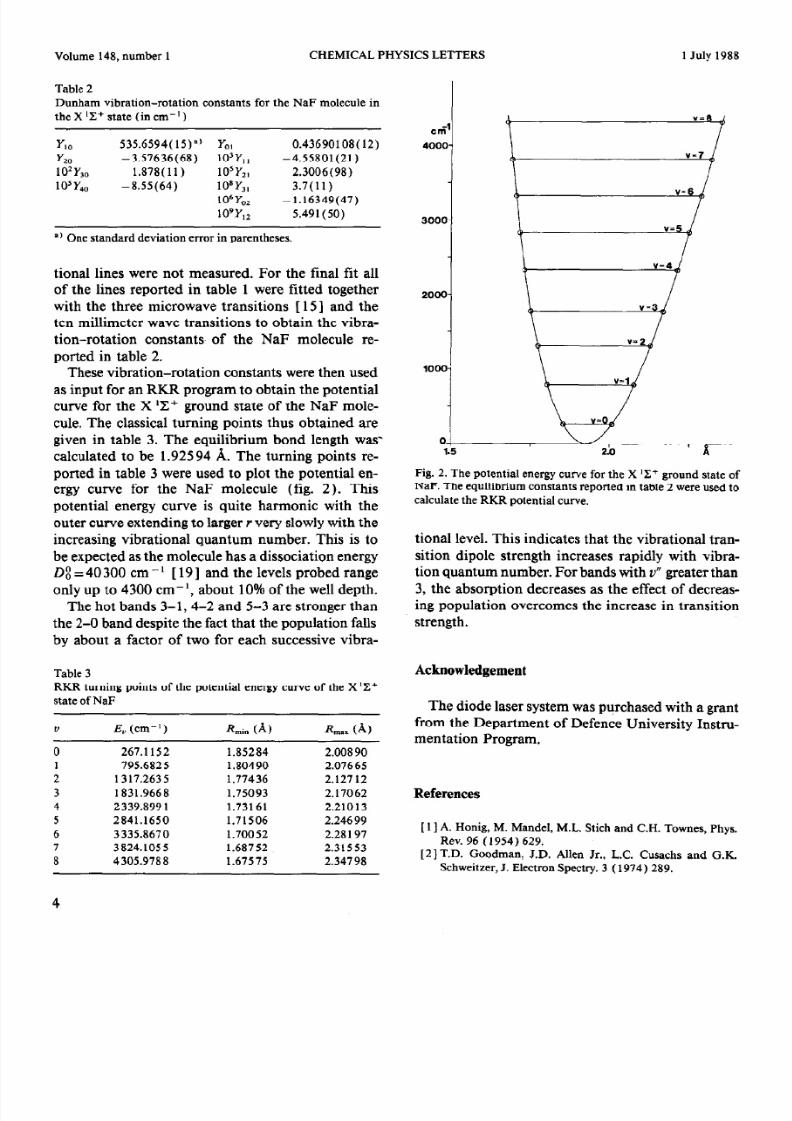
These vibration-rotation constants were then used
as input for an RK R program to obtain the potential
curve for the X ‘Z+ ground state of the NaF mole-
cule. The classical turning points thus obtained are
given in table 3. The equilibrium bond length was
calculated to be 1.92594 A. The turning points re-
ported in table 3 were used to plot the p otential en-
ergy curve for the NaF molecule (fig. 2). T his
potential energy curve is quite h armonic with the
outer curve extending to larger r very slowly with theincreasing vibrational quantum num ber. This is to
be expected a s the molecule h as a dissociation energy
0: = 40 300 cm --I [ 19 ] and the levels probed range
only up to 4300 cm-‘, about 10% of the well depth.
The hot band s 3-1,4-2 and 5-3 are stronger than
the 2-O band despite the fact that the population falls
by about a factor of two for each successive vibra-
Table 3
RRR turning points of the potential energy curve of the X’Z+
state of NaF
” .!Z, cm-‘) R,i, (A) &,x,x (A)
0 267.1152 1.85284 2.008 90
1 795.682 5 1.80490 2.07665
2 1317.2635 1.77436 2.12712
3 1831.9668 1.75093 2.17062
4 2339.899 1 1.73161 2.21013
5 2841.1650 1.71506 2.24699
6 3335.8670 1.70052 2.28 191
7 3824.1055 1.687 52 2.31553
8 4305.9788 1.67575 2.34798
4
cd
4000-
011.5 2.0 a
Fig. 2. The potential energy curve for the X IX+ ground state of
NaF. Th e equilibrium constants reported in table 2 were used to
calculate the RKR potential curve.
tional level. This indicates tha t the vibrational tran-
sition dipole strength increases rapidly with vibra-
tion quantum numb er. For bands with v” greater than
3, the abso rption decreases a s the effect of decreas-
ing population overcomes the increase in transition
strength.
The diode laser system was purchased with a grant
from the Departmen t of Defence University Instru-
mentation Program.
References
[ 11 A. Honig, M . Mandel, M.L. Stich and C.H. Tow nes, Phys.
Rev. 96 (1954)629.
[2]T.D. Goodm an, J.D. Allen Jr., L.C. Cusachs and G.K.
Schweitzer, J. Electron Spectry. 3 ( 197 4) 28 9.
Page 5
8/2/2019 M.C. Douay et al- Diode-Laser Spectroscopy of Alkali Halides: The Sodium Fluoride Molecule
http://slidepdf.com/reader/full/mc-douay-et-al-diode-laser-spectroscopy-of-alkali-halides-the-sodium-fluoride 5/5
Volume 148, number 1 CHEMICAL PHYSICS LETTERS 1 July 1988
(31 A.G. Maki, J. Mol. Spectry. 10 2 (198 3) 361. [22] P. Brumerand M. Karplus, J. Chem. Phys. 58 (1973 ) 3903 .
[4] H. Jones and J. Lindenmayer, Chem. Phys. Letters 135 [231 J. Shanker, H.B. Agrawal and G.G. A grawal, J. Chem. Phys.
(1987) 189. 73 (1980)4056.
[ 5 GA. Thompson, A.G. Maki, W.B. Olson and A. W& r, J.
Mol. Spectty. 12 4 (198 7) 130.
[6] C.R. Brazier, N.H. O liphant and P.F. Bem ath, in
preparation.
[24] M. Kumar, A.J. Kaur and J. Shanker, J. Chem. Phys. 84
(1986) 5735.
[7] G. Thompson, A.G. Maki and A. Weber, J. Mol. Spectry.
118 (1986) 540.
[25] J. Shanker and H .B. Agrawal, Can. J. Phys. 58 ( 1980) 950 .
[26] B.T. Gowda and SW. Benson, J. Phys. Chem. 8 6 (1982 )847.
[S] A.G. Maki and F.J. Lovas, J. Mol. Spectry. 95 (1 982) 80.
[9] R.K. Ritchie and H. Lew, Can. J. Phys. 42 ( 1964) 43.
[lo] A. Snelson and K.S. Pitzer, J. Phys. Chem. 67 (19 63) 882.
[ 111V.I. Baikov and K.P. Vasilevskii, Opt. Spectry. 22 (1967)
198.
[27 ] J.E. Szymanski and J.A.D. Matthew, Can. J. Phys. 62 ( 198 4)
583.
[28 ] R.F. Barrow and A.D. Caunt, Proc. Roy. Sot. A 2 19 ( 1953 )
I20.
[ 121T.P. Martin an d H. Schaber, J. Chem. Phys. 68 (1978) 4299.
[ 13] Z.K. Ismail, R.H. H auge and J.L. Margrave, J. Inorg. Nucl.
Chem. 35 (1973) 3201.
[291 P. Davidovits and DC. B&head, J. Chem. Phys. 46 ( 1967 )
2968.
[ 141SE. Veazey and W. Gordy, Phys. Rev. I38A (1965 ) 1303 .
[ 151R.K. Bauer andH. Lew, Can. J. Phys. 41 ( 1963 ) 146 1; 42
(1964) 830.
[30] T.R. Suand S.J. Riley, J. Chem. Phys. 72 (1980 ) 6632 .
[311 E.M. Bulewicz, L.F. Phillips and T.M. Sugden, Trans. Far-
adaysoc. 57 (1961) 921.
[ 161C.D. H ollowell, A.J. Hebert an d K . Street Jr., J. Chem. Ph ys.
41 (1964) 3540.
[321 D.O. Ham, J. Chem. Phys. 60 ( 1974) 1802.
[331 M. Polanyi, Atomic reactions (Williams and N orgate, Lon-don, 1932).
[ 171PK. Swaninathan and E. Clementi, J. Phys. Chem. 91
(1987) 1020.
[ 181 . Pyykko, G.H.F. Diercksen, F. Milller-Plathe and L.
Laaksonen, Chem. Phys. Letters 14 1 ( 1987) 535.
[ 1S] S.R. Langhoff, C.W. Bauschlicher Jr. and H . Partridge, J.
Chem. Phys. 84 ( 1986) 1687.
[201 Y. Zeiri and G .G. Balint-Kurti, J. Mol. Spectry. 99 ( 1983 )
[21]l&.Rittner,J.Chem.Phys. 19 (1951 ) 1030 .
[34] P. Arrowsmith, S.H.P. Bly, P.E. Charters and J.C. Polanyi,
J. Chem. Phys. 79 (1983) 283,
[ 351 . Davidovitz and D.L. McFadden, Alkali halide vapors
(Academic Press, New York, 1979).
1361G. Guelachvilli and K. Narahari Rao, Handbook of in-
frared standards (Academic Press, Orlando, 1986).
[37] J.L. Dunham , Phys. Rev. 41 (1932 ) 7 21.
[381 M. Eisenstadt, G.M. Rothberg and P. Kusch, J. Chem. Phys.
29 (1958) 797.