17
MCALLEN, TX OFFERING MEMORANDUM

MCALLEN, TX
OFFERING MEMORANDUM

CONFIDENTIALITY AGREEMENTNon-Endorsements
Marcus & Millichap is not affiliated with, sponsored by, or endorsed by any commercial tenant or lessee identified in this marketing package. The presence of any corporation’s logo or name is not intended to indicate or imply affiliation with, or sponsorship or endorsement by, said corporation of Marcus & Millichap, its affiliates or subsidiaries, or any agent, product, service, or commercial listing of Marcus & Millichap, and is solely included for the purpose of providing tenant lessee information about this listing to prospective customers.
ALL PROPERTY SHOWINGS ARE BY APPOINTMENT ONLY.PLEASE CONSULT YOUR MARCUS & MILLICHAP AGENT FOR MORE DETAILS.
Disclaimer
THIS IS A BROKER PRICE OPINION OR COMPARATIVE MARKET ANALYSIS AND SHOULD NOT BE CONSIDERED AN APPRAISAL. In making any decision that relies upon my work, you should know that we have not followed the guidelines for development of an appraisal or analysis contained in the Uniform Standards of Professional Appraisal Practice of the Appraisal Foundation. This information has been secured from sources we believe to be reliable, but we make no representations or warranties, express or implied, as to the accuracy of the information. References to square footage or age are approximate. Buyer must verify the information and bears all risk for any inaccuracies. Marcus & Millichap is a service mark of Marcus & Millichap Real Estate Investment Services, Inc. © 2017 Marcus & Millichap. All rights reserved.
REDWOOD DOMIT APARTMENTSMcAllen, TXACT ID Y0160101

1001 E FERN AVEMCALLEN, TX 78501
Presented By
Mike MoffittFirst Vice President Investments
AustinTel: 512-338-7846
TABLE OF CONTENTS
MARKET COMPARABLES
Rent Comparables Map...............................................................................................9Rent Comparables.......................................................................................................10
INVESTMENT OVERVIEWProperty Overview.......................................................................................................15Property Aerials...........................................................................................................16
FINANCIAL ANALYSISUnit Mix........................................................................................................................19Rent Roll Detail...........................................................................................................20Operating Statement..................................................................................................27Pricing Detail................................................................................................................28Growth Rate Projections.............................................................................................29Ten-Year Cash Flow.....................................................................................................30Proposal Price IRR......................................................................................................31

RENT COMPARABLES MAP
Paradise Village Kerria Square
Atrium Place
Stonewood Domit
Villas de Nolana
Villages at Sugar Road
Redwood Domit Apartments
Mosaic Lofts
The Landing on the 6th
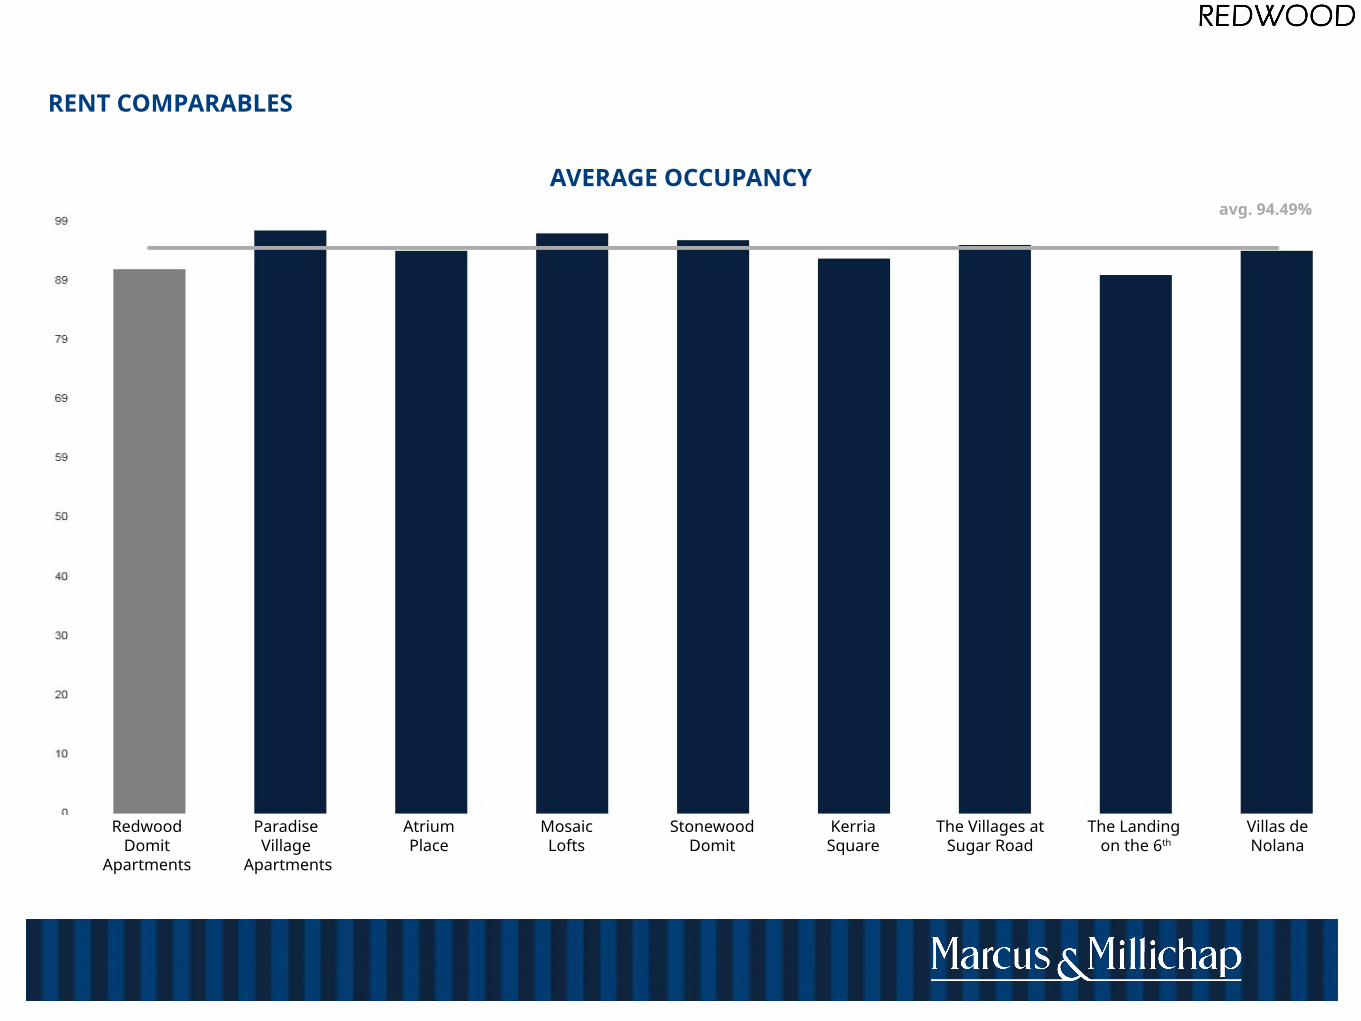
RENT COMPARABLES
AVERAGE OCCUPANCY
Redwood Domit
Apartments
Paradise Village
Apartments
AtriumPlace
Mosaic Lofts
StonewoodDomit
Kerria Square
The Villages at Sugar Road
The Landing on the 6th
Villas de Nolana
avg. 94.49%

RENT COMPARABLES
AVERAGE RENT - MULTIFAMILY
Rewood DomitApartments
Paradise Village
Apartments
AtriumPlace
Mosaic Lofts
StonewoodDomit
Kerria Square
The Villages at Sugar
Road
The Landing
on the 6th
Villas de Nolana
3 BR
avg. $1,127
Redood DomitApartments
Paradise Village
Apartments
AtriumPlace
Mosaic Lofts
StonewoodDomit
Kerria Square
The Villages at Sugar
Road
The Landing
on the 6th
Villas de Nolana
avg. $672
STUDIOS
1 BR
Redwood DomitApartments
Paradise Village
Apartments
AtriumPlace
Mosaic Lofts
StonewoodDomit
Kerria Square
The Villages at Sugar
Road
The Landing
on the 6th
Villas de Nolana
avg. $764
2 BR
Redwood DomitApartments
Paradise Village
Apartments
AtriumPlace
Mosaic Lofts
StonewoodDomit
Kerria Square
The Villages at Sugar
Road
The Landing
on the 6th
Villas de Nolana
avg. $946

RENT COMPARABLES
Property Unit Description Number of Units
SF Market
Rent Rent / SF
Northwood Domit Apartments 1X1 16 770 $825 $1.07
201 E Quamasia Ave 2X2 A 30 1,099 $925 $0.84
McAllen, TX 78504 2X2 B 18 1,124 $975 $0.87
Year Built: 2004 2X2 C 4 1,173 $1,025 $0.87
Occupancy: 92 3X2 2 1,200 $1,150 $0.96
Total / Averages 70 1,037 $927 $0.89
Paradise Village Apartments 1 BR 30 760 $620 $0.82
4210 N Main St 2 BR 52 1,006 $775 $0.77
McAllen, TX 78504 Total / Averages 82 916 $718 $0.78
Year Built: 1993
Occupancy: 97%
Atrium Place 1 BR 25 863 $745 $0.86
500 E Camellia Ave 2 BR 30 1,142 $895 $0.78
McAllen, TX 78501 3 BR 5 1,272 $995 $0.78
Year Built: 2001 Total / Averages 60 1,037 $841 $0.81
Occupancy: 94%

RENT COMPARABLES
Property Unit Description Number of Units
SF Market
Rent Rent / SF
Mosaic Lofts Studio 26 601 $695 $1.16
300 E Camellia Ave 1 BR 33 778 $854 $1.10
McAllen, TX 78501 2 BR 21 1,139 $1,154 $1.01
Year Built: 2007 3 BR 5 1,280 $1,400 $1.09
Occupancy: 97 Total / Averages 85 843 $912 $1.08
Kerria Square 1 BR 40 800 $750 $0.94
2100 Kerria Ave 2 BR 20 900 $850 $0.94
McAllen, TX 78501 3 BR 22 1,100 $850 $0.77
Year Built: 2014 Total / Averages 82 905 $801 $0.89
Occupancy: 93%
Stonewood Domit Studio 29 583 $667 $1.14
501 E Camellia Ave 1 BR 20 733 $750 $1.02
McAllen, TX 78501 2 BR 14 1,100 $1,075 $0.98
Year Built: 2004 3 BR 14 1,210 $1,150 $0.95
Occupancy: 96 Total / Averages 77 830 $851 $1.02

RENT COMPARABLES
Property Unit Description Number of Units
SF Market
Rent Rent / SF
Villages at Sugar Road Studio 36 504 $605 $1.20
5228 S Sugar Rd 1 BR 36 579 $725 $1.25
Edinburg, TX 78539 1 BR 24 684 $855 $1.25
Year Built: 2013 2 BR 24 837 $925 $1.11
Occupancy: 95 2 BR 24 965 $1,080 $1.12
3 BR 24 1,192 $1,250 $1.05
Total / Averages 168 758 $872 $1.15
Villas de Nolana Studio 9 562 $720 $1.28
121 E Quamasia Ave 1 BR 39 776 $815 $1.05
McAllen, TX 78504 2 BR 58 1,158 $985 $0.85
Year Built: 2004 3 BR 14 1,289 $1,250 $0.97
Occupancy: 94% Total / Averages 120 1,004 $941 $0.94
The Landing on the 6th 1 BR 34 620 $800 $1.29
4401 N 6th St 2 BR 84 922-970 $800-$860 $0.88
McAllen, TX 78504 3 BR 32 1,012 $995 $0.98
Year Built: 1997 Total / Averages 150 886 $858 $0.97
Occupancy: 90%

Unit Description No. of Units
Rentable Sq. Ft. Per Unit
Market Rent Market Rent per Square Foot
Monthly Income
1x1 16 770 $825 $1.07 $13,200
2x2 A 30 1,099 $925 $0.84 $27,750
2x2 B 18 1,124 $975 $0.87 $17,550
2x2 C 4 1,173 $1,025 $0.87 $4,100
3x2 2 1,200 $1,150 $0.96 $2,300
Totals / Wtd. Averages
124 944 117,000 $872 $0.92
UNIT MIX
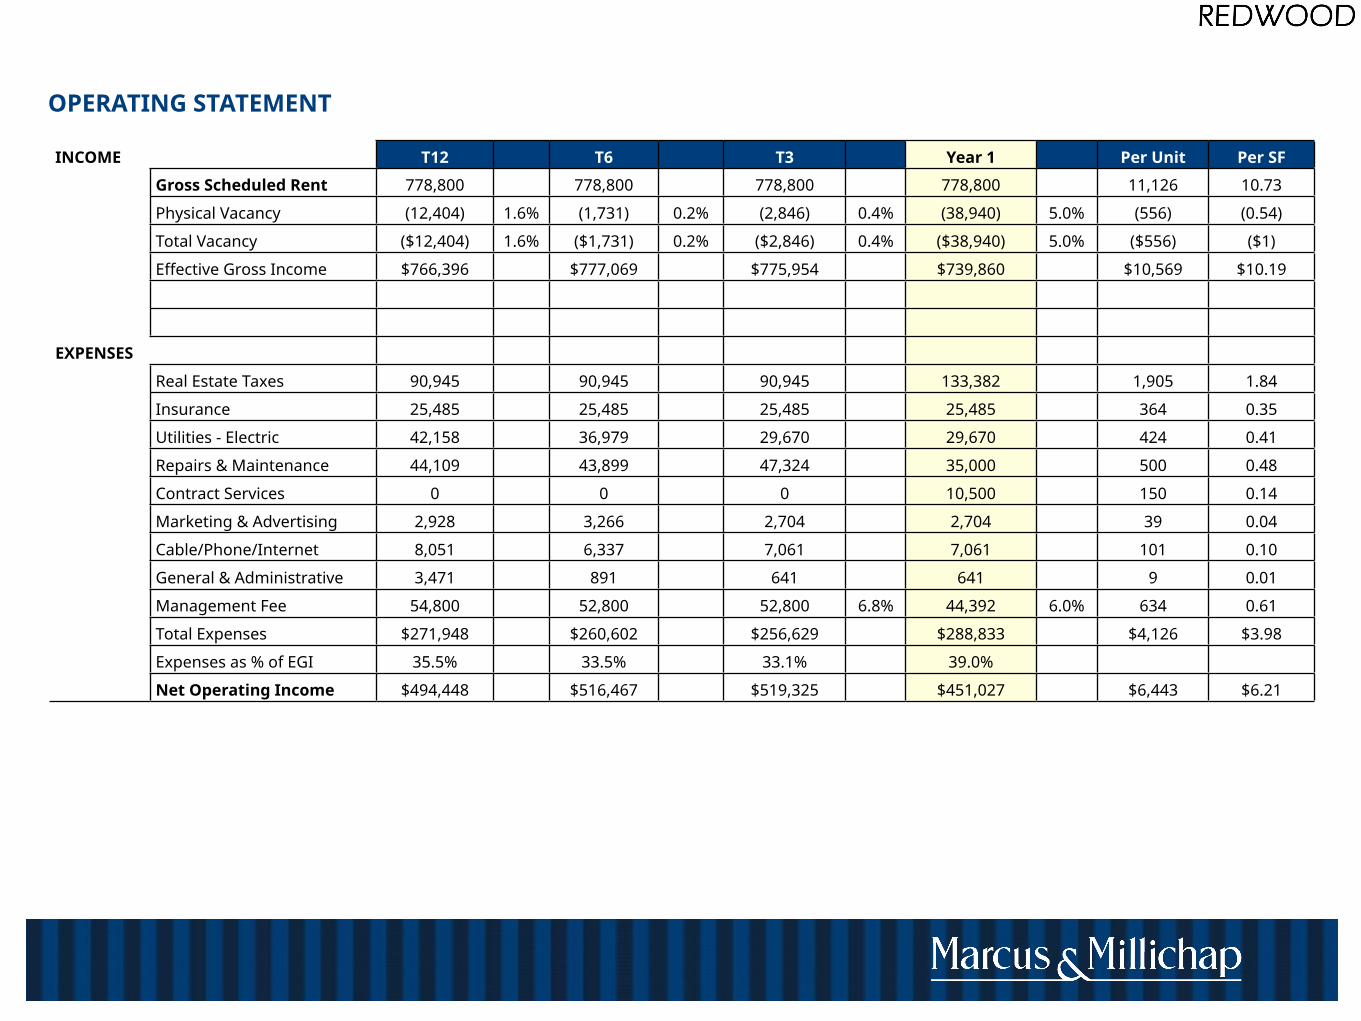
OPERATING STATEMENT
INCOME T12 T6 T3 Year 1 Per Unit Per SF
Gross Scheduled Rent 778,800 778,800 778,800 778,800 11,126 10.73
Physical Vacancy (12,404) 1.6% (1,731) 0.2% (2,846) 0.4% (38,940) 5.0% (556) (0.54)
Total Vacancy ($12,404) 1.6% ($1,731) 0.2% ($2,846) 0.4% ($38,940) 5.0% ($556) ($1)
Effective Gross Income $766,396 $777,069 $775,954 $739,860 $10,569 $10.19
EXPENSES
Real Estate Taxes 90,945 90,945 90,945 133,382 1,905 1.84
Insurance 25,485 25,485 25,485 25,485 364 0.35
Utilities - Electric 42,158 36,979 29,670 29,670 424 0.41
Repairs & Maintenance 44,109 43,899 47,324 35,000 500 0.48
Contract Services 0 0 0 10,500 150 0.14
Marketing & Advertising 2,928 3,266 2,704 2,704 39 0.04
Cable/Phone/Internet 8,051 6,337 7,061 7,061 101 0.10
General & Administrative 3,471 891 641 641 9 0.01
Management Fee 54,800 52,800 52,800 6.8% 44,392 6.0% 634 0.61
Total Expenses $271,948 $260,602 $256,629 $288,833 $4,126 $3.98
Expenses as % of EGI 35.5% 33.5% 33.1% 39.0%
Net Operating Income $494,448 $516,467 $519,325 $451,027 $6,443 $6.21

INVESTMENT SUMMARY
PROPERTY OVERVIEW
Year of Construction 2004
Number of Units 70
Rentable Square Feet 72,614
Average Unit Size 1,037
Current Occupancy 98.0%
YEAR ONE/RETURNS
Annualized Per Unit
Gross Potential Rent $778,800 $11,126
Effective Gross In-come
$775,954 $11,085
Operating Expenses $(57,729) $(825)
NOI $519,325 $7,419
Initial Cash-on-Cash 9.73%
Year 1 Cash-on-Cash 5.17%
Year 1GRM 16.63
5-year IRR 10.79%
7-year IRR 15.55%
PRICING GUIDANCE
Low $7,000,000
$7,250,000
Middle $7,500,000
$7,750,000
High $8,000,000
FINANCIAL METRICS
Purchase Price
$7,000,000 - $7,500,000 - $8,000,000
Price/Unit $100,000 - $107,143 - $114,286
Price/SqFt $96.40 - $103.29 - $110.17
Current NOI $519,325
Current Cap 7.42% - 6.92% - 6.49%
Year 1 NOI $451,027
Year 1 CAP 6.44% - 6.01% - 5.64%
GRM Current 13.48 - 14.44 - 15.40
GRM Year 1 15.52 - 16.63 - 17.74
NEW LOAN SUMMARY
Original Loan Amount $6,375,000
Origination Date September-17
Interest 4.70%
Interest Only Periods 0
Amortization 30 years
Term 10 years
Term Date 9/1/2027
New Monthly PMT $33,063

GROWTH RATE PROJECTIONS
Year 1 2019 2020 2021 2022 2023 2024 2025 2026 2027
INCOME
Gross Potential Rent 0.0% 3.00% 3.00% 3.00% 3.00% 3.00% 3.00% 3.00% 3.00% 3.00%
Loss / Gain to Lease 1.0% 1.50% 1.50% 1.50% 1.50% 1.50% 1.50% 1.50% 1.50% 1.50%
Physical Vacancy 5.00% 5.00% 5.00% 5.00% 5.00% 5.00% 5.00% 5.00% 5.00%
Total Vacancy 5.00% 5.00% 5.00% 5.00% 5.00% 5.00% 5.00% 5.00% 5.00%
Total Other Income 2.00% 2.00% 2.00% 2.00% 2.00% 2.00% 2.00% 2.00% 2.00%
EXPENSES
Operating Expenses 2.00% 2.00% 2.00% 2.00% 2.00% 2.00% 2.00% 2.00% 2.00%
Real Estate Taxes 1.00% 1.00% 1.00% 1.00% 1.00% 1.00% 1.00% 1.00% 1.00%
Insurance 1.00% 1.00% 1.00% 1.00% 1.00% 1.00% 1.00% 1.00% 1.00%
Utilities 1.00% 1.00% 1.00% 1.00% 1.00% 1.00% 1.00% 1.00% 1.00%
Management Fee 6%
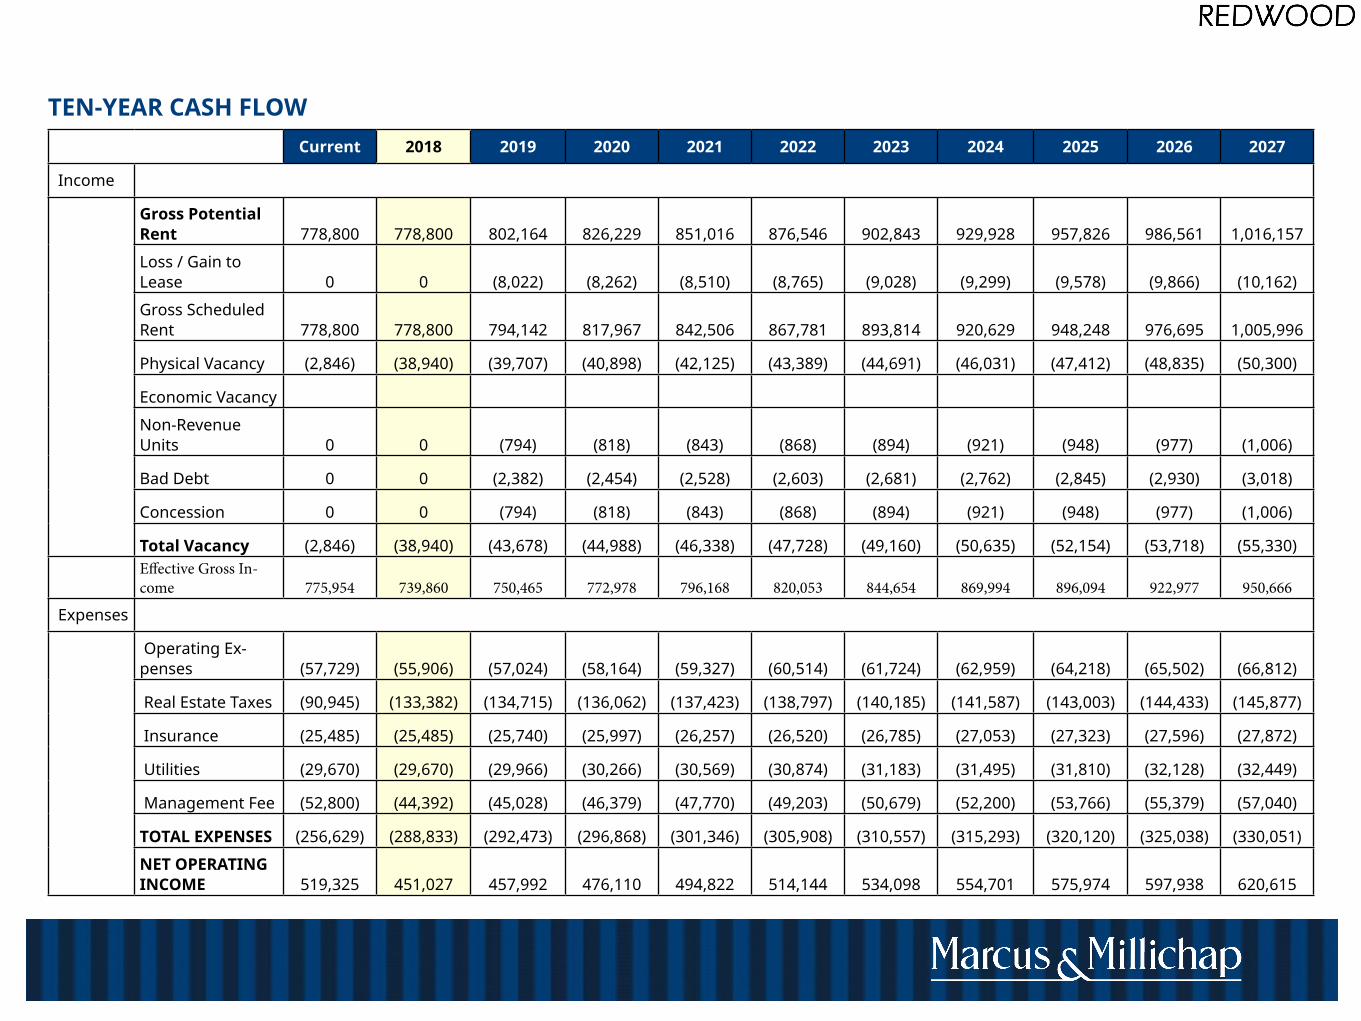
TEN-YEAR CASH FLOWCurrent 2018 2019 2020 2021 2022 2023 2024 2025 2026 2027
Income
Gross Potential Rent 778,800 778,800 802,164 826,229 851,016 876,546 902,843 929,928 957,826 986,561 1,016,157
Loss / Gain to Lease 0 0 (8,022) (8,262) (8,510) (8,765) (9,028) (9,299) (9,578) (9,866) (10,162)
Gross Scheduled Rent 778,800 778,800 794,142 817,967 842,506 867,781 893,814 920,629 948,248 976,695 1,005,996
Physical Vacancy (2,846) (38,940) (39,707) (40,898) (42,125) (43,389) (44,691) (46,031) (47,412) (48,835) (50,300)
Economic Vacancy
Non-Revenue Units 0 0 (794) (818) (843) (868) (894) (921) (948) (977) (1,006)
Bad Debt 0 0 (2,382) (2,454) (2,528) (2,603) (2,681) (2,762) (2,845) (2,930) (3,018)
Concession 0 0 (794) (818) (843) (868) (894) (921) (948) (977) (1,006)
Total Vacancy (2,846) (38,940) (43,678) (44,988) (46,338) (47,728) (49,160) (50,635) (52,154) (53,718) (55,330)Effective Gross In-come 775,954 739,860 750,465 772,978 796,168 820,053 844,654 869,994 896,094 922,977 950,666
Expenses
Operating Ex-penses (57,729) (55,906) (57,024) (58,164) (59,327) (60,514) (61,724) (62,959) (64,218) (65,502) (66,812)
Real Estate Taxes (90,945) (133,382) (134,715) (136,062) (137,423) (138,797) (140,185) (141,587) (143,003) (144,433) (145,877)
Insurance (25,485) (25,485) (25,740) (25,997) (26,257) (26,520) (26,785) (27,053) (27,323) (27,596) (27,872)
Utilities (29,670) (29,670) (29,966) (30,266) (30,569) (30,874) (31,183) (31,495) (31,810) (32,128) (32,449)
Management Fee (52,800) (44,392) (45,028) (46,379) (47,770) (49,203) (50,679) (52,200) (53,766) (55,379) (57,040)
TOTAL EXPENSES (256,629) (288,833) (292,473) (296,868) (301,346) (305,908) (310,557) (315,293) (320,120) (325,038) (330,051)
NET OPERATING INCOME 519,325 451,027 457,992 476,110 494,822 514,144 534,098 554,701 575,974 597,938 620,615

Exclusively listed by
Mike MoffittFirst Vice President Investments
AustinTel: 512-338-7846
1001 E FERN AVEMCALLEN, TX 78501


