475 Riverside Drive, Suite 253, New York, NY, 10115, United States Phone: +1-212-870-2767; Fax: +1-212-870-2777 Website: http://mci.ei.columbia.edu MCI SOCIAL SECTOR WORKING PAPER SERIES N° 3/2009 EDUCATION NEEDS ASSESSMENT FOR KADUNA CITY, NIGERIA Prepared by: Matthew A.M. Thomas June 2009
Transcript
475 Riverside Drive, Suite 253, New York, NY, 10115, United States
EDUCATION NEEDS ASSESSMENT FOR KADUNA CITY, NIGERIA
Prepared by:
Matthew A.M. Thomas
June 2009
1
All rights reserved. Unless otherwise indicated, this working paper may be reproduced, quoted or cited without permission of the author(s) provided there is proper acknowledgement. The responsibility for the contents of this Working Paper remains with the author(s).
NB: This needs assessment was researched and written by MCI intern Matthew Thomas. It was edited by MCI Co-Director Dr. Susan M. Blaustein and MCI Social Sector Research Manager Dr. Moumié Maoulidi.
2
ACKNOWLEDGEMENTS I would like to thank the following people and institutions that helped to make this project possible.
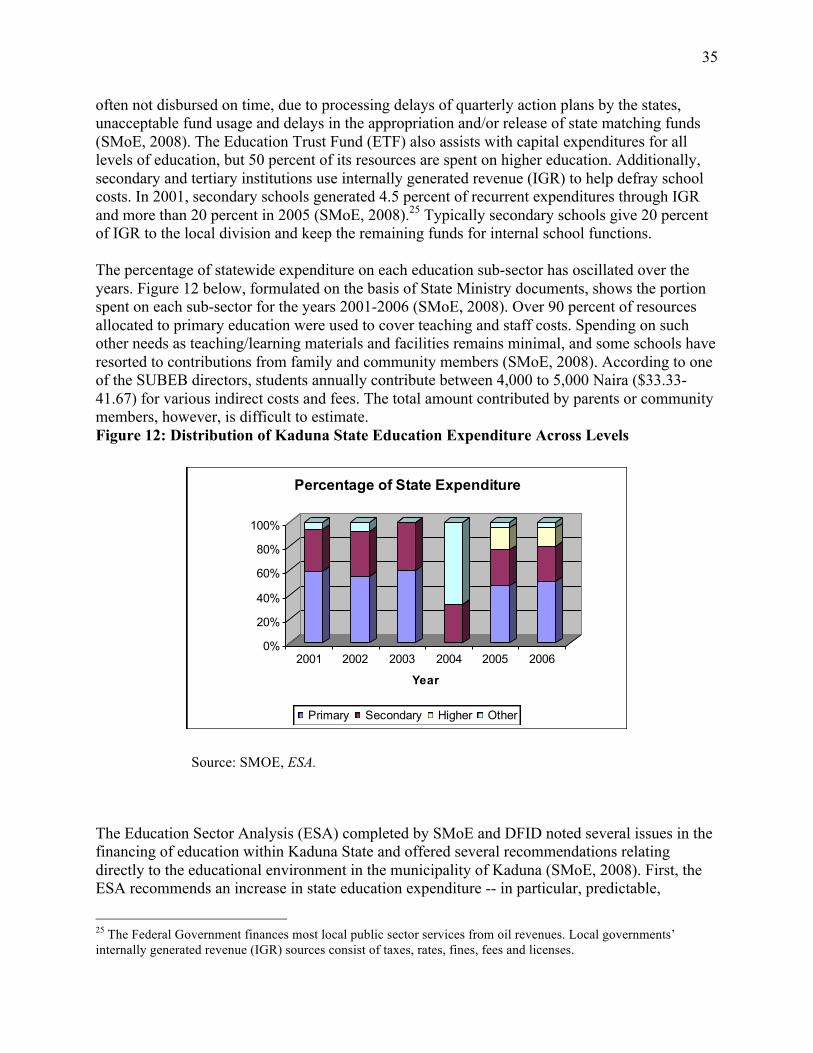
Kaduna State Ministry of Economic Planning (SMoEP) 1. Ladi Kokwain (Director, International Coordination) 2. Biya Dogon (Planning Officer, International Coordination) 3. Christy Yohanna (Officer, International Coordination) 4. Balat (Driver) Kaduna State Ministry of Education (SMoE) 5. Suleiman L. Kauru (Honorable Commissioner) 6. Nafisa Kawu (Education Permanent Secretary) 7. Ismaila Makarfi (Director, Planning, Research, & Statistics) 8. Abdu Gambo (Director, Schools) 9. John Woje Bagu (Director, Private Schools Board) 10. Alisabatu Dada Onazi (Director, Administration & Supply) 11. Rahila M. Shok (Director, Higher Education) 12. A. Mohammed (Deputy Director, Finance and Accounts) 13. Mallam Muazu N. Ahmed (Director, Agency for Mass Literacy) 14. Esther Myahwegi (Director, State Education Sector Plan) 15. Christina Lekwat (Director, Inspectorate) 16. Late N. B. Bin (Deputy Director, Educational Resource Center) 17. Jonathon Achi (Officer, HIV/AIDS Desk) 18. Isaac Jogai (Officer, Planning, Research, & Statistics) 19. Kenneth Anaredo (Principal Planning Officer, Technical Education Board) Kaduna State University (KSU) 20. Ibrahim Kubau (Director, Academic Affairs) 21. Hauwa Ibrahim (Planning Officer, Academic Affairs) Kaduna State Universal Basic Education Board (SUBEB) 22. Y. K. Bobai (Director, Inspectorate) 23. Christopher Ignatius (Director, Planning, Research, & Statistics) 24. Jonah S. Bagudu (Assistant Director, Planning, Research, & Statistics) 25. Monday B. Madaki (Deputy Director, Physical Planning & Monitoring) 26. Audu B. Musa (Principal Education Officer, Statistics) 27. Naason Nbala (Headmaster, Railway Quarters Primary School) 28. Musa Gwamna (Chief Inspector of Education) Department for International Development (DFID) 29. Steven Bradley (Kaduna State Team Leader, CUBE Project) United Nations Development Programme (UNDP) / Millennium Villages Project (MVP) 30. Dr. Tony Chuvwen (Project Manager, MVP) 31. Dr. Bala Yunusa (Project Officer, MVP) 32. Elisha Tunua (Project Accountant, MVP) Columbia University 33. Dr. Susan M. Blaustein (Co-Director, Millennium Cities Initiative, Earth Institute) 34. Dr. Moumié Maoulidi (Social Sector Research Manager, Millennium Cities Initiative) 35. Ms. Leocadie Welling (Former Administrative Assistant, Millennium Cities Initiative) 36. Ms. Janina Franco (Former Associate Research Scholar, Millennium Cities Initiative)
III. FINANCING OF EDUCATION .................................................................................................................. 33 3.1. Financial Situation in Kaduna .............................................................................................................................. 33 3.2. Unit Costs ...................................................................................................................................................................... 37 3.3. EPSSim Scenarios ...................................................................................................................................................... 37
IV. CONCLUSION AND RECOMMENDATIONS ........................................................................................ 40 REFERENCES ............................................................................................................................................................ 42 APPENDIX .................................................................................................................................................................. 45 Appendix 1: .......................................................................................................................................................................... 45 Appendix 2: .......................................................................................................................................................................... 46
4
TABLES Page Table 1: Public and Private Primary Indicators (2005/2006) 21 Table 2: JSS Flow rates in Kaduna State (2005-2006) 27 Table 3: Basic Literacy Program Indicators (2006) 31 Table 4: Share of LGA federal allocation spent on primary school staff salaries (05/06) 34 Table 5: Unit Costs (Naira) at all levels of Education in Kaduna State 37 Table 6: Simulation Cost for Scenarios 38 Table 7: Internal efficiencies between current situation and proposed optimum scenario 39 FIGURES Figure 1: Organizational Structure of Kaduna State Ministry of Education 16 Figure 2: ECCD classroom at Railway Quarters Primary School, Kaduna South LGA 19 Figure 3: Public Primary School Enrolment (1998-2007) 20 Figure 4: Combined and Individual PTR by LGA 22 Figure 5: Teaching Staff Summary (1998-2007) 23 Figure 6: Primary Teachers by Qualifications 24 Figure 7: Photo of Toilet Block Constructed in 2006 25 Figure 8: Kaduna State Primary School Completion Rate 26 Figure 9: Percentage of students with passing marks on JSCE by subject and year 28 Figure 10: Enrolment in Adult Literacy Classes in Kaduna (1990-2007) 31 Figure 11: Resource Allocation for Primary Schooling 33 Figure 12: Distribution of Kaduna State Education Expenditure Across Levels 35 Figure 13: Percentage of Total State Budget Spent on Education 36 Figure 14: Number of Primary Teachers in Kaduna City (2006-2017) 38 Figure 15: Recurrent Costs for All Levels of Education in Kaduna City (2006-2017) 39 MAPS Map 1: Local Government Areas (LGAs) in Kaduna State 9 Map 2: Map of Nigeria with Kaduna city 13
5
ABREVIATIONS C-SESP Consolidated State Education Sector Plan CUBE Capacity for Universal Basic Education DfID UK Department for International Development ECCD Early Childhood Care and Development ERC Educational Resource Center ESA Education Section Analysis FME Federal Ministry of Education GDP Gross Domestic Product GER Gross Enrolment Rate GIR Gross Intake Rate IGR Internally Generated Revenue JSCE Junior Secondary Certification Examination JSS Junior Secondary School KSU Kaduna State University LGA Local Government Area LGEA Local Government Education Authority MDG Millennium Development Goal NGO Non-Governmental Organization NCE National Certificate of Education NECO National Examination Council NEMIS Nigerian Education Management Information System NTI National Teacher Institute NUT National Union of Teachers PTR Pupil-Teacher Ratio SACA State Action Committee Against AIDS SMoE State Ministry of Education SMOH State Ministry of Health SMOST State Ministry of Science and Technology SSCE Senior Secondary Certificate Examination SSS Senior Secondary School STUP Special Teacher Upgrading Program SUBEB State Universal Basic Education Board TC.II Teaching Certificate II TVE Technical and Vocational Education UBE Universal Basic Education UBEC Universal Basic Education Commission UNESCO United Nations Educational, Scientific and Cultural Organization WAEC West African Examinations Council
6
EXECUTIVE SUMMARY
This educational needs assessment is part of series of working documents aiming to support the creation and implementation of urban development strategies in nine Millennium Cities in sub-Saharan Africa. This study explores the educational situation in Kaduna, Nigeria, and examines recent successes and the ensuing challenges in the education sector. The main objective of this assessment is to evaluate Kaduna’s path to achieving Millennium Development Goals (MDGs) #2 and #3 – achieving universal primary education and achieving gender parity at all levels of education by 2015. This work was conducted by a Columbia University Teachers College student contracted by the Earth Institute who subsequently traveled to Kaduna, Nigeria, in May/June 2008, to collect data, conduct interviews and examine the current educational system.
The findings of this assessment show that education in Kaduna is moving in a positive direction, although much remains to be accomplished before the education MDGs will be met successfully. There is a particular need to improve early childhood care and development (ECCD) in the city, as many children do not attend pre-primary institutions. At the primary and secondary school levels, enrolments have increased dramatically in recent years due to the free and compulsory education program. As a result, latrines, classrooms and staff rooms need to be built or renovated, and more textbooks and teacher guides have to be provided. This requires financial resources form the Federal Government, the State and the donor community.
Initiatives to improve the quality of education also need to be undertaken. Many teachers are not qualified, and many students are not passing the various standardized exams. Teachers at all levels need to at least complete the National Certificate of Education (NCE). Improved qualifications will hopefully influence students’ performance on exams. The exit examinations at the end of primary and junior secondary school are also preventing many students from transitioning to higher levels of education. Girls perform significantly less well than boys on these exams. Given that one of the education MDGs is explicitly concerned with gender parity, interventions with the potential to improve girls’ performance on these examinations, such as recruitment of qualified female teachers and provision of instructional materials to schools, are very much needed.
Finally, better data management and maintenance will help Kaduna achieve the education MDGs. Currently, private schools in Kaduna City enroll a large number of the students but the Education Management Information System (EMIS) data only partially covers the private sector in education. The data management system used to track students in private schools is currently being updated, which will be extremely important to tracking the overall indicators of education in the city. Islamic and other religious schools are also often lost in the statistical melee. Including all educational providers in the State Ministry of Education (SmoE) data system will be crucial to ensuring that all students have access to primary education.
This report is divided into four sections. The first provides a brief background description of Kaduna City and the objectives of this study; the second includes an analysis of educational indicators for each level, introduces successes and problems associated with the provision of education and considers specific issues that need to be addressed. Section III presents information on education costs and analyzes the status of educational finance in Kaduna. Finally, recommendations for the future development of education in the city are provided.
7
I. INTRODUCTION
This educational needs assessment examines the existing educational environment in the municipality of Kaduna, the capital of Kaduna State and symbolic capital of northern Nigeria (Human Rights Watch, 2003a). According to the latest census, the city’s population in 2006 was 1,128,694.1 The city is a tribal melting pot, with several distinct groups. The Hausa/Fulani are the dominant ethnic groups in the city and the state, and the Hausa language serves as the lingua franca. The city predominantly consists of people who are Muslims, but close to 40 percent of the population are Christian (Maier, 2000). The objective of this needs assessment is to identify and assess the major constraints facing the city in its efforts to achieve Millennium Development Goals #2 and #32:
• Achieving universal primary education • Achieving gender parity in primary and secondary education
The first Millennium Development Goal, “eradicating extreme poverty and hunger,” is also considered, though to a lesser extent, through the promotion and evaluation of adult literacy programs and tertiary education. As adults achieve literacy and attain higher levels of education, their potential to obtain higher paying jobs and to climb out of poverty increases exponentially. The main focus of the report, however, is centered on formal education at the primary level.
Education in Kaduna City is characterized by many challenges, which tend to differ drastically from rural to urban areas. According to the Universal Basic Education (UBE) intervention, all children are provided free education for six years of primary school and three years of junior secondary school (JSS). While this federal mandate to provide nine years of basic education has the potential to promote development and effect positive change in the region, in reality it may be somewhat ambitious, as many children are currently not able to bridge the gap between primary and JSS. Even worse, some children in the most rural areas are not able to attend primary school at all. Additionally, issues of educational quality are problematic. Kaduna City currently employs a large percentage of teachers who are unqualified or who do not meet national certification standards. As a result of poor examination scores, an indicator closely linked to the quality of teaching, many students are not able to transition successfully to higher levels of education.
Educational resources are also in high demand. In some locations, school facilities are quite literally falling apart, students and teachers lack textbooks and teacher guides and school grounds have an insufficient number of latrines and water sources. One government official noted that, “some teaching staff go home for water or to use the toilet,” because the facilities at school are insufficient or nonexistent.3 Indeed, it would seem that numerous barriers exist to achieving universal primary education and attaining the education MDGs by 2015. 1 This is the population for three LGAs, Kaduna North, Kaduna South and Chikun. 2 UNDP (2008). 3 J. Bagudu, personal communication, May 28, 2008.
8
1.1. Background One of the challenges in conducting a needs assessment for Kaduna City is that its geographic boundaries are not clearly demarcated. Neither a city “boundary” nor an official centralized city government exists. Instead, all educational activities are monitored and operated at the state level. In actuality, the city of Kaduna actually lies in several different Local Government Areas (LGAs): Kaduna North, Kaduna South and Chikun. After many conversations with various stakeholders, most officials came to a consensus that this research study should primarily focus on the aforementioned three LGAs. This decision was not easy, because while all of Kaduna North and South are included in the metropolis, only part of Chikun lies within the city limits. The remaining sections of Chikun are considered rural areas and, therefore, represent vastly different educational environments and challenges. Including only the urban section of Chikun was not possible, as the data was only disaggregated to the LGA level. Despite the inclusion of some rural regions of Chikun, it was generally agreed that it should be included in the study, along with Kaduna North and Kaduna South LGAs.
Plans are apparently underway for Kaduna City’s further expansion into the Chikun local government area, which further justified Chikun’s inclusion in the scope of this study. It should also be noted that a very small percentage of Igabi LGA is included in the municipality of Kaduna. While officials could not confirm the exact percentage, they generally agreed that less than 10 percent of the LGA falls within the urban area of Kaduna and that the majority of the city—more than 95 percent—was situated in the other three LGAs. After consulting with numerous ministry officials and staff from non-governmental organizations (NGOs) operating in Kaduna, it was decided that Igabi should be excluded from the scope of this study. Map 1 below shows all of the LGAs in Kaduna State.
9
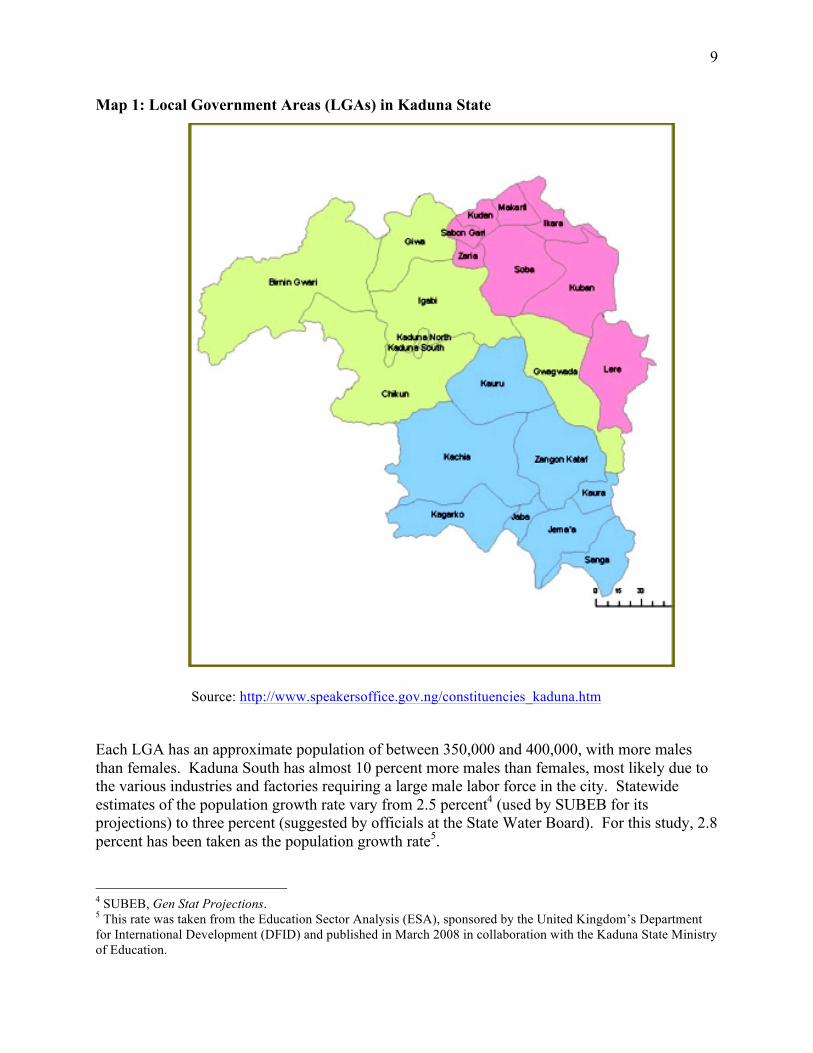
Map 1: Local Government Areas (LGAs) in Kaduna State
Each LGA has an approximate population of between 350,000 and 400,000, with more males than females. Kaduna South has almost 10 percent more males than females, most likely due to the various industries and factories requiring a large male labor force in the city. Statewide estimates of the population growth rate vary from 2.5 percent4 (used by SUBEB for its projections) to three percent (suggested by officials at the State Water Board). For this study, 2.8 percent has been taken as the population growth rate5.
4 SUBEB, Gen Stat Projections. 5 This rate was taken from the Education Sector Analysis (ESA), sponsored by the United Kingdom’s Department for International Development (DFID) and published in March 2008 in collaboration with the Kaduna State Ministry of Education.
10
Education in Kaduna City and the rest of the state is controlled by the State Ministry of Education (SMoE), which is seated in the state ministry secretariat complex in Kaduna City. The SMoE is responsible for the statewide provision of educational services, including executing administration duties, allocating funds to support various educational branches and monitoring and inspecting both levels of secondary school—junior secondary schools (JSS) and senior secondary schools (SSS). The State Universal Basic Education Board (SUBEB) is charged with handling educational provision and financing at the primary and pre-primary levels. SUBEB is considered one of the parastatals under the auspices of the SMoE, which also provides oversight for several other statewide parastatals, including the Kaduna Agency for Mass Literacy and Kaduna State University (KSU). The state’s Educational Resource Center (ERC) controls and monitors curriculum and educational content, including material for the various subjects studied in schools. While most educational decisions are made at the state ministry level, LGAs also play a role in the decision-making for the education sector, particularly at the local level. The role of the LGAs is more prominent for primary than for secondary education. The lack of a municipal government, however, means that most processes in the city of Kaduna are still aggregated and handled at the state level. Furthermore, some data are collected and analyzed by inspectorate divisions, while others are disaggregated by LGA. In addition to dual coverage in data, the roles and responsibilities of various governmental agencies or offices sometimes overlap, a circumstance addressed in greater detail later in this report.
1.2. Objectives The scope of this needs assessment is quite broad and includes several different levels and forms of education. In the formal public education sector, levels considered include pre-primary, primary, junior and senior secondary education. The same levels of education are considered within the private sector, although data regarding private schooling is more difficult to gather and verify. As mentioned above, Kaduna State is currently in the process of upgrading its private school educational tracking system, but at the time of this study, much data was unavailable.
Tertiary education in Kaduna is considered in this evaluation, but only data from the main institution of higher education in the region, Kaduna State University (KSU), is included in the final analysis. Although several other tertiary institutions are located in Kaduna City, data was difficult to gather for these institutions which, more importantly, do not receive state funding. Additionally, non-formal education—in the form of adult literacy programming—also falls within the scope of this study.
The main educational indicators considered here include the following: enrolment, intake, promotion and repetition rates; classroom, latrine and textbook availability; teacher qualifications and employment figures; gender ratios, and classroom utilization rates. Throughout this needs assessment, regardless of the educational level or sector, an emphasis is placed on gender parity, evidenced by the ratio of boys to girls in school, male and female
11
teachers, etc. The financing of education is also included and is evaluated on the basis of capital and recurrent costs, budgetary allowances and other indicators. Two essential research questions drive this study. First, how does the current educational situation in Kaduna City compare to the targets embedded in the MDGs -- that is, how far away is Kaduna City from achieving the MDGs? Second, what policy options and strategic planning considerations could possibly help the city of Kaduna attain these Goals by 2015?
1.3. Methodology Information regarding school enrolment was gathered from the Planning, Research and Statistics offices of the SMoE and SUBEB. The original data were collected6 using NEMIS, the Nigerian Educational Information Management System, and later compiled into electronic charts and tables. These data were based on existing documents and compiled from the various existing segregations. At the secondary level, school data are segregated according to inspectorate division, with each division responsible for collecting the information and reporting directly to the Ministry of Education. At the primary level, data are segregated by Local Government Areas, each of which is made up of a number of smaller districts. In some cases, statewide data are used as a proxy for data that is missing or unavailable at the municipal level. These substitutions will be noted in the report when they occur. National, state and local policy documents also informed this study and played a crucial role in analyzing the future of education in Kaduna. Finally, comparisons between different states or LGAs have occasionally been offered to provide deeper insight into the local and national contexts. In addition to collecting quantitative data, formal and informal interviews were conducted with various ministry officials, focused on three main issues: 1) the structural and functional operations of the educational system; 2) the major constraints to improving education in Kaduna City, and 3) Kaduna SMoE’s goals, plans and objectives for the future of education in the city and state. Quotations and comments from these interviews have been interspersed throughout this report to triangulate and provide supplementary support for some of the quantitative data.
1.4. Demographics According to the 2006 Nigerian Population Census, Kaduna has the third largest state population in Nigeria, with more than six million residents. With more than 140 million people, Nigeria has the largest population in Africa and the eighth largest in the world.7 Its economy, largely dependent on crude oil from the Delta region, has also shown signs of growth, insulating Nigeria at least somewhat from the global economic crisis. According to the International Monetary Fund (2008), Nigeria experienced the strongest economy in its recent history and benefited from a nine percent gross domestic product (GDP) growth rate in 2008. At this point, however, it is unclear how badly the Nigerian economy will be affected by the worldwide economic downturn, 6 Data collection and analysis techniques included copying old printed information and electronic documents; cross-checking and confirming data sets with stakeholders, and analyzing statistical reports of various education offices. 7 Federal Republic of Nigeria (2006).
12
which has already triggered a serious currency devaluation, or by the reduction in oil production, resulting largely from the activities of militants in the Niger Delta (Stratfor, 2009). According to the World Bank, the recent instability in the Delta region has led to a severe drop in the oil industry’s total percentage of GDP (World Bank, 2008). Nigeria has the second largest economy in sub-Saharan Africa and is responsible for 41 percent of the region’s GDP (World Bank, 2008). Fortunately, the average inflation rate has fallen from 17.8 to 5.2 percent between 2005 and 2007 (World Bank, 2008). Additionally, Nigeria has cleared its foreign debt through successful negotiations with the Paris and London Clubs. As a major industrial center, the city of Kaduna has achieved a per capita GDP of $1,600, well above the national average $1,161 (World Bank, 2008). Despite debt elimination and positive GDP growth, the economic distribution is very polarized, with “the richest 10 percent of the Nigerian population receiving just under half of the national income while the bottom 10 percent receive only 1.6 percent” and an estimated 60 percent of the population living below the poverty line (World Bank, 2008; Hardman, Kadir and Smith, 2008). The economic polarization is one of many factors contributing to Nigeria’s overall ranking of 154th out of 179 countries on the United Nations Human Development Index (UNDP, 2008a). This index measures a variety of development indicators, including adult literacy, life expectancy and school enrolment ratios.
1.5. Ethnic and Religious Tensions Economic struggles are not the only challenges faced by denizens of Kaduna. The distinction between indigenous and non-indigenous also appears to be a significant division among some sectors of society. Non-indigenous communities often claim that they are discriminated against in the provision of vital government infrastructure and services such as schools, scholarships, health care and even roads. In some states, non-indigenous parents allege that, although secondary school fees are technically the same for indigenous and non-indigenous students, local officials routinely waive school and exam fees for indigenous students, while non-indigenous students are forced to pay. In other communities non-indigenous find that they are unable to purchase land or even a home (Human Rights Watch, 2006).
13
Map 2: Map of Nigeria with Kaduna City
Source: CIA World Factbook, Nigeria
Religious and ethnic tensions are still fresh in the minds of those living in Kaduna. In 2000, a major incident occurred in which more than 1,200 people died in violent riots across the city. “From one point of view,” Nigerian journalist/editor Hajiya Bilkisu Yusuf noted, “the conflicts are between a major ethnic group, Hausa-Fulani, and the minorities, while from another, it is a clash of religion, Christians against Muslims.”8 In 2002 more riots broke out between varying fractions, this time more clearly divided along religious lines. This occurred shortly after the Government implemented a modified version of Shari'a law (United States Department of State, 2002). Several hundred were killed, and between 20,000 and 30,000 people were displaced in the course of the fighting and its aftermath (Human Rights Watch, 2003b). These conflicts directly affected educational provision, as a large number of schools were destroyed or burned during the attacks. Additionally, many students were unable to attend school for a period of time, due to the fragile and insecure conditions. These drops in school attendance were significant, as can be seen in Figure 3. While it is clear that religious and ethnic tensions still exist among the residents of Kaduna, several government officials insisted that violent strife of this nature would never again
8 Yusuf, 2007, p. 246.
14
occur in Kaduna City. They believe that an increased sense of solidarity and unity among members of Kaduna society will mitigate against such conflict in the future.
1.6. Limitations Several challenges were encountered while conducting research for this study. The conflict between the large scope of the research questions and the in-country time allotted for research presented the biggest challenge. As a result, significant amounts of time were spent traveling to and waiting at various offices and other locations to meet officials and gather data. Additionally, it was often difficult to know with whom to speak, in order to request access to the desired information. Nigerian business protocols also presented a challenge: officials would not release data without letters addressed to them and signed by the Commissioner of the Ministry for Economic Planning, the official Nigerian sponsor for MCI’s research. Consequently, the research process was often dictated by whether these official letters had reached the necessary official. In some instances, data were readily available and appeared accurate and current. In other cases, some basic data were available, while specific statistical calculations including rates, percentages and other figures were missing, and such information had to be manually calculated based on existing data sets. Unfortunately, the online education information system was not operational during MCI’s field research. Additionally, some data sets contained errors due to improper reporting by school administrators, as conversations with officers from the Planning, Research and Statistics office of Kaduna SMoE revealed. This is especially relevant for statistics concerning the numbers of teachers, as teachers are sometimes counted twice if they teach multiple subjects or grade levels. Data specific to education financing were difficult to procure and analyze for several reasons. First, some ministry officials were reluctant to release sensitive financial information. Second, educational finance in Nigeria is incredibly complex, as a number of different sources allocate funds to different levels of education. In fact, some funding sources, such as support coming from local communities, are essentially impossible even to estimate, due to a lack of tracking and budgeting. This challenge is addressed in greater detail in the “Financing Education in Kaduna” section of this report. Finally, much of the financial data is aggregated at the state level. Because the geographical scope of this study is limited to Kaduna North, Kaduna South and Chikun LGAs, it was sometimes difficult to estimate the amounts spent in each area. The geographic scope of this study, focused on three LGAs, also proved difficult when analyzing data. At the primary level, statistics are gathered and maintained by LGAs. However, as mentioned, at the secondary levels (JSS and SSS), data is organized by inspectorate divisions, which are not divided along LGA boundaries. Indeed, two schools in an inspectorate division may belong to separate LGAs. This makes the entire research study more complex, as some data, including population figures, are disaggregated by LGAs, while others are organized according to inspectorate divisions. Even more challenging, some schools included in specific divisions are actually located outside the municipality of Kaduna and the three LGAs under study.
15
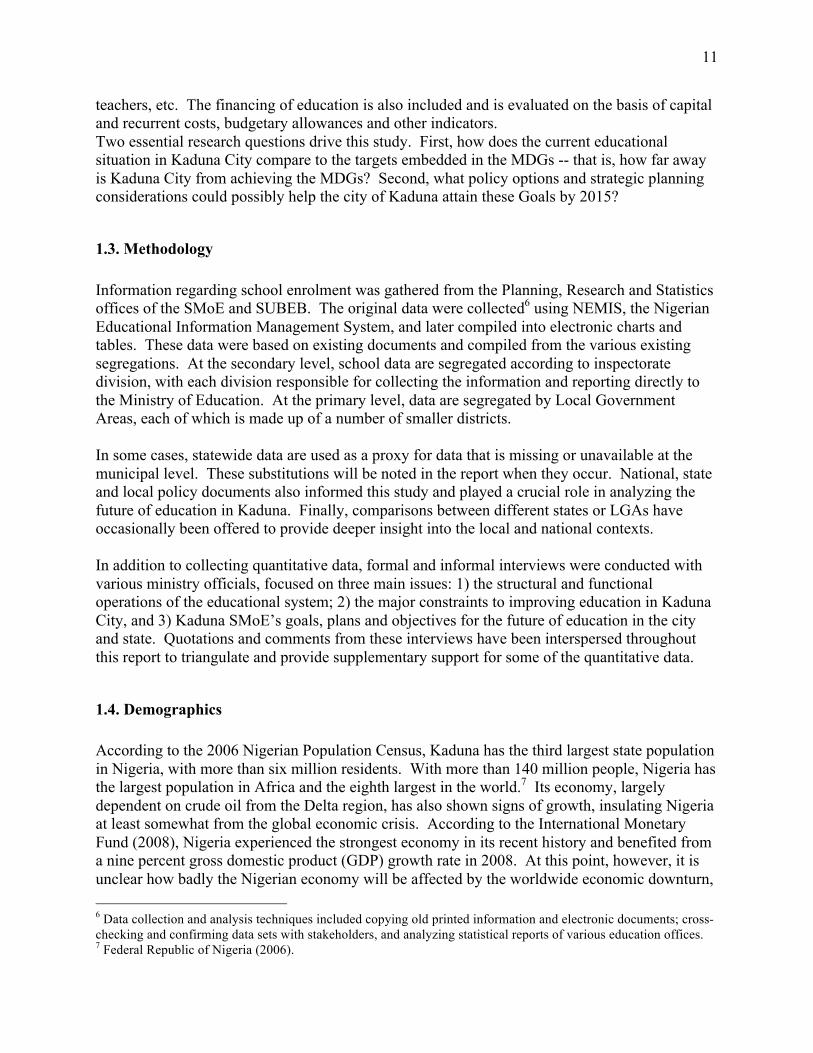
1.7. Educational Services Overview Educational services in Kaduna State are handled by a number of different ministry offices and agencies. As in all LGAs in Nigeria, federal, state and local government all have stakes in education service delivery. LGAs are primarily responsible for providing funding allocated for the salaries of teachers and non-teaching staff. Each LGA has a Local Government Education Authority (LGEA), headed by the Education Secretary for that LGA. The LGEA works directly with SUBEB to coordinate educational activities in the area and to monitor teaching through classroom observations, which are supposed to be made on a bi-monthly basis. Local governments are officially responsible for primary education, although federal and state governments assist with administration, supervision and inspection. The recruitment and payment of teachers is the responsibility of the local governments, although SUBEB handles the direct payments to teachers and must approve all qualified teacher appointments. In some domains, there is overlap between the mandates of SUBEB and the LGAs. Some of the domains where roles and responsibilities are somewhat unclear include teacher management, procedures relating to school operation, implementation of capital building projects and primary school maintenance (SMoE, 2008). At the state level, three ministries aid in educational service provision. The State Ministry of Science and Technology (SMOST) is responsible for the operation of six science secondary schools, five technical colleges and three commercial schools including Nuhu Bamali State Polytechnic (SMoE, 2008). The State Ministry of Health (SMOH) is responsible for higher education institutions related to medicine and health services. The State Ministry of Education (SMoE) is charged with the remaining education sectors. This ministry handles all education policies related to primary, secondary, vocational and tertiary education. The SMoE is responsible for supervising SUBEB, which is charged with the management of primary schools, facilities and maintenance and the supply and purchase of textbooks and other instructional materials. Secondary education is solely under direct control of the SMoE. Regarding tertiary education, the SMoE is responsible for Kaduna State University and the State College of Education Gidan Waya, whereas the Federal Ministry of Education (FME) handles most of the other tertiary institutions in the state, including Kaduna Polytechnic Institute, a popular technical school training more than 15,000 students. The Kaduna SMoE is responsible for all administrative duties regarding education in Kaduna State. The ministry is headed by the Honorable Commissioner, an elected official. The Education Permanent Secretary serves as second in the chain of command and is not elected. A number of parastatals fall under the authority of the permanent secretary, although these are not housed at the state secretariat: SUBEB, Kaduna Agency for Mass Literacy, Library Board, Scholarship Board, College of Education Gidan Waya, Private Schools Board, Kaduna State University, Teaching Service Board and Kaduna Capital School. All of the parastatals are funded by the state and report directly to the SMoE. There are also eight departments within the SMoE, each with its own director, deputy directors and other officers, including: School Services; Planning, Research, and Statistics (PRS); Administration and Supplies; Finance and Accounts; Higher Education; Inspectorate Services, State Education Sector Project and the Education Resource Center (ERC). A flow chart outlining the chain of command and various departments is shown in
16
Figure 1: Organizational Structure of Kaduna State Ministry of Education
Source: SMoE, ESA, p. 102.
The FME is charged with creating, disseminating and monitoring national education policies. One national policy that drastically changed the course of education in Nigeria was the introduction in 1999 of Universal Basic Education (UBE), which mandates that all children should receive free basic education, consisting of six years of primary school and three years of junior secondary school (JSS). At the conclusion of the last year of primary school (Primary Six) and junior secondary school (JSS3), students must take exit exams, the “selection exam” and “junior secondary certificate exam (JSCE)”, respectively, before moving on to the next level. A state examinations board determines the minimum qualifying scores for each year, and the exams are controlled by the state, which both decides the appropriate content and facilitates the examination process.
There are currently a number of additional institutions delivering educational services in Kaduna. Statewide, there are many nomadic, Qur’anic and Islamiyyah schools in operation. According to
Internal Audit
Director Schools
Education Permanent Secretary
Honorable Commissioner of
Education
Director PRS
Director Inspectorate
Services
Director ERC
Director Higher
Education
Director Administration
and Supply
Director Private Schools
Public Relations
Parastatals (Including SUBEB)
Director Finance
and Accounts
17
the Education Sector Analysis (SMoE, 2008), there are 138 nomadic schools, 5,108 Qur’anic schools and 3,702 Islamiyyah schools in the state. While many of these schools are autonomous and currently operate outside of the SMOE’s administration, a means to integrate them into the system is currently being formulated. The following section examines the educational indicators considered in this study and explores the current educational environment in Kaduna City. The baseline data for this research predominantly come from 2006, but some data from other years have been substituted where 2006 figures were unavailable.
II. PERSPECTIVES ON EDUCATION SUB-SECTORS
In this section of the report, each level or form of education included in the study is thoroughly evaluated and described, using baseline data describing the situation on the ground in Kaduna City. First, particularly in the more urbanized areas, private schools enroll a large percentage of the student population. The recent Private Schools Board was only established a year ago, and, consequently, accurate data regarding the private schools is still being collected and organized. Second, there is a serious problem of over-staffing in Kaduna’s urban schools. While an astonishingly low pupil-teacher ratio (PTR) may seem like a wholly positive characteristic, in reality it represents a waste of precious financial resources. Additionally, both qualitative and quantitative data support the finding that schools lack such basic resources as textbooks, teacher guides, classrooms and latrines. Other findings demonstrate that technical and non-formal education in Kaduna is drastically underdeveloped. This is particularly concerning, given the demands of the labor market and the future productive potential of the nation.
2.1. Pre-Primary Education Pre-primary education in Nigeria, termed, “Early Childhood Care and Development (ECCD),” enrolls children as young as one year old. Children from several months to two years old can attend kindergarten classes at pre-primary institutions. The percentage of children attending kindergarten, however, is very low. A greater percentage of children are able to attend nursery school, which occurs after kindergarten, although these figures are still lower than the primary enrolment percentages. Nursery schools are referred to as levels 01-03, or N1-N3, and children aged three to five are eligible to attend. The few public pre-primary programs that do exist are typically incorporated into the facilities at primary schools. In the 2006/2007 school year, 12,839 children were enrolled in public nursery schools in Chikun, Kaduna North and Kaduna South. The gross enrolment rate (GER) for public pre-primary school was approximately 13 percent for girls and 10 percent for boys. Teachers at the nursery level are called “caregivers,” and the SMoE has been attempting to create specific certifications for teachers at this level. The PTR for public nursery schools is approximately 26:1, although nearly
18
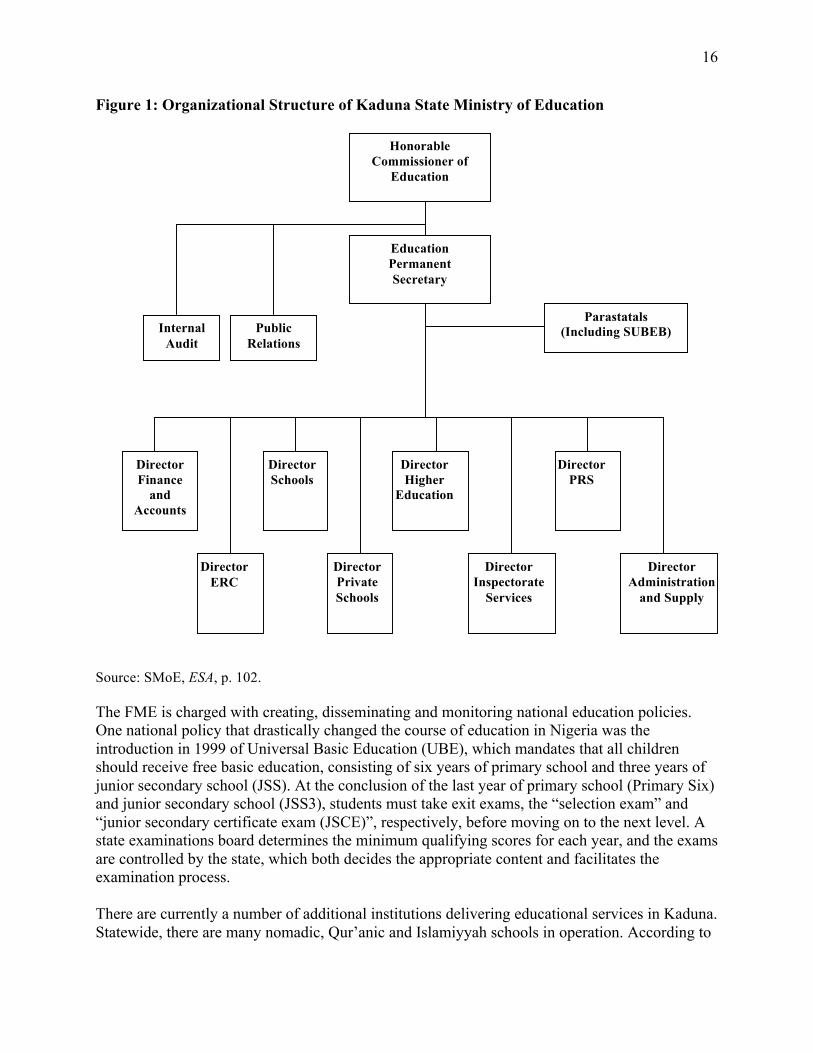
48 percent of the caregivers were teaching with sub-standard qualifications, typically a TC.II certificate or less9. In contrast to the low numbers of children attending pre-primary public schools, 51,829 children were enrolled in private nursery schools in the 2006/2007 school year. For the three LGAs considered in this study, the GER for private schools is 45 percent. Interestingly, the GER was more than five percent higher for girls than for boys, at 48 percent and 43 percent respectively, parallelling the public school ratio, where the GER is also higher for girls. At the nursery level, it is clear that private institutions are far more popular than the public ones, with more than 80 percent of those enrolled in nursery school attending a private school. This figure is quite high, especially considering the fees associated with private schooling: some of the private schools charge more than 12,000 Naira per term (approximately $300 per year), while others charge only 1,000 Naira per term. Despite some of the high tuition fees at private nursery schools, many parents feel it is a worthwhile investment. One parent noted succinctly the distinct difference between public and private nursery schools: “They [private nursery schools] are of a much higher quality.”10 The combined GER for nursery school is 56 percent, which is high, given that pre-primary education is neither compulsory nor covered under the UBE intervention. The GER for rural areas is drastically lower, as parents typically lack sufficient funds to send their children to nursery schools, and fewer pre-primary schools exist. For example, Chikun LGA, which is partly rural, has only 70 private nursery schools, whereas Kaduna North and Kaduna South each has more than 260. To increase the GER in the rural areas, the SMoE would have to build schools and begin to offer pro-poor subsidies. Given the current financial constraints of SUBEB and the SMoE, it is unlikely that public nursery programs will be able to greatly expand outside of the municipality of Kaduna. It is certainly possible, however, that the GER could increase in the more urbanized areas. Based on enrolment figures from the Private Schools Board and SUBEB, the number of students attending nursery school has nearly doubled in recent years. This achievement, likely due to increases in both the number of private and public pre-primary institutions and in the relative affluence among Kaduna City residents, provides hope for achieving future target enrolment rates. The Federal Ministry of Education has set a 66 percent GER target, although Kaduna State targets are between 40-50 percent (SMoE, 2008). Educational quality at this level, however, is still a matter meriting further exploration. Textbooks and learning materials are not provided for students in public schools, and private schools are currently not tracking learning materials at this level. Additionally, as mentioned above, many caregivers are not trained, and there appears to be a serious lack of accountability in educational content and delivery at the pre-primary level. Due to its nascent stage and the absence of dedicated educational financing, improving the quality of public education and instruction at the ECCD level will be a major challenge for SUBEB and the SMoE. Figure 2 below reflects a typical scene in a pre-primary school. This particular classroom contains nearly 90 students and eight teachers or caretakers. While this classroom may seem like an ideal educational environment—with a student-to-teacher ratio of nearly 10:1—the lack of classroom space seriously diminishes the value of having an abundance of teachers. The students clearly do not
9 Due to the high number of unqualified teachers, the Federal Ministry of Education has proposed that teachers with Grade Two certificates (TC.II) or less are to be phased out. The 2004 Universal Basic Education Act requires the National Certificate on Education as the minimum teaching qualification. 10 E. Tunua, personal communication, May 16, 2008.
19
have adequate learning space or materials, as evidenced by the students sitting on the floor and those practically falling off the benches. Furthermore, the pedagogical style utilized with the students was dictated by the lack of classroom space and materials; teachers called out English words or mathematical calculations, and students repeated them aloud in a call-and-response or recitation form. It was obvious that the teachers expected students to memorize lesson content for the day. It was also obvious that many students were merely copying what their friends said or wrote and consequently had little understanding of the actual material in the lesson. Figure 2: ECCD classroom at Railway Quarters Primary School, Kaduna South LGA
Source: Author.
2.2. Primary Education Primary education in Nigeria is a six-year program. Public primary school is officially under the auspices of SUBEB, but LGAs also play a role at this level. LGAs help to recruit and monitor teachers and assist with capital and school renovation projects. Private primary schools are organized and monitored by the Private Schools Board but often act on a more autonomous basis than their public counterparts. Public primary schools are labeled according to their identifying characteristic, namely the date of their establishment or their relationship to another school. For example, so-called mother schools are those which have adopted the creation of smaller “branch” schools. “Model schools” are typically exemplified by specific educational targets and increased funding. These model schools are to serve as examples of ideal teaching and learning environments. Kaduna Capital School is an example of a model school in the city and is also one of the SMoE parastatals. Lastly, although some schools are referred to as LGA schools and others as UBE schools, there is no difference in their respective quality or organization; rather,
20
the labels refer to when the school was established, as UBE schools were created after the introduction of Universal Basic Education. Several educational indicators have been used to assess the current primary school situation in Kaduna City. The overall gross intake rate (GIR), or percentage of eligible children entering primary schooling at grade 1, is approximately 94 percent for boys and 106 percent for girls, or 99 percent combined. The total gross enrolment ratio, including public and private primary schools, is 113 percent. Public primary schools currently have a GER of 67 percent for boys and 62 percent for girls. The total enrolment for public institutions is 115,752 pupils. Private schools have a GER of 53 percent for boys and 44 percent for girls, with 87,207 students enrolled in 2006. Figure 3 below shows a summary of the total public school enrolment figures from 1998 to 2007. According to the SUBEB Department of Planning, Research and Statistics (PRS), the drop in enrolment in 2001 can be attributed to communal disturbances that forced people to leave the state and travel to their family homes. Since that time, Kaduna State has experienced other violent outbreaks spurred on by ethnic and/or religious discord.11 No explanation, however, was provided for the drop in enrolment figures in 2005. Figure 3: Public Primary School Enrolment (1998-2007)
Source: SUBEB, General Statistics Projection.
The Education Sector Analysis, produced in conjunction with the DFID/World Bank Capacity for Universal Basic Education (CUBE) program, found results similar to those of this study. Table 1 below shows the primary indicators for the 2005/2006 school year. The severe
11 In 2002 a riot preceded the Miss World pageant in Abuja, after an article in a Lagos newspaper offended Kaduna Muslims. (The article stated that, if the Prophet Muhammad were to watch the beauty pageant, he would end up marrying one of its contestants.)
Public School Enrolment Summary 1998-2007
0
10000
20000
30000
40000
50000
60000
70000
80000
1998 1999 2000 2001 2002 2003 2004 2005 2006 2007
ChikunKaduna NorthKaduna South
21
difference between gross enrolment and gross intake ratios for Kaduna South LGA and the other two LGAs is a serious concern. The demographics in Kaduna South are more similar to those in Kaduna North than to those in Chikun, but there is still a significant difference in educational provision.
Table 1: Public and Private Primary Indicators (2005/2006)
Number of Schools Enrolments Enrolment Ratios
LGA Public Private Total Public Private Total GIR GER
Chikun 228 104 332 44,778 13,201 57,979 99 86.3
Kaduna N 44 153 197 40,583 26,645 67,228 99.9 100.4
Kaduna S 30 93 123 32,140 16,783 48,923 58.8 64.7
Source: SMoE, Education Sector Analysis.
Currently no school feeding program is operating in Kaduna City primary schools. Several ministry and local government officials agree that school feeding programs would be highly beneficial for primary students and would increase student enrolment, primarily in the rural areas. It was generally agreed that school feeding programs targeting students in the urban area of Kaduna City are not a priority for the administration and should not be created, but that programs targeting students in the state’s most rural areas could help enhance student learning and attendance. Additionally, only a few programs include pro-poor subsidies or free textbooks and uniforms, despite promises from the government to provide an adequate number of textbooks and uniforms. Apparently the government is providing all of the uniforms only at particular schools, with plans to expand the program to new schools each year. One public primary headmaster interviewed for this study noted that students from particularly poor families are provided with necessary learning materials (notebooks, pencils, etc.) from the school account and are allowed to come to school without proper uniforms.12 It is unlikely that these students would be able to attend without such assistance; at this point, however, it appears that most pro-poor subsidies exist only at the local school level and are disbursed on an individual-case basis.
The indirect costs of primary education are certainly an educational constraint in Kaduna. Although there are no official fees for students attending primary school, students are expected to buy uniforms, exercise books, sandals and even a school patch at many primary schools. Additionally, as the opportunity cost of sending children to school increases, parents are more likely to keep the girls and boys at home to do housework, farm chores or other manual labor. 12 N. Nbala, personal communication, June 13, 2008.
22
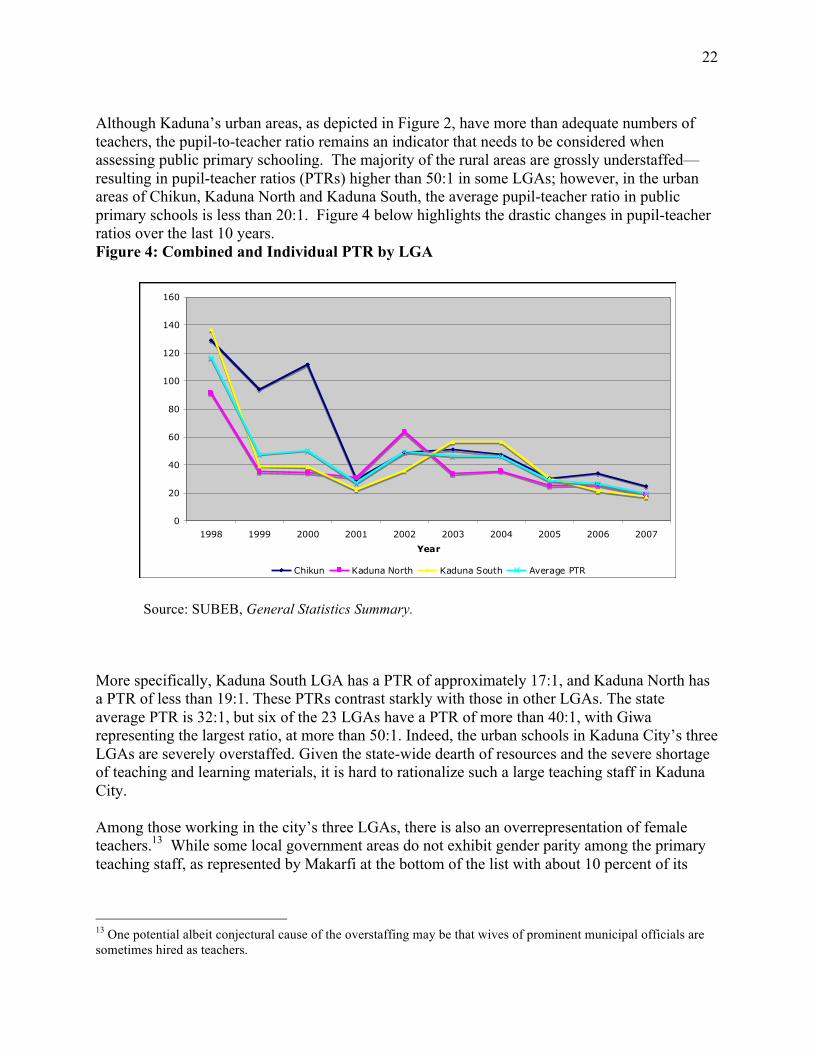
Although Kaduna’s urban areas, as depicted in Figure 2, have more than adequate numbers of teachers, the pupil-to-teacher ratio remains an indicator that needs to be considered when assessing public primary schooling. The majority of the rural areas are grossly understaffed—resulting in pupil-teacher ratios (PTRs) higher than 50:1 in some LGAs; however, in the urban areas of Chikun, Kaduna North and Kaduna South, the average pupil-teacher ratio in public primary schools is less than 20:1. Figure 4 below highlights the drastic changes in pupil-teacher ratios over the last 10 years. Figure 4: Combined and Individual PTR by LGA
Source: SUBEB, General Statistics Summary.
More specifically, Kaduna South LGA has a PTR of approximately 17:1, and Kaduna North has a PTR of less than 19:1. These PTRs contrast starkly with those in other LGAs. The state average PTR is 32:1, but six of the 23 LGAs have a PTR of more than 40:1, with Giwa representing the largest ratio, at more than 50:1. Indeed, the urban schools in Kaduna City’s three LGAs are severely overstaffed. Given the state-wide dearth of resources and the severe shortage of teaching and learning materials, it is hard to rationalize such a large teaching staff in Kaduna City.
Among those working in the city’s three LGAs, there is also an overrepresentation of female teachers.13 While some local government areas do not exhibit gender parity among the primary teaching staff, as represented by Makarfi at the bottom of the list with about 10 percent of its
13 One potential albeit conjectural cause of the overstaffing may be that wives of prominent municipal officials are sometimes hired as teachers.
staff being female, the teaching staff in Kaduna North and Kaduna South is more than 70 percent female, and Chikun is not far behind, at approximately 63 percent.
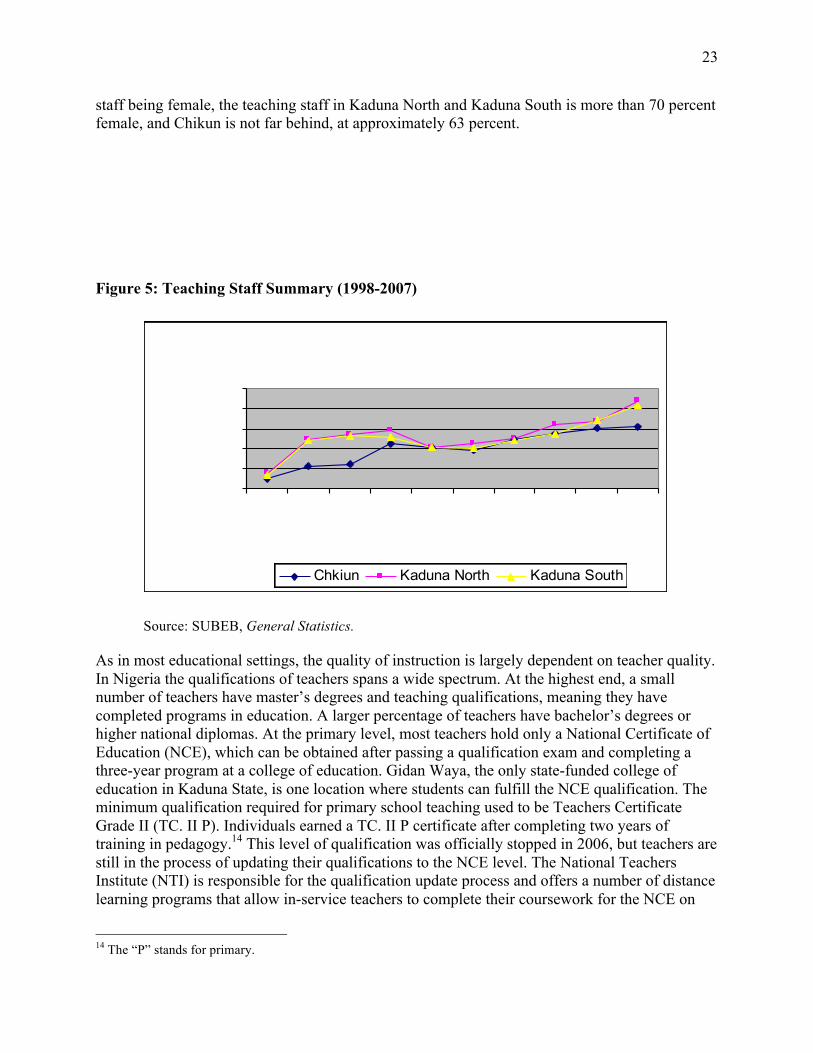
Figure 5: Teaching Staff Summary (1998-2007)
Source: SUBEB, General Statistics.
As in most educational settings, the quality of instruction is largely dependent on teacher quality. In Nigeria the qualifications of teachers spans a wide spectrum. At the highest end, a small number of teachers have master’s degrees and teaching qualifications, meaning they have completed programs in education. A larger percentage of teachers have bachelor’s degrees or higher national diplomas. At the primary level, most teachers hold only a National Certificate of Education (NCE), which can be obtained after passing a qualification exam and completing a three-year program at a college of education. Gidan Waya, the only state-funded college of education in Kaduna State, is one location where students can fulfill the NCE qualification. The minimum qualification required for primary school teaching used to be Teachers Certificate Grade II (TC. II P). Individuals earned a TC. II P certificate after completing two years of training in pedagogy.14 This level of qualification was officially stopped in 2006, but teachers are still in the process of updating their qualifications to the NCE level. The National Teachers Institute (NTI) is responsible for the qualification update process and offers a number of distance learning programs that allow in-service teachers to complete their coursework for the NCE on
14 The “P” stands for primary.
Teaching Staff Summary 1998-2007
0500
1000150020002500
1998 1999 2000 2001 2002 2003 2004 2005 2006 2007
Year
Num
ber o
f Te
ache
rs
Chkiun Kaduna North Kaduna South
24
weekends and holidays. The distance learning program can be completed in four years, while an intensive full-time program, Special Teacher Upgrading Program (STUP), can be completed in half the time.
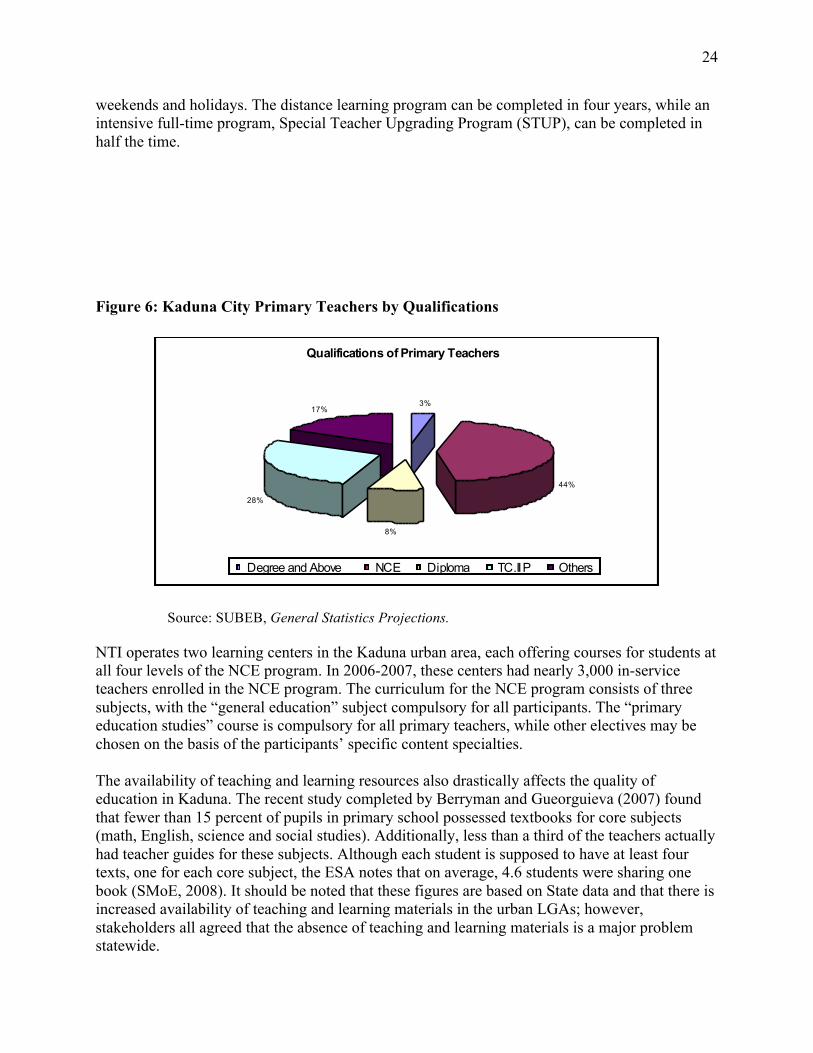
Figure 6: Kaduna City Primary Teachers by Qualifications
Source: SUBEB, General Statistics Projections.
NTI operates two learning centers in the Kaduna urban area, each offering courses for students at all four levels of the NCE program. In 2006-2007, these centers had nearly 3,000 in-service teachers enrolled in the NCE program. The curriculum for the NCE program consists of three subjects, with the “general education” subject compulsory for all participants. The “primary education studies” course is compulsory for all primary teachers, while other electives may be chosen on the basis of the participants’ specific content specialties. The availability of teaching and learning resources also drastically affects the quality of education in Kaduna. The recent study completed by Berryman and Gueorguieva (2007) found that fewer than 15 percent of pupils in primary school possessed textbooks for core subjects (math, English, science and social studies). Additionally, less than a third of the teachers actually had teacher guides for these subjects. Although each student is supposed to have at least four texts, one for each core subject, the ESA notes that on average, 4.6 students were sharing one book (SMoE, 2008). It should be noted that these figures are based on State data and that there is increased availability of teaching and learning materials in the urban LGAs; however, stakeholders all agreed that the absence of teaching and learning materials is a major problem statewide.
Qualifications of Primary Teachers
3%
44%
8%
28%
17%
Degree and Above NCE Diploma TC.II P Others
25
The number and condition of public primary school classrooms is also a concern. Currently, 1,845 classrooms are in good condition, although 678 classrooms in bad condition are also being used. Using only the classrooms in good condition for calculation purposes, the pupil-to-classroom ratio is roughly 60:1. Overpopulation, therefore, is a major problem and “does not allow for child-to-child contact.”15 The condition of classrooms is a major constraint in achieving the MDGs, as headmasters are often forced to close certain classrooms, due leaky or missing roofs or unsafe structural conditions. Additionally, many classrooms lack a sufficient number of desks, and “pupils normally take lessons sitting on the floor.”16 There are 443 toilets in the three LGAs under study, meaning that, across all three LGAs, there is an average of 261 students for every toilet. Chikun is clearly the worst in this regard, with a student-to-toilet ratio of 400:1. Figure 7: Photo of Toilet Block Constructed in 2006
Source: Author.
One school visited built its first block of functioning toilets in 2006, with the help of a grant from the World Bank. Prior to this, students had to leave their classrooms and walk across a railroad track to reach functioning toilets. As a result, students would miss half an hour or more of valuable classroom instruction time. It is evident that even lavatory conditions must improve drastically for students to experience a higher quality of primary education.
Students completing primary school sit for the “Selection Exam,” a standardized test created and facilitated by the Educational Resource Center (ERC). In addition to indirect costs and many other factors, this exam is often a major reason that students discontinue their education, 15 C. Lekwat, personal communication, June 6, 2008. 16 N. Nbala, personal communication, June 13, 2008.
26
although the exam has not been conducted recently. The ERC plans to begin testing students again during this coming year. Figure 8 represents the completion rates of primary students from 2000-2005.
Figure 8: Kaduna State Primary School Completion Rate (percent)
Source: Nigeria Education Statistics (2006).
Figure 8 also reveals the gender disparity in exam scores. Although the ratios of boys to girls may be fairly equal in primary schooling, the test results shown above highlight a gendered issue in Kaduna that is a serious concern. While there may be multiple causes for these disparities, one likely reason is the amount of time girls are expected to help out with daily chores in the kitchen and/or around the house, time that could otherwise be spent studying. Additionally, the belief that girls will not need to be educated because they will marry and not work may jeopardize the value placed on girls’ education among families (Mehrotra and Delamonica, 1998). This issue definitely deserves further consideration and research.
2.3. Secondary Education In Nigeria, as explained above, there are two levels of secondary education, junior and senior. Overall, there are 56 public and 533 private secondary schools in Kaduna City. The public school student population is 52.5 percent female, the teacher population is 57.7 percent female. The GER is 41 percent for boys and 37 percent for females in public schools, 27 percent for boys
0
10
20
30
40
50
60
70
2000 2001 2002 2003 2004 2005
Co
mp
leti
on R
ate
(%)
MaleFemale
27
and 17 percent for girls in private schools. The overall GER in 2006 for secondary school education is 61 percent, with 39 percent in public schools and 22 percent in private schools. For both junior and senior secondary schools, inspectorate divisions are responsible for monitoring the facilities, collecting information on enrolment and evaluating teachers and lessons plans. Officials at inspectorate division also decide what schools need in order to function properly (including facilities) and how they can be improved. The inspectorate divisions do not align along LGA lines; thus schools in different LGAs may be in the same inspectorate division and vice versa. For the purpose of this study, only data from the schools in the urban area of Kaduna (Kaduna North, Kaduna South, Chikun) are included. The schools in these LGAs are under the jurisdiction of four inspectorate divisions: Kaduna, Sabon Tasha, Birin Gwari and Riga Chikun. Each inspectorate division has several inspectors who are expected to execute the supervisory tasks described above and all administrative tasks that keep the schools operating smoothly. Unfortunately, inspectors are not able to monitor schools as often as they could, due to transportation issues.
Throughout secondary school, students must pass a number of standardized exams in order to continue studying. The National Exam Commission (NECO) controls and administers these exams. Students in the third year of JSS sit for the Junior School Certificate Exam (JSCE). After the second year of SSS, student must pass a “qualifying” exam in order to move to SS3. Finally, students who wish to continue their studies at the tertiary level must pass the Senior Secondary Certification Exams (SSCE). For both junior and senior secondary education, teachers with NCE certificates or additional degrees are currently considered qualified. However, this is changing: the Government hopes that NCE qualifications will eventually be only for primary teachers, whereas secondary teachers will be required to have higher qualifications, such as undergraduate or master’s degrees.
2.4. Junior Secondary Education Junior secondary school consists of three different grade levels, referred to as JS1, JS2 and JS3. Students enrolled in junior secondary school are typically between the ages of 12 and 14, although some students may be older, due to promotion failure or delays in enrolment. As previously mentioned, junior secondary school is included under Nigeria’s Universal Basic Education. However, in contrast to pre-primary and primary levels of education, junior secondary education is officially under the mandate of SMoE, rather than of SUBEB. Although the inclusion of junior secondary school under the jurisdiction of the SMoEs—despite its inclusion in UBE—may appear confusing, many junior and secondary schools share facilities. Therefore it seems sensible to keep them together under one governing body, for monitoring and administrative purposes. The 48 public junior secondary schools in Kaduna’s three urban LGAs serve more than 35,000 junior secondary students. While most children in Nigeria are within two kilometers of a primary school (FME, 2005), the inclusion of junior secondary schools into UBE has created a massive increase in demand, and, consequently, many JSS students must travel a significantly greater
28
distance to attend school, particularly in the most rural areas (UNESCO, 2008). While some junior secondary schools are single-sex, most include both boys and girls. Student enrolment at the JSS level is fairly balanced, with approximately 52 percent female. Table 2: JSS Flow rates in Kaduna State (2005-2006) Promotion Repetition Dropout M F M F M F
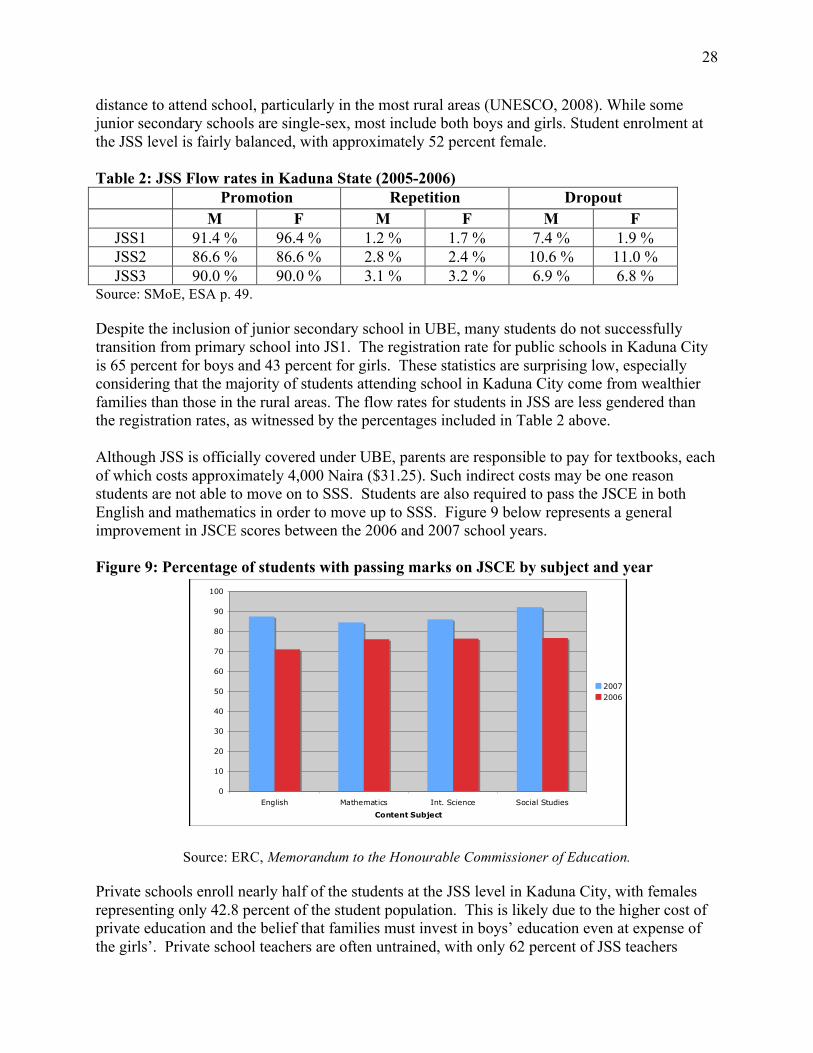
Despite the inclusion of junior secondary school in UBE, many students do not successfully transition from primary school into JS1. The registration rate for public schools in Kaduna City is 65 percent for boys and 43 percent for girls. These statistics are surprising low, especially considering that the majority of students attending school in Kaduna City come from wealthier families than those in the rural areas. The flow rates for students in JSS are less gendered than the registration rates, as witnessed by the percentages included in Table 2 above. Although JSS is officially covered under UBE, parents are responsible to pay for textbooks, each of which costs approximately 4,000 Naira ($31.25). Such indirect costs may be one reason students are not able to move on to SSS. Students are also required to pass the JSCE in both English and mathematics in order to move up to SSS. Figure 9 below represents a general improvement in JSCE scores between the 2006 and 2007 school years. Figure 9: Percentage of students with passing marks on JSCE by subject and year
Source: ERC, Memorandum to the Honourable Commissioner of Education.
Private schools enroll nearly half of the students at the JSS level in Kaduna City, with females representing only 42.8 percent of the student population. This is likely due to the higher cost of private education and the belief that families must invest in boys’ education even at expense of the girls’. Private school teachers are often untrained, with only 62 percent of JSS teachers
0
10
20
30
40
50
60
70
80
90
100
English Mathematics Int. Science Social StudiesContent Subject
Per
cen
tag
e of
Stu
den
ts t
hat
Pas
sed
20072006
29
considered qualified. The PTR for private schools is approximately 22:1, but would be 36:1 if untrained teachers are not included in the calculation.
Technical and vocational education (TVET) programs for JSS students have only been initiated in the last two years and are still in their nascent stage. These institutions were not included in this study, as they are not yet well-established, have little track record thus far and the data proved difficult to collect. Nevertheless, technical and vocational education will be a crucial educational area to support for the future development of Kaduna City. In fact, UNESCO (2004) recently began implementing a TVET program in Nigeria that aims to increase the number of secondary school students enrolled in technical trades. It would be important to expand and to increase awareness of this and other TVET programs in Kaduna.
2.5. Senior Secondary Education In 2006 Kaduna City had 21,894 students enrolled in public and 27,746 students in private senior secondary school. Clearly, private education plays a major role here. The dropout rate for secondary school is only five percent, the repetition rate only two percent (SMoE, 2008); however, in 2005, the GER for SSS was a meager 25 percent, far below the 56 percent target set by the Education Sector Plan (SMoE, 2008). Gender parity, however, is fairly positive, with 53.2 percent of the SSS student population being female. There may be several reasons for the low GER. First, as with the JSS level, there are various indirect costs of schooling at the SSS level. Students must pay for their textbooks, which can become quite costly for students taking many subjects. Additionally, as mentioned above, students must pass a standardized exam to continue their education. After the second year of secondary school, students must pass the “qualifying” exam. In 2006, 24.54 percent of those who sat for the exam passed with five or more credits, including English and mathematics, the two compulsory subjects, while 67.74 percent passed with five or more credits in any subject area. The students failing these subjects were subsequently allowed to retake the English and mathematics sections. In 2007, 40.22 percent of the students passed at credit level in five or more subjects, including English and mathematics (ERC, 2007), marking a significant increase over the test results of the previous year. At the end of senior secondary school, students wishing to continue their studies can choose to take either the West African Examination Council (WAEC) exam or the Senior Secondary Certification Examination (SSCE), which is administered by the National Examination Commission (NECO). For those students desiring to increase their educational options for further study, it is advisable to take both exams. All students must pay to take the WAEC exams, but indigenous students’ fees are waived for the NECO. In 2005, 8.74 percent of boys and 7.02 percent of girls who sat for the WAEC examination passed with a minimum of five credits (including English language and mathematics). This percentage improved significantly from 2003, when only 6.02 percent of boys and 4.76 percent of girls passed with the same number of credits.
30
It should also be noted that in the last two years, a surprisingly low number of students sat for the chemistry and physics exams, with only 20 percent of students taking them in 2006 and even fewer --18 percent for chemistry, 12 percent for physics -- in 2007 (SMoE, 2008). This may reflect the shortage of math and science teachers in secondary schools. Indeed, a recent policy document produced by Kaduna State noted that the PTR for math and physics teachers at the secondary level is 268:1 and 296:1, respectively (Kaduna State of Nigeria, 2004). There was also a drastic decrease between 2006 and 2007 in the numbers of students who sat for such technical subjects as wood-working, metal-working and technical drawing. Science and technical schools do exist at the SSS level, but there are few operating in the city itself. In fact, the Malali Technical School, operated and monitored by the Ministry of Science and Technology (MoST), is the only school for SSS students in Kaduna City. Given that Kaduna Polytechnic Institute, located just outside the city center, is a major higher education institution (HEI) in the region, it is somewhat surprising that so few science or technical schools exist for Kaduna’s secondary school students.
2.6. Tertiary and Vocational Education There are, however, a number of tertiary and vocational institutions in Kaduna. Aside from Kaduna Polytechnic, a large, federally funded and operated technical institute, the state hosts the Nigerian Defense Academy (military), Airforce Technology (military) and the School of Water Resources. The only state-funded HEI, however, is Kaduna State University (KSU), the only higher education institution included in this study. KSU was established in May 2004 and aims to be an institution specializing in the sciences, providing “all-around university education of the highest standard for the development of the individual and the State” (KSU, 2008b). In 2006, KSU had 1,497 students enrolled at the undergraduate level and 683 enrolled in sub-degree programs. The university is organized into three main departments: art; social and management science and the sciences. Currently, 41.2 percent of the student body is in the sciences department, 33.7 percent in social and management science and 24.9 percent in the art department (National Universities Commission, 2007). The ratio of academic staff to students at KSU is approximately 21:1 (KSU, 2008a). KSU currently has 63 classrooms and 15 laboratories/specialized rooms. Tuition at KSU varies depending on students’ economic capacity. For students from Kaduna State, the university offers scholarships, bursaries and tuition reimbursement. As a result, these students only pay 50 percent of the normal tuition. Indigenous students are responsible for 28,410,575 Naira ($ 236,755)per year, while non-indigenous students only pay 8,593,150 Naira ($71,609) per year.17 Clearly, there is a big tuition difference between the fees for indigenous and non-indigenous students, reflecting the potential discrimination described in the introduction to this report. KSU is also in the process of expanding and has used much of the incoming tuition to help defray the costs of new capital construction and renovation.
17 Using $1 = � 120 2008 exchange rate.
31
2.7. Non-formal and Adult Education The Kaduna Agency for Mass Literacy, a parastatal under the SMoE, is the primary body responsible for adult literacy and non-formal education programs. The adult literacy ratio is approximately 66 percent overall, with 78 percent for men and 55 percent for women (National Bureau of Statistics, 2006). Funding for the agency, which is charged with operating several statewide programs, comes directly from the SMoE, and according to the director, “financing is a big problem.”18 In 2007, there were 483 teachers and 117 supervisors employed by the agency, resulting in a 25:1 PTR. Each LGA has at least 20 learning centers, where there are three books or sets of materials per learner and one teacher guide for each teacher. The Kaduna Agency for Mass Literacy offers several programs, each with a different objective and target audience. For learners who need extra help with exam preparation or re-entry into existing education programs, the agency operates a “Remedial” program. The free “Basic Literacy” program used to be by far the most popular program offered. Ranging from six to nine months long, it offers participants a Primary Four certificate upon successful completion. All instruction is in Hausa, and classes meet three times per week for an hour. Instructors are currently paid 1,000 Naira ($8.33) per center/per month; a fivefold increase was proposed and approved in 2008, but the financing and transition are still being processed. Predictably, the low salaries paid to instructors have had a negative impact on the overall quality of instruction offered at the centers.19
Table 3: Basic Literacy Program Indicators (2006)
Total Enrolment Dropout Percentage Male Female Total % F Male Female Total Chikun 75 407 482 84 47% 39% 40%
Kaduna North 130 338 468 72 45% 35% 37%
Kaduna South 79 446 525 85 25% 51% 47%
Source: Kaduna Agency for Mass Literacy (2006)
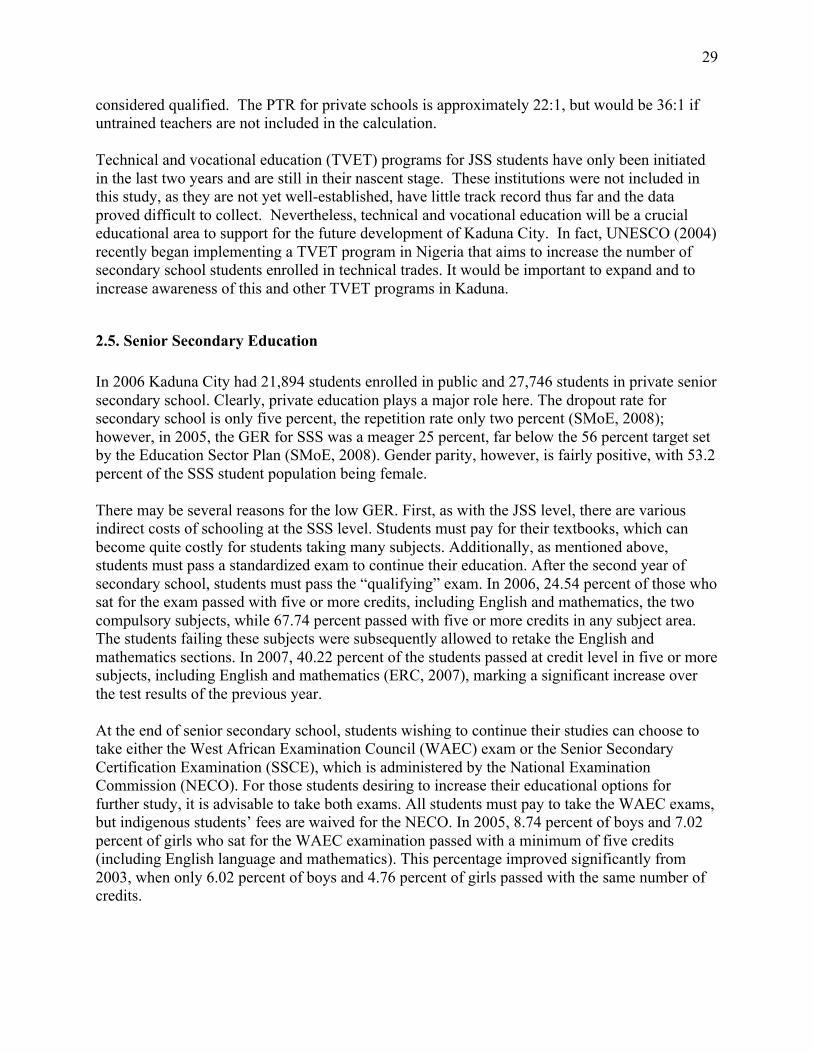
Table 3 shows the enrolment and dropout figures for 2006. Unfortunately, the Basic Literacy program experiences extremely high dropout rates, which could be directly related to the quality of instruction. In recent years the agency has been forced to reduce the quantity and quality of its services due to budget cuts. Figure 10 below represents the popularity of their programming in the early 1990s and its startling decline. Figure 10: Enrolment in Adult Literacy Classes in Kaduna, 1990-2007
18 M. M’Azu, personal communication, May 21, 2008. 19 M, M’Azu, personal communication, May 21, 2008.
32
Source: Kaduna Agency for Mass Literacy (2006) The Kaduna Agency for Mass Literacy also offers “Post-Literacy,” “Continuing Education” and “Advancement” programs. These programs charge fees to participants and cover topics (English, mathematics, general knowledge, computers, etc.) in greater detail and at a higher cognitive level. Additionally, the Agency offers a program specifically targeting women. Held at “Functional Women’s Centers,” this course provides women with the opportunity to develop vocational skills such as sewing, vaseline-making and tie-dye, in addition to English language skills. This program is still being pilot-tested, and there is only one center in each LGA, because of the start-up and equipment costs involved.
2.8. HIV/AIDS Education Fortunately, Nigeria has maintained a rather low HIV/AIDS infection rate in recent years. The national prevalence rate is 3.1 percent (UNAIDS, 2008), and according to the Kaduna State Action Committee Against AIDS (SACA), the prevalence rate for the state is 5.6 percent, for the city, approximately seven percent.20 HIV/AIDS prevention and awareness education are topics that are supposed to be integrated as a unit in health classes. One headmaster, however, noted that many parents complained about the HIV/AIDS education, for fear that “the information may mislead the children” and that, as a result, they would buy condoms and use them indiscriminately. 21 Consequently, this school no longer teaches HIV/AIDS education or family planning. The SMoE also operates agencies concerned with HIV/AIDS. The Ministry of Education houses an “HIV/AIDS Desk” that trains 60 teachers per year in methods of integrating HIV/AIDS education in an interdisciplinary manner. Additionally, the Desk distributes poster campaigns and ensures that every JSS institution has at least one HIV awareness club. Kaduna State also 20 W. Gim, personal communication, June 10, 2008. 21 Headmaster, personal communication, June 13, 2008.
0
10000
20000
30000
40000
50000
60000
70000
1990 1993 1997 2007
Number of ClassesMale EnrolmentFemale Enrolment
33
relies on SACA to coordinate statewide HIV/AIDS programs and activities. This organization is still fairly new, and its coordination to date has been somewhat haphazard. Although these services are active and in place, it is evident that the Government could make a more concerted attempt to coordinate their efforts.
III. FINANCING OF EDUCATION This section of the needs assessment seeks to identify some of the financial constraints to achieving the education MDGs in Kaduna City. The first section contains an explanation of the state’s current financial situation as regards education; the second examines the unit costs for various educational services, and the third section explores three scenarios created using UNESCO’s Education Policy and Strategy Simulation.
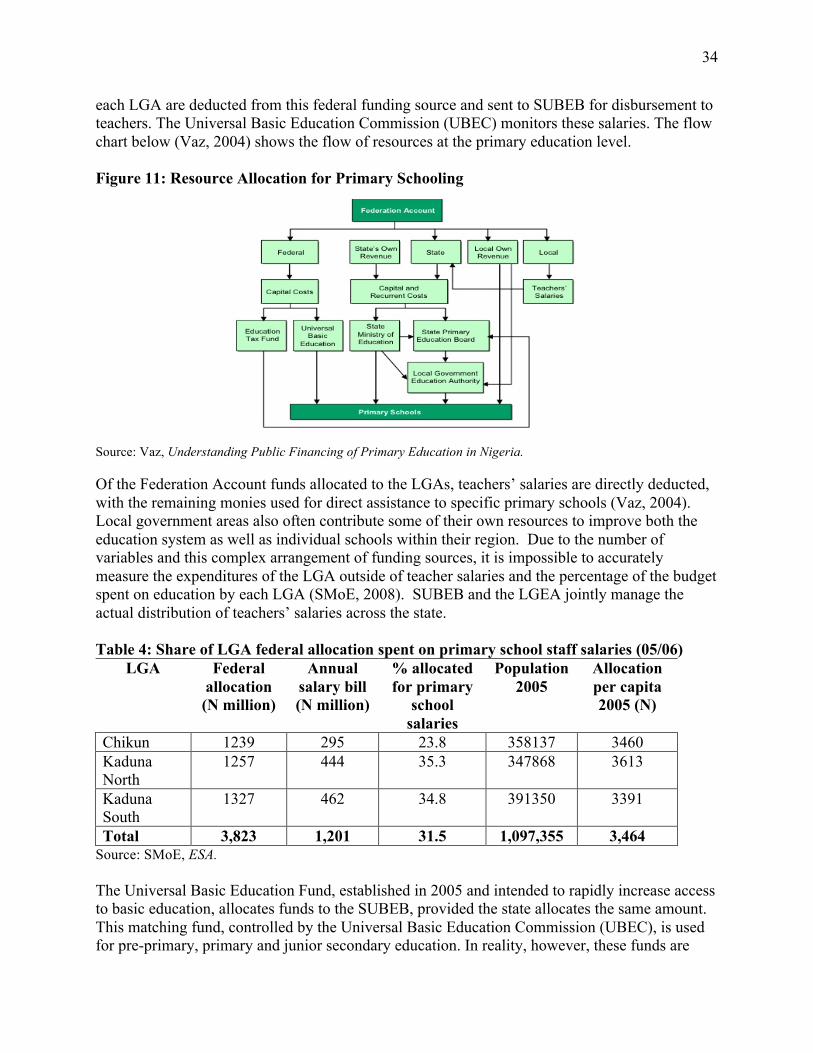
3.1. Financial Situation in Kaduna The system established to finance education in Nigeria is as complex as it is difficult to understand. Official policies and documents describe an intended division of funding according to education level and the type of institution. 22 The federal government is supposed to be solely responsible for tertiary education, whereas the Universal Basic Education (UBE) Intervention Fund is intended for pre-primary, primary and junior secondary education. In reality, however, there appears to be a high degree of both overlap between and ignorance of each branch’s specific role. Indeed, the ESA report noted that, “the mechanisms that have been found to distribute this concurrent responsibility have resulted in one of the most complex financing systems in the world,” and “it is impossible to capture the global picture of education finance.”23 One study even noted that, “There is no accurate comprehensive information on total public spending on education in Nigeria.”24 A variety of funding sources combine to help fund education in Kaduna State. The Federation Account is a national-level funding source that distributes funds vertically to the federal, state and local government areas. Once distributed, the funds are then apportioned horizontally across the 36 states and 774 local governments, using a multi-faceted equation that considers population, land mass and other variables (SMoE, 2008). Capital expenditures, including classrooms and textbooks, are taken from the federal and state government shares of the Federation Account. The state is responsible for recurrent costs, such as maintaining SUBEB, the LGEAs and primary schools. The state is funded by a number of sources: the Federation Account, which in 2006 contributed 26 percent of state income, internally generated revenue; value-added taxes, and other miscellaneous sources. The state is responsible for funding all administrative offices, as well as the secondary schools. The Federal Account, a national-level funding pool, allocates money to each LGA through a complex formula. Salaries of teachers and non-teaching staff for 22 See Abubakar and Bennell, 2007. 23 SMoE, 2008, pp. 27-28. 24 Ibid.
34
each LGA are deducted from this federal funding source and sent to SUBEB for disbursement to teachers. The Universal Basic Education Commission (UBEC) monitors these salaries. The flow chart below (Vaz, 2004) shows the flow of resources at the primary education level. Figure 11: Resource Allocation for Primary Schooling
Source: Vaz, Understanding Public Financing of Primary Education in Nigeria.
Of the Federation Account funds allocated to the LGAs, teachers’ salaries are directly deducted, with the remaining monies used for direct assistance to specific primary schools (Vaz, 2004). Local government areas also often contribute some of their own resources to improve both the education system as well as individual schools within their region. Due to the number of variables and this complex arrangement of funding sources, it is impossible to accurately measure the expenditures of the LGA outside of teacher salaries and the percentage of the budget spent on education by each LGA (SMoE, 2008). SUBEB and the LGEA jointly manage the actual distribution of teachers’ salaries across the state. Table 4: Share of LGA federal allocation spent on primary school staff salaries (05/06)
LGA Federal allocation (N million)
Annual salary bill (N million)
% allocated for primary
school salaries
Population 2005
Allocation per capita 2005 (N)
Chikun 1239 295 23.8 358137 3460 Kaduna North
1257 444 35.3 347868 3613
Kaduna South
1327 462 34.8 391350 3391
Total 3,823 1,201 31.5 1,097,355 3,464 Source: SMoE, ESA. The Universal Basic Education Fund, established in 2005 and intended to rapidly increase access to basic education, allocates funds to the SUBEB, provided the state allocates the same amount. This matching fund, controlled by the Universal Basic Education Commission (UBEC), is used for pre-primary, primary and junior secondary education. In reality, however, these funds are
35
often not disbursed on time, due to processing delays of quarterly action plans by the states, unacceptable fund usage and delays in the appropriation and/or release of state matching funds (SMoE, 2008). The Education Trust Fund (ETF) also assists with capital expenditures for all levels of education, but 50 percent of its resources are spent on higher education. Additionally, secondary and tertiary institutions use internally generated revenue (IGR) to help defray school costs. In 2001, secondary schools generated 4.5 percent of recurrent expenditures through IGR and more than 20 percent in 2005 (SMoE, 2008).25 Typically secondary schools give 20 percent of IGR to the local division and keep the remaining funds for internal school functions. The percentage of statewide expenditure on each education sub-sector has oscillated over the years. Figure 12 below, formulated on the basis of State Ministry documents, shows the portion spent on each sub-sector for the years 2001-2006 (SMoE, 2008). Over 90 percent of resources allocated to primary education were used to cover teaching and staff costs. Spending on such other needs as teaching/learning materials and facilities remains minimal, and some schools have resorted to contributions from family and community members (SMoE, 2008). According to one of the SUBEB directors, students annually contribute between 4,000 to 5,000 Naira ($33.33-41.67) for various indirect costs and fees. The total amount contributed by parents or community members, however, is difficult to estimate. Figure 12: Distribution of Kaduna State Education Expenditure Across Levels
Source: SMOE, ESA.
The Education Sector Analysis (ESA) completed by SMoE and DFID noted several issues in the financing of education within Kaduna State and offered several recommendations relating directly to the educational environment in the municipality of Kaduna (SMoE, 2008). First, the ESA recommends an increase in state education expenditure -- in particular, predictable,
25 The Federal Government finances most local public sector services from oil revenues. Local governments’ internally generated revenue (IGR) sources consist of taxes, rates, fines, fees and licenses.
0%
20%
40%
60%
80%
100%
2001 2002 2003 2004 2005 2006
Year
Percentage of State Expenditure
Primary Secondary Higher Other
36
sustainable and accountable funding for all levels of education. According to discussions with financial personnel in the ministry, the education budget is scheduled to increase, and Governor Arc. Mohammed Namabi Sambo himself is committed to improving education: during a recent speech he remarked that his administration “is convinced that the only way of promoting peace and development is by providing qualitative education to the youth and children" (Vanguard, 29 December 2008). Addressing the State House Assembly on 3 February 2009, the governor affirmed that 27 percent of the 2009 budget will be allocated to the education sector, an increase of nearly nine percent over the 2007 budget. His commitment to improve funding was also demonstrated by the “Think Tank” committee, created to reform education in Kaduna State. In recent years, the percentage of the total state budget allocated for education has risen, as represented by the graph in Figure 13.
Figure 13: Percentage of Total State Budget Spent on Education
Source: Kaduna SMoE, Office of Finance and Accounts.
The ESA also recommends that the state concentrate on better teacher management. This recommendation is particularly apt for the urban areas of Kaduna, where the PTR is so low. These urban schools are overpopulated with teachers, even as some rural schools struggle to fill teaching positions. Furthermore, the ESA proposes establishing a benchmark for minimum spending on material costs such as textbooks, to upgrade teaching and learning conditions, and that facilities be better maintained, to improve the quality of classrooms, laboratories, latrines and administrative offices. Regarding the funding priorities, the ESA suggests that LGA budgets be closely investigated to monitor the percentages accorded to teachers’ salaries. This suggestion was made in response to the common critique that some LGAs have been recruiting
Percentage of Total State Budget Spent on Education
02468101214161820
1999 2000 2001 2002 2003 2004 2005 2006 2007
37
inexperienced and untrained teachers to save costs.26 Finally, the ESA questions the high percentage of the state budget spent on tertiary institutions. Constitutionally, higher education is the responsibility of the federal government; therefore, it seems that those funds allocated to tertiary institutions could be better utilized to address needs at the primary and/or secondary levels of education.
3.2. Unit Costs This study uses ESA unit costs27 to estimate the amount of money spent at various levels of education. These unit costs also inform recommendations for future educational policies and investments. One interesting thing to note about the unit costs is the drastic difference between those at the pre-primary/primary levels and those at KSU. Table 5 offers a chart of the unit costs used in the model. Table 5: Unit Costs (in Naira) at all levels of Education in Kaduna State
Recurrent Costs Pre-Primary Primary JSS SSS KSU Teachers (Wage, etc.) Qualified 166,000 166,000 270,000 270,000 150,000 Unqualified 120,000 120,000 200,000 200,000 Other staff costs Head Teachers/Principals/Snr. Staff 420,000 476,000 476,000 1,252,000 Support Personal/Jnr. Staff 129,000 129,000 129,000 3,500,000 Other non-teaching staff 78,000 78,000 78,000 Teacher/learning material Textbooks 560 560 560 560 Teaching Guides 560 560 560 560 Other running costs Training & staff development 5% 5% 5% 5% 5% School feeding (per pupil) 3,800 3,800 3,800 3,800 Other support, per pupil 200 200 200 200 125,000 Other support, per class 7,000 7,000 7,000 7,000 1,276,120 Constructions & other investments New constructions 1,538,000 1,538,000 1,538,000 1,538,000 4,812,800 New equipment (incl. furniture) 202,000 202,000 202,000 202,000 615,000 Renovation and maintenance 25,000 25,000 25,000 25,000 1,005,840
Source: SMoE, ESA, p. 77.
3.3. EPSSim Scenarios
26 Statement by Ms. Aishatu Saidu Song, National Teachers’ Institute (NTI), Nigeria at a 2006 education forum in Kenya. 27 That is, those provided by the SMoE Education Sector Analysis.
38
Three scenarios have been created for this needs assessment. The first is a baseline scenario, using 2006 as the baseline year. This scenario draws on current information and policy targets to predict the future of Kaduna’s education system and to estimate the cost of reaching the MDG target of universal primary education by 2015. The second scenario is a fast-track scenario that represents what is needed to achieve the Goals by 2013, rather than 2015. The third scenario is an efficiency scenario that lowers the total number of teachers as well as the student repetition rate. In the baseline and fast-track scenarios, promotion rates are kept at 94 percent for all levels, and the repetition rate is kept constant, at five percent. These figures represent the targets set by the Education Sector Analysis. In the efficiency scenario, however, the promotion rates are boosted to 99 percent, and the repetition rates are lowered to one percent. This change alleviates educational wastage, a major cost to Government. Figure 14 shows the number of primary school teachers used in each scenario. The sharp drop in teacher employment highlights the objective of limiting the number of teachers, which of course would significantly reduce the cost of education.
Figure 14: Number of Primary Teachers in Kaduna City (2006-2017)
Source: EPSSim Model.
While each scenario represents a slightly different educational outcome over the next decade, the actual cost to Government is not drastically different. Table 6 represents the costs (in Naira) of each simulation.
Although there is little variation in the costs of these scenarios, the recurrent costs reveal larger differences. As depicted below in Figure 15, the recurrent costs at all levels of education are similar under the Baseline and Efficiency scenarios, but much higher for the Fast-Track Scenario.
Figure 15: Recurrent Costs for All Levels of Education in Kaduna City (2006-2017)
Source: EPSSim Model.
In addition to the scenarios created for this assessment, the ESA produced by DFID and the SMoE used EPSSim and generated a number of scenarios. The “optimum scenario” provided in the ESA may be the best option for the Government to pursue. Like the efficiency scenario offered above, this scenario improves the overall efficiency of the educational system by raising survival rates and lowering wastage. Additionally, the coefficient of efficiency, an indicator that summarizes the repetition and dropout consequences, is significantly lower in the optimum scenario. (See Table 7, below.)
Table 7: Internal efficiencies between current situation and proposed optimum scenario
Internal efficiency indicators (05/06)
Internal efficiency indicators (2015/2016)
Wastage Ratio 1.51 1.10 Coefficient of Efficiency 0.66 0.91 Survival Rates To Grade 2 93.3 percent 98.9 percent To Grade 3 88.6 percent 97.9 percent To Grade 4 81.8 percent 96.8 percent To Grade 5 72.2 percent 95.6 percent To Grade 6 64.1 percent 94.5 percent
Source: SMoE, ESA, p. 82.
This scenario also improves the registration rates at all levels and increases teachers’ salaries. It further allows for a 15-percent increase in funding to non-formal education, thus improving the gender gap in the literacy rate (SMoE, 2008). This scenario has already been disseminated among Ministry officials and is currently being reviewed for possible incorporation into future educational policy.
IV. CONCLUSION AND RECOMMENDATIONS
The SMoE is in the process of completing a Consolidated State Education Sector Plan (C-SESP) as part of a grant from the World Bank. This plan will combine the objectives and targets established in the government is Think Tank Roadmap, Kaduna State Economic Empowerment and Development Strategy (KADSEEDS), Education Sector Plan (ESP), Blueprint, and Education Sector Analysis. There are several main objectives of the C-SESP:
• Improve the relevance and quality of education • Expand basic coverage, specifically for disadvantaged children • Increase Non-Formal Education (NFE) • Strengthen governance and monitoring capacity28
Hopefully, this new sector plan will consolidate the multitude of overlapping and sometimes contradictory policies and targets used by Kaduna State in the past and can chart a clear way forward. With regards to educational finance, it is clear that teacher salaries are a major problem. Many teachers are distracted from their regular teaching duties because they are busy trying to earn money from private tutoring. Asked whether the quality of instruction might improve if teacher salaries could be increased, one headmaster noted, “If this is tackled, you will see how education will pick up.” While this research was being conducted, the National Union of Teachers (NUT) began a strike for higher salaries. (Ochayi, 2008). They demanded the implementation of the
28 E. Myahwegi, personal communication, May 29, 2008.
41
National Teacher Salary Scale and were backed by the Nigeria Labor Congress and other civil society organizations. At the same time, it is clear that there are too many teachers, particularly at the primary level. The extremely low pupil-teacher ratios represent money the Government is wasting. For Kaduna City, it may be beneficial to keep fewer teachers on the payroll, but to pay those teachers better. The Government may also wish to consider investing in science and mathematics by hiring more teachers in those disciplines at the secondary level. In any event, under current circumstances, as noted by Abubakar and Bennel, the “deployment and workload of teachers are neither efficient nor equitable.”29 Gender disparities in Kaduna City are not overwhelming. As many of the GER figures noted throughout this assessment highlight, many girls have access to school. The gender disparities do become more apparent as one moves up the educational system, as evidenced by higher GERs in secondary than in primary school. Additionally, the SMoE should examine gender differences in exam results. It may be possible to reduce some of the gender gaps in education by researching subject stereotyping and developing programs that encourage girls to study mathematics, sciences and other technical subjects.
The Government should also carefully consider the quality of education in Kaduna City, where State results indicate that many students are not passing the standardized exams. As more and more students enter the school system, maintaining the quality of education will be increasingly difficult. The issue of educational quality is also closely linked to teachers’ qualification levels. It would be advantageous for the Government to move aggressively to update all of the teachers’ qualifications to at least NCE. This will help to raise quality, popularity and value of education in Kaduna City. The SMoE also needs to update the schools and resources at schools in Kaduna. Latrines, classrooms and staff rooms need to be built or renovated as the school population increases. The quantities of books and teacher guides present in the classroom need to increase drastically. Additionally, students should be provided with uniforms and basic learning materials in order to reduce the indirect costs of education. These interventions will almost certainly increase access and quality at the same time. In conclusion, the Optimum Scenario reported in the ESA and currently being explored by the Ministry of Education may be the best option for Kaduna City for the next decade. Achieving universal primary education and gender parity is a worthy yet challenging task. Hopefully, the guidance provided by the forthcoming C-SESP will help Kaduna achieve these goals on schedule, possibly even earlier than 2015. Furthermore, Governor Sambo’s commitment to raising to 27 percent of state government expenditure the amount allocated to education is a good sign that things are moving in a positive direction for Kaduna. It is hoped that the realization of this commitment, combined with a number of small adjustments such as those proposed here, will help improve significantly the quality and impact of education in Kaduna City.
29 Abubakar and Bennel, 2007, p. xii.
42
REFERENCES Abubakar, H. and Bennell, P. (2007). “Kaduna state education public expenditure review,”
(Kaduna: DFID). Kaduna State Agency for Mass Literacy (2006). NFE Enrolment and Number of Facilitators,
(Kaduna: State Agency for Mass Literacy) CIA (19 February 2009). The World Factbook, Nigeria
https://www.cia.gov/library/publications/the-world-factbook/geos/ni.html Educational Resource Center [ERC] (2006). Memorandum to the Honourable Commissioner of
Education on the 2007 Qualifying Examination (Q/E). Educational Resource Center [ERC] (2007). Memorandum to the Honourable Commissioner of
Education on the 2007 Qualifying Examination (Q/E). Federal Ministry of Education (2005). Education Sector Analysis. (Abuja: Ministry of
Education) Federal Ministry of Education (2007). “Statistics of Nigeria: 1999-2005” in M. J. Shuaibu and
B.K. Ismail, eds., (Abuja: Statistics and NEMIS Branch). Federal Republic of Nigeria. (2006). 2006 Census. www.nigeriastat.gov.ng International Monetary Fund (IMF). (2008). Nigeria Needs Sustained Reforms to Build on
Success. 8 February 2008. http://www.imf.org/external/pubs/ft/survey/so/2008/CAR021508A.htm
Hardman, F., Abd-Kadir, J., and Smith, F. (2008). “Pedagogical renewal: Improving the quality
of classroom interaction in Nigerian primary schools,” International Journal of Educational Development, 28, pp. 55-69.
Human Rights Watch (2006). Government Discrimination Against Non-Indigenes. May 26,
2008, http://hrw.org/reports/2006/nigeria0406/5.htm Human Rights Watch (2003a). Background. 26 May 2008.
http://www.hrw.org/reports/2003/nigeria0703/2.htm Human Rights Watch (2003b). The November 2002 Riots. 26 May 2008.
http://www.hrw.org/reports/2003/nigeria0703/3.htm Kaduna State of Nigeria (2004). Kaduna State Economic Empowerment and Development
Strategy.
43
Kaduna State University (2008a). Higher Education. 14 January 2009.http://www.kasuportal.net/ Kaduna State University (2008b). Home Page. 14 January 2009. http://www.kasuportal.net/ Maier, K. (2000). “Northern exposure: Northern Nigerian states adopt Sharia,” The New
Republic (223) 7. Mehrotra, S. and Delamonica, E. (1998). “Household costs and public expenditure on education
in five low income countries: A comparative analysis,” International Journal of Educational Development, 18(1), pp. 41-61.
National Bureau of Statistics (2006). CWIQ Survey, Kaduna State Summary. (Abuja: National
Bureau of Statistics). National Universities Commission (2007). Student Enrolment by Faculty/Department, Sex and
Courses (Abuja: National Universities Commission). Ochayi, C. (2008). “NUT resumes strike tomorrow.” Retrieved on 30 April 2009.
http://www.vanguardngr.com/content/view/11312/ State Universal Basic Education Board [SUBEB] (2007). General Statistic Projections.
Electronic File. UNAIDS (2008). Epidemiological Fact Sheet on HIV and AIDS: Nigeria, 2008. Retrieved on 2
February 2009. http://www.who.int/globalatlas/predefinedReports/EFS2008/full/EFS2008_NG.pdf
UNESCO (2004). “Revitalizing TVET in Nigeria,” (Paris: UNESCO). Retrieved on 12 February
UNESCO (2008). EFA GMR 2008 Nigeria Country Study (Paris: UNESCO). UNDP (2007). Human Development Report (New York: UNDP) Retrieved on May 26, 2008.
http://hdrstats.undp.org/countries/country_fact_sheets/cty_fs_NGA.html UNDP (2008a). 2008 Statistical Update: Human Development Index, Nigeria, 2006. February
12, 2009 http://hdrstats.undp.org/2008/countries/country_fact_sheets/cty_fs_NGA.html UNDP (2008b). Millennium Development Goals. 15 August 2008.
http://www.undp.org/mdg/goal2.shtml United States Department of State (2002). 2002 Report on International Religious Freedom.
(Washington D.C.: US Department of State). Retrieved on 19 February 2009. http://www.state.gov/g/drl/rls/irf/2002/14073.htm
44
United States Department of State. (2008). 2008 Report on International Religious Freedom. (Washington D.C.: US Department of State). Online. UNHCR Refworld, available at: http://www.unhcr.org/refworld/docid/48d5cbb953.html
State Ministry of Education [SMoE] (2008). Education Sector Analysis. (Kaduna: Kaduna State
Government). IMF (2008). Nigeria Needs Sustained Reforms to Build on Success, 8 February 2008.
http://www.imf.org/external/pubs/ft/survey/so/2008/CAR021508A.htm Human Rights Watch (2006), Government Discrimination Against Non-Indigenes, taken from
http://hrw.org/reports/2006/nigeria0406/5.htm Stratfor. (27 January 2009). “The financial crisis in Nigeria.” 12 February 2009.
http://www.stratfor.com/analysis/20090126_financial_crisis_nigeria Vanguard. (29 December 2008). “Nigeria: Kaduna gives education lion share in 2009 budget.”
AllAfrica.com. Retrieved on 17 February 2009. http://allafrica.com/stories/200812290153.html
Vaz, P. (2004). “Understanding primary financing of primary education in Nigeria,”
(Washington DC: RTI International). World Bank (2008). Nigeria Country Brief. 17 February 2009.
[email protected] Kaduna State Ministry of Education (SMoE) 3. Abdu Gambo (Director, Schools) – 08037011400 4. Christina Lekwat (Director, Inspectorate) - 08035856089 5. Abubakar Tanko (Director, Educational Resource Center) - 08034535904 6. N.B. Bin (Deputy Director, Educational Resource Center) - 08023583981 7. Jonathon Achi (Officer, HIV/AIDS Desk) - 07082488446 8. Kenneth Anaredo (Principal Planning Officer, Technical Education Board) – 08055945547 Kaduna State University (KSU) 9. E.M. Abdulrahman (Vice Chancellor) - 08036075522 10. Ibrahim Kubau (Director, Academic Affairs) – 08080338399; [email protected] Kaduna State Universal Basic Education Board (SUBEB) 11. Monde Be Madiki (Deputy Director, Physical Planning & Monitoring) – 08037864676;
08023615638; 08023379995 12. Audu B. Musa (Principal Education Officer, Statistics) - 08023634840 13. Naason Nbala (Headmaster, Railway Quarters Primary School) - 08036464578 14. Lawal Tanko (Chief Store Officer) - 08037876706 Department for International Development (DFID) 15. Steven Bradley (Kaduna State Team Leader, CUBE Project) - 07030690066
United Nations Development Programme (UNDP) / Millennium Villages Project (MVP) 16. Dr. Bala Yunusa (Project Officer, MVP) - +2348033497441 (bala,[email protected]) 17. Elisha Tunua (Project Accountant, MVP) – 08035910336