McIDAS-V: An open source data analysis and visualization tool for multi- and hyperspectral satellite data ITSC-XVI, Angra do Reis, Brazil, 7 May 2008 Tom Achtor , Tom Rink, Tom Whittaker, Dave Parker, Gail Dengel, Jon Beavers, Jessica Staude, Becky Schaffer, Ray Garcia, Bruce Flynn, Dee Wade Space Science & Engineering Center (SSEC) at the University of Wisconsin - Madison
Transcript
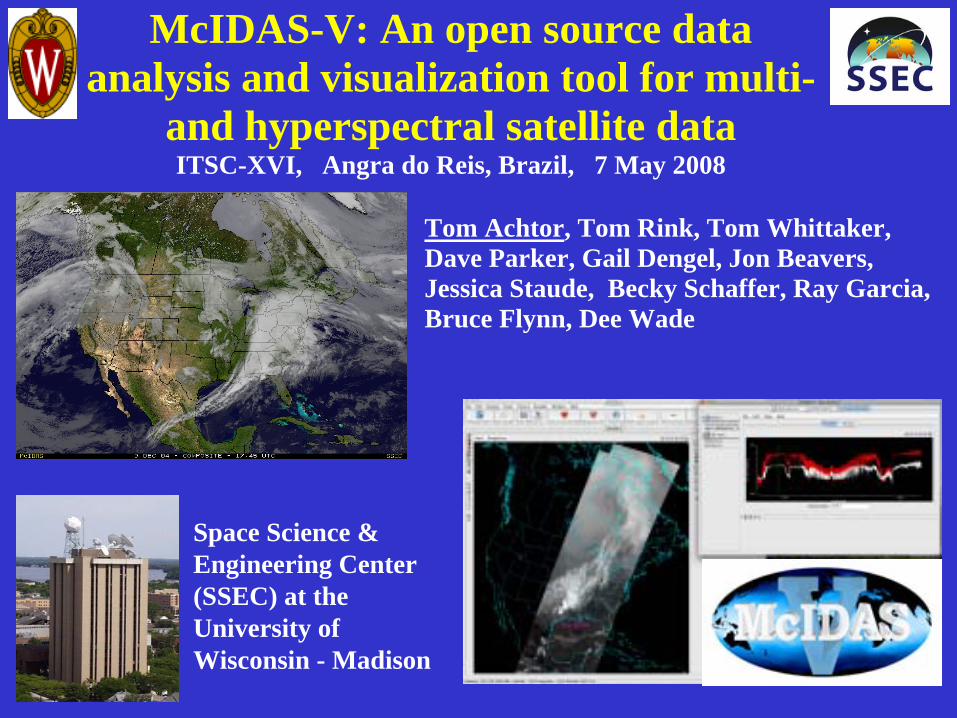
McIDAS-V: An open source data analysis and visualization tool for multi-
and hyperspectral satellite data ITSC-XVI, Angra do Reis, Brazil, 7 May 2008
Tom Achtor, Tom Rink, Tom Whittaker, Dave Parker, Gail Dengel, Jon Beavers, Jessica Staude, Becky Schaffer, Ray Garcia, Bruce Flynn, Dee Wade
Space Science & Engineering Center (SSEC) at theUniversity ofWisconsin - Madison
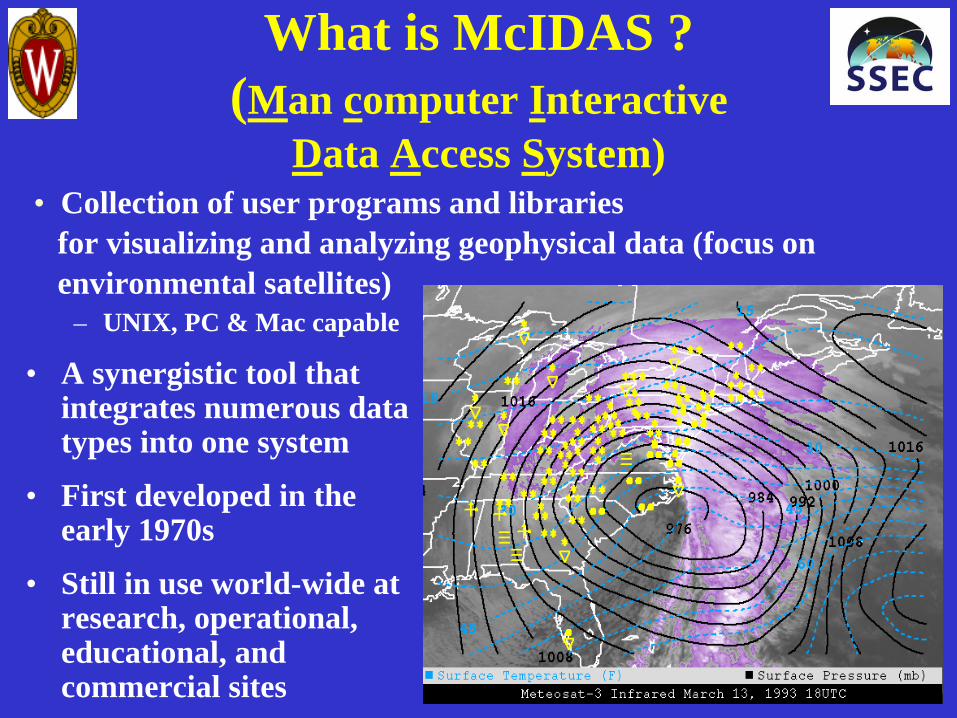
What is McIDAS ? (Man computer Interactive
Data Access System)
– UNIX, PC & Mac capable
• A synergistic tool that integrates numerous data types into one system
• First developed in the early 1970s
• Still in use world-wide at research, operational, educational, and commercial sites
• Collection of user programs and librariesfor visualizing and analyzing geophysical data (focus onenvironmental satellites)
McIDAS-X Users(MUG has about 50 members)
• NOAA – NESDIS, AWC, SPC, TPC, etc.• NASA – STS, LaRC, MSFC, JPL• Unidata – 130 universities, colleges and
international educational collaborators• International – EUMETSAT, Spain,
Greece, Mexico, Australia• Industry –Honeywell, Weathernews,
Universal Weather, Meteorlogix, Weather Central, etc.
Why the Change?• McIDAS software (written in Fortran 77 & C)
has a 30+ year heritage resulting in limited potential
• METOP, NPOESS and GOES-R operational satellite data cannot be optimally utilized– great increase in data rates– new tools for working with these large data
sets• Platform / OS dependence• New data analysis and visualization concepts are
now available (e.g. 4-D)
Presenter
Presentation Notes
Multi spectral and
McIDAS-V Requirements
• Create a powerful and versatile software system for environmental data processing, analysis and visualization
• Continue to fully support McIDAS Users’ Group (MUG) and McIDAS-X functionality as users transition to McIDAS-V
• Support existing and evolving needs of scientific research and algorithm/applications development for new programs
• Support operational users by providing frameworks in McIDAS-V, enabling a natural transition path for research results into operations
• Use system to educate students in remote sensing and physical sciences; involve students in its development, evolution and use
What is McIDAS-V
McIDAS-X VisAD + IDV + HYDRA = McIDAS-V
VisAD Developer: Bill Hibbard, UW SSEC
• Open-source, Java library for building interactive and collaborative visualization and analysis tools
• Features include:– Powerful mathematical data model that embraces
virtually any numerical data set– General display model that supports 2- and 3-D displays,
multiple data views, direct manipulation– Adapters for multiple data formats (netCDF, HDF-5,
FITS, HDF-EOS, McIDAS, Vis5D, etc.) and access to remote data servers through HTTP, FTP, DODS/OpenDAP, and OpenADDE protocols
– Metadata can be integrated into each data object
IDV-Integrated Data Viewer Developers: Unidata (Don Murray/Jeff McWhirter)
• Unidata developed, VisAD- based, scientific analysis and visualization library and toolkit
• Open Source, Java™ framework and reference application
• Provides 2- and 3-D displays of geo-scientific data (plus, of course, animations)
Why VisAD and IDV?• VisAD brings the Data Model and advanced
display capabilities• IDV is a “reference application” that provides a
framework for fetching, selecting and displaying data
• Both in Java and Open Source• Use Jython (Python running in Java) as
scripting language• Many other supporting libraries available
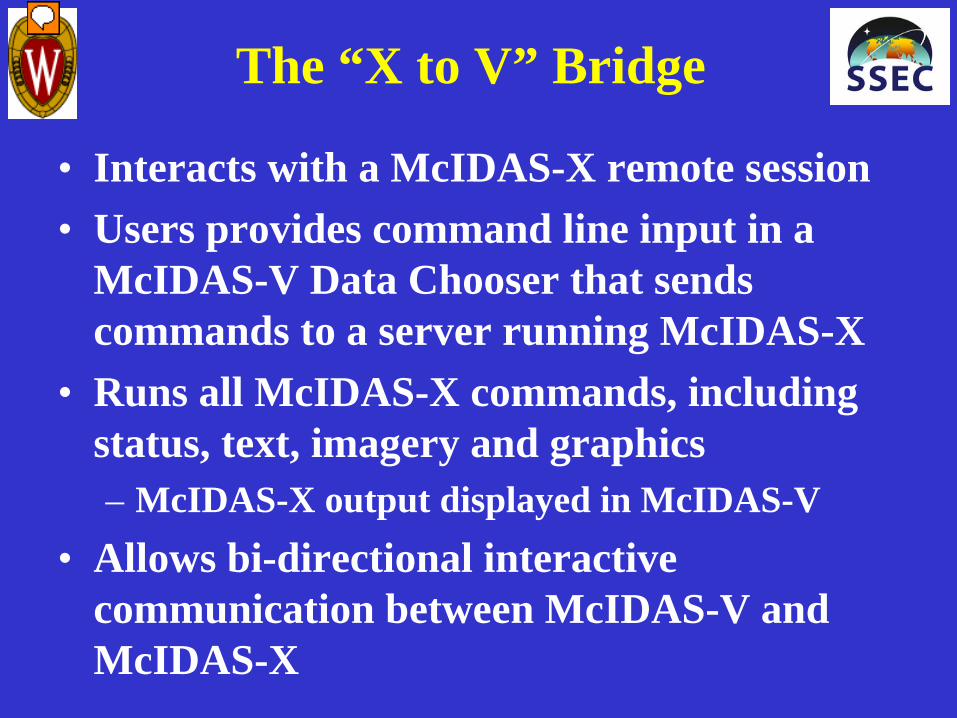
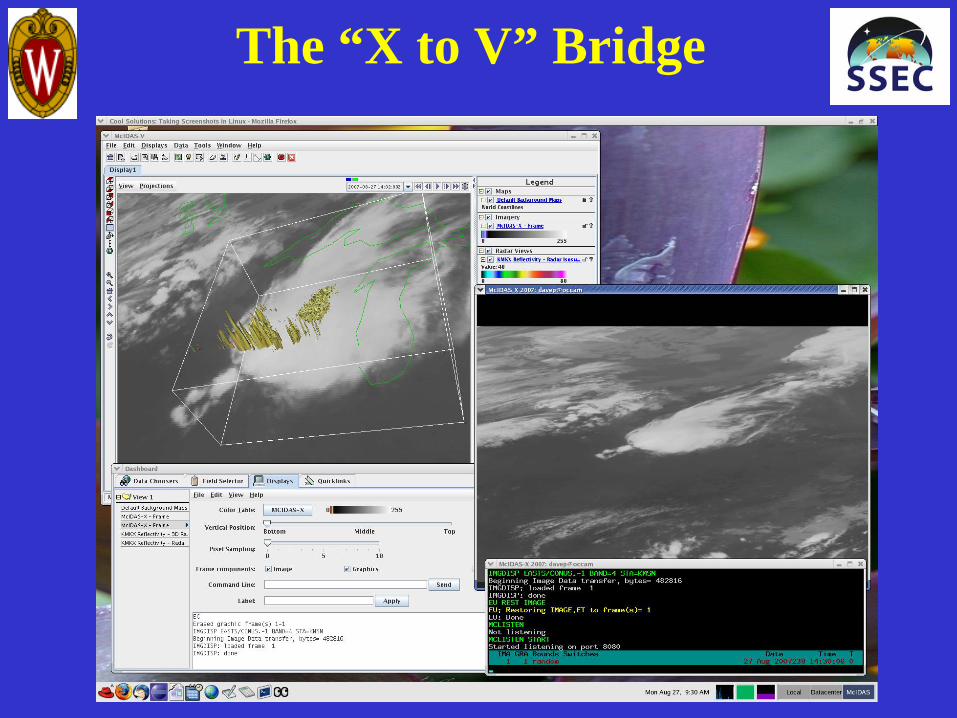
The “X to V” Bridge
• Interacts with a McIDAS-X remote session• Users provides command line input in a
McIDAS-V Data Chooser that sends commands to a server running McIDAS-X
• Runs all McIDAS-X commands, including status, text, imagery and graphics– McIDAS-X output displayed in McIDAS-V
• Allows bi-directional interactive communication between McIDAS-V and McIDAS-X
Presenter
Presentation Notes
This is the 3rd interaction on the Connector refining as we get input from the User community on how best to transition from X to V
The “X to V” Bridge
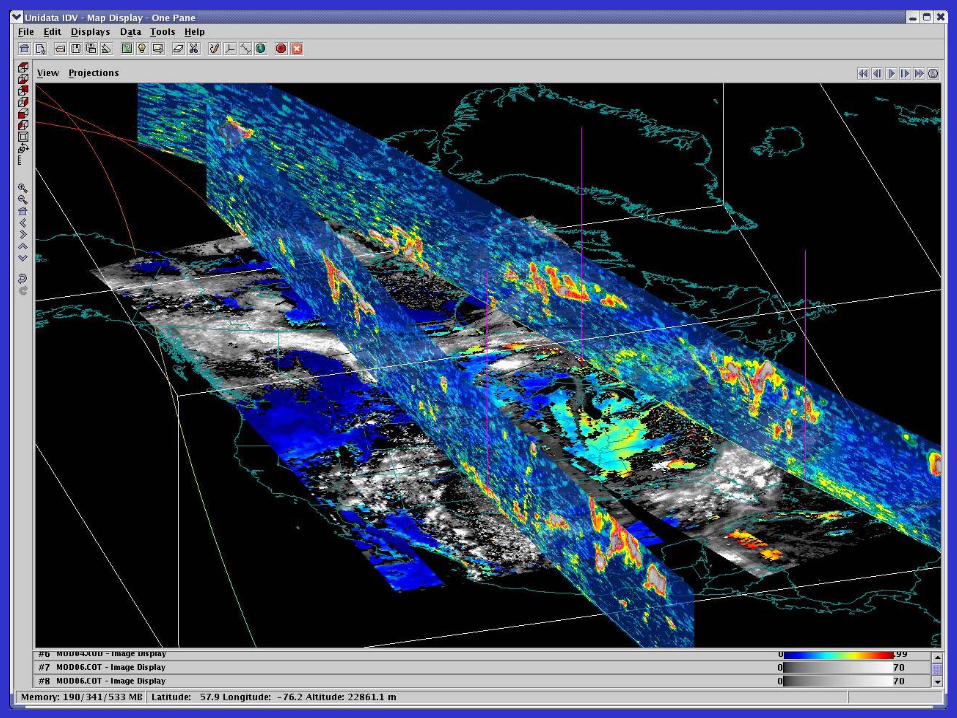
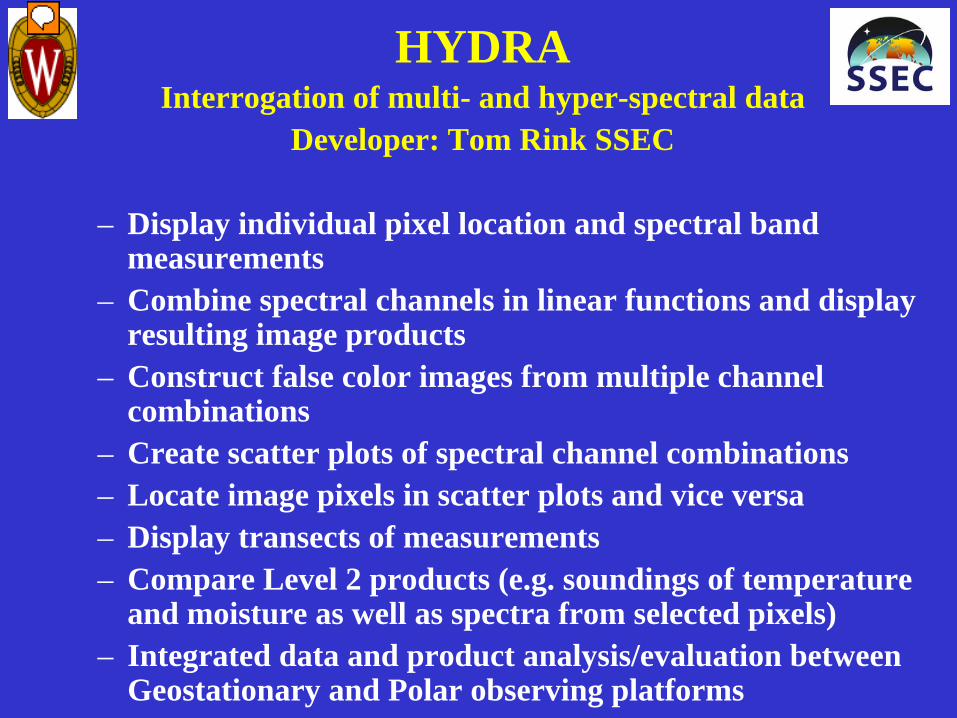
HYDRAInterrogation of multi- and hyper-spectral data
Developer: Tom Rink SSEC
– Display individual pixel location and spectral band measurements
– Combine spectral channels in linear functions and display resulting image products
– Construct false color images from multiple channel combinations
– Create scatter plots of spectral channel combinations– Locate image pixels in scatter plots and vice versa– Display transects of measurements– Compare Level 2 products (e.g. soundings of temperature
and moisture as well as spectra from selected pixels)– Integrated data and product analysis/evaluation between
Geostationary and Polar observing platforms
Presenter
Presentation Notes
HYDRA = Hyper-spectral data research application
Presenter
Presentation Notes
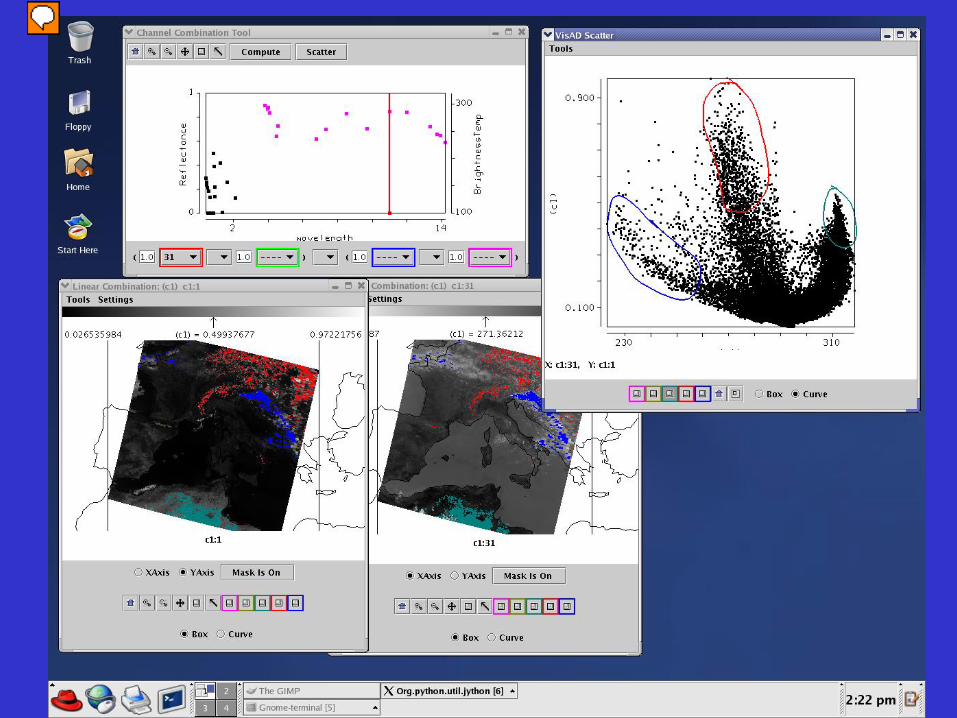
Scatter of values from two images, wth 1 band on each axis UL is chooser. LL image is band 1 (vis); right is 31 (ir window) UL is the tool to create the products. In scatter we select points and they are highlighted in blue, red and turquoise in the images. Blue-Low T and R (high clouds) Red (near freezing, highR showing snow. Turq is high T mod ref - desert
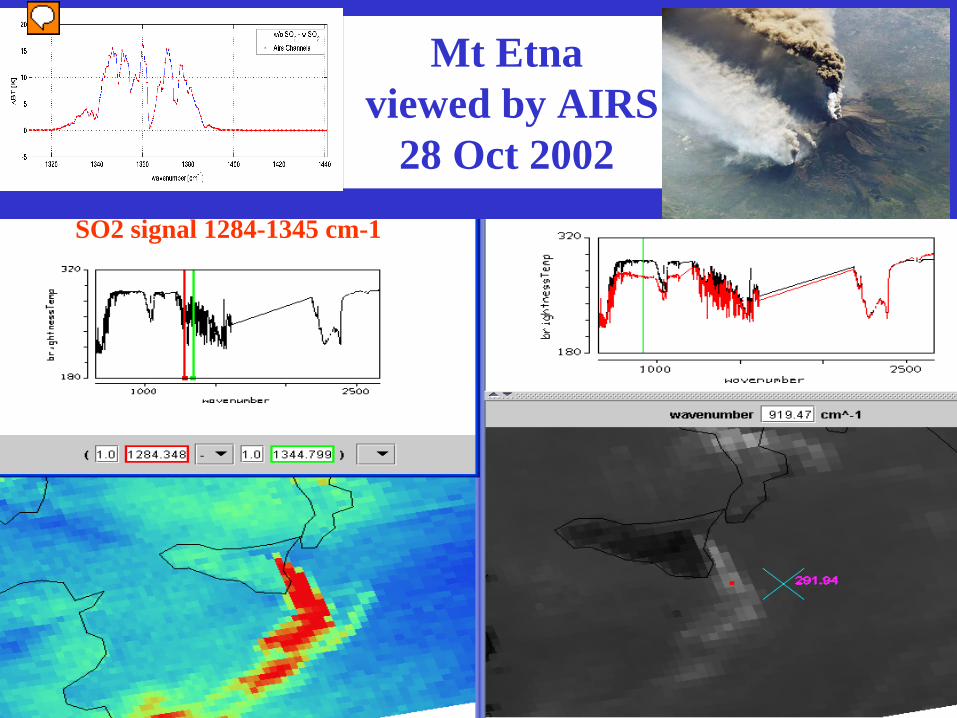
Mt Etnaviewed by AIRS
28 Oct 2002SO2 signal 1284-1345 cm-1
Presenter
Presentation Notes
In the spectra, the Red line is in the SO2 absorption region and the green line is not in SO2 absorption; both have similar h20 absorption features so we are seeing the only the SO2 emission, which stands out very clearly against the atmospheric background because the signal is so strong
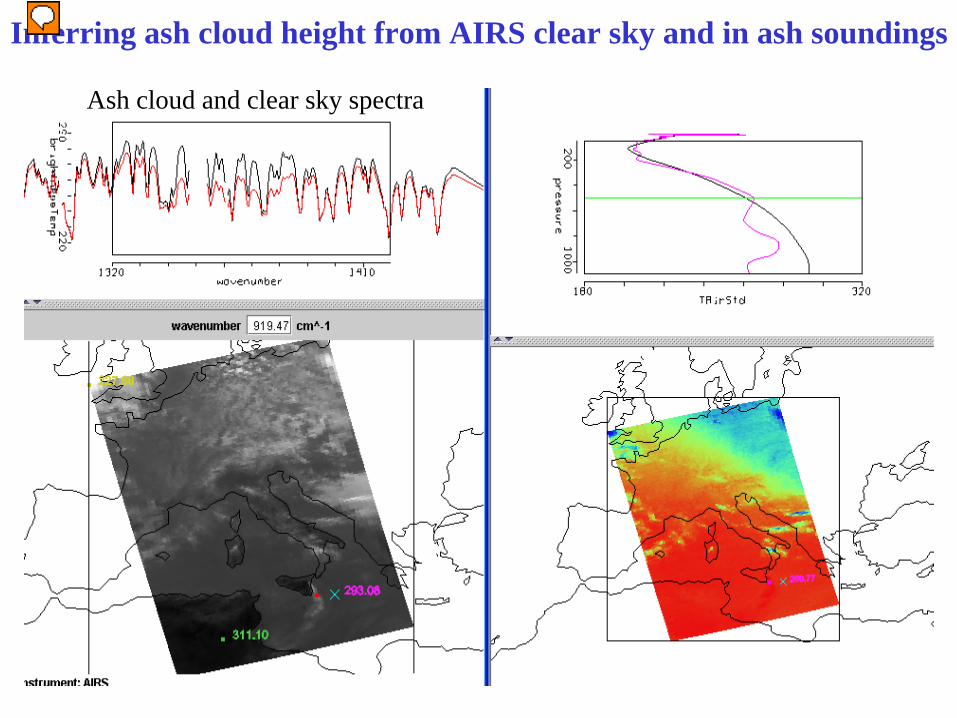
Ash cloud and clear sky spectra
Inferring ash cloud height from AIRS clear sky and in ash soundings
Presenter
Presentation Notes
Comparing two spectra and associated retrieval (cursor locations – in and out of ash cloud) Rt side image is retrieval T at about 500mb (yellow line above). T profile shows clear and ash cloud retrieval and the horiz. Line indicates the T difference to show the height of the ash cloud ??? WHY do we look at 1320 to 1410 wavenum??
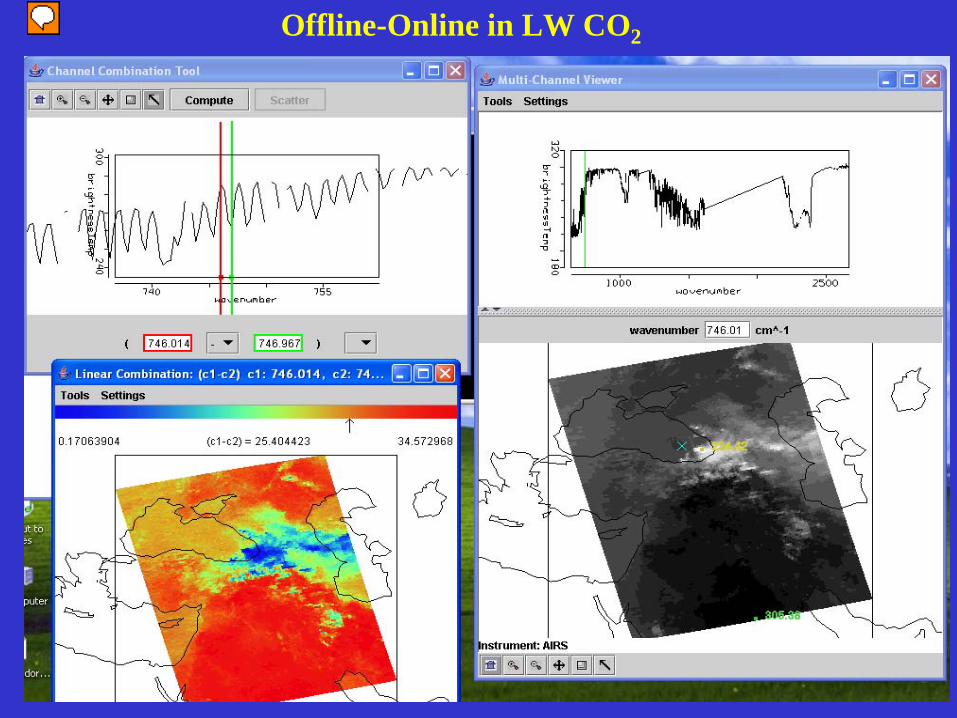
Offline-Online in LW CO2
Presenter
Presentation Notes
The difference shows the vertical temperature gradient; in cloudy area both see clouds so diff is small, where clear one sees the gradient
Offline-Online in H2 O
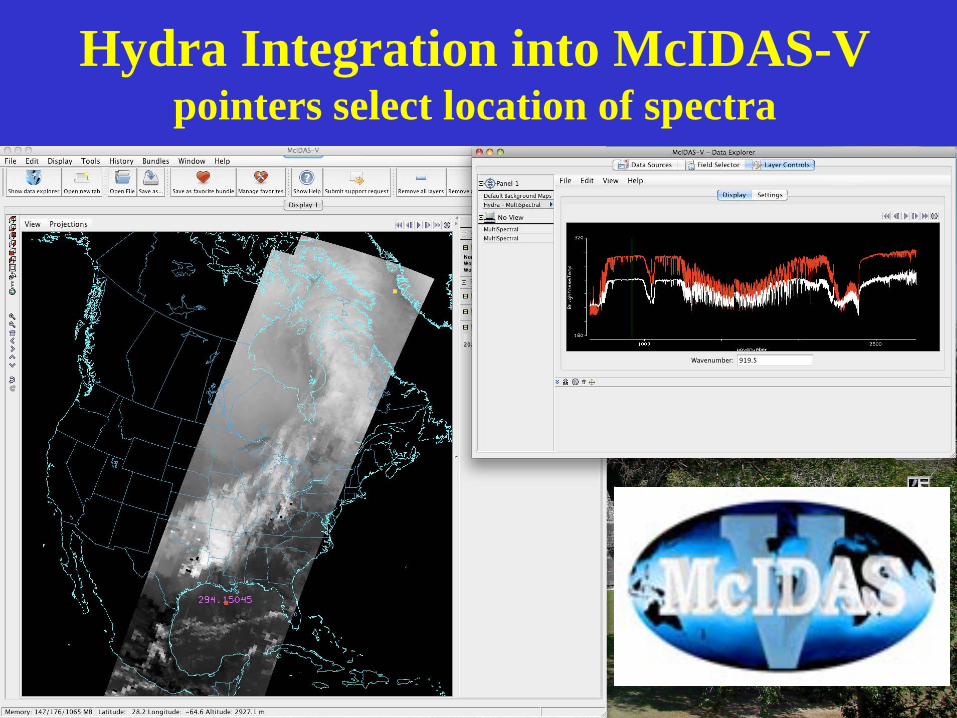
Hydra Integration into McIDAS-V IASI granule
Hydra Integration into McIDAS-V pointers select location of spectra
Hydra Integration into McIDAS-V slider bar selects spectral band display
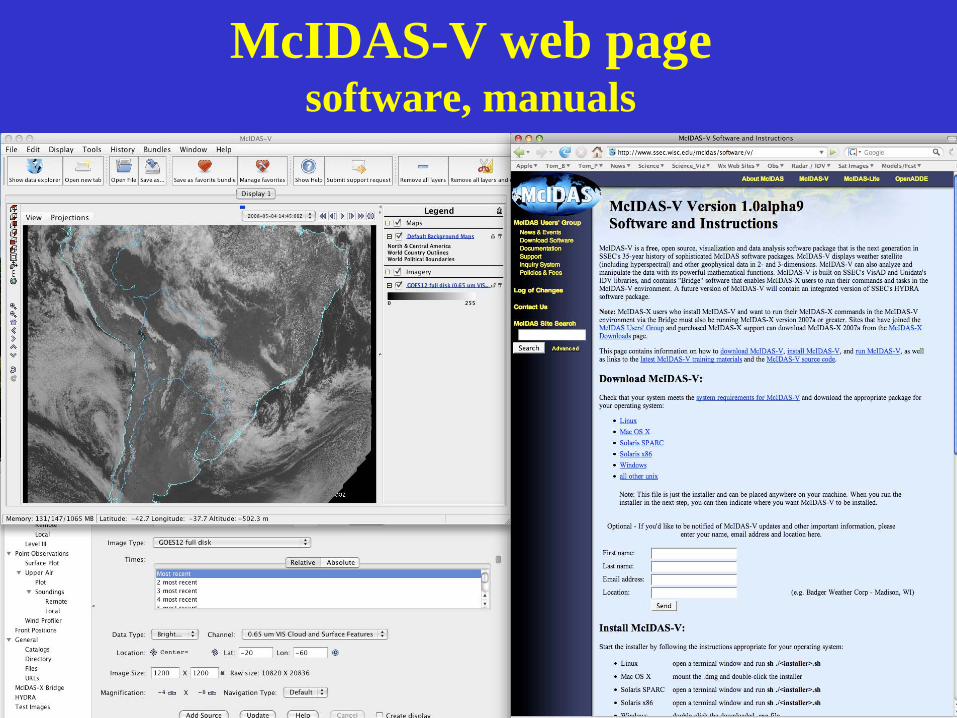
McIDAS-V web page software, manuals
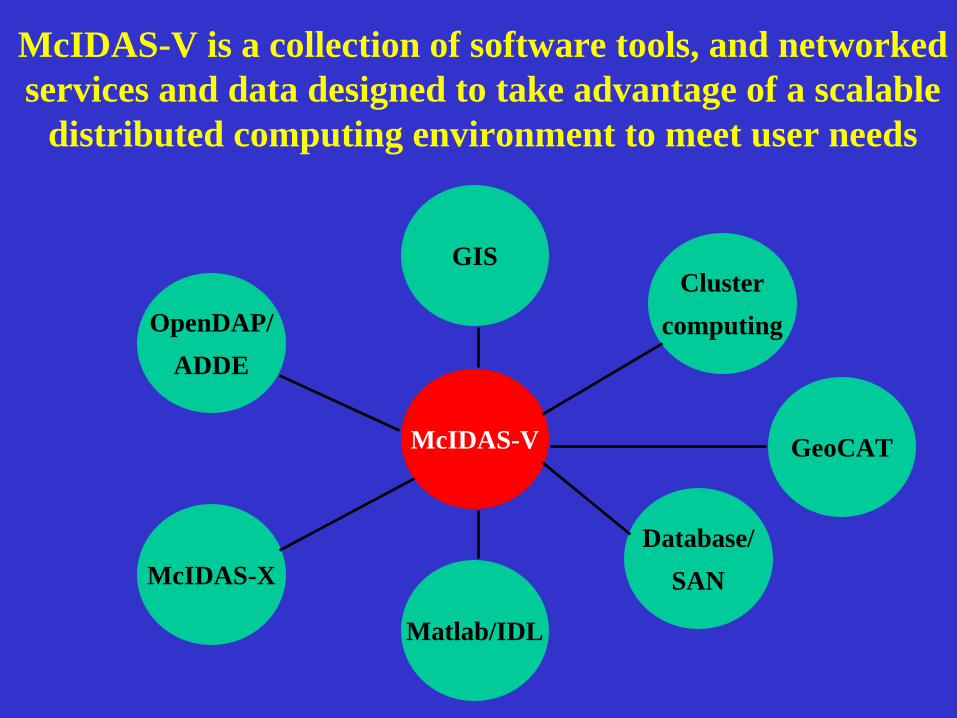
McIDAS-V
Clustercomputing
Matlab/IDL
Database/SAN
OpenDAP/ADDE
GIS
McIDAS-X
McIDAS-V is a collection of software tools, and networked services and data designed to take advantage of a scalable
distributed computing environment to meet user needs
GeoCAT
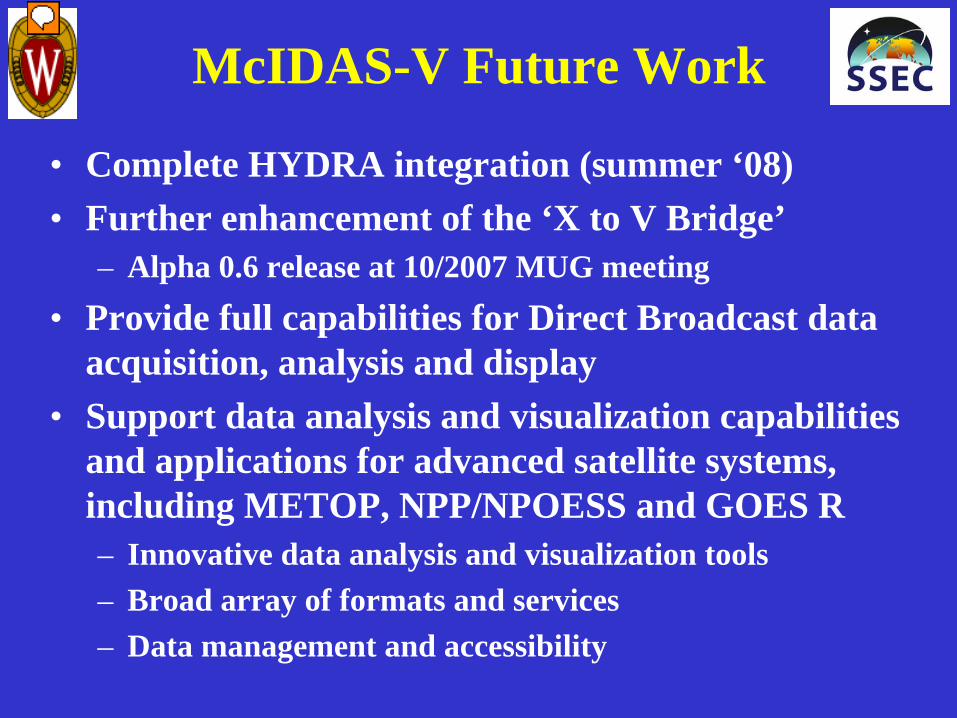
• Complete HYDRA integration (summer ‘08)• Further enhancement of the ‘X to V Bridge’
– Alpha 0.6 release at 10/2007 MUG meeting
• Provide full capabilities for Direct Broadcast data acquisition, analysis and display
• Support data analysis and visualization capabilities and applications for advanced satellite systems, including METOP, NPP/NPOESS and GOES R– Innovative data analysis and visualization tools– Broad array of formats and services– Data management and accessibility
McIDAS-V Future Work
Presenter
Presentation Notes
Data set has 168 cubes to cover Can to S Am (near full disk) Each cube is 128x128x101 gridpoints ---14 Gb for each time step times 37 time steps = ½ Terrabyte
McIDAS-V software
McIDAS-V is free, open source software
available at http://www.ssec.wisc.edu/mcidas/software/v/