2
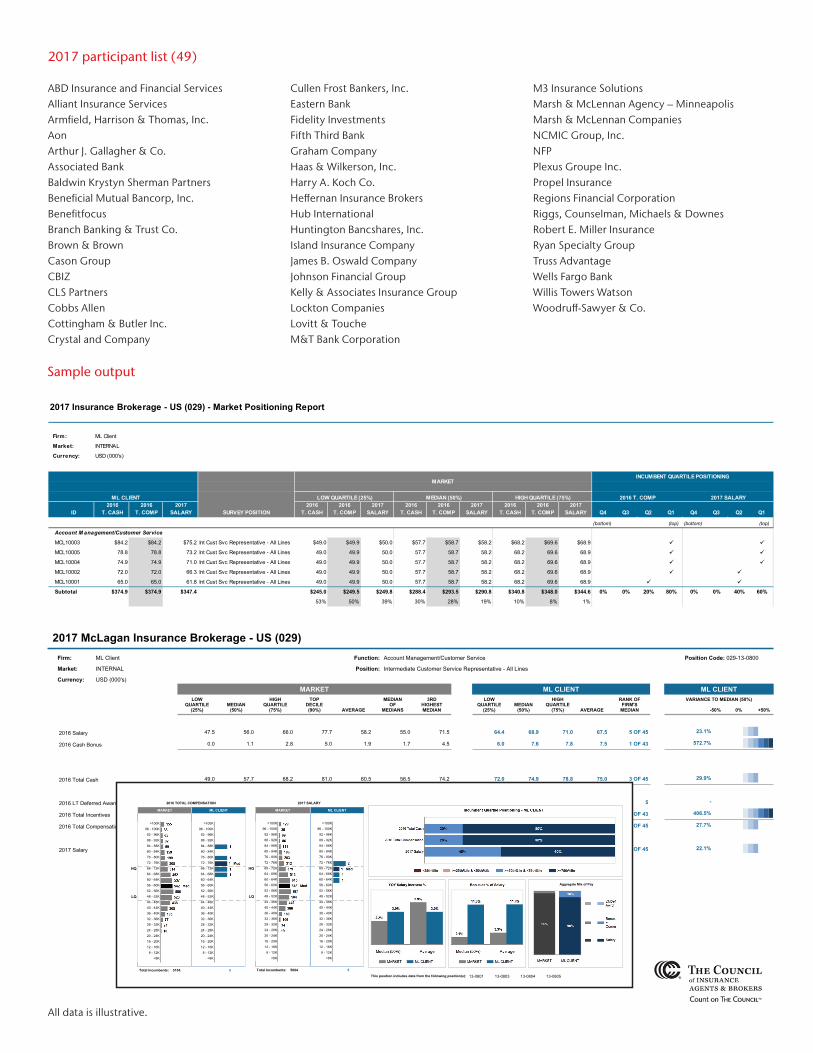
McLagan Insurance Brokerage Compensation Survey We understand that compensation is critical to the success of your business. In order to address this need, McLagan, partnering with the Council of Insurance Agents & Brokers, offers a comprehensive compensation survey specifically designed for the Insurance Brokerage Industry. We’re here to empower results Contact our team today to learn more about our solutions for insurance. Kaitlyn Isley 1.203.602.1202 [email protected] Ryan Bowers 1.203.388.3571 [email protected] For more information on McLagan, visit mclagan.aon.com is comprehensive survey provides competitive benchmark compensation data for virtually all positions found within the Insurance Brokerage Industry. Our survey provides competitive pay and production data for key functions in the industry such as Top Management, Producers, and Account Executives. Today our survey spans: • 49 Firms • 45,000 Employees Our industry compensation data is critical to your firm’s success Track Producer Pay / Production • Assess the competitiveness of your Producer revenue results • Assess Producer talent (i.e., Are your Top Producers really Top Producers?) Manage Annual Budgets / Year End Compensation Process • Manage compensation spending on a functional and business-wide basis • Project salary budgets and develop accruals for incentives • Optimize your pay mix (i.e., salary vs. bonus vs. long-term awards) Drive Recruiting and Retention • Review strengths and weaknesses of your compensation strategy • Compare your market position relative to competitive compensation levels • Define compensation opportunities to chart career paths To further capture pay distinctions, data is also broken out by the following scoping factors: • Firm size (by firm revenue) • Firm type (private vs. public) • Location (regional & major metro) We provide support and insights needed for decision making Advisory solutions: Our consulting approach is customized by project and includes functional benchmarking, pay and performance analysis, incentive plan review and design, cost to market analysis, and custom market practice studies. Confidentiality: Reports are presented in a way that ensures that data on individual companies cannot be identified. Reports are distributed only to participating organizations, each of which signs a reciprocal non-disclosure agreement with McLagan. 2018 key dates February Survey launch April / May Data collection due August Results delivered Participation fee 2017 Revenue CIAB Members Non-CIAB Members <25 M $2,000 $2,400 $25-100 M $3,300 $3,700 $100 M+ $4,600 $5,100