45
McTaggart, Findlay, Parkin: Microeconomics © 2007 Pearson Education Australia Chapter 4: Elasticity
| Date post: | 15-Apr-2018 |
| Category: |
Documents |
| Upload: | phungxuyen |
| View: | 224 times |
| Download: | 5 times |
McTaggart, Findlay, Parkin: Microeconomics © 2007 Pearson Education Australia
Chapter 4:
Elasticity
4-2McTaggart, Findlay, Parkin: Microeconomics © 2007 Pearson Education Australia
Objectives
After studying this chapter, you will be able to:§ Define, calculate, and explain the factors that influence the
price elasticity of demand
§ Define, calculate, and explain the factors that influence the cross elasticity of demand and the income elasticity of demand
§ Define, calculate, and explain the factors that influence the elasticity of supply
4-3McTaggart, Findlay, Parkin: Microeconomics © 2007 Pearson Education Australia
Squeezing Out Revenue
§ To predict the quantitative effects of changes in demand and supply on prices, quantities and total revenue, we need to know how responsive demand and supply are to price and other influences on buying plans and selling plans.
§ This chapter explains how we measure the response of demand and supply to price and other influences on buying plans and selling plans using the concept of elasticity.
§ It explains how we calculate, interpret, and use elasticity.

4-4McTaggart, Findlay, Parkin: Microeconomics © 2007 Pearson Education Australia
Price Elasticity of Demand
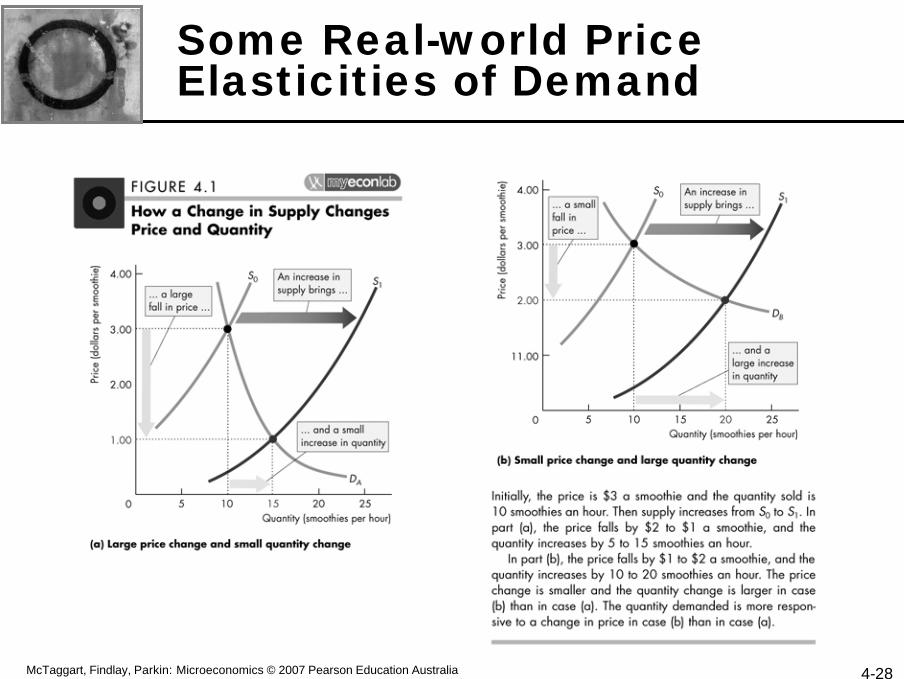
When supply increases, the equilibrium price falls and the equilibrium quantity increases§ But does the price fall by a larger amount and the quantity
increase by a little? (Figure 4.1(a))
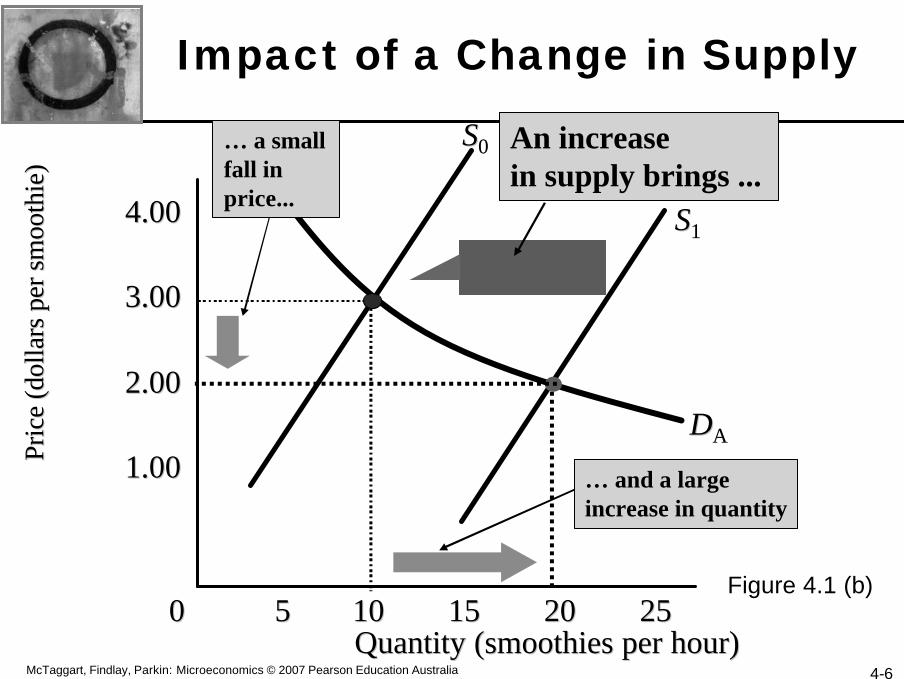
§ Or does the price barely fall and the quantity increase by a large amount? (Figure 4.1 (b))
§ The answer depends on the responsiveness of the quantity demanded to a change in price.

4-5McTaggart, Findlay, Parkin: Microeconomics © 2007 Pearson Education Australia
Impact of a Change in Supply
Quantity (smoothies per hour)Quantity (smoothies per hour)
Pric
e (d
olla
rs p
er s
moo
thie
)Pr
ice
(dol
lars
per
sm
ooth
ie)
1.001.00
2.002.00
3.003.00
4.004.00
DDAA
00 252555 1010 1515 2020
SS00… a largefall in price...
SS11
An increasein supply brings ...
… and a smallincrease in quantity
Figure 4.1 (a)
4-6McTaggart, Findlay, Parkin: Microeconomics © 2007 Pearson Education Australia
Impact of a Change in Supply
Quantity (smoothies per hour)Quantity (smoothies per hour)
Pric
e (d
olla
rs p
er s
moo
thie
)Pr
ice
(dol
lars
per
sm
ooth
ie)
1.001.00
2.002.00
3.003.00
4.004.00
DDAA
00 252555 1010 1515 2020
SS00… a smallfall in price...
SS11
An increasein supply brings ...
… and a largeincrease in quantity
Figure 4.1 (b)

4-7McTaggart, Findlay, Parkin: Microeconomics © 2007 Pearson Education Australia
Price Elasticity of Demand
§ The price elasticity of demand is a units-free measure of the responsiveness of the quantity demanded of a good to a change in its price, when all other influences on buyers’ plans remain the same.
§ Calculating Elasticity§ The price elasticity of demand is calculated by using the
formula:
Percentage change in quantity demandedPercentage change in price
4-8McTaggart, Findlay, Parkin: Microeconomics © 2007 Pearson Education Australia
Price Elasticity of Demand
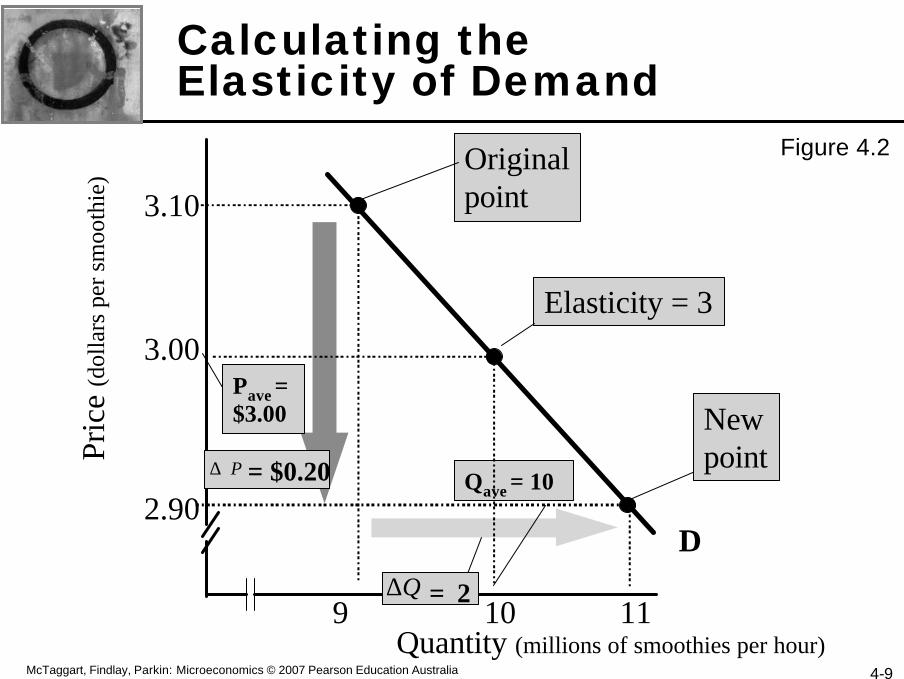
To calculate the price elasticity of demand:
§ We express the change in price as a percentage of the average price—the average of the initial and new price,
§ and we express the change in the quantity demanded as a percentage of the average quantity demanded—the average of the initial and new quantity.
4-9McTaggart, Findlay, Parkin: Microeconomics © 2007 Pearson Education Australia
Newpoint
Quantity (millions of smoothies per hour)
Pric
e (d
olla
rs p
er s
moo
thie
)
9 10 11
2.90
3.00
3.10
D
Originalpoint
Pave = $3.00
= $0.20P∆Qave = 10
= 2Q∆
Elasticity = 3
Calculating the Elasticity of Demand
Figure 4.2

4-10McTaggart, Findlay, Parkin: Microeconomics © 2007 Pearson Education Australia
Price Elasticity of Demand
§ By using the average price and average quantity, we get the same elasticity value regardless of whether the price rises or falls.
§ The ratio of two proportionate changes is the same as the ratio of two percentage changes.
§ The measure is units free because it is a ratio of two percentage changes and the percentages cancel out.
§ Changing the units of measurement of price or quantity leaves the elasticity value the same.
4-11McTaggart, Findlay, Parkin: Microeconomics © 2007 Pearson Education Australia
Price Elasticity of Demand
§ The formula yields a negative value because price and quantity move in opposite directions.
§ But it is the magnitude, or absolute value, of the measure that reveals how responsive the quantity change has been to a price change.
4-12McTaggart, Findlay, Parkin: Microeconomics © 2007 Pearson Education Australia
Price Elasticity of Demand
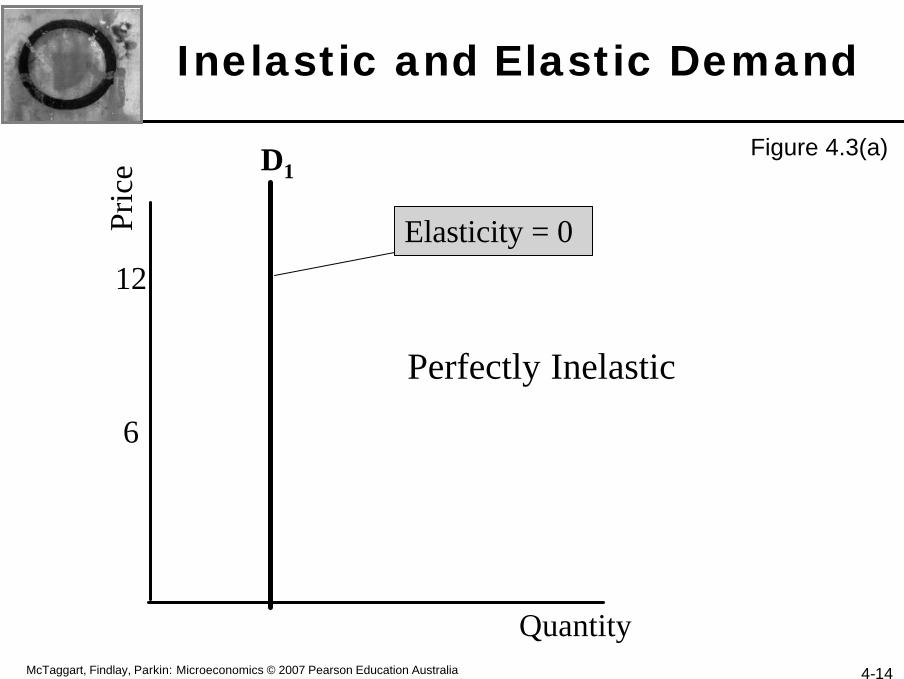
§ Inelastic and elastic demand§ Demand can be inelastic, unit elastic, or elastic, and can
range from zero to infinity.
§ If the quantity demanded doesn’t change when the price changes, the price elasticity of demand is zero and the good has a perfectly inelastic demand.

4-13McTaggart, Findlay, Parkin: Microeconomics © 2007 Pearson Education Australia
Price Elasticity of Demand
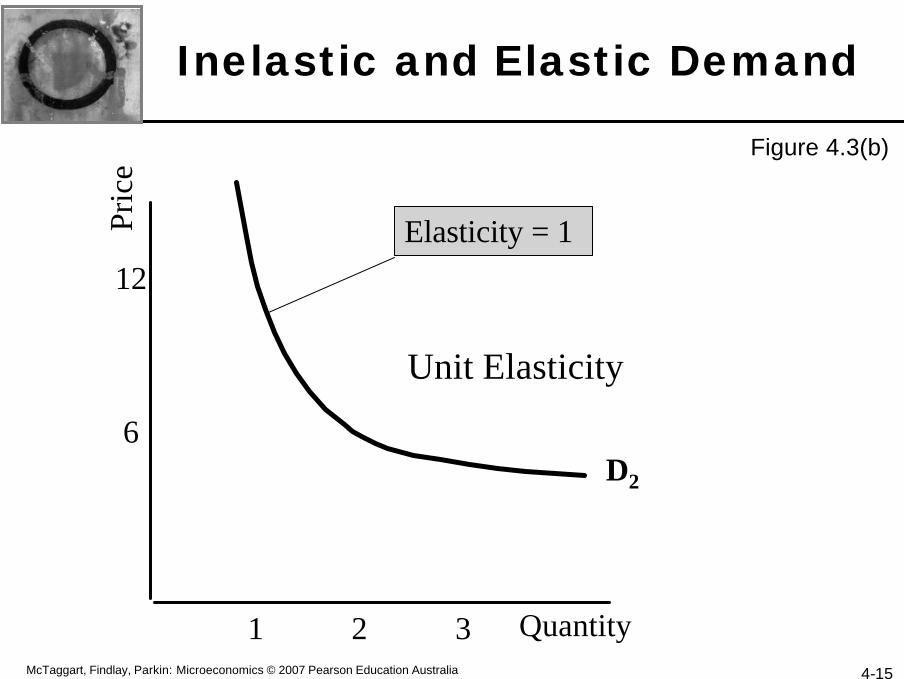
§ Between the two previous cases, the percentage change in the quantity demanded is smaller than the percentage change in price, so the price elasticity of demand is less than 1 and the good has inelastic demand.
§ If the percentage change in the quantity demanded is infinitely large when the price barely changes, the price elasticity of demand is infinite and the good has perfectly elastic demand.
4-14McTaggart, Findlay, Parkin: Microeconomics © 2007 Pearson Education Australia
Inelastic and Elastic Demand
6
12
Pric
e
Quantity
D1
Elasticity = 0
Perfectly Inelastic
Figure 4.3(a)
4-15McTaggart, Findlay, Parkin: Microeconomics © 2007 Pearson Education Australia
Inelastic and Elastic Demand
6
12
Pric
e
Quantity
D2
1 2 3
Elasticity = 1
Unit Elasticity
Figure 4.3(b)

4-16McTaggart, Findlay, Parkin: Microeconomics © 2007 Pearson Education Australia
Inelastic and Elastic Demand
6
12
Pric
e
Quantity
D3
Elasticity = ∞
Perfectly Elastic
Figure 4.3(c)

4-17McTaggart, Findlay, Parkin: Microeconomics © 2007 Pearson Education Australia
Price Elasticity of Demand
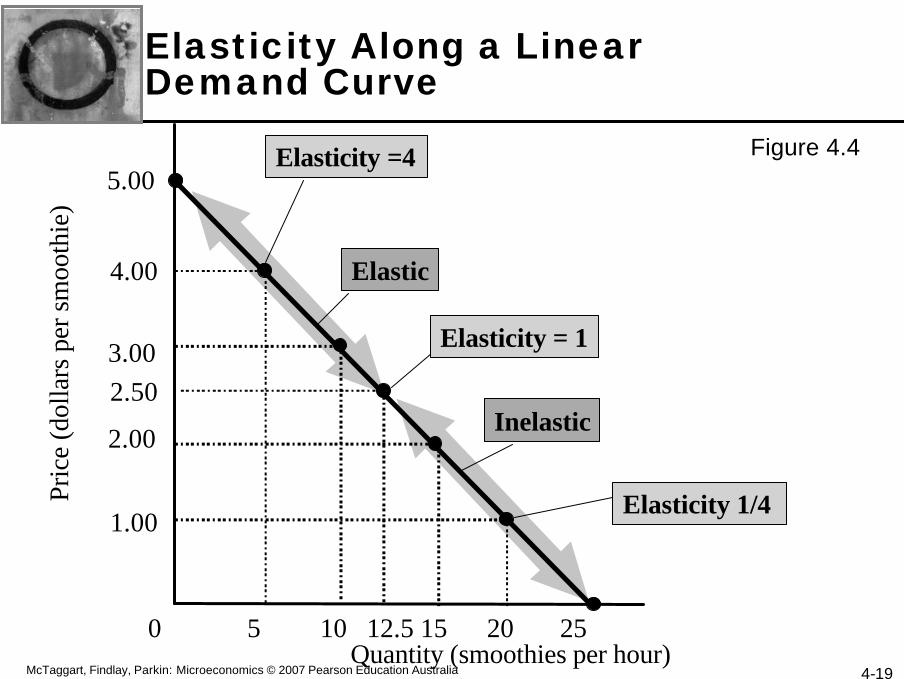
§ Elasticity along a linear demand curve§ Figure 4.4 shows how demand becomes less elastic as the
price falls along a linear demand curve.
§ At prices above the mid-point of the demand curve, demand is elastic.
§ At prices below the mid-point of the demand curve, demand is inelastic
4-18McTaggart, Findlay, Parkin: Microeconomics © 2007 Pearson Education Australia
Price Elasticity of Demand
§ For example, if the price falls from $5 to $3, the quantity demanded increases from 0 to 10 smoothies an hour.
§ The average price is $4 and the average quantity is 5.
§ The price elasticity of demand is (10/5)/(2/4), which equals 4.
4-19McTaggart, Findlay, Parkin: Microeconomics © 2007 Pearson Education Australia
Elastic
Inelastic
Elasticity Along a Linear Demand Curve
Elasticity = 1
0 5 10 12.5 15 20 25
2.50
1.00
2.00
3.00
4.00
5.00
Pric
e (d
olla
rs p
er s
moo
thie
)
Quantity (smoothies per hour)
Elasticity 1/4
Elasticity =4 Figure 4.4
4-20McTaggart, Findlay, Parkin: Microeconomics © 2007 Pearson Education Australia
Price Elasticity of Demand
§ Total revenue and elasticity§ The total revenue from the sale of a good or service equals
the price of the good multiplied by the quantity sold.§ When the price changes, total revenue also changes.§ But a rise in price doesn’t always increase total revenue.
4-21McTaggart, Findlay, Parkin: Microeconomics © 2007 Pearson Education Australia
Price Elasticity of Demand
§ The change in total revenue due to a change in price depends on the elasticity of demand:§ If demand is elastic, a 1 percent price cut increases the
quantity sold by more than 1 percent, and total revenueincreases.
§ If demand is inelastic, a 1 percent price cut decreases the quantity sold by more than 1 percent, and total revenues decreases.
§ If demand is unit elastic, a 1 percent price cut increases the quantity sold by 1 percent, and total revenue remains unchanged.
4-22McTaggart, Findlay, Parkin: Microeconomics © 2007 Pearson Education Australia
Price Elasticity of Demand
§ The total revenue test is a method of estimating the price elasticity of demand by observing the change in total revenue that results from a price change (when all other influences on the quantity sold remain the same).
§ If a price cut increases total revenue, demand is elastic.
§ If a price cut decreases total revenue, demand is inelastic.
§ If a price cut leaves total revenue unchanged, demand is unit elastic.

When demandis inelastic, aprice cut decreasestotal revenue
Inelastic demand
When demandis elastic, aprice cut increasestotal revenue
Elastic demand
31.250 6 12
1.00
2.00
3.00
4.00
5.00
Pric
e (d
olla
rs p
er s
moo
thie
)
0 12.5 25
Tot
al R
even
ue (d
olla
rs)
Quantity (smoothies per hour)
Unitelastic
Maximum total revenue
2.50
Copyright © 2007 Pearson Education Australia Pty Limited
Elasticity and Total Revenue
Figure 4.5
23

4-24McTaggart, Findlay, Parkin: Microeconomics © 2007 Pearson Education Australia
Price Elasticity of Demand
§ Your expenditure and your elasticity§ If your demand is elastic, a 1 percent price cut increases the
quantity you buy by more than 1 percent, and your expenditure on the item increases.
§ If your demand is inelastic, a 1 percent price cut increases thequantity you buy by less than 1 percent, and your expenditure on the item decreases.
§ If your demand is unit elastic, a 1 percent price cut increases the quantity you buy by 1 percent, and your expenditure on the item does not change.

4-25McTaggart, Findlay, Parkin: Microeconomics © 2007 Pearson Education Australia
Price Elasticity of Demand
§ The factors that influence the elasticity of demand
§ The elasticity of demand for a good depends on:§ The closeness of substitutes
§ The proportion of income spent on the good
§ The time elapsed since a price change

4-26McTaggart, Findlay, Parkin: Microeconomics © 2007 Pearson Education Australia
Price Elasticity of Demand
§ The closeness of substitutes§ The closer the substitutes for a good or service, the more
elastic is the demand for it.
§ Necessities, such as food or housing, generally have inelastic demand.
§ Luxuries, such as exotic vacations, generally have elastic demand.
§ The proportion of income spent on the good§ The greater the proportion of income consumers spent on a
good, the larger is its elasticity of demand.
4-27McTaggart, Findlay, Parkin: Microeconomics © 2007 Pearson Education Australia
Price Elasticity of Demand
§ The time elapsed since a price change§ The more time consumers have to adjust to a price
change, or the longer that a good can be stored without losing its value, the more elastic is the demand for that good.
4-28McTaggart, Findlay, Parkin: Microeconomics © 2007 Pearson Education Australia
Some Real-world Price Elasticities of Demand
4-29McTaggart, Findlay, Parkin: Microeconomics © 2007 Pearson Education Australia
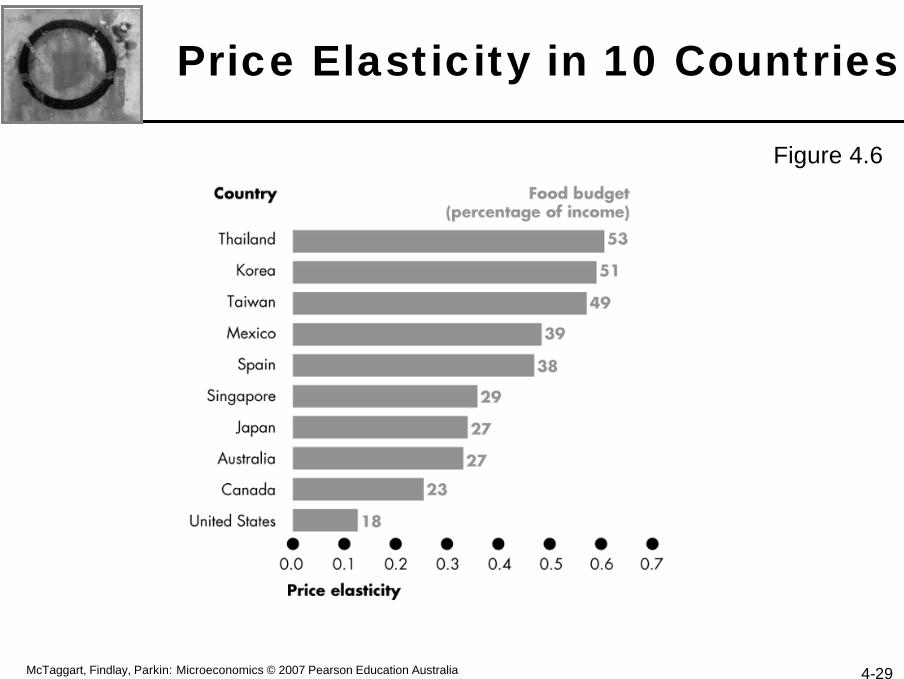
Price Elasticity in 10 Countries
Figure 4.6
4-30McTaggart, Findlay, Parkin: Microeconomics © 2007 Pearson Education Australia
More Elasticities of Demand
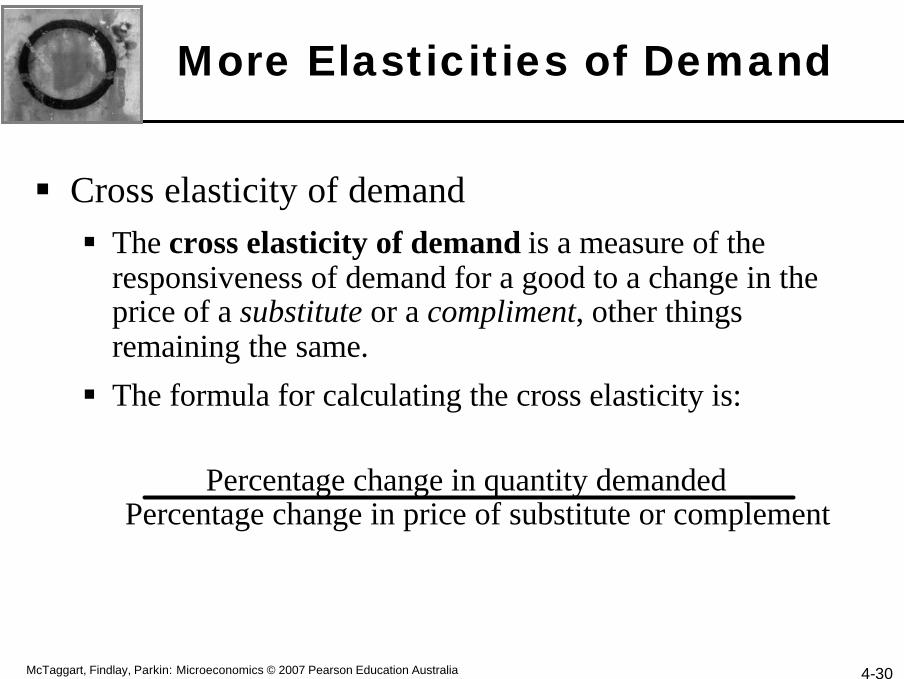
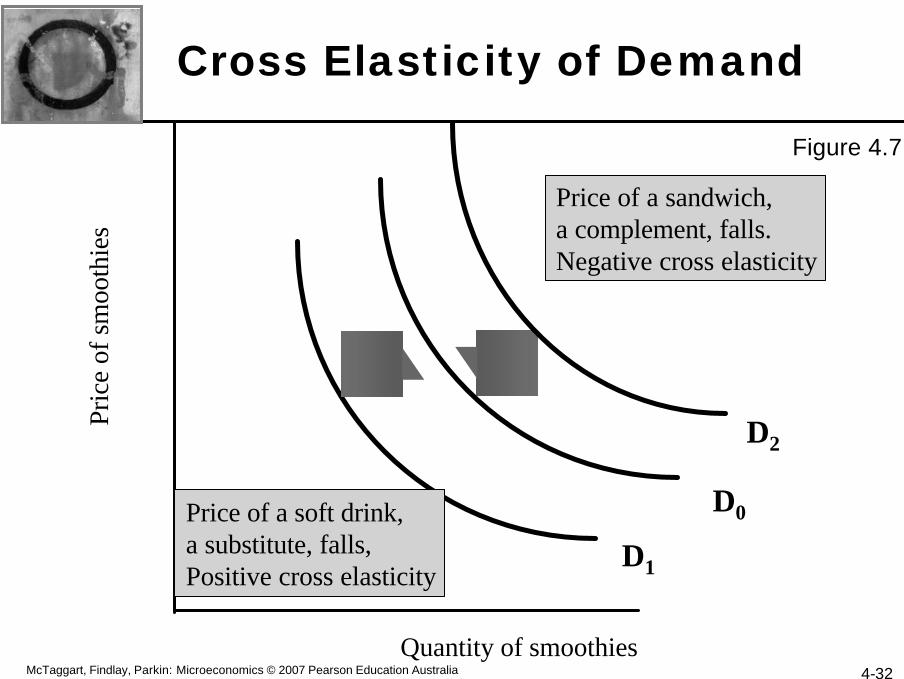
§ Cross elasticity of demand§ The cross elasticity of demand is a measure of the
responsiveness of demand for a good to a change in the price of a substitute or a compliment, other things remaining the same.
§ The formula for calculating the cross elasticity is:
Percentage change in quantity demandedPercentage change in price of substitute or complement
4-31McTaggart, Findlay, Parkin: Microeconomics © 2007 Pearson Education Australia
More Elasticities of Demand
§ The cross elasticity of demand for a substitute is positive.
§ The cross elasticity of demand for a complement is negative.
4-32McTaggart, Findlay, Parkin: Microeconomics © 2007 Pearson Education Australia
Cross Elasticity of DemandPr
ice
of s
moo
thie
s
Quantity of smoothies
D0Price of a soft drink,a substitute, falls,Positive cross elasticity
D1
D2
Price of a sandwich, a complement, falls.Negative cross elasticity
Figure 4.7
4-33McTaggart, Findlay, Parkin: Microeconomics © 2007 Pearson Education Australia
More Elasticities of Demand
§ Income Elasticity of Demand§ The income elasticity of demand measures how the quantity
demanded of a good responds to a change in income, other things equal.
§ The formula for calculating the income elasticity of demand is:
Percentage change in quantity demandedPercentage change in income

4-34McTaggart, Findlay, Parkin: Microeconomics © 2007 Pearson Education Australia
More Elasticities of Demand
§ If the income elasticity of demand is greater than 1, demand is income elastic and the good is a normal good.
§ If the income elasticity of demand is greater than zero but lessthan 1, demand is income inelastic and the good is a normal good.
§ If the income elasticity of demand is less than zero (negative) the good is an inferior good.

4-35McTaggart, Findlay, Parkin: Microeconomics © 2007 Pearson Education Australia
More Elasticities of Demand
Figure 4.8
4-36McTaggart, Findlay, Parkin: Microeconomics © 2007 Pearson Education Australia
Elasticity of Supply
§ The elasticity of supply measures the responsiveness of the quantity supplied to a change in the price of a good when all other influences on selling plans remain the same.
§ Calculating the Elasticity of Supply§ The elasticity of supply is calculated by using the formula:
Percentage change in quantity suppliedPercentage change in price

4-37McTaggart, Findlay, Parkin: Microeconomics © 2007 Pearson Education Australia
How a Change in Demand Changes Price and Quantity
Quantity (pizzas per hour)Quantity (pizzas per hour)
Pric
e (d
olla
rs p
er p
izza
)Pr
ice
(dol
lars
per
piz
za)
1.001.00
5.005.00
DD0000 252555 1010 1515 2020
SSaa
Large price change and small quantity change
…… a largeprice rise......2.002.00
3.003.00
DD11
An increasein demandbrings ...
…… and a smallquantity increase
4.004.00
6.006.00
Figure 4.9 (a)
4-38McTaggart, Findlay, Parkin: Microeconomics © 2007 Pearson Education Australia
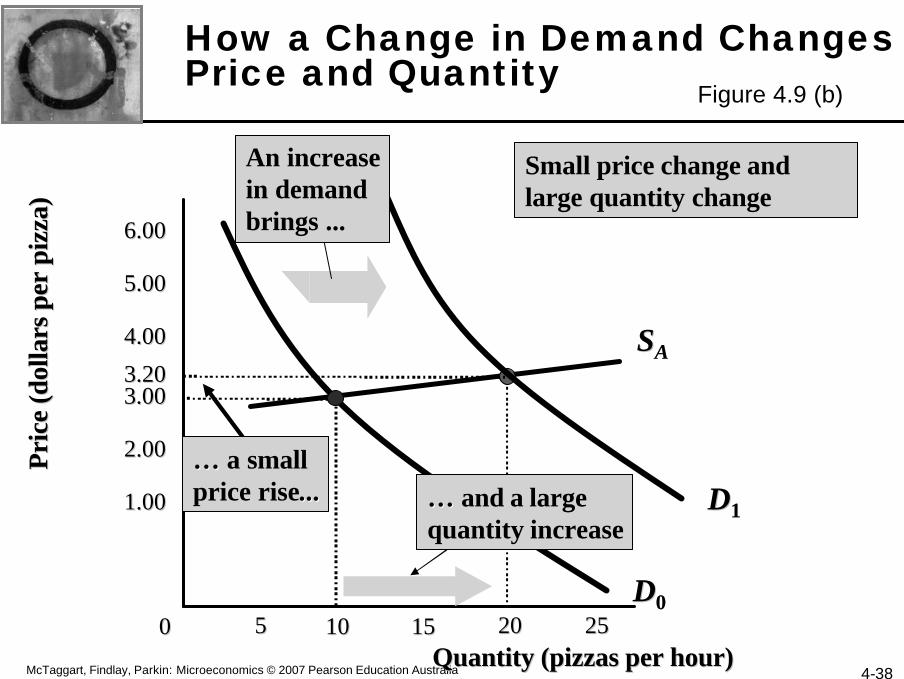
How a Change in Demand Changes Price and Quantity
Quantity (pizzas per hour)Quantity (pizzas per hour)
Pric
e (d
olla
rs p
er p
izza
)Pr
ice
(dol
lars
per
piz
za)
1.001.00
5.005.00
DD0000 252555 1010 1515 2020
SSAA
Small price change and large quantity change
…… a smallprice rise......
2.002.00
3.003.00
…… and a largequantity increase
4.004.00
6.006.00
DD11
An increasein demandbrings ...
3.203.20
Figure 4.9 (b)
4-39McTaggart, Findlay, Parkin: Microeconomics © 2007 Pearson Education Australia
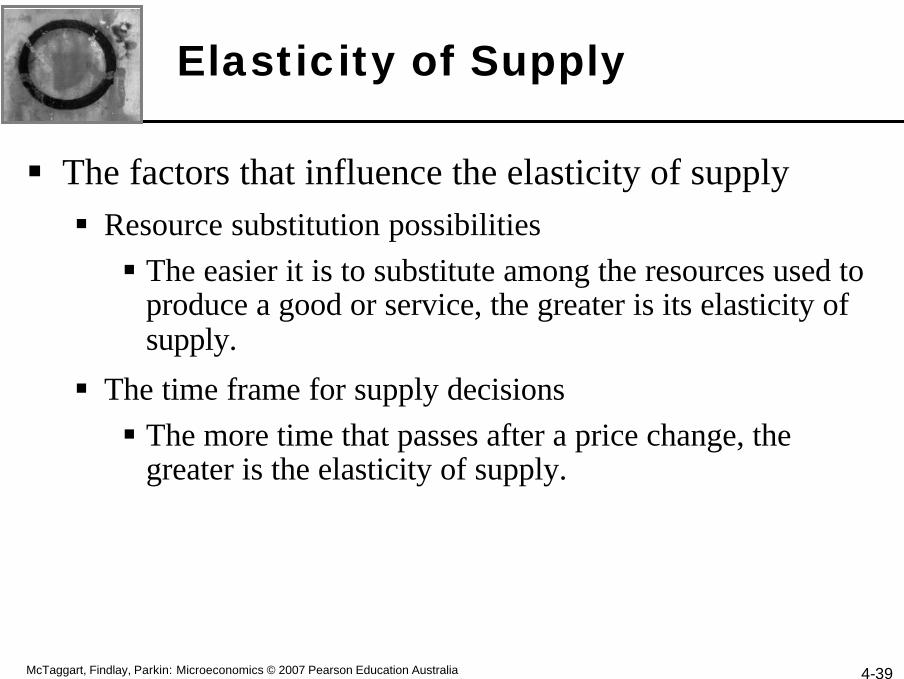
Elasticity of Supply
§ The factors that influence the elasticity of supply§ Resource substitution possibilities§ The easier it is to substitute among the resources used to
produce a good or service, the greater is its elasticity of supply.
§ The time frame for supply decisions§ The more time that passes after a price change, the
greater is the elasticity of supply.
4-40McTaggart, Findlay, Parkin: Microeconomics © 2007 Pearson Education Australia
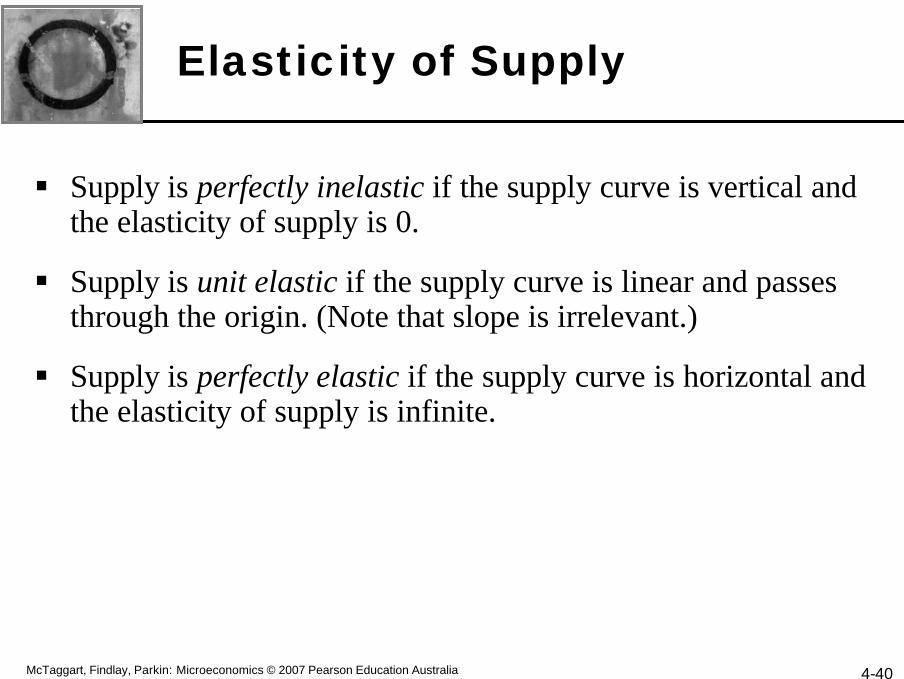
Elasticity of Supply
§ Supply is perfectly inelastic if the supply curve is vertical and the elasticity of supply is 0.
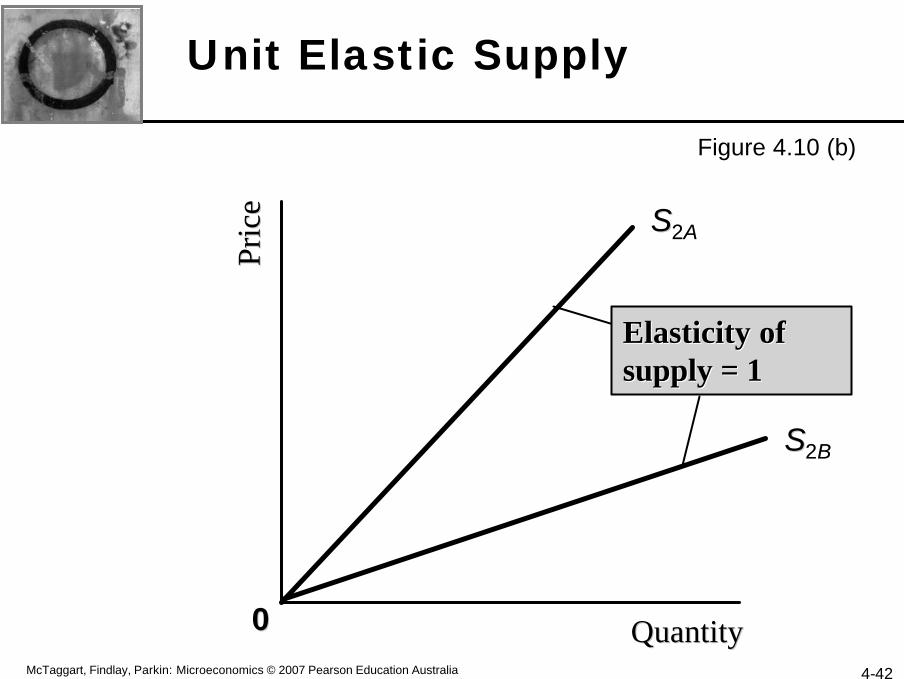
§ Supply is unit elastic if the supply curve is linear and passes through the origin. (Note that slope is irrelevant.)
§ Supply is perfectly elastic if the supply curve is horizontal and the elasticity of supply is infinite.

4-41McTaggart, Findlay, Parkin: Microeconomics © 2007 Pearson Education Australia
Perfectly Inelastic Supply
Pric
ePr
ice
QuantityQuantity
SS11
Elasticity of Elasticity of supply = 0supply = 0
00
Figure 4.10 (a)
4-42McTaggart, Findlay, Parkin: Microeconomics © 2007 Pearson Education Australia
Unit Elastic Supply
Pric
ePr
ice
QuantityQuantity
SS22AA
00
SS22BB
Elasticity of Elasticity of supply = 1 supply = 1
Figure 4.10 (b)

4-43McTaggart, Findlay, Parkin: Microeconomics © 2007 Pearson Education Australia
Perfectly Elastic Supply
Pric
ePr
ice
QuantityQuantity
SS33
00
Elasticity of Elasticity of supply = supply = ∞
Figure 4.10 (c)
4-44McTaggart, Findlay, Parkin: Microeconomics © 2007 Pearson Education Australia
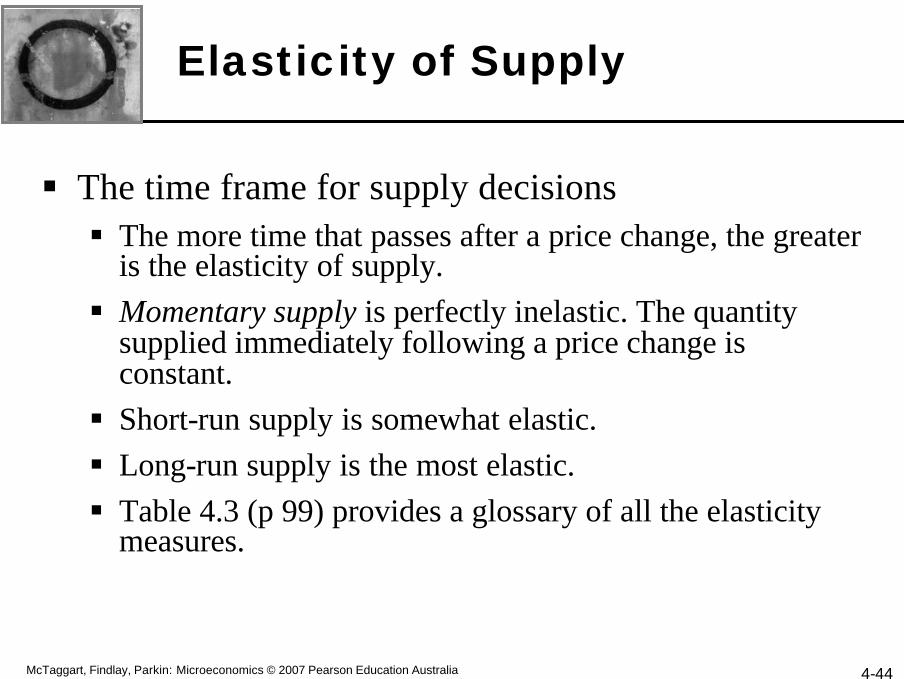
Elasticity of Supply
§ The time frame for supply decisions§ The more time that passes after a price change, the greater
is the elasticity of supply.§ Momentary supply is perfectly inelastic. The quantity
supplied immediately following a price change is constant.§ Short-run supply is somewhat elastic.§ Long-run supply is the most elastic.§ Table 4.3 (p 99) provides a glossary of all the elasticity
measures.
4-45McTaggart, Findlay, Parkin: Microeconomics © 2007 Pearson Education Australia
ENDCHAPTER 4


