24
MCX 2.0: Renewed! MCX Initiating Coverage | 19 August 2015 Sector: Business Services Ashish Chopra ([email protected]); +91 22 3982 5424
MCX 2.0: Renewed!
MCX
Initiating Coverage | 19 August 2015Sector: Business Services
Ashish Chopra ([email protected]); +91 22 3982 5424

MCX
5 August 2015 2
Contents: MCX 2.0: Renewed!
Summary ....................................................................................................................... 3
Leading business in a young, evolving industry .......................................................... 4
Sustainable and scalable business model ................................................................... 6
CTT had driven ~40% decline in volumes .................................................................. 10
SEBI takeover to pave way for universal exchanges ................................................. 12
Introduction of options to drive volumes ................................................................. 14
Monopoly + policy push + operating leverage .......................................................... 16
Current leadership...................................................................................................... 18
Key takeaways from PWC’s special audit .................................................................. 19
Financials and valuations ........................................................................................... 21
Investors are advised to refer through disclosures made at the end of the Research Report.
Motilal Oswal research is available on www.motilaloswal.com/Institutional-Equities, Bloomberg, Thomson Reuters, Factset and S&P Capital.

MCX
19 August 2015 3
MCX 2.0: Renewed! Promoter change, regulatory owner change, monopoly intact
MCX is India’s largest commodity exchange, with a market share of ~84% in FY15. In his latest budget speech, the Finance Minister proposed the merger of FMC
with SEBI – a key positive towards mobilizing long-awaited reforms. Under SEBI, introduction of new products like options can bring back the volumes
lost due to CTT (~40% impact). Revival of daily volumes to INR500b by FY18 implies 35% volume CAGR, 62%
EBITDA CAGR, and 85% EBIT CAGR. Buy; our price target is INR1,400.
Retains leadership in nascent industry despite parent’s crisis Multi Commodity Exchange of India Limited (MCX) is a state-of-the-art electronic commodity futures exchange, offering futures trading in bullion, ferrous and non-ferrous metals, energy, and agricultural commodities. It began operations in November 2003, and has 84% market share (FY15). It has retained its monopolistic share despite erstwhile parent’s crisis post the INR56b NSEL scandal, testament to the virtue of leadership in the winner-takes-all business. SEBI’s merger with FMC will mobilize much awaited reforms In his budget 2015-16 speech, the Finance Minister proposed to merge the Securities and Exchange Board of India (SEBI), the stock market regulator, with the Forward Markets Commission (FMC), which regulates the commodities market. SEBI’s taking over proceedings would help [1] bring a large share of the unorganized market back to MCX (estimated at 6-7x), and [2] introduce new products (options, indices) and participants (FIs, FIIs, Banks). These changes can be introduced without the passage of the FCRA Bill, if SEBI deems it useful and is satisfied with the readiness of the ecosystem. Expect 35% volume CAGR, driving 62% EBITDA CAGR; Buy Our base case assumes return to pre-CTT ADT of INR500b by FY18, a CAGR of 35%. Operating leverage would help drive EBIT CAGR of 85% and EBITDA CAGR of 62%. We initiate coverage on MCX with a Buy rating; our price target is INR1,400, which discounts 25x FY18E earnings back by one year. Globally, the average multiple of exchanges in emerging markets is ~20x. We believe there is a case for MCX to command a premium to that median, given [1] scope to outgrow peer exchanges globally, as the potential is still untapped in India, and [2] near-monopoly market share, to which there is little threat.
Initiating Coverage | Sector: Business Services
MCX CMP: INR1,090 TP: INR1,400 (+28%) Buy
BSE Sensex S&P CNX
28,932 8,495
Stock Info Bloomberg MCX IN Equity Shares (m) 51.0 52-Week Range (INR) 1289 / 701 1, 6, 12 Rel. Per (%) 0/20/23 M.Cap. (INR b) 55.6 M.Cap. (USD b) 0.9 AvgVal. INRm/Vol‘000 666/689 Free float (%) 100.0
Financial Snapshot (INR b) Y/E March 2015 2016E 2017E
Sales 2.0 2.3 3.6
EBITDA 0.7 0.8 1.8
PAT 1.3 0.7 2.2
EPS (INR) 24.6 14.7 43.4
EPS Gr. (%) -18.1 -40.4 196.5
BV/Sh. (INR) 235.8 249.8 271.9
RoE (% 10.7 6.0 16.6
RoCE (%) 10.4 10.5 16.2 Payout (%) 6.9 115.6 55.7
Valuations
P/E (x) 44.3 74.4 25.1
P/BV (x) 4.6 4.4 4.0
EV/ EBITDA (x) 58.6 47.9 21.2
Div. Yield (%) 0.2 1.6 2.2
Shareholding pattern (%)
As on Jun-15 Mar-15 Jun-14 Promoter 0.0 0.0 26.0
DII 40.9 40.1 19.2
FII 15.3 15.3 17.7 Others 43.9 44.6 37.1 FII Includes depository receipts
Stock Performance (1-year)
700
850
1,000
1,150
1,300
Aug
-14
Oct
-14
Dec
-14
Feb-
15
Apr-
15
Jun-
15
Aug-
15
Multi Comm. Exc. Sensex - Rebased
Motilal Oswal values your support in the Asiamoney Brokers Poll 2015 for India
Research, Sales and Trading team. We request your ballot.
MCX
19 August 2015 4
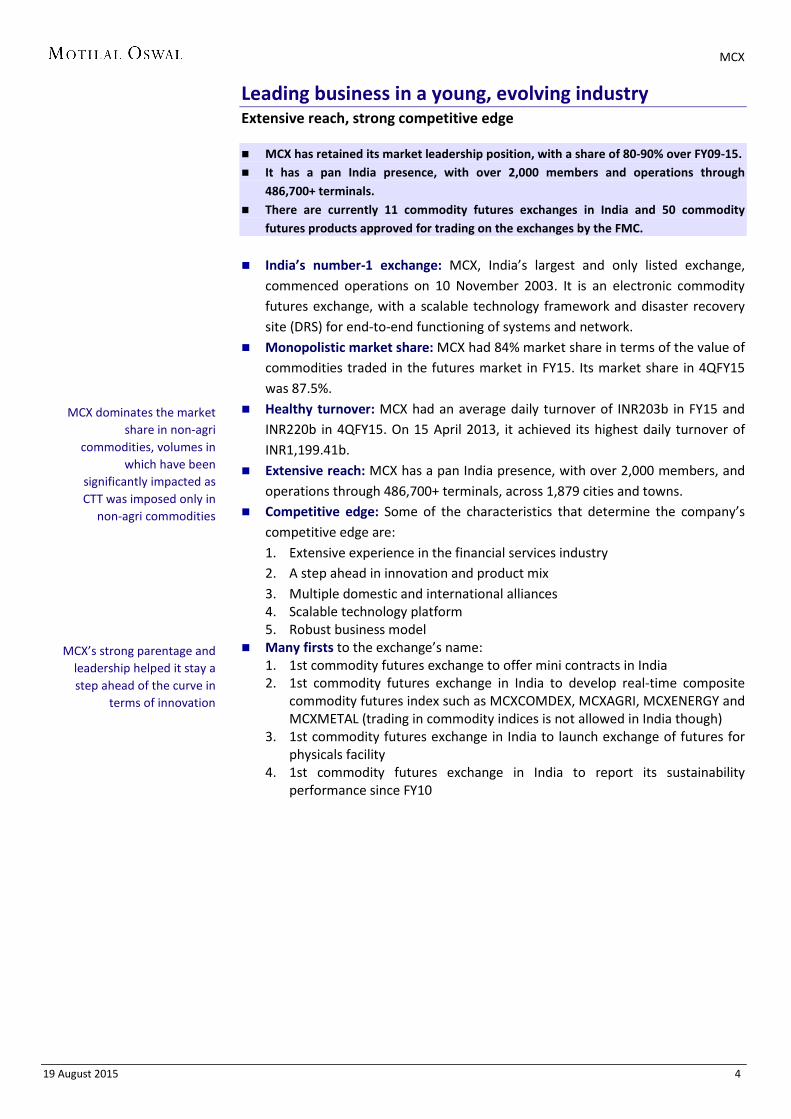
Leading business in a young, evolving industry Extensive reach, strong competitive edge
MCX has retained its market leadership position, with a share of 80-90% over FY09-15. It has a pan India presence, with over 2,000 members and operations through
486,700+ terminals. There are currently 11 commodity futures exchanges in India and 50 commodity
futures products approved for trading on the exchanges by the FMC.
India’s number-1 exchange: MCX, India’s largest and only listed exchange,
commenced operations on 10 November 2003. It is an electronic commodity futures exchange, with a scalable technology framework and disaster recovery site (DRS) for end-to-end functioning of systems and network.
Monopolistic market share: MCX had 84% market share in terms of the value of commodities traded in the futures market in FY15. Its market share in 4QFY15 was 87.5%.
Healthy turnover: MCX had an average daily turnover of INR203b in FY15 and INR220b in 4QFY15. On 15 April 2013, it achieved its highest daily turnover of INR1,199.41b.
Extensive reach: MCX has a pan India presence, with over 2,000 members, and operations through 486,700+ terminals, across 1,879 cities and towns.
Competitive edge: Some of the characteristics that determine the company’s competitive edge are: 1. Extensive experience in the financial services industry 2. A step ahead in innovation and product mix 3. Multiple domestic and international alliances 4. Scalable technology platform 5. Robust business model
Many firsts to the exchange’s name: 1. 1st commodity futures exchange to offer mini contracts in India 2. 1st commodity futures exchange in India to develop real-time composite
commodity futures index such as MCXCOMDEX, MCXAGRI, MCXENERGY and MCXMETAL (trading in commodity indices is not allowed in India though)
3. 1st commodity futures exchange in India to launch exchange of futures for physicals facility
4. 1st commodity futures exchange in India to report its sustainability performance since FY10
MCX dominates the market share in non-agri
commodities, volumes in which have been
significantly impacted as CTT was imposed only in
non-agri commodities
MCX’s strong parentage and leadership helped it stay a step ahead of the curve in
terms of innovation

MCX
19 August 2015 5
Exhibit 1: MCX - Key milestones
Source: Company
Key industry highlights 17 commodity exchanges are recognized by the FMC in India. Six are national
multi-commodity exchanges. 11 are regional or localized exchanges spread across India.
About 50 commodity futures are approved by the FMC for trading. Six electronic national-level multi-commodity exchanges recognized by the
Government of India are MCX, NCDEX, NMCE, ICEX, ACE, and UCX. The national exchanges accounted for 99.72% of the turnover of commodity
futures contracts traded in India during FY13-14. Growth of the commodity industry in India will depend on favorable policy
framework (that is, roll-back of CTT), amendment of regulatory statutes, economic growth, increase in investor participation, technological advancements, and introduction of new commodity classes.
Incorporated in April 2002
Commenced operations in Nov 2003
Forged strategic alliances with NYMEX (Part of CME Group)
Became India’s first listed exchange on March 9, 2012
Recorded the highest daily turnover of Rs. 119941.42 crore (single side)
Was the 3rd largest commodity futures exchanges globally in terms of the number of contracts traded in CY 2012*
Market share of about 87% in FY2012-13
Commodity Transaction Tax (CTT) imposed effective July 1, 2013
As a result of crisis at NSEL (a subsidiary of FTIL), (1) MCX’s erstwhile anchor investor, Financial Technologies (FTIL) - declared not ‘Fit and Proper’; (2) FMC asked PwC to conduct a forensic audit of MCX’s operations since inception – revealed pertinent facts
MCX underwent significant changes during 2013-14; changes in top management and Board
Market share fell to about 77%
Market share of 87.48% in Q4 2015
Launch of futures trading in Crude mini
2002
2003
2005-08
2012
2013 2015
Mr. P K Singhal assigned the role of taking care of the day to day operations of the Exchange
Technology agreement with FTIL re-negotiated – more equitable terms w.e.f. July 01, 2014
FTIL sold its entire stake (26%) held in MCX between July-September 2014 Kotak Mahindra Bank Ltd. acquired 15% equity stake on September 29, 2014
Mr. P. K. Singhal elevated as Joint Managing Director on October 14, 2014
Regains Market share of about 86% in Dec-14
2014

MCX
19 August 2015 6
Sustainable and scalable business model Monopolistic share in winner-takes-all industry
MCX has held on to its monopolistic market share in the most turbulent of times in the winner-takes-all industry.
Being the largest commodity exchange in India, MCX is the key source of data on commodity trends, which could be a potential source of revenue, going forward.
Market leadership in winner-takes-all business There is little room for multiple players in the exchange business, and across the globe, one would struggle to find more than three exchanges for any asset class with market share noteworthy of any mention. The leading exchange is the obvious choice of traders, given the assurance for their biggest pre-requisite for choosing any exchange – liquidity. As a result, the player with the highest market share is a guaranteed winner – liquidity drives liquidity. While competitors have tried to change the market dynamics with various forms of aggressive behavior, pricing for example, this has failed to have an impact. Even in the most turbulent of times over the last 12-18 months, when the parent’s existence was in deep waters on issues of fraud around National Spot Exchange (NSEL), the exchange managed to retain its share. Additionally, it has remained without a full-time MD & CEO since May 2014 when Mr Manoj Vaish resigned after just three months. This is a reflection of the winner-takes-all nature of the business model. Exhibit 2: MCX's market leadership has sustained through thick and thin
Source: Company, MOSL
Leadership in multiple commodities takes care of concentration risk MCX’s golden run in terms of volumes came at the time of significant run-up in gold and silver prices. That was also perceived to be a risk, given that the share of volumes from these two commodities had exceeded 70%. However, presence in multiple commodities helps avert the concentration risk, and volatility in the prices of even a single major non-agricultural commodity can help drive significant volumes. This was evidenced in FY15, when action in oil prices drove energy to exceed gold as the largest traded commodity at MCX by value.
80.2
89.6 87.5 87.5 86.0 87.3
84.9 85.0
FY08 FY09 FY10 FY11 FY12 FY13 FY14 FY15
Market share - MCX (%)
Displacing the leader is an arduous task in the winner-
takes-all industry

MCX
19 August 2015 7
Exhibit 3: While gold and silver were dominant commodities in FY12…
Source: Company, MOSL
Exhibit 4: …with oil price volatility, energy replaced gold at the top
Source: Company, MOSL
Exhibit 5: MCX enjoys a clear monopoly in non-agri commodities
Source: Company, MOSL
Pick-up in physical demand for commodities would help… Growth potential in an economy like India remains exciting over the next decade, which should drive up demand for commodities. The increase in physical market volumes would increase the hedging requirements for industry players, influencing derivative trading volumes. In developed markets, commodity derivative volumes are generally a multiple of the underlying physical commodity volumes. As the consumption of physical commodities increases in India, the volumes of commodity derivatives being traded may also increase.
Exhibit 6: Linkage of gold futures volumes to gold imports – FY15 disparity due to CTT
Source: Company, MOSL
Agri commodities
12%
Gold 24%
Silver 32%
Metals 16%
Energy 16%
FY12 Agri
commodities 17%
Gold 20%
Silver 15%
Metals 21%
Energy 27%
FY15
98.4 100.0 100.0
10.4
Bullion Energy Base Metals Agri
MCX's market share in various commodity segments
0
12,000
24,000
36,000
48,000
0
15
30
45
60
Mar
04
Mar
05
Mar
06
Mar
07
Mar
08
Mar
09
Mar
10
Mar
11
Mar
12
Mar
13
Mar
14
Mar
15
Gold imports (USD b) Gold volumes on MCX (INR b)

MCX
19 August 2015 8
…along with significant under-penetration of commodity derivatives In developed markets, commodity derivatives volumes are at a much higher multiple of the underlying physical commodity volumes. The Indian commodities market is ~4x the physical market compared with the global average of 35-40x. Futures volumes are 59x the physical trade in gold v/s 5x at MCX, 148x in silver v/s ~34x at MCX, 90x in copper v/s 13x at MCX, and 44x in cotton v/s 0.7x at MCX. Exhibit 7: Commodities multiplier suggests a long way to go for India's exchanges
Commodity Futures multiplier in 2014
Globally MCX Gold 59.0 5.0 Silver 148.0 34.0 Copper 90.0 13.0 CPO 12.0 1.0 Cotton 44.0 0.7
Source: MCX Research
Scalable model, with potential to generate revenue from new streams Being the largest commodity exchange in India, with near-monopolistic market share, MCX is the key source of data on commodity trends. This gives MCX the opportunity to develop new non-transaction revenue sources like market data product and information offerings, as is the case for various leading exchanges in India and the rest of the world. This not only provides scalability to the business model, but also offers potential for growth with limited incremental costs. Growth in commodity markets facilitate demand for better trading and analytical tools, risk management tool, market data products and price information offerings, which are potential new revenue streams. Globally, exchanges derive 10-15% of their revenue from such services. Indian exchanges do not match that number, especially in equities, given weak acceptance of algorithmic trades. MCX is better placed to garner revenue from such sources, given its speedier execution in such trades, which already constitute around 20-30% of the company’s volumes. To facilitate the same, MCX has entered into agreements with financial information service agencies to provide real time data feed on trading prices, trading volume and other information on the commodity futures contracts traded on the exchange and in the spot market. The company currently has such arrangements with the following entities: 1. Bloomberg Finance LP 2. NewsWire 18 Private Limited 3. IQN Data Solutions Private Limited 4. Reuters India Private Limited 5. Interactive Data (Europe) Limited Within India, even at NSE, services like online data feed, e-learning and data subscription feed amounted to 9% of revenue in FY14.
MCX has chalked out plans of additional revenue
streams, which may see implementation once new
leadership is in place

MCX
19 August 2015 9
Exhibit 8: Sources of revenue for NSE NSE revenue break-up (%) FY12 FY13 FY14 Transaction charges 81.1 81.9 82.7 Annual subscription 1.2 0.6 0.0 Book building fees 0.4 0.5 0.4 Listing fees 3.5 3.8 3.5 Income - online data feed services fees 3.0 3.1 3.7 ADM 1.7 1.6 1.5 IMS 1.0 0.7 0.5 E-learning solutions 5.7 4.9 5.0 IT & Process support charges 0.4 0.5 0.0 Index License fees outside India 0.9 1.1 1.5 ETF Licensing outside India 0.1 0.2 0.2 Data subscription fees 0.2 0.3 0.3 Dividend received 0.0 0.0 0.0 Others 0.6 0.9 0.7
Source: Company, MOSL

MCX
19 August 2015 10
CTT had driven ~40% decline in volumes Headwinds of low commodity prices in current turnover
In 2QFY12, the average daily turnover (ADT) on MCX was INR625m, buoyed by strong run-up in gold and silver prices.
Post the introduction of commodities transaction tax (CTT), ADT dropped to ~INR270b. The current ADT is ~INR200b.
Nascent industry registered high growth till FY13 In terms of traded value, Indian commodity futures volumes have gone up from INR20.5t in FY06 to INR181.3t in FY12, a CAGR of 44%. However, this declined marginally to INR170t in FY13, and significantly further to INR101t in FY14. Exhibit 9: Volumes started declining after FY13, mainly due to CTT
Source: Company, MOSL
The market is at a relatively nascent stage, with gold, silver, crude oil, and copper being the four largest commodities traded on the Indian exchanges. For MCX, these commodities constituted 70%+ of the total traded value, with gold and silver contributing 42% to overall volumes in FY14. Introduction of CTT set off a period of decline in traded volumes MCX’s ADT is well below historical highs today, at ~INR200b. Volumes on the exchange have declined gradually. The decline at every stage has been due to different reasons. The chronology is as follows: Peak volumes at MCX coincided with the best run in prices for gold and silver.
ADT reached a high of INR625b in 2QFY12, as a result. The gradual drop in gold and silver prices in the next seven quarters resulted in
volumes settling at ~INR500b between 3QFY12 and 1QFY14. However, after commodities transaction tax (CTT) was imposed in 2QFY14,
volumes saw a hit of 45% to INR270b per day. This was due to 300%+ increase in the trading costs for prop desks, as compared to ~30% increase for the non-prop traders. Prop trades constituted 40-50% of daily volumes.
In the middle of 2QFY14, MCX’s parent, FTECH ran into a crisis, with the unfolding of the scandal in NSEL, leaving stranded sums as high as INR56b invested by various investors.
In the following three quarters, ADT declined further to INR170b-200b due to a combination of factors: [1] lack of faith on the promoter entity holding 26% (now down to 20%) shares in the exchange, [2] general sluggishness as far as
21 35 39 51 73 113 181 170 101 62
69
13 31
43 54 61
-6
-40 -39
FY06 FY07 FY08 FY09 FY10 FY11 FY12 FY13 FY14 FY15
Commodity volumes (INR t) YoY (%)
Fast-growing volumes took a knock post July 1, 2013,
when CTT became effective on non-agri commodities;
volumes declined by ~40%

MCX
19 August 2015 11
volatility in key commodities is concerned – gold, silver, copper and crude, and [3] rising interest in equities as an investment class, with the new government.
Exhibit 10: ADT is less than one-third from peak
Source: Company, MOSL
Exhibit 11: Total volume in gold traded (INR t)
Source: Company, MOSL
Exhibit 12: Total volume in silver traded (INR t)
Source: Company, MOSL
Exhibit 13: Total volume in crude traded (INR t)
Source: Company, MOSL
Exhibit 14: Total volume in copper traded (INR t)
Source: Company, MOSL
386 439
625 502 473 476 514 484 471 490
270 171 194 196 208 225 234
4QFY
11
1QFY
12
2QFY
12
3QFY
12
4QFY
12
1QFY
13E
2QFY
13
3QFY
13E
4QFY
13
1QFY
14
2QFY
14
3QFY
14
4QFY
14
1QFY
15
2QFY
15
3QFY
15
4QFY
15
Average daily turnover (INR b)
10
21 19 25
42 37
25
12
FY08 FY09 FY10 FY11 FY12 FY13 FY14 FY15
Gold
6 8 11
27
57
41
18
9
FY08 FY09 FY10 FY11 FY12 FY13 FY14 FY15
Silver
5
10 12
18
25
30
18
13
FY08 FY09 FY10 FY11 FY12 FY13 FY14 FY15
Crude
5 4
9
11
15 14
8
4
FY08 FY09 FY10 FY11 FY12 FY13 FY14 FY15
Copper

MCX
19 August 2015 12
SEBI takeover to pave way for universal exchanges Benefits: New products, new participants, higher volumes
SEBI appears to be gearing up for the Finance Minister’s proposal to merge FMC with it. The implications of the merger are significant.
Stock exchanges will be able to become universal exchanges wherein equities, debt instruments and currencies are traded under the same roof as commodity derivatives.
Among the benefits for commodities exchanges would be possibilities of new products and participants, a regulator with greater autonomy, and shift of volumes from unorganized markets to the exchanges.
Big institutional changes in India often follow big crises - The balance of payments (BoP) crisis of 1990 paved the way for radical changes in the financial system, including near autonomy to the central bank, RBI.
Electronic stock exchanges, depositories and an independent regulator for the stock market, the Securities and Exchange Board of India (SEBI) were all born in the aftermath of what became infamous as the 1992 Harshad Mehta scam.
The INR56b payment default that grounded the National Spot Exchange (NSEL) has now triggered the merger of the Forward Markets Commission with SEBI.
FMC’s merger with SEBI… The proposal to merge the Forward Markets Commission (FMC), which regulates the commodities market, with Securities and Exchange Board of India (SEBI), the stock market regulator was proposed by Finance Minister (FM), Mr Arun Jaitley in his budget 2015-16 speech. The FM had also proposed repealing the Forward Contract Regulation Act and changes in the Securities and Contract Regulation Act in the Finance Bill. After the announcement, SEBI called all commodity exchanges to make presentations. It is also building in-house expertise and making other changes.
…to pave the way for universal exchanges The implications of the merger are significant. Stock exchanges will be able to become universal exchanges wherein equities, debt instruments and currencies are traded under the same roof as commodity derivatives.
Exhibit 15: Implications of SEBI-FMC merger

MCX
19 August 2015 13
Opens avenues of new products for commodity exchanges including MCX… The changes will provide enormous opportunities: investment derivatives such as exchange traded funds for silver and other metals, weather and freight derivatives, and index futures and options trading in commodities. …along with new participants It is hoped that with time institutional investors like banks and mutual funds will also be allowed to participate in these markets, which will increase liquidity significantly, in addition to the new products. Long-awaited autonomy The merger will give a significant boost to the integrity of the commodities market. FMC was dependent on the government for finances. It is believed that the body is short staffed and technologically constrained to regulate and monitor the markets. Potential reversion from unorganized market to exchanges A Nielsen report in 2013 suggested that ‘dabba’ trading (illegal off-exchange derivatives trading) in commodities had increased 5-7x after CTT was introduced in July 2013. SEBI should be able to play an instrumental role in controlling this and to bring back the ‘dabba’ trading to the exchanges. Exhibit 16: Impact on share of options post the introduction of STT in 2005 for equity exchanges
Source: Company, MOSL
The risk – invites competition from established equity exchanges Another implication of the merger of SEBI and FMC is that stock exchanges will be able to become universal exchanges, wherein equities, debt instruments and currencies are traded under the same roof as commodity derivatives. Stock exchanges already have depositories and clearing corporations that will cater to the needs of commodity traders as well.
7.9 8.1 10.5 10.3
28.8
39.2
59.1
69.4 72.5 73.6 72.1
FY05 FY06 FY07 FY08 FY09 FY10 FY11 FY12 FY13 FY14 FY15
Options as a % of total turnover since STT

MCX
19 August 2015 14
Introduction of options to drive volumes MCX’s profits to grow disproportionately
ADT at MCX fell from INR500b to INR300b after imposition of CTT. Cost of CTT on options is negligible v/s futures – so volumes can recover 2.5x from
current levels, with options alone. Given the high operating leverage, MCX’s EBITDA margin on incremental volumes
could be 80%+.
Introduction of options should help revive volumes lost to CTT Options trading has witnessed huge potential in the global commodities markets. Globally, options contribute 40-50% of the total futures and options volumes. Introduction of options trading in India should increase commodity volumes significantly, and make available a wider range investment and hedging tools. ADT at MCX fell from INR500b to INR300b after imposition of CTT. Cost of CTT on options is negligible v/s futures – so volumes can recover 2.5x from current levels (of ~INR200b) with options alone, our base case. Exhibit 17: Prop volumes were impacted the most due to CTT Prop trader bp bp
Assumed transaction charges 0.10 0.25
Brokerage - -
Stamp duty 0.10 0.10
Service Tax and edu cess (12.24% + 2%) 0.01 0.03 Total 0.21 0.38 CTT 1.00 1.00 New cost 1.21 1.38 Increase in costs 471% 262%
Source: Company, MOSL
Exhibit 18: Cost increase for non-prop traders was disproportionately lower Non-prop trader bp bp Assumed transaction charges 0.10 0.25 Brokerage (assumed) 2.50 2.50 Stamp duty 0.10 0.10 Service Tax and edu cess (12.24% + 2%) 0.32 0.34 Total 3.02 3.19 CTT 1.00 1.00 New cost 4.02 4.19 Increase in costs 33% 31%
Source: Company, MOSL
The shift of volumes towards options was witnessed in equities too, post the introduction of securities transaction tax (STT). Such an avenue (options) in the case of commodities led to sharp decline in volumes.

MCX
19 August 2015 15
Exhibit 19: Options account for a significant share of NSE volumes
Source: MOSL
Given high operating leverage, MCX’s profits to grow disproportionately Operating leverage in the model remains significant, with the only material variable costs being 10.3% of transaction revenues, which are being paid to technology vendor as software support charges. A large share of the remaining costs is fixed, implying 80%+ EBITDA margin on incremental volumes. Appended below is the sensitivity snapshot for FY18 based on various volume growth scenarios: Exhibit 20: FY18 summary scenarios at various levels of volume CAGR Volume CAGR over FY15-18 10.0% 15% 20% 25% 30% 35% Revenue 2674 3037 3432 3861 4326 4829 EBITDA 1114 1439 1793 2178 2596 3046 EBITDA margin 41.6% 47.4% 52.3% 56.4% 60.0% 63.1% EPS 34.0 38.7 43.8 49.4 55.5 62.0 PE 32.1 28.2 24.9 22.1 19.7 17.6 Upside @ 25x target PE -22.2% -11.4% 0.4% 13.2% 27.0% 42.0%
Source: Company, MOSL
38 7 7 7 10 9
27
37
57
68 71 73
FY02 FY03 FY04 FY05 FY06 FY07 FY08 FY09 FY10 FY11 FY12 FY13 FY14
Options as a % of total turnover (equities)

MCX
19 August 2015 16
Monopoly + policy push + operating leverage See 35% volume CAGR driving 62% EBITDA over FY15-18
Our base case assumes return to pre-CTT ADT of INR500b by FY18, a CAGR of 35%. Operating leverage would drive EBIT CAGR of 85% and EBITDA CAGR of 62%. We initiate coverage on MCX with a ‘BUY’ rating; our price target is INR1,400.
Base case assumption of recovery in volumes lost to CTT… Our base case assumes that with the introduction of options, the volumes lost
to CTT will be recovered, taking the ADT to INR500b. Assuming FY18 as the first full year when this is effective, this implies volume CAGR of 35% over FY15-18.
With the introduction of other factors such as indices and new participation from FIIs and banks, there is potential upside to this number.
… to result in 62% CAGR in EBITDA over FY15-18 Given the operating leverage, the base case volume CAGR of 35% over FY15-18
drives EBITDA CAGR of 62% during this period. The corresponding EPS CAGR is 37%, mainly due to the current high contribution of other income to PBT.
Exhibit 21: Huge operating leverage at play to drive improvement in profitability… Volume CAGR over FY15-18 10.0% 15% 20% 25% 30% 35% Revenue 2674 3037 3432 3861 4326 4829 EBITDA 1114 1439 1793 2178 2596 3046 EBITDA margin 41.6% 47.4% 52.3% 56.4% 60.0% 63.1% EPS 34.0 38.7 43.8 49.4 55.5 62.0 PE 32.1 28.2 24.9 22.1 19.7 17.6 Upside @ 25x target PE -22.2% -11.4% 0.4% 13.2% 27.0% 42.0%
Source: Company, MOSL
Exhibit 22: ...lent by significantly lower growth in operating costs
Scenario - Volume growth YoY (%) Cost growth (%) EBITDA growth (%)
5% 3.8% 5.5% 10% 4.5% 17.9% 15% 5.3% 30.4% 20% 6.0% 42.8% 25% 6.7% 55.2% 30% 7.4% 67.6%
Source: Company, MOSL
Exhibit 23: NSE - An instance of non-linearity
Source: Company, MOSL
2,734 2,676 4,094 5,409 9,486 9,311 11,726 13,280 14,626 15,951 34.6
57.9
46.8
65.6
55.0 55.4 52.3
48.0 48.2
55.0
FY04 FY05 FY06 FY07 FY08 FY09 FY10 FY11 FY12 FY13
Sales (INR m) PAT % (LHS)

MCX
19 August 2015 17
Initiating coverage with Buy rating Globally, the average multiple of exchanges in emerging markets is ~20x. We
believe there is a case for MCX to command a premium to that median, given [1] scope to outgrow peer exchanges globally, as the potential is still untapped in India, and [2] near-monopolistic market share, to which there is little threat.
At 25x FY18E earnings discounted by 15% for 1-year forward target, we arrive at a price target of INR1,400. We initiate coverage with a Buy rating.
Exhibit 24: Valuation snapshot
Sales EBITDA % PAT % PE EV/EBITDA
Exchange CY14 CY15 CY16 CY14 CY15 CY16 CY14 CY15 CY16 CY14 CY15 CY16 CY14 CY15 CY16
Intercontinental Exchange In 3,275 3,375 3,573 58 66 71 31 39 42 22 17 14 14 12 11
Multi Commodity Exch India 4,400 3,947 5,166 49 57 51 32 35 32 31 31 26 13 13 11
Cboe Holdings Inc 597 647 700 58 60 62 31 32 33 23 20 18 12 11 9 London Stock Exchange Group 1,163 1,275 1,348 47 48 50 24 25 27 19 17 15 11 10 9 Asx Ltd 660 700 739 77 77 78 58 58 59 18 17 16 12 11 10 Singapore Exchange Ltd 703 761 840 62 62 64 47 47 49 23 20 18 15 14 12 Hong Kong Exchanges & Clear 9,946 11,844 13,236 69 72 75 53 56 57 34 28 25 20 16 14 Bursa Malaysia Bhd 490 533 580 60 60 61 39 40 40 22 20 18 10 10 9 Cme Group Inc 3,032 3,345 3,649 64 66 69 36 37 39 23 20 17 13 12 10
Key risk – increased competition from equity exchanges One of the implications of FMC’s merger with SEBI is that stock exchanges will be able to become universal exchanges, where equities, debt instruments and currencies are traded under the same roof as commodity derivatives. Stock exchanges already have depositories and clearing corporations that will cater to the needs of commodity traders as well. If NSE enters the commodities segment, MCX could see stiff competition, which may impair both market share and profit margins.

MCX
19 August 2015 18
Current leadership Exhibit 25: The new leadership team
Board of Directors Designation
Satyananda Mishra, IAS (Retd.) Chairman, Independent Director, FMC Approved
Dinesh Kumar Mehrotra Independent Director, FMC Nominated
Pravin Tripathi Independent Director, FMC Nominated
G Anantharaman, IRS (Retd.) Independent Director, FMC Approved
Arun Nanda Independent Director, FMC Nominated
R. Amalorpavanathan Shareholder Director, Bank of Baroda
S K Mitra Independent Director, FMC Nominated
MAK Prabhu Shareholder Director, Canara Bank
Ajai Kumar Shareholder Director
Parveen Kumar Singhal Joint Managing Director, MCX
Source: Company, MOSL
Exhibit 26: Management Leadership
Name Designation
Parveen Kumar Singhal Executive Vice President
Ajay Puri Company Secretary & Chief Compliance Officer
Sandeep Kumar Sarawgi Chief Financial Officer
PP Kaladharan Senior VP, Technology
JB Ram Senior VP, Membership & Inspection, IG & Arbitration
Dr Raghavendra Prasad Senior VP, Legal
Ramalingam M Senior VP, Market Operations
Narendra Kumar Ahlawat Senior VP, Market Operations
Rajendra Gogate VP, Administration
The overhaul in leadership and ownership should do
away with any governance concerns – a key positive

MCX
19 August 2015 19
Key takeaways from PWC’s special audit Weak compliance; decisions taken by FTECH
MCX continued to operate with close participation from FTECH’s senior management subsequent to the listing of the exchange, as well.
There appears to be participation of FTECH’s representatives in various areas of vendor management – selection of vendors / service providers, finalization of contracts, approval of invoices and payments. In certain instances, it appears that key management personnel at MCX may have only executed decisions taken by the senior management of FTECH.
Of the related parties, select entities were identified as being members and / or clients who have traded on the MCX platform over the years. Specific abnormal patterns have been noted in trades performed by these entities such as wash trades. The regulators in India prohibit trading by related parties or trades which demonstrate patterns such as wash trades on exchange platforms.
There were several modifications and amendments to various terms and conditions in related party agreements of MCX, for which MCX was unable to demonstrate the business rationale, as these were not supported by any underlying cost-benefit analysis or validation from respective business users. Many of the modifications and amendments led to net cash outflows from MCX to related parties.
It appears that the senior management of FTECH played a significant role in decisions pertaining to the commercial terms between MCX and other group companies. In various instances, key management personnel of MCX such as Ex CFO, Head – IT, Ex Chief Compliance Officer stated that decisions were directly taken by and instructions received from the “Chairman’s Office” [FTECH] or the “MD & CEO’s Office” [MCX].
Individuals who were members of the key decision making forums at MCX, the Board of Directors, Director’s Committee and Information Systems Steering Committee had also been key management persons in FTECH or had held current / past dictatorships in group companies.
MCX emerged as a significant customer for FTECH by driving ~25% of FTECH’s revenues in the preceding years. Despite this, it does not seem that MCX was able to enjoy adequate bargaining power against FTECH at the time of negotiating technology support and business support agreements. Contractual terms and conditions appear to be beneficial to FTECH. MCX appears to be contractually bound to FTECH for an unprecedented long tenure of 33-50 years with a provision of automatic renewal for up to two similar terms.
Some of these contracts have defined significant financial penalty for MCX in case it wants to terminate these contracts.
MCX procured hardware through FTECH at an added mark-up of 20-32%. It is not clear whether FTECH played the role of intermediary between hardware vendor and MCX or whether it indeed contributed towards any value addition to the product to be able to earn a mark-up.
MCX was one of the few profit making businesses of the FT group, and accordingly, FTECH allocated costs towards MCX for group level of marketing spend in excess proportions.

MCX
19 August 2015 20
MCX paid ~INR550m to vendors, whose physical existence could not be established. Transactions in whole or in part with certain vendors appear questionable.
The alerts system installed by MCX for surveillance had critical alerts, which were not enabled.
The review identified 14,131 instances of trade aggregating to INR18.6b, where the same party placed buy and sell orders within 60 seconds of each other, resulting in no change in position. Additionally, in 1,565 instances aggregating INR11.8b, the buyer and seller were part of same group of companies that placed orders within 5 seconds of each other, resulting in no change of position within the group.
Two members, who were debarred by SEBI in July 2006, continued to trade on MCX between September 2006 and December 2011 even though FMC had issued a circular mandating that members debarred by other exchanges should not be allowed to trade on commodity exchanges. One of them was a member with highest turnover on MCX in 2004.

MCX
19 August 2015 21
Financials and valuations
Income statement (INR Million) Y/E March FY12 FY13 FY14 FY15 FY16E FY17E FY18E Sales 5,262 4,992 3,197 2,038 2,323 3,558 4,783 Change (%) 42.6 (5.1) (35.9) (36.3) 14.0 53.2 34.4
Cost of Services 1,036 1,072 935 733 769 924 1,074 SG&A Expenses 879 987 1,014 616 659 691 726 Provisions
EBITDA 3,347 2,932 1,248 689 895 1,943 2,983 % of Net Sales 63.6 58.7 39.0 33.8 38.5 54.6 62.4 Depreciation 272 307 343 259 244 236 231 Interest 0 0 11 14 0 - - Other Income 1,027 1,427 1,202 1,285 1,251 1,361 1,479 EO Item (net) 142 - - - 594 - -
PBT 3,960 4,051 2,097 1,701 1,307 3,068 4,231 Tax 1,098 1,065 569 450 494 736 1,019 Rate (%) 27.7 26.3 27.1 26.5 37.8 24.0 24.1 PAT 2,862 2,986 1,528 1,251 814 2,331 3,213 Extraordinary
Net Income 2,862 2,986 1,528 1,251 814 2,331 3,213 Change (%) 65.6 4.4 (48.8) (18.1) (34.9) 186.5 37.8
Balance Sheet (INR Million) Y/E March FY12 FY13 FY14 FY15 FY16E FY17E FY18E Share Capital 508 510 510 510 510 510 510 Reserves 9,461 11,058 10,931 11,512 12,193 13,316 14,870 Net Worth 9,969 11,567 11,441 12,022 12,703 13,826 15,380 SGF
1,720 1,871 1,871 1,871 1,871
Loan & other long term liab. 432 569 449 343 343 343 343 Capital Employed 10,401 12,136 13,610 14,236 14,917 16,040 17,595
Net Block 1,369 2,044 1,735 1,552 1,508 1,471 1,440 CWIP 1 - - - - - - Other LT Assets 1,907 531 281 281 281 281 281 Investments 2,208 1,481 132 132 132 132 132
Curr. Assets 13,274 13,802 15,267 16,278 17,022 18,547 20,324 Current Investments 9,294 9,201 10,766 12,795 12,795 12,795 12,795 Debtors 514 69 90 107 124 176 236 Cash & Bank Balance 3,124 3,475 3,417 2,655 3,238 4,356 5,654 Loans & Advances 283 530 676 456 553 780 1,049 Other Current Assets 59 525 319 265 312 440 591 Current Liab. & Prov 8,358 5,721 3,805 4,007 4,026 4,391 4,583 Net Current Assets 4,916 8,080 11,462 12,271 12,996 14,156 15,741
Application of Funds 10,401 12,136 13,610 14,236 14,917 16,040 17,595 E: MOSL Estimates

MCX
19 August 2015 22
Financials and valuations
Ratios Y/E March FY12 FY13 FY14 FY15 FY16E FY17E FY18E Basic (INR)
EPS 56.1 58.6 30.0 24.6 14.7 43.4 60.1 Cash EPS 61.4 64.6 36.9 29.6 19.5 48.1 64.6 Book Value 195.5 226.8 225.4 235.8 249.8 271.9 302.5 DPS 24.0 0.5 10.2 - 14.3 20.4 30.6 Payout % 50.0 0.9 39.0 6.9 115.6 55.7 60.3
Valuation (x)
P/E 19.4 18.6 36.3 44.3 74.4 25.1 18.1 Cash P/E 17.7 16.9 29.6 36.8 56.0 22.7 16.9 EV/EBITDA 13.0 14.8 33.2 58.6 47.9 21.2 13.2 EV/Sales 8.3 8.7 13.0 19.8 17.1 10.8 7.8 Price/Book Value 5.6 4.8 4.8 4.6 4.4 4.0 3.6 Dividend Yield (%) 2.6 0.1 1.1 0.2 1.6 2.2 3.3
Profitability Ratios (%)
RoE 31.0 27.7 13.3 10.7 6.0 16.6 20.9 RoCE 24.8 26.5 12.8 10.4 10.5 16.2 20.4
Turnover Ratios
Debtors (Days) 35.7 5.1 10.3 19.1 19.6 18.0 18.0 Fixed Asset Turnover (x) 31.2 27.3 18.1 11.4 12.5 18.1 22.4
Cash Flow Statement (INR Million) Y/E March FY12 FY13 FY14 FY15 FY16E FY17E FY18E CF from Operations 1,600 2,470 1,949 469 745 1,452 2,201 Cash for Working Capital 1,160 (1,941) (1,565) 503 (143) (42) (287) Net Operating CF 2,760 529 385 972 602 1,410 1,913
Net Purchase of FA (200) (462) (59) (9) (200) (200) (200) Free Cash Flow 2,561 68 325 963 402 1,210 1,713 Net Purchase of Invest. (2,723) 1,910 586 (1,080) 1,158 993 1,086 Net Cash from Invest. (2,923) 1,448 527 (1,089) 958 793 886 Dividend Payments (296) (2,134) (1,133) - (658) (1,085) (1,502) Cash Flow from Fin. (296) (2,134) (1,133) - (658) (1,085) (1,502) Others 273
- -
Net Cash Flow (186) (156) (221) (117) 902 1,118 1,298
Opening Cash Bal. 3,310 3,124 3,475 3,417 2,655 3,238 4,356 Add: Net Cash (186) (156) (221) (117) 902 1,118 1,298 Closing Cash Bal. 3,124 2,968 3,255 3,300 3,558 4,356 5,654
MCX
19 August 2015 23
N O T E S

MCX
19 August 2015 24
Disclosures This document has been prepared by Motilal Oswal Securities Limited (hereinafter referred to as Most) to provide information about the company(ies) and/sector(s), if any, covered in the report and may be distributed by it and/or its affiliated company(ies). This report is for personal information of the selected recipient/s and does not construe to be any investment, legal or taxation advice to you. This research report does not constitute an offer, invitation or inducement to invest in securities or other investments and Motilal Oswal Securities Limited (hereinafter referred as MOSt) is not soliciting any action based upon it. This report is not for public distribution and has been furnished to you solely for your general information and should not be reproduced or redistributed to any other person in any form. This report does not constitute a personal recommendation or take into account the particular investment objectives, financial situations, or needs of individual clients. Before acting on any advice or recommendation in this material, investors should consider whether it is suitable for their particular circumstances and, if necessary, seek professional advice. The price and value of the investments referred to in this material and the income from them may go down as well as up, and investors may realize losses on any investments. Past performance is not a guide for future performance, future returns are not guaranteed and a loss of original capital may occur.
MOSt and its affiliates are a full-service, integrated investment banking, investment management, brokerage and financing group. We and our affiliates have investment banking and other business relationships with a some companies covered by our Research Department. Our research professionals may provide input into our investment banking and other business selection processes. Investors should assume that MOSt and/or its affiliates are seeking or will seek investment banking or other business from the company or companies that are the subject of this material and that the research professionals who were involved in preparing this material may educate investors on investments in such business. The research professionals responsible for the preparation of this document may interact with trading desk personnel, sales personnel and other parties for the purpose of gathering, applying and interpreting information. Our research professionals are paid on the profitability of MOSt which may include earnings from investment banking and other business.
MOSt generally prohibits its analysts, persons reporting to analysts, and members of their households from maintaining a financial interest in the securities or derivatives of any companies that the analysts cover. Additionally, MOSt generally prohibits its analysts and persons reporting to analysts from serving as an officer, director, or advisory board member of any companies that the analysts cover. Our salespeople, traders, and other professionals or affiliates may provide oral or written market commentary or trading strategies to our clients that reflect opinions that are contrary to the opinions expressed herein, and our proprietary trading and investing businesses may make investment decisions that are inconsistent with the recommendations expressed herein. In reviewing these materials, you should be aware that any or all of the foregoing among other things, may give rise to real or potential conflicts of interest. MOSt and its affiliated company(ies), their directors and employees and their relatives may; (a) from time to time, have a long or short position in, act as principal in, and buy or sell the securities or derivatives thereof of companies mentioned herein. (b) be engaged in any other transaction involving such securities and earn brokerage or other compensation or act as a market maker in the financial instruments of the company(ies) discussed herein or act as an advisor or lender/borrower to such company(ies) or may have any other potential conflict of interests with respect to any recommendation and other related information and opinions.; however the same shall have no bearing whatsoever on the specific recommendations made by the analyst(s), as the recommendations made by the analyst(s) are completely independent of the views of the affiliates of MOSt even though there might exist an inherent conflict of interest in some of the stocks mentioned in the research report Reports based on technical and derivative analysis center on studying charts company's price movement, outstanding positions and trading volume, as opposed to focusing on a company's fundamentals and, as such, may not match with a report on a company's fundamental analysis. In addition MOST has different business segments / Divisions with independent research separated by Chinese walls catering to different set of customers having various objectives, risk profiles, investment horizon, etc, and therefore may at times have different contrary views on stocks sectors and markets.
Unauthorized disclosure, use, dissemination or copying (either whole or partial) of this information, is prohibited. The person accessing this information specifically agrees to exempt MOSt or any of its affiliates or employees from, any and all responsibility/liability arising from such misuse and agrees not to hold MOSt or any of its affiliates or employees responsible for any such misuse and further agrees to hold MOSt or any of its affiliates or employees free and harmless from all losses, costs, damages, expenses that may be suffered by the person accessing this information due to any errors and delays. The information contained herein is based on publicly available data or other sources believed to be reliable. Any statements contained in this report attributed to a third party represent MOSt’s interpretation of the data, information and/or opinions provided by that third party either publicly or through a subscription service, and such use and interpretation have not been reviewed by the third party. This Report is not intended to be a complete statement or summary of the securities, markets or developments referred to in the document. While we would endeavor to update the information herein on reasonable basis, MOSt and/or its affiliates are under no obligation to update the information. Also there may be regulatory, compliance, or other reasons that may prevent MOSt and/or its affiliates from doing so. MOSt or any of its affiliates or employees shall not be in any way responsible and liable for any loss or damage that may arise to any person from any inadvertent error in the information contained in this report. MOSt or any of its affiliates or employees do not provide, at any time, any express or implied warranty of any kind, regarding any matter pertaining to this report, including without limitation the implied warranties of merchantability, fitness for a particular purpose, and non-infringement. The recipients of this report should rely on their own investigations.
This report is intended for distribution to institutional investors. Recipients who are not institutional investors should seek advice of their independent financial advisor prior to taking any investment decision based on this report or for any necessary explanation of its contents.
Most and it’s associates may have managed or co-managed public offering of securities, may have received compensation for investment banking or merchant banking or brokerage services, may have received any compensation for products or services other than investment banking or merchant banking or brokerage services from the subject company in the past 12 months. Most and it’s associates have not received any compensation or other benefits from the subject company or third party in connection with the research report. Subject Company may have been a client of Most or its associates during twelve months preceding the date of distribution of the research report
MOSt and/or its affiliates and/or employees may have interests/positions, financial or otherwise of over 1 % at the end of the month immediately preceding the date of publication of the research in the securities mentioned in this report. To enhance transparency, MOSt has incorporated a Disclosure of Interest Statement in this document. This should, however, not be treated as endorsement of the views expressed in the report.
Motilal Oswal Securities Limited is registered as a Research Analyst under SEBI (Research Analyst) Regulations, 2014. SEBI Reg. No. INH000000412
There are no material disciplinary action that been taken by any regulatory authority impacting equity research analysis activities
Analyst Certification The views expressed in this research report accurately reflect the personal views of the analyst(s) about the subject securities or issues, and no part of the compensation of the research analyst(s) was, is, or will be directly or indirectly related to the specific recommendations and views expressed by research analyst(s) in this report. The research analysts, strategists, or research associates principally responsible for preparation of MOSt research receive compensation based upon various factors, including quality of research, investor client feedback, stock picking, competitive factors and firm revenues
Disclosure of Interest Statement MCX Analyst ownership of the stock No Served as an officer, director or employee No
A graph of daily closing prices of securities is available at www.nseindia.com and http://economictimes.indiatimes.com/markets/stocks/stock-quotes
Regional Disclosures (outside India) This report is not directed or intended for distribution to or use by any person or entity resident in a state, country or any jurisdiction, where such distribution, publication, availability or use would be contrary to law, regulation or which would subject MOSt & its group companies to registration or licensing requirements within such jurisdictions.
For U.S. Motilal Oswal Securities Limited (MOSL) is not a registered broker - dealer under the U.S. Securities Exchange Act of 1934, as amended (the"1934 act") and under applicable state laws in the United States. In addition MOSL is not a registered investment adviser under the U.S. Investment Advisers Act of 1940, as amended (the "Advisers Act" and together with the 1934 Act, the "Acts), and under applicable state laws in the United States. Accordingly, in the absence of specific exemption under the Acts, any brokerage and investment services provided by MOSL, including the products and services described herein are not available to or intended for U.S. persons.
This report is intended for distribution only to "Major Institutional Investors" as defined by Rule 15a-6(b)(4) of the Exchange Act and interpretations thereof by SEC (henceforth referred to as "major institutional investors"). This document must not be acted on or relied on by persons who are not major institutional investors. Any investment or investment activity to which this document relates is only available to major institutional investors and will be engaged in only with major institutional investors. In reliance on the exemption from registration provided by Rule 15a-6 of the U.S. Securities Exchange Act of 1934, as amended (the "Exchange Act") and interpretations thereof by the U.S. Securities and Exchange Commission ("SEC") in order to conduct business with Institutional Investors based in the U.S., MOSL has entered into a chaperoning agreement with a U.S. registered broker-dealer, Motilal Oswal Securities International Private Limited. ("MOSIPL"). Any business interaction pursuant to this report will have to be executed within the provisions of this chaperoning agreement.
The Research Analysts contributing to the report may not be registered /qualified as research analyst with FINRA. Such research analyst may not be associated persons of the U.S. registered broker-dealer, MOSIPL, and therefore, may not be subject to NASD rule 2711 and NYSE Rule 472 restrictions on communication with a subject company, public appearances and trading securities held by a research analyst account.
For Singapore Motilal Oswal Capital Markets Singapore Pte Limited is acting as an exempt financial advisor under section 23(1)(f) of the Financial Advisers Act(FAA) read with regulation 17(1)(d) of the Financial Advisors Regulations and is a subsidiary of Motilal Oswal Securities Limited in India. This research is distributed in Singapore by Motilal Oswal Capital Markets Singapore Pte Limited and it is only directed in Singapore to accredited investors, as defined in the Financial Advisers Regulations and the Securities and Futures Act (Chapter 289), as amended from time to time. In respect of any matter arising from or in connection with the research you could contact the following representatives of Motilal Oswal Capital Markets Singapore Pte Limited: Kadambari Balachandran Email : [email protected] Contact : (+65) 68189233 / 65249115 Office Address : 21 (Suite 31),16 Collyer Quay,Singapore 04931
Motilal Oswal Securities Ltd
Motilal Oswal Tower, Level 9, Sayani Road, Prabhadevi, Mumbai 400 025 Phone: +91 22 3982 5500 E-mail: [email protected]


