66
RECOMMENDA TIONS FOR MICHIGAN SPECIFIC LOAD AND RESISTANCE FACTOR DESIGlV LOADS AND LOAD AND RESISTANCE FACTOR RATING PROCEDURES I ++ OMDOT Michigan Department of Transportation

RECOMMENDA TIONS FOR MICHIGAN SPECIFIC LOAD AND RESISTANCE FACTOR DESIGlV LOADS AND LOAD AND RESISTANCE FACTOR RATING
PROCEDURES I ++ OMDOT Michigan Department of Transportation

Technical Report Documentation Page 1. Report No. R-1511
2. Government Accession No.
3. MDOT Project Manager 5. Report Date April 2008
4. Title and Subtitle Recommendations for Michigan Specific Load and Resistance Factor Design Loads and Load and Resistance Factor Rating Procedures
6. Performing Organization Code
7. Author(s) Rebecca Curtis, P.E., and Roger Till, P.E.
8. Performing Org. Report No. 10. Work Unit No. (TRAIS) 11. Contract No.
9. Performing Organization Name and Address Michigan Department of Transportation Construction and Technology Division P.O. Box 30049 Lansing, MI 48909
11(a). Authorization No. 13. Type of Report & Period Covered Final Report, 3/07-3/08
12. Sponsoring Agency Name and Address Michigan Department of Transportation Construction and Technology Division P.O. Box 30049 Lansing, MI 48909 14. Sponsoring Agency Code
15. Supplementary Notes 16. Abstract The Load and Resistance Factor Rating (LRFR) code for load rating bridges and Load and Resistance Factor Design (LRFD) code for designing bridges are based on factors calibrated from structural load and resistance statistics to achieve a more uniform level of reliability for all bridges. The live load factors in the LRFR code are based on load data thought to be representative of heavy truck traffic nationwide. However, the code allows for recalibrating live load factors for a jurisdiction if weigh-in-motion data are available. The Michigan Department of Transportation anticipates implementing customized live load factors based on the analysis described in this report. Additional clarifications are made regarding gross vehicle weight to use for determining the live load factor and loading configurations for use with the LRFR code. The revised LRFD live load factors and other LRFR recommendations are compared to the HL-93 loading and recommendations are made to meet the operational needs of the Michigan Department of Transportation. 17. Key Words LRFR, LRFD, HL-93, Load Rating, Live Load, Load Factors, Legal Load, Overload, Permit Load
18. Distribution Statement No restrictions. This document is available to the public through the Michigan Department of Transportation.
19. Security Classification - report Unclassified
20. Security Classification - page Unclassified
21. No. of Pages 64
22. Price

MICHIGAN DEPARTMENT OF TRANSPORTATION
MDOT
Recommendations for Michigan Specific Load and
Resistance Factor Design Loads and Load and Resistance Factor Rating Procedures
Rebecca Curtis, P.E. and Roger Till, P.E.
Structural Section Construction and Technology Division
Research Report R-1511
Michigan Transportation Commission
Ted B. Wahby, Chairman Linda Miller Atkinson, Vice Chairwoman
Maureen Miller Brosnan, Jerrod Jung James R. Rosendall, James S. Scalici
Kirk T. Steudle, Director Lansing, Michigan
April 2008

The information contained in this report was compiled exclusively for the use of the Michigan Department of Transportation. Recommendations contained herein are based upon the research data obtained and the expertise of the researchers, and are not necessarily to be construed as Department policy. No material contained herein is to be reproduced-wholly or in part-without the expressed permission of the Engineer of Construction and Technology.
i
TABLE OF CONTENTS Page Executive Summary ..................................................................................................................... ii Action Plan.................................................................................................................................. iii 1.0 Introduction.......................................................................................................................1 2.0 Background.......................................................................................................................1 3.0 Load Rating.......................................................................................................................2 4.0 Federal Ratings – Inventory and Operating ......................................................................2 5.0 Axle Weights on the Bridge Affects the Load Factor.......................................................3 6.0 Michigan Legal Load Ratings – Legal Vehicles...............................................................4 7.0 Overload Classification – Overload Permit Vehicles .......................................................6 8.0 Load Factor Design (LFD) HS-25 versus Load Factor Rating (LFR) Legal and Operating Loads...............................................................................................7 9.0 LRFR – Recommended Refinements ...............................................................................8 10.0 LRFD – Recommended Modifications...........................................................................18 11.0 Long Span/Continuous Span Loadings...........................................................................20 12.0 Cost Impact .....................................................................................................................22 13.0 Future Research Needs ...................................................................................................22 14.0 Recommendations...........................................................................................................22 References...................................................................................................................................24 Appendices..................................................................................................................................26
ii
EXECUTIVE SUMMARY The Load and Resistance Factor Rating (LRFR) code for load rating bridges and Load and Resistance Factor Design (LRFD) code for designing bridges are based on factors calibrated from structural load and resistance statistics to achieve a more uniform level of reliability for all bridges. The live load factors in the LRFR code are based on load data thought to be representative of heavy truck traffic nationwide. However, the code allows for recalibrating live load factors for a jurisdiction if weigh-in-motion data are available. The Michigan Department of Transportation anticipates implementing customized live load factors based on the analysis described in this report. Additional clarifications are made regarding gross vehicle weight to use for determining the live load factor and loading configurations for use with the LRFR code. The revised LRFD live load factors and other LRFR recommendations are compared to the HL-93 loading and recommendations are made to meet the operational needs of the Michigan Department of Transportation.

iii
ACTION PLAN Engineering Operations Committee
• Approve Report R-1511, Recommendations for Michigan Specific Load and Resistance Factor Design Loads and Load and Resistance Factor Rating Procedures.
Design Division – Structures Section
• Implement the LRFD HL-93-mod loading that replaces the 25-kip tandem axle with a single 60-kip axle and adds a 1.2 factor to the lane and maximum of the truck or axle loading.
Bridge Operations Section
• Rate LRFR structures according to the modifications given in R-1511 including the modified live load factors and loading configurations.
• Engage a university consultant to review current practice and recommend a loading procedure for spans greater than 200 feet based on a reliability method. This issue is already an approved State Planning and Research (SPR) project.
Structural Section
• Research and recommend a method for adjusting Permit Loads for gage widths greater than 6 feet in a manner that would provide consistent results regardless of the method of rating of the structure (LFR or LRFR).
• Investigate loading scenarios and recommend method of rating of decks for Overloads and Superloads.

1
1.0 INTRODUCTION The Load and Resistance Factor Rating (LRFR) code for load rating bridges and Load and Resistance Factor Design (LRFD) Code for designing bridges are based on factors calibrated from structural load and resistance statistics to achieve a more uniform level of reliability for all bridges. The live load factors in the LRFR code are based on load data thought to be representative of heavy truck traffic nationwide. However, the code allows for recalibrating live load factors for a jurisdiction if weigh-in-motion (WIM) data are available. The Michigan Department of Transportation (MDOT) anticipates implementing customized live load factors based on the analysis described in this report. Additional clarifications are made regarding gross vehicle weight to use for determining the live load factor and loading configurations for use with the LRFR code. More than 30,000 Overweight Permits have been issued each year since 2002, providing a vital service to Michigan’s economy. The revised LRFD live load factors and other LRFR recommendations are compared to the HL-93 loading and recommendations are made to meet the operational needs of the Michigan Department of Transportation and our motorists. 2.0 BACKGROUND A number of changes have been instituted in the bridge design/load rating community. In 2000, the American Association of State Highway and Transportation Officials (AASHTO) and the Federal Highway Administration (FHWA) set a transition date of October 1, 2007 after which all new bridges that states initiate preliminary engineering shall be designed by the Load and Resistance Factor Design (LRFD) Specifications. While FHWA created a sample LRFD Implementation Plan to aid states in adopting the new specifications, the document did not mention comparing structures designed by LRFD to Load and Resistance Factor Rating (LRFR). While the FHWA does not intend to mandate re-rating existing and valid bridge load ratings by LRFR, they are requiring that beginning in 2010, all structures designed by LRFD must also be rated using LRFR.
The standard resource for bridge load rating according to LFR is the Manual for Condition Evaluation of Bridges1, while the LRFR resource is the Guide Manual for Condition Evaluation and Load and Resistance Factor Rating of Highway Bridges (Guide Manual)2. The two manuals are currently being combined into a new reference, the Manual for Bridge Evaluation (MBE). This reference is scheduled to be released in 2008 by AASHTO. A preliminary version of the MBE is referenced in this report.
Michigan legal loads are greater than the AASHTO legal loads that were used in the development of the AASHTO Standard Specifications for Highway Bridges and LRFD codes. The AASHTO Legal Loads are also used as the legal load of numerous states. Because of this, Michigan has, in the past, adjusted the AASHTO design truck to account for the heavier loads.
1 Manual for Condition Evaluation of Bridges, Second Edition, AASHTO. 2 Guide Manual for Condition Evaluation and Load and Resistance Factor Rating of Highway Bridges, First Edition with 2005 Interim Revisions, AASHTO.

2
The HS-25 truck was derived by multiplying the axle loads of the AASHTO HS-20 truck by 1.25. The HS-20 truck has axle weights of 8,000 pounds, 32,000 pounds, and 32,000 pounds for a total truck weight of 72,000 pounds or 36 tons. However, in Michigan, legal loads can weigh as much as 164,000 pounds or 82 tons, spread over 11 axles. 3.0 LOAD RATING The operational ratings used by MDOT can be separated into 3 categories: Federal Ratings, Michigan Legal Loads and Overload Classification. In general, the Federal Ratings are for informational purposes only in order to provide FHWA with a common reference point for comparing structures within a state and across the country, and do not directly measure the operational capacity of a structure in Michigan. The Legal Loads and Overload Classifications are the items that have a direct impact on motorists and industry. A number of assumptions have been made in this report. They are:
• The bridges rated using LRFR were designed by LRFD. • The future wearing surface “allowance” in LRFD has been placed at the time of the
operational ratings. • The Average Daily Truck Traffic (ADTT) in one direction of the structures is greater
than 5000, as this would apply to freeway structures that would generally also be carrying the heaviest loads.
• The structure is designed as efficiently as possible (meaning that no reserve capacity is available).
4.0 FEDERAL RATINGS - INVENTORY AND OPERATING The MBE refers to the Federal Inventory and Operating Ratings as the “Design Load Rating” (6A.1.7.1)3. This rating is “a measure of the performance of existing bridges to current LRFD bridge design standards” in “its present as-inspected condition”. This analysis screens bridges for the strength and service limit designs. Table 1 in this report is taken from Table 6A.4.3.2.2-14 of the MBE.
Table 1 Design-Load Rating Live Load Factors for
the Strength I Limit State Evaluation Level Load Factor Inventory 1.75 Operating 1.35
As the structure would have been designed for the loading and load factors required at the Federal Inventory Level, this rating factor would be a minimum of 1. Most likely, due to choosing standard sizes and other engineering decisions, this rating would be greater than one. The Federal Operating Rating would then be 1.3, regardless of whether strength or service limit states controlled. 3 Section 6.1.7.1 in the “Guide Manual for Condition Evaluation and Load and Resistance Factor Rating (LRFR) of Highway Bridges” (Guide Manual). 4 Table 6-4 in the Guide Manual.

3
Even if MDOT adopts a design loading greater than HL-93, the Federal Inventory and Operating Ratings must be calculated at the HL-93 level in order to be consistent with national standards. This report recommends that the calculation of Federal Inventory and Operating Ratings remains at the unmodified HL-93 loading using load factors identified in the MBE Table 6A.4.3.2.2-1. 5.0 AXLE WEIGHTS ON THE BRIDGE AFFECTS THE LOAD FACTOR In the MBE5, the load rating of permits has been calibrated to provide a uniform and acceptable level of reliability for these heavy vehicles. The live load distribution for LRFR is based upon the simultaneous side-by-side presence of two equally heavy vehicles in each lane. The authors of the LRFR method found this to be conservative. The load factors for permit trucks were lowered to account for the permit vehicle in one lane and simultaneous heavy, non-permit trucks in the other available lanes. For an ADTT of 5000 or greater, one way, the lower bound of the permit truck is set to 100-kips with a live load factor of 1.8 to match with legal loads. As the weight of the permit truck increases to 150-kips, the live load factor is linearly interpolated to 1.3. Vehicles with a gross vehicle weight greater than 150-kips use a constant live load factor of 1.3. One complication in the MBE6 is that only the axle weights on the bridge can be included in the interpolation of permit load factors, and therefore shorter spans do not get the full benefit of this reduction. This would require close inspection to get the true maximum combination of moment and load factor based on axle placement, weight on the span, and resultant load factor. This check is designed for short spans where a small group of axles and not the entire vehicle would control the loading. It is possible that a 50-kip truck could have a 20-kip tandem axle that exceeds the calculated capacity of a structure when using the 1.8 live load factor. Now consider a second vehicle that also has a 20-kip tandem axle that is isolated from the other axles on the truck. If the total weight of the vehicle was 150-kip, the live load factor would be reduced to 1.3. The heavier truck, although it creates the same force effect on the structure as the smaller vehicle, would be allowed to pass as the live load factor is reduced. The authors of the MBE considered this situation to be unreasonable, and added the axle weight restriction. Michigan requires the analysis of twenty-eight vehicles for legal loading. The AASHTO legal load rating includes only three vehicles (and possibly the Notional Rating Load from the proposed MBE). An additional twenty vehicles are analyzed to find the Overload Classification. The number of trucks is an acknowledgement of the unique loading situation in Michigan. This increased level of detail from the standard, on which the code is based, addresses the concern of restricting the structure for axle weights on smaller structures and for identifying the Overload Classification used in evaluating routine permit loads. Load Posting and Overload Classification are all-or-nothing situations, where the amount by which each truck passes the limit (a Rating Factor of 1.0) does not impact the final result. As long as the rule is satisfied for all vehicles, RF≥1.0, the trucks of those types and Gross Vehicle Weight (GVW) or less are allowed to pass over the structure. When a structure does require posting, it is possible that certain heavy vehicles may be affected by this check, as 1, 2 and 3-unit vehicles are separated for signing. 5 Subsection 6A.4.5.4.2 in the MBE and Subsection 6.4.5.4.2 in the Guide Manual. 6 Table 6A.4.5.4.2.1-1 in the MBE and Table 6-6 2 in the Guide Manual.

4
If any of the rating factors for the vehicles in the Permit Class are less than 1.0, then the entire Overload Classification drops until the rating factors for all twenty vehicles are greater than or equal to 1.0. In certain cases, vehicles with axle weights or gross vehicle weights in excess of the overload classifications are required for transport of goods. These vehicles are referred to as “Superloads” and require analysis of the specific vehicle, weights, and structure. For Superload situations the axle weights may affect the final result. This report recommends the following:
1. MDOT base the load factor on the GVW for a standard analysis. 2. MDOT base the load factor on the portion of the vehicle on the span for Load
Postings and Superload analyses. 6.0 MICHIGAN LEGAL LOAD RATINGS – LEGAL VEHICLES According to the MBE7 subsection 6A.4.3.1:
Bridges that pass HL-93 screening at the Inventory level will have adequate capacity for all AASHTO legal loads and State legal loads that fall within the exclusion limits described in the AASHTO LRFD Bridge Design Specifications.
The exclusion vehicles are shown in Appendix A. The Michigan Legal Loads are shown in Appendix B. Designated Loading will be used to compare Michigan Legal Loads with the LRFR Legal Load Ratings. According to the MBE8 subsection 6A.2.3.1:
State legal loads significantly heavier than the AASHTO legal loads should be load rated using the load factors specified for routine permits in this Manual, if the span has sufficient capacity for AASHTO legal loads.
In practice, the routine permit vehicles are treated differently than legal loads by the MBE when the GVW exceeds 100-kips. This is the threshold for modifying the live load factor. Table 2 summarizes the Michigan Legal Loads that are greater than 100-kips. While the Gross Vehicle Weight of some of the Exclusion Vehicles approaches the maximum of the Michigan Legal Loads (149.0-kip versus 154-kip), the load is spread over a much longer vehicle (73 feet versus 49.5 feet) in the exclusion case. As shown, a number of the 2 and 3-unit trucks exceed the effects of the Exclusion Vehicles, with ratios as high as 1.34.
7 Subsection 6.4.3.1 in the Guide Manual. 8 Subsection 6.2.3.1 in the Guide Manual.

5
Table 2 Ratio of Unfactored MI Legal Load Truck Moment with Impact to
Unfactored HL93 loading or Exclusion Truck with Impact Span Michigan Truck Number (ft) #6 #7 #12 #13 #14 #15 #16 #17 #18 #21 #22 #23 #25 30 - - - - - - 1.01 1.04 1.04 - - - - 40 - - - - - - 1.05 1.10 1.09 - - - - 50 - - - - 1.03 - 1.13 1.19 1.17 - - 1.05 1.04 60 - - 1.01 1.01 1.11 1.04 1.20 1.27 1.24 1.01 1.07 1.15 1.13 70 - - 1.05 1.08 1.17 1.14 1.26 1.34 1.31 1.11 1.16 1.24 1.23 80 - - 1.04 1.06 1.15 1.14 1.23 1.32 1.30 1.14 1.19 1.25 1.25 90 - - - 1.03 1.10 1.11 1.18 1.27 1.25 1.12 1.17 1.21 1.23 100 - - - - 1.07 1.09 1.14 1.23 1.21 1.10 1.16 1.18 1.21 110 - - - - 1.05 1.07 1.11 1.20 1.19 1.09 1.15 1.16 1.19 120 - - - - 1.03 1.06 1.09 1.17 1.17 1.08 1.14 1.15 1.18 130 - - - - 1.01 1.05 1.07 1.16 1.16 1.07 1.13 1.13 1.17 140 - - - - - 1.04 1.06 1.14 1.14 1.07 1.13 1.13 1.17 150 - - - - - 1.03 1.05 1.13 1.14 1.06 1.12 1.12 1.16 160 - - - - - 1.03 1.04 1.12 1.13 1.06 1.12 1.11 1.15 170 - - - - - 1.02 1.03 1.11 1.12 1.06 1.12 1.10 1.15 180 - - - - - 1.02 1.02 1.11 1.11 1.05 1.12 1.10 1.15 190 - - - - - 1.01 1.02 1.10 1.11 1.05 1.11 1.09 1.14 200 - - - - - 1.01 1.01 1.10 1.10 1.05 1.11 1.09 1.14
As it is unwieldy to calculate moments of a certain truck and then compare to the exclusion vehicles for any given span configuration, this report shall treat all trucks greater than 100-kips as Legal-Heavy Vehicles. Trucks 6 and 7 are therefore included as Legal-Heavy Vehicles even though they do not exceed the Exclusion Truck Moment Envelope. Legal-Heavy Vehicles are to be differentiated from Overload-Permit Vehicles, which will be discussed later in the report. It is reasonable to combine MI Trucks 6-7, 12-19 and 21-25 with the load factors specified for Permit Vehicles in Table 6A.4.5.4.2.1-19 of the MBE. The benefit of treating these heavy vehicles as Permit Vehicles is that the load factor is reduced on a sliding scale as the weight increases for Strength I/II Limit State checks. The load factor for Service II checks (steel structures only) is reduced from 1.3 to 1.0 for Service II Limit State checks.
Adding this load factor reduction into the equation reduces the ratio of the factored Design HL-93 Load Moment to the factored MI Legal Load Truck Moment by up to 30 percent. Table 3 lists the few truck and span combinations that exceed a ratio of 1.0.
9 Table 6.6 in the Guide Manual.
6
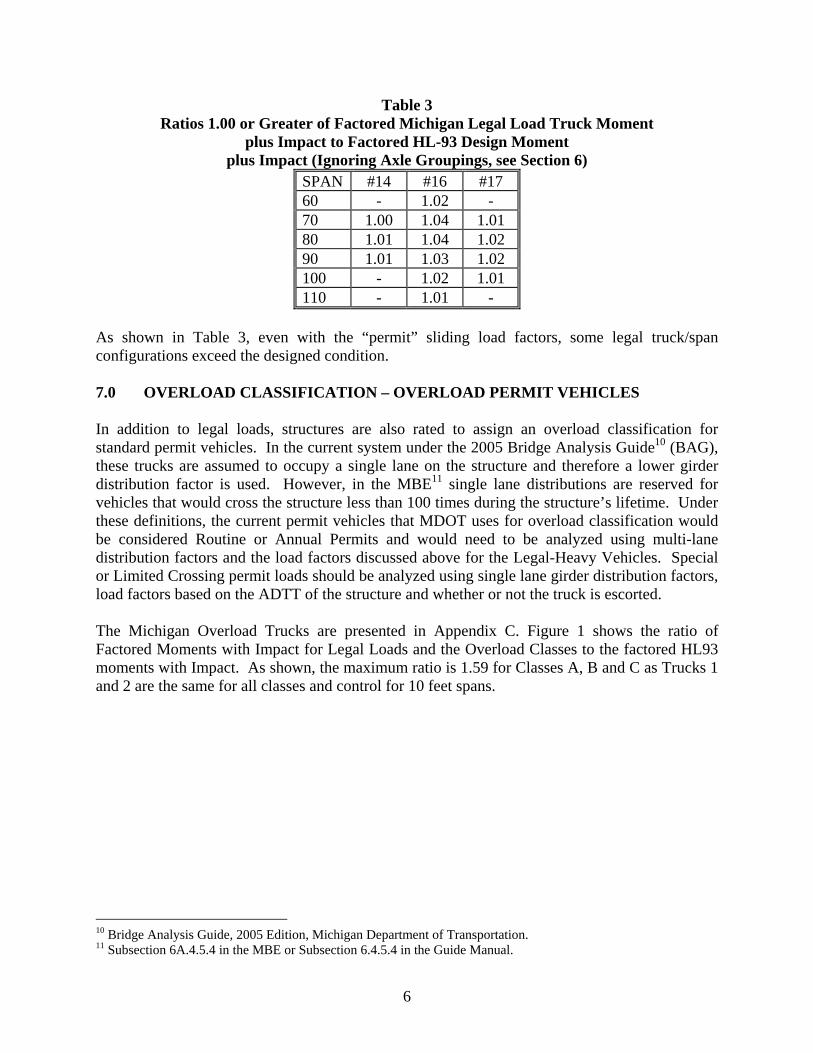
Table 3 Ratios 1.00 or Greater of Factored Michigan Legal Load Truck Moment
plus Impact to Factored HL-93 Design Moment plus Impact (Ignoring Axle Groupings, see Section 6)
SPAN #14 #16 #17 60 - 1.02 - 70 1.00 1.04 1.01 80 1.01 1.04 1.02 90 1.01 1.03 1.02 100 - 1.02 1.01 110 - 1.01 -
As shown in Table 3, even with the “permit” sliding load factors, some legal truck/span configurations exceed the designed condition. 7.0 OVERLOAD CLASSIFICATION – OVERLOAD PERMIT VEHICLES In addition to legal loads, structures are also rated to assign an overload classification for standard permit vehicles. In the current system under the 2005 Bridge Analysis Guide10 (BAG), these trucks are assumed to occupy a single lane on the structure and therefore a lower girder distribution factor is used. However, in the MBE11 single lane distributions are reserved for vehicles that would cross the structure less than 100 times during the structure’s lifetime. Under these definitions, the current permit vehicles that MDOT uses for overload classification would be considered Routine or Annual Permits and would need to be analyzed using multi-lane distribution factors and the load factors discussed above for the Legal-Heavy Vehicles. Special or Limited Crossing permit loads should be analyzed using single lane girder distribution factors, load factors based on the ADTT of the structure and whether or not the truck is escorted.
The Michigan Overload Trucks are presented in Appendix C. Figure 1 shows the ratio of Factored Moments with Impact for Legal Loads and the Overload Classes to the factored HL93 moments with Impact. As shown, the maximum ratio is 1.59 for Classes A, B and C as Trucks 1 and 2 are the same for all classes and control for 10 feet spans.
10 Bridge Analysis Guide, 2005 Edition, Michigan Department of Transportation. 11 Subsection 6A.4.5.4 in the MBE or Subsection 6.4.5.4 in the Guide Manual.

7
0.60
0.70
0.80
0.90
1.00
1.10
1.20
1.30
1.40
1.50
1.60
1.70
0 20 40 60 80 100 120 140 160 180 200
Span Length (ft)
Rat
io o
f Leg
al a
nd O
verlo
ad M
omen
ts to
Des
ign
Mom
ent
Legal Loads vs HL-93
Class A vs HL-93
Class B vs HL-93
Class C vs HL-93
Figure 1
Ratios of Factored MI Legal and Overload Truck Moments With Impact to Factored HL-93 Design Moment with Impact
8.0 LOAD FACTOR DESIGN (LFD) HS-25 VERSUS LOAD FACTOR RATING
(LFR) LEGAL AND OPERATING LOADS The Legal and Operating Moments with load factors are generally less than the HS-25 LFD Design Loading. Figure 2 illustrates the ratios of the maximum factored MI Legal Load including impact and the maximum factored Overload moment including impact for each class compared to the factored HS-25 design loading including impact. As shown, the maximum legal load ratio is below 1.00, while the maximum Class A load ratio is less than 1.10. The design load factor is 2.17, while the operating load factor for legal and overload moments is 1.3. The Overload Moments were reduced by a factor of 11/14 (0.785) to account for a single lane distribution.

8
0.50
0.60
0.70
0.80
0.90
1.00
1.10
0 20 40 60 80 100 120 140 160 180 200
Span Length (ft)
Rat
io o
f Leg
al a
nd O
verlo
ad M
omen
ts to
Des
ign
Mom
ent
Legal Loads vs HS-25
Class A vs HS-25
Class B vs HS-25
Class C vs HS-25
Figure 2
Maximum Ratios of Factored MI Legal Truck Moments Including Impact and Overload Truck Moments Including Impact to
Factored HS-25 Design Moment Including Impact (LFR vs. LFD)
9.0 LRFR – RECOMMENDED REFINEMENTS The results of switching to LRFR/LRFD from LFR/LFD are quite significant for Michigan. Under the previous design/rating system, the design moments would allow most new structures to carry all legal loads and Class A overloads for permits. For the typical maximum span length between 70 and 80 feet, there is a 10-15 percent allowance for many unknowns – future overlays (in excess of the 25-psf accounted for in design), possible deterioration, and Superload Vehicles (vehicles heavier than Overload Classes). However, in the LRFR/LRFD system, new structures (if designed 100 percent efficiently) would have some span lengths that did not meet legal loads and would most likely be restricted from Overloads, as shown in Figure 1. According to the Permits Section, more than 30,000 Overweight Permits have been issued each year since 2002, providing a vital service to our State’s economy. The new design/rating system, if left unmodified, would prevent these vehicles from driving across any new structure.
The LRFR code in the MBE was developed based on a two-lane maximum loading event of 240-kips, a legal truck (the 3S-2) of 72-kips and a legal load factor of 1.8. The NCHRP Report 45412 gives a formula to convert this baseline live load factor to be vehicle and traffic specific for permit vehicles. And, as discussed previously, we recommend that legal loads greater than 100-kips use routine permit vehicle live load factors. The formula is: 12 NCHRP Report 454 Calibration of Load Factors for LRFR Bridge Evaluation, 2001, Transportation Research Board.
9
PAP T
laneL72*
240)(
*8.12,+
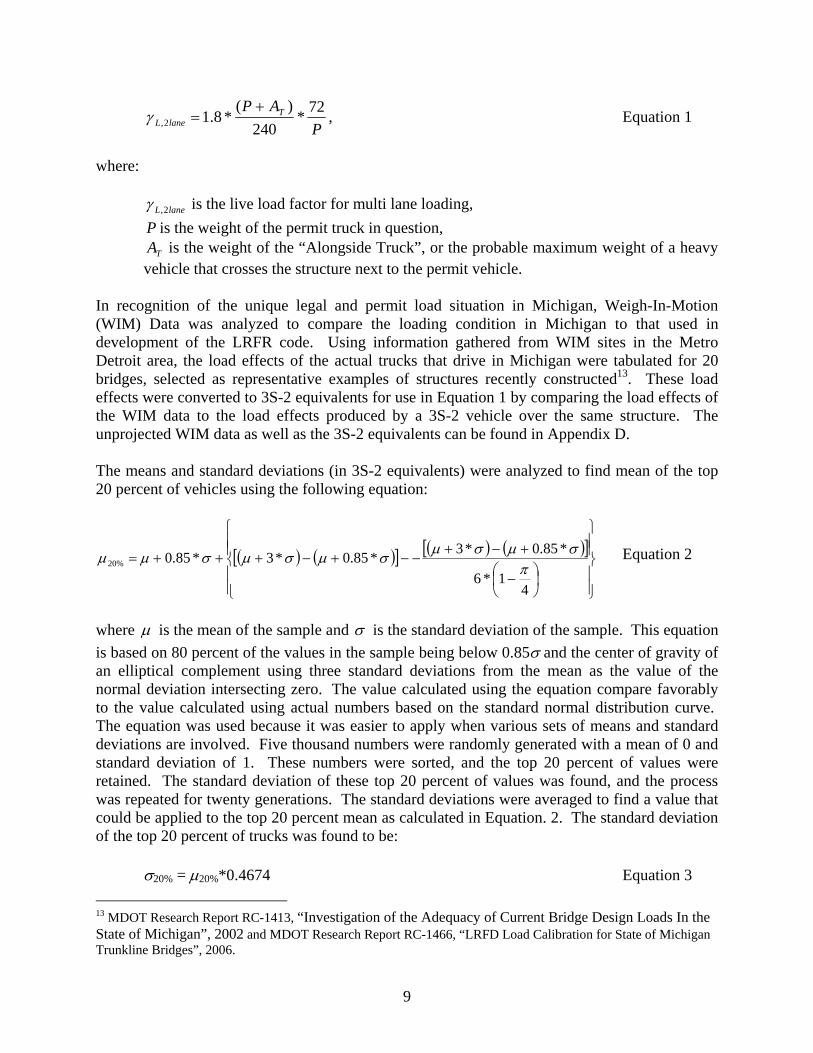
=γ , Equation 1
where:
laneL 2,γ is the live load factor for multi lane loading, P is the weight of the permit truck in question,
TA is the weight of the “Alongside Truck”, or the probable maximum weight of a heavy vehicle that crosses the structure next to the permit vehicle.
In recognition of the unique legal and permit load situation in Michigan, Weigh-In-Motion (WIM) Data was analyzed to compare the loading condition in Michigan to that used in development of the LRFR code. Using information gathered from WIM sites in the Metro Detroit area, the load effects of the actual trucks that drive in Michigan were tabulated for 20 bridges, selected as representative examples of structures recently constructed13. These load effects were converted to 3S-2 equivalents for use in Equation 1 by comparing the load effects of the WIM data to the load effects produced by a 3S-2 vehicle over the same structure. The unprojected WIM data as well as the 3S-2 equivalents can be found in Appendix D.
The means and standard deviations (in 3S-2 equivalents) were analyzed to find mean of the top 20 percent of vehicles using the following equation:
( ) ( )[ ] ( ) ( )[ ]
⎪⎪⎭
⎪⎪⎬
⎫
⎪⎪⎩
⎪⎪⎨
⎧
⎟⎠⎞
⎜⎝⎛ −
+−+−−+−+++=
41*6
*85.0*3*85.0*3*85.0%20 πσμσμσμσμσμμ Equation 2
where μ is the mean of the sample and σ is the standard deviation of the sample. This equation is based on 80 percent of the values in the sample being below 0.85σ and the center of gravity of an elliptical complement using three standard deviations from the mean as the value of the normal deviation intersecting zero. The value calculated using the equation compare favorably to the value calculated using actual numbers based on the standard normal distribution curve. The equation was used because it was easier to apply when various sets of means and standard deviations are involved. Five thousand numbers were randomly generated with a mean of 0 and standard deviation of 1. These numbers were sorted, and the top 20 percent of values were retained. The standard deviation of these top 20 percent of values was found, and the process was repeated for twenty generations. The standard deviations were averaged to find a value that could be applied to the top 20 percent mean as calculated in Equation. 2. The standard deviation of the top 20 percent of trucks was found to be:
σ20% = μ20%*0.4674 Equation 3 13 MDOT Research Report RC-1413, “Investigation of the Adequacy of Current Bridge Design Loads In the State of Michigan”, 2002 and MDOT Research Report RC-1466, “LRFD Load Calibration for State of Michigan Trunkline Bridges”, 2006.
10
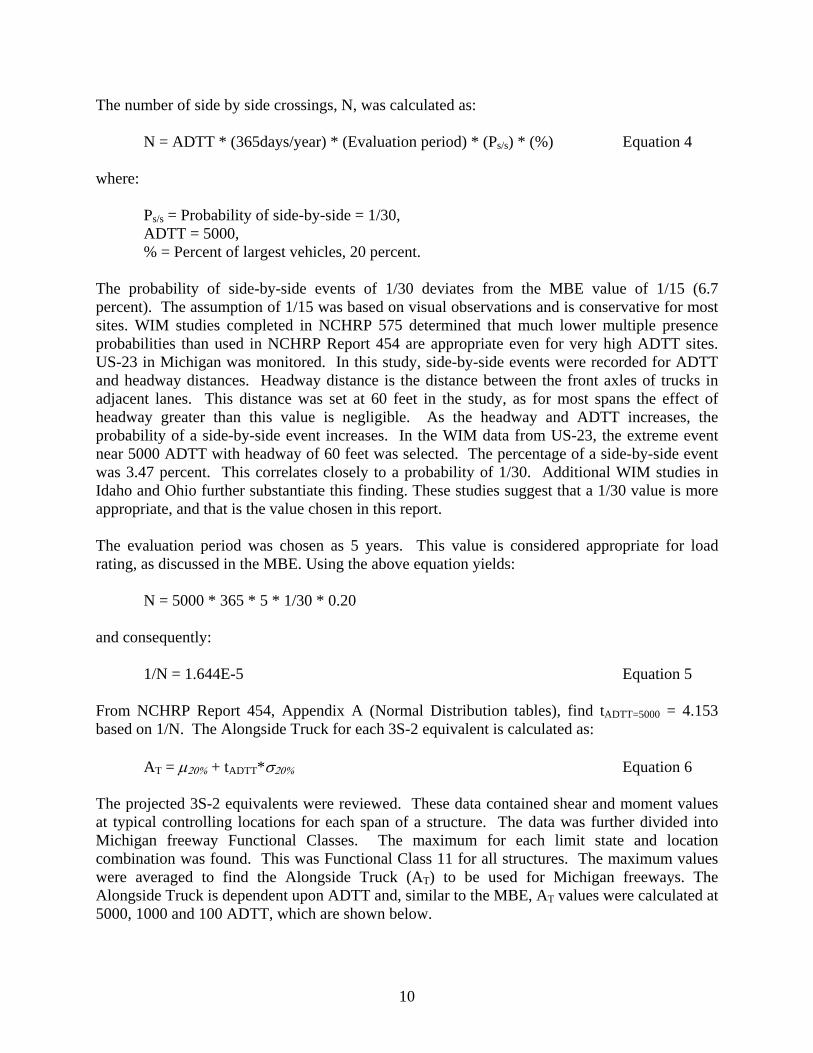
The number of side by side crossings, N, was calculated as:
N = ADTT * (365days/year) * (Evaluation period) * (Ps/s) * (%) Equation 4 where:
Ps/s = Probability of side-by-side = 1/30, ADTT = 5000, % = Percent of largest vehicles, 20 percent.
The probability of side-by-side events of 1/30 deviates from the MBE value of 1/15 (6.7 percent). The assumption of 1/15 was based on visual observations and is conservative for most sites. WIM studies completed in NCHRP 575 determined that much lower multiple presence probabilities than used in NCHRP Report 454 are appropriate even for very high ADTT sites. US-23 in Michigan was monitored. In this study, side-by-side events were recorded for ADTT and headway distances. Headway distance is the distance between the front axles of trucks in adjacent lanes. This distance was set at 60 feet in the study, as for most spans the effect of headway greater than this value is negligible. As the headway and ADTT increases, the probability of a side-by-side event increases. In the WIM data from US-23, the extreme event near 5000 ADTT with headway of 60 feet was selected. The percentage of a side-by-side event was 3.47 percent. This correlates closely to a probability of 1/30. Additional WIM studies in Idaho and Ohio further substantiate this finding. These studies suggest that a 1/30 value is more appropriate, and that is the value chosen in this report.
The evaluation period was chosen as 5 years. This value is considered appropriate for load rating, as discussed in the MBE. Using the above equation yields:
N = 5000 * 365 * 5 * 1/30 * 0.20 and consequently:
1/N = 1.644E-5 Equation 5
From NCHRP Report 454, Appendix A (Normal Distribution tables), find tADTT=5000 = 4.153 based on 1/N. The Alongside Truck for each 3S-2 equivalent is calculated as:
AT = μ20% + tADTT*σ20% Equation 6 The projected 3S-2 equivalents were reviewed. These data contained shear and moment values at typical controlling locations for each span of a structure. The data was further divided into Michigan freeway Functional Classes. The maximum for each limit state and location combination was found. This was Functional Class 11 for all structures. The maximum values were averaged to find the Alongside Truck (AT) to be used for Michigan freeways. The Alongside Truck is dependent upon ADTT and, similar to the MBE, AT values were calculated at 5000, 1000 and 100 ADTT, which are shown below.

11
Table 4 AT values based on ADTT
ADTT N 1/N tADTT AT 5000 60833 0.000016 4.153 188.6 1000 12167 0.000082 3.769 181.3 100 1217 0.000822 3.148 169.4
The corresponding live load factors were calculated using Equation 1 and are presented in Table 5. These values represent multi-lane or two-lane loading, for example heavy-legal or routine permit loading scenarios. The value “P” in Table 6 corresponds to the weight of the Legal-Heavy or routine permit that is being analyzed.
Table 5 Two-Lane Live Load Factors for Legal-Heavy/Permit Vehicles based on Equation 1
Calculated γL, 2lane for sample P values ADTT (one way) 100 kips 125 kips 150 kips 175 kips 200 kips 225 kips 250 kips
5000 1.56 1.35 1.22 1.12 1.05* 0.99* 0.95* 1000 1.52 1.32 1.19 1.10 1.03* 0.98* 0.93* 100 1.45 1.27 1.15 1.06* 1.00* 0.95* 0.91*
*Live load factors smaller than 1.10 are not recommended by this report Although the Michigan alongside truck is larger than that used in the development of the code, the factors in Table 5 of this report are lower than those suggested in Table 6A.4.5.4.2.1-114 of the MBE, which range from 1.80 to 1.30 for 100-kip to 150-kip vehicles, respectively, for an ADTT level of 5000. There are three reasons for this difference: the side-by-side probability for an ADTT of 5000 is different; the code is trying to prevent situations where legal trucks would be prevented from crossing a structure, but permitted vehicles would be allowed; and situations where single lane loading would control.
For the concern that permit trucks would be allowed to cross structures that legal vehicles are not allowed to cross, the heavy alongside truck in Michigan creates a different sliding scale than that present in the MBE. If a 72-kip truck was evaluated using Equation 1 for the “permit” live load factor using the Alongside Truck from NCHRP 454 (120-kip), the corresponding load factor would be 1.44 for 5000 ADTT. However, using the Michigan-specific Alongside Truck of 188.6-kip would increase the load factor to the legal load cap of 1.80. Adjustment is not required for Michigan loads as the permit and legal load factors converge automatically.
It is generally thought that a multi-lane loading situation always controls. As the MBE Alongside Truck is very large compared to the AASHTO legal loads, the uncertainty of the load effect, and therefore the magnitude of the live load factor, is dominated by the MBE Alongside Truck. However, as the Permit truck (P) gets very large, the weight of the permit vehicle itself begins to dominate the load effect, and therefore the single lane loading can control the required live load factor. This can be shown in the following series of equations taken from NCHRP 454. 14 Table 6-6 of the Guide Manual.

12
NCHRP 454 developed the target safety margin for load rating by comparing resistance to expected loading. This can expressed as the following:
L
gWLR LL **γ
= Equation 7
where:
LR is the target safety margin of component resistance to expected mean live load,
γL is the live load factor, WL is the nominal weight of the rating vehicle, g is the lateral distribution factor for the girder being checked,
L is the expected mean maximum live load effect. As mentioned previously, the expected maximum loading, L , used in creation of the MBE is based on the effect of two side-by-side similar 120-kip vehicles and a corresponding live load factor of 1.8. Assuming g, the lateral distribution factor, would not change depending on the actual vehicle being checked, then a change in the expected mean maximum live load would require a corresponding change in the live load factor in order to maintain the target safety margin. This relationship of live load factor to vehicle weight can be re-written:
2408.1
=T
L
Wγ
Equation 8
where:
WT is the expected two-lane effect. This target reliability is for legal loads, which assumes that the load rater is evaluating WL as a nominal 3S2 vehicle, or a weight of 72-kips. In order to achieve this same target reliability in permit review, the ratio of a 3S2 vehicle to the Permit vehicle must be inserted into the equation. The maximum expected two-lane event would be the permit vehicle and the maximum alongside truck, and WT can be written: PAW TT += Equation 9 thus deriving a form of Equation 1:
PAP T
laneL 72*240
8.12, =+
γ

13
Referring to the numerator of Equation 7, the nominal factored live load effect for two lanes is given as: mlaneLlane gPL **2,2 γ= Equation 10 where: gm is the multi-lane lateral distribution factor. NCHRP 454 cites work by Zokaie that developed a different method for comparing the effect of a permit vehicle in one lane with a different vehicle in the next lane. This assumption, proven empirically according to NCHRP 454, is used so that the lateral distribution factors from AASHTO LRFD may be used (which were developed assuming similar side-by-side vehicles) without doing independent grillage analyses. The equation is found by adding the effect of the single lane permit truck to the multi-lane effect of the Alongside Truck, and then subtracting the single lane effect of Alongside Truck. )(** 111 ggAgPW mT −+= Equation 11 where:
W1 is the single lane maximum girder effect, g1 is the single lane lateral distribution factor.
Returning to the premise that a reference ratio of resistance to loading is desired, Equation 7 may be rewritten for the single lane case as follows:
LgP
LR laneL 11, **γ
= Equation 12
where: γL,1lane is the live load factor for single lane loading. In this equation, the mean maximum live load event is based on a single 120-kip vehicle. The 1.8 value derived in Section 6.2.2 of NCHRP 454 was based on multi-lane distribution factors of random traffic. In order to have a true reference ratio, the single lane live load factor must be based on this ratio:
1
11,
1
1 ***120
*72*8.1W
gPg
gLR laneLγ
== Equation 13
Solving for γL,1lane changes the Equation 13 to:

14
( )[ ]111
1, ****72*
1208.1 ggAgP
gP mTlaneL −+=γ Equation 14
Similar to the multi-lane case, the nominal live load effect for single lane loading, using the numerator of Equation 7, is:
11,1 ** gPL laneLlane γ= Equation 15 In order to compare the single and multilane live load factors to find the controlling case, an “equivalent” multilane live load factor from the single lane loading can be found by setting the nominal live load effects equal to each other. equivlane LL =1 Equation 16 substituting in Equation 10 and Equation 15: mequivlaneL gPgP **** 11, γγ = Equation 17 substituting in Equation 14 and solving for γequiv:
m
Tm
equiv gg
P
Agg
P11 *72*
120
)1(*8.1
⎟⎟⎠
⎞⎜⎜⎝
⎛−+
=γ Equation 18
Table 6 contains the γequiv that would be needed to produce the same live load effect in a multi-lane analysis as would be found in a single-lane analysis.
Table 6 Two-Lane Live Load Factors for Legal-Heavy Permit Vehicles based on Equation 18
Calculated γequiv for sample P values gm/g1 ADTT
(one way) 100 kips 125 kips 150 kips 175 kips 200 kips 225 kips 250 kips 5000 1.35 1.24 1.16 1.10 1.06* 1.03* 1.00* 1000 1.33 1.22 1.14 1.09* 1.05* 1.02* 1.00* 1.4 100 1.29 1.19 1.12 1.07* 1.03* 1.00* 0.98*
5000 1.47 1.31 1.19 1.11 1.05* 1.01* 0.97* 1000 1.44 1.28 1.17 1.10 1.04* 0.99* 0.96* 1.7 100 1.39 1.24 1.14 1.07* 1.01* 0.97* 0.94*
5000 1.56 1.35 1.22 1.12 1.05* 0.99* 0.95* 1000 1.44 1.28 1.17 1.10 1.04* 0.99* 0.96* 2 100 1.39 1.24 1.14 1.07* 1.01* 0.97* 0.94*
*Live load factors smaller than 1.10 are not recommended by this report

15
The live load distribution ratio of 2, a conservative upper limit for typical cross-sections, is the controlling case for single lane loading. If the γequiv in Table 6 was larger than the γL,2lane given in Table 5, then the single lane loading case would control. Upon inspection, γequiv only exceeds γL,2lane for the 100 ADTT case for 175-kip permit loads and then at 200-kip permit loads and above. In these situations, the live load factor is less than 1.10. It is reasonable to set upper and lower bounds for live load factors. A value of 1.10 will be set as the minimum live load factor in order to eliminate possible situations where a single lane loading might produce a greater effect than multi-lane and to establish a lower limit. Upper limits are based on the Legal Live Load Factors in Table 6A.4.4.2.3.1-1 of the MBE if the GVW is less than or equal to 100-kips and the Permit Live Load Factors in Table 6A.4.5.4.2.1-115 when the GVW is greater than 100-kips. Table 7 summarizes the recommended Designated Load legal vehicle live load factors. This report recommends to use the Live Load Factors given in Tables 7 thru 10 and Appendix E.
Table 7 Michigan Designated Legal Vehicle Load Factors based on ADTT Michigan Designated Legal Vehicle Load Factors for Strength Limit States Vehicle Number
GVW (kips)
5000 ADTT γLL
1000 ADTT γLL
100 ADTT γLL
1 33.4 1.80 1.65 1.40 2 47.4 1.80 1.65 1.40 3 54.4 1.80 1.65 1.40 4 67.4 1.80 1.65 1.40 5 84.0 1.75 1.65 1.40 6 101.4 1.54 1.51 1.40 7 119.4 1.39 1.36 1.31 8 91.4 1.65 1.61 1.40 9 51.4 1.80 1.65 1.40 10 65.4 1.80 1.65 1.40 11 83.4 1.76 1.65 1.40 12 117.4 1.41 1.37 1.32 13 125.4 1.35 1.32 1.27 14 132.4 1.31 1.28 1.23 15 143.3 1.25 1.22 1.18 16 138.4 1.28 1.25 1.20 17 151.4 1.21 1.19 1.14 18 154.0 1.20 1.18 1.13 19 117.4 1.41 1.37 1.32 20 87.4 1.71 1.65 1.40 21 151.4 1.21 1.19 1.14 22 161.4 1.17 1.15 1.11 23 154.0 1.20 1.18 1.13 24 122.0 1.37 1.34 1.29 25 164.0 1.16 1.14 1.10 26 50.0 1.80 1.65 1.40 27 72.0 1.80 1.65 1.40 28 80.0 1.80 1.65 1.40
15 Tables 6-5 and 6-6 in the Guide Manual, respectively
16
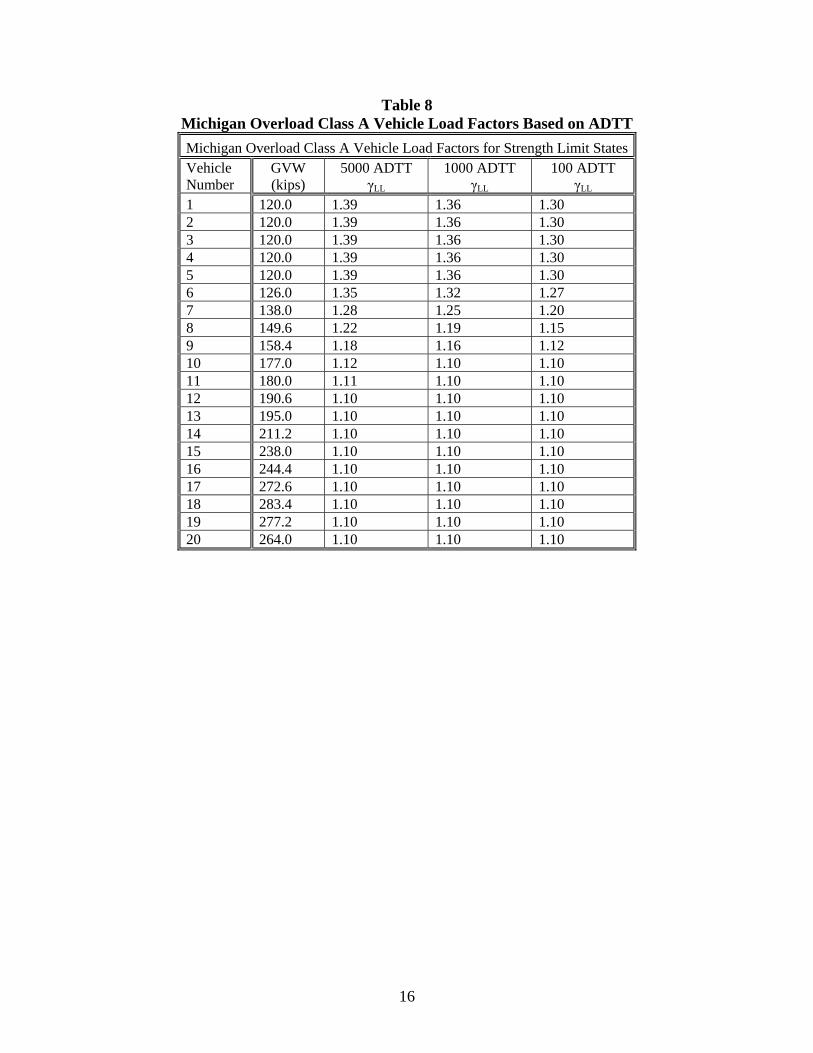
Table 8 Michigan Overload Class A Vehicle Load Factors Based on ADTT Michigan Overload Class A Vehicle Load Factors for Strength Limit States Vehicle Number
GVW (kips)
5000 ADTT γLL
1000 ADTT γLL
100 ADTT γLL
1 120.0 1.39 1.36 1.30 2 120.0 1.39 1.36 1.30 3 120.0 1.39 1.36 1.30 4 120.0 1.39 1.36 1.30 5 120.0 1.39 1.36 1.30 6 126.0 1.35 1.32 1.27 7 138.0 1.28 1.25 1.20 8 149.6 1.22 1.19 1.15 9 158.4 1.18 1.16 1.12 10 177.0 1.12 1.10 1.10 11 180.0 1.11 1.10 1.10 12 190.6 1.10 1.10 1.10 13 195.0 1.10 1.10 1.10 14 211.2 1.10 1.10 1.10 15 238.0 1.10 1.10 1.10 16 244.4 1.10 1.10 1.10 17 272.6 1.10 1.10 1.10 18 283.4 1.10 1.10 1.10 19 277.2 1.10 1.10 1.10 20 264.0 1.10 1.10 1.10

17
Table 9 Michigan Overload Class B Vehicle Load Factors based on ADTT Michigan Overload Class B Vehicle Load Factors for Strength Limit States Vehicle Number
GVW (kips)
5000 ADTT γLL
1000 ADTT γLL
100 ADTT γLL
1 120.0 1.39 1.36 1.30 2 120.0 1.39 1.36 1.30 3 118.0 1.40 1.37 1.32 4 108.0 1.48 1.45 1.39 5 104.0 1.52 1.48 1.40 6 108.0 1.48 1.45 1.39 7 114.0 1.43 1.40 1.34 8 127.6 1.34 1.31 1.26 9 129.6 1.33 1.30 1.25 10 146.4 1.24 1.21 1.16 11 159.0 1.18 1.16 1.12 12 160.2 1.18 1.15 1.11 13 168.8 1.14 1.12 1.10 14 179.2 1.11 1.10 1.10 15 204.0 1.10 1.10 1.10 16 203.6 1.10 1.10 1.10 17 232.4 1.10 1.10 1.10 18 241.6 1.10 1.10 1.10 19 234.4 1.10 1.10 1.10 20 225.8 1.10 1.10 1.10

18
Table 10 Michigan Overload Class C Vehicle Load Factors based on ADTT Michigan Overload Class C Vehicle Load Factors for Strength Limit States Vehicle Number
GVW (kips)
5000 ADTT γLL
1000 ADTT γLL
100 ADTT γLL
1 120.0 1.39 1.36 1.30 2 120.0 1.39 1.36 1.30 3 114.0 1.43 1.40 1.34 4 98.0 1.58 1.54 1.40 5 88.0 1.70 1.65 1.40 6 90.0 1.67 1.63 1.40 7 93.0 1.64 1.59 1.40 8 105.6 1.50 1.47 1.40 9 105.6 1.50 1.47 1.40 10 122.0 1.37 1.34 1.29 11 138.0 1.28 1.25 1.20 12 134.4 1.30 1.27 1.22 13 147.4 1.23 1.20 1.16 14 153.6 1.20 1.18 1.14 15 170.0 1.14 1.12 1.10 16 173.0 1.13 1.11 1.10 17 182.8 1.10 1.10 1.10 18 200.0 1.10 1.10 1.10 19 200.8 1.10 1.10 1.10 20 191.4 1.10 1.10 1.10
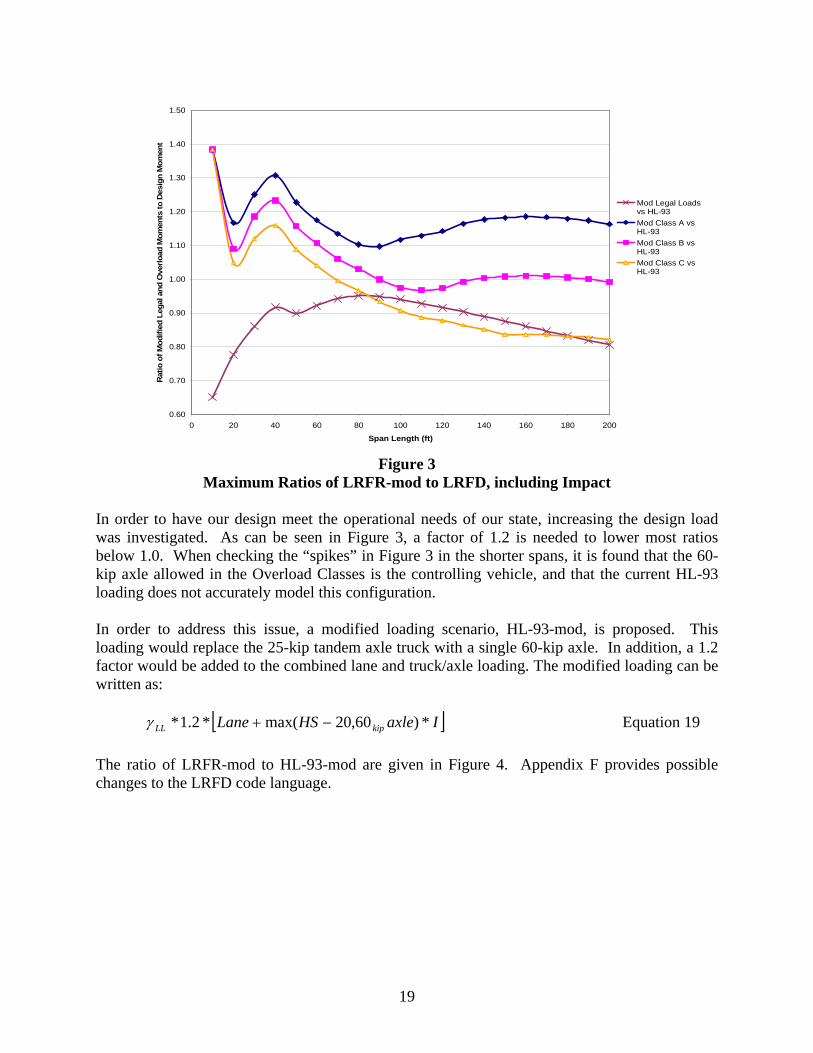
10.0 LRFD – RECOMMENDED MODIFICATIONS Despite the effort taken to modify the LRFR load factors (LRFR-mod) to meet the needs of Michigan trucks, the operational capacity of bridges designed/rated under LRFD and HL-93/ LRFR-mod will still be less than the current LFR/LFD (HS-25) system. As shown in Figure 2, for the typical span lengths constructed in Michigan (40 to 70 feet), all single-span factored legal and overload permit class moments are less than 90 percent of the factored HS-25 design moments. In contrast, Figure 3 shows the factored LRFR-mod/LRFD comparisons. In the most common span lengths, the factored overload permit class moments exceed the factored design moment by 15 to 30 percent. This would make it likely that new structures would be restricted from Overload Permit Vehicles even if designed correctly according to LRFD.
19
0.60
0.70
0.80
0.90
1.00
1.10
1.20
1.30
1.40
1.50
0 20 40 60 80 100 120 140 160 180 200
Span Length (ft)
Rat
io o
f Mod
ified
Leg
al a
nd O
verlo
ad M
omen
ts to
Des
ign
Mom
ent
Mod Legal Loadsvs HL-93Mod Class A vsHL-93Mod Class B vsHL-93Mod Class C vsHL-93
Figure 3
Maximum Ratios of LRFR-mod to LRFD, including Impact In order to have our design meet the operational needs of our state, increasing the design load was investigated. As can be seen in Figure 3, a factor of 1.2 is needed to lower most ratios below 1.0. When checking the “spikes” in Figure 3 in the shorter spans, it is found that the 60-kip axle allowed in the Overload Classes is the controlling vehicle, and that the current HL-93 loading does not accurately model this configuration.
In order to address this issue, a modified loading scenario, HL-93-mod, is proposed. This loading would replace the 25-kip tandem axle truck with a single 60-kip axle. In addition, a 1.2 factor would be added to the combined lane and truck/axle loading. The modified loading can be written as: [ ]IaxleHSLane kipLL *)60,20max(*2.1* −+γ Equation 19 The ratio of LRFR-mod to HL-93-mod are given in Figure 4. Appendix F provides possible changes to the LRFD code language.

20
0.60
0.70
0.80
0.90
1.00
1.10
1.20
1.30
1.40
1.50
0 20 40 60 80 100 120 140 160 180 200
Span Length (ft)
Rat
io o
f Mod
ified
Leg
al a
nd O
verlo
ad M
omen
ts to
Des
ign
Mom
ent
Mod Legal Loadsvs HL-93-modMod Class A vsHL-93-modMod Class B vsHL-93-modMod Class C vsHL-93-mod
Figure 4
Maximum Ratios of LRFR-mod to LRFD-mod, including Impact As shown in Figure 4, using the modified LRFD loading and the modified LRFR factors, the operational capacity versus design ratios return to current levels. The most common spans are near 90 percent for Class A Overloads. This report recommends creating the HL-93-mod loading that replaces the 25-kip tandem axle truck with a single 60-kip axle and adds a 1.2 factor to the lane and maximum of the truck or axle loading. 11.0 LONG SPAN/CONTINUOUS SPAN LOADING This report does not analyze the effect of long spans or continuous spans on the load rating versus design moment ratios. Long spans are considered to be spans over 200 feet in length. While all span lengths should be evaluated for the legal vehicle, long spans and continuous spans have additional requirements. For Legal Load Ratings, the MBE16 required load for long spans is the AASHTO Type 3-3 Truck, multiplied by 0.75, and combined with a lane load of 0.2-klf. For negative moments and reactions, a lane load of 0.2-klf combined with two AASHTO Type 3-3 multiplied by 0.75 heading in the same direction separated by 30 feet is required. The other AASHTO Legal Load trucks do not have to be checked in combination with the lane load for Legal Load Ratings as they would not control on long spans. The truck portion of this load would have impact added and all applicable load factors would apply to the total live load.
For permit loads, subsection 6A4.5.4.1 of the MBE17 specifies that for spans between 200 feet and 300 feet, and when calculating negative moments, a 0.2-klf lane load shall be applied in
16 Subsection 6A.4.4.2.1 in the MBE and Subsection 6.4.4.2.1 in the Guide Manual. 17 Subsection 6.4.5.4 in the Guide Manual.
21
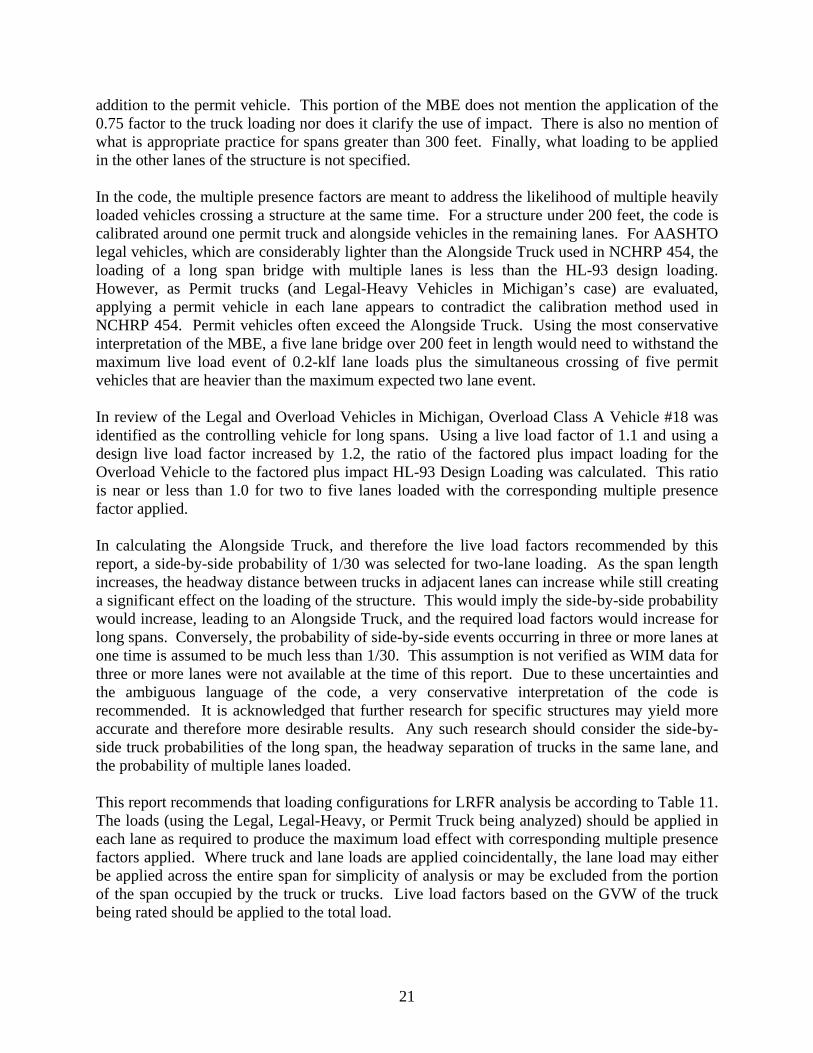
addition to the permit vehicle. This portion of the MBE does not mention the application of the 0.75 factor to the truck loading nor does it clarify the use of impact. There is also no mention of what is appropriate practice for spans greater than 300 feet. Finally, what loading to be applied in the other lanes of the structure is not specified.
In the code, the multiple presence factors are meant to address the likelihood of multiple heavily loaded vehicles crossing a structure at the same time. For a structure under 200 feet, the code is calibrated around one permit truck and alongside vehicles in the remaining lanes. For AASHTO legal vehicles, which are considerably lighter than the Alongside Truck used in NCHRP 454, the loading of a long span bridge with multiple lanes is less than the HL-93 design loading. However, as Permit trucks (and Legal-Heavy Vehicles in Michigan’s case) are evaluated, applying a permit vehicle in each lane appears to contradict the calibration method used in NCHRP 454. Permit vehicles often exceed the Alongside Truck. Using the most conservative interpretation of the MBE, a five lane bridge over 200 feet in length would need to withstand the maximum live load event of 0.2-klf lane loads plus the simultaneous crossing of five permit vehicles that are heavier than the maximum expected two lane event.
In review of the Legal and Overload Vehicles in Michigan, Overload Class A Vehicle #18 was identified as the controlling vehicle for long spans. Using a live load factor of 1.1 and using a design live load factor increased by 1.2, the ratio of the factored plus impact loading for the Overload Vehicle to the factored plus impact HL-93 Design Loading was calculated. This ratio is near or less than 1.0 for two to five lanes loaded with the corresponding multiple presence factor applied.
In calculating the Alongside Truck, and therefore the live load factors recommended by this report, a side-by-side probability of 1/30 was selected for two-lane loading. As the span length increases, the headway distance between trucks in adjacent lanes can increase while still creating a significant effect on the loading of the structure. This would imply the side-by-side probability would increase, leading to an Alongside Truck, and the required load factors would increase for long spans. Conversely, the probability of side-by-side events occurring in three or more lanes at one time is assumed to be much less than 1/30. This assumption is not verified as WIM data for three or more lanes were not available at the time of this report. Due to these uncertainties and the ambiguous language of the code, a very conservative interpretation of the code is recommended. It is acknowledged that further research for specific structures may yield more accurate and therefore more desirable results. Any such research should consider the side-by-side truck probabilities of the long span, the headway separation of trucks in the same lane, and the probability of multiple lanes loaded. This report recommends that loading configurations for LRFR analysis be according to Table 11. The loads (using the Legal, Legal-Heavy, or Permit Truck being analyzed) should be applied in each lane as required to produce the maximum load effect with corresponding multiple presence factors applied. Where truck and lane loads are applied coincidentally, the lane load may either be applied across the entire span for simplicity of analysis or may be excluded from the portion of the span occupied by the truck or trucks. Live load factors based on the GVW of the truck being rated should be applied to the total load.
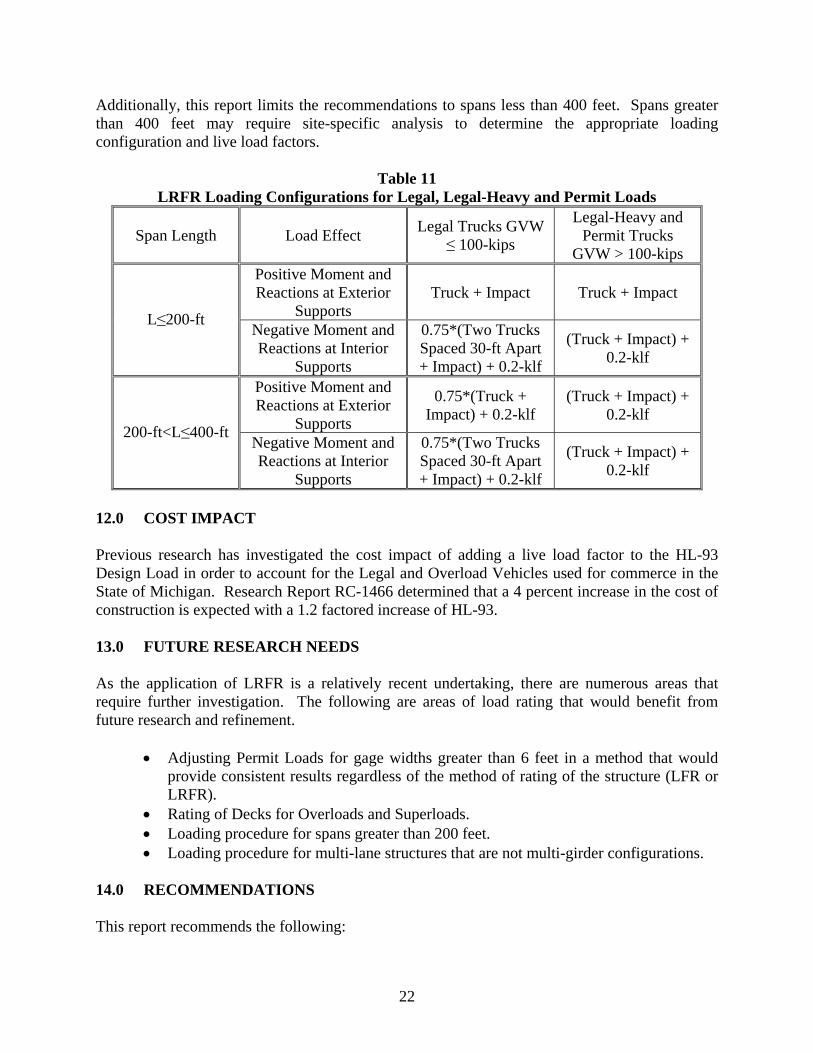
22
Additionally, this report limits the recommendations to spans less than 400 feet. Spans greater than 400 feet may require site-specific analysis to determine the appropriate loading configuration and live load factors.
Table 11 LRFR Loading Configurations for Legal, Legal-Heavy and Permit Loads
Span Length Load Effect Legal Trucks GVW ≤ 100-kips
Legal-Heavy and Permit Trucks
GVW > 100-kips Positive Moment and Reactions at Exterior
Supports Truck + Impact Truck + Impact
L≤200-ft Negative Moment and Reactions at Interior
Supports
0.75*(Two Trucks Spaced 30-ft Apart + Impact) + 0.2-klf
(Truck + Impact) + 0.2-klf
Positive Moment and Reactions at Exterior
Supports
0.75*(Truck + Impact) + 0.2-klf
(Truck + Impact) + 0.2-klf
200-ft<L≤400-ft Negative Moment and Reactions at Interior
Supports
0.75*(Two Trucks Spaced 30-ft Apart + Impact) + 0.2-klf
(Truck + Impact) + 0.2-klf
12.0 COST IMPACT
Previous research has investigated the cost impact of adding a live load factor to the HL-93 Design Load in order to account for the Legal and Overload Vehicles used for commerce in the State of Michigan. Research Report RC-1466 determined that a 4 percent increase in the cost of construction is expected with a 1.2 factored increase of HL-93. 13.0 FUTURE RESEARCH NEEDS
As the application of LRFR is a relatively recent undertaking, there are numerous areas that require further investigation. The following are areas of load rating that would benefit from future research and refinement.
• Adjusting Permit Loads for gage widths greater than 6 feet in a method that would
provide consistent results regardless of the method of rating of the structure (LFR or LRFR).
• Rating of Decks for Overloads and Superloads. • Loading procedure for spans greater than 200 feet. • Loading procedure for multi-lane structures that are not multi-girder configurations.
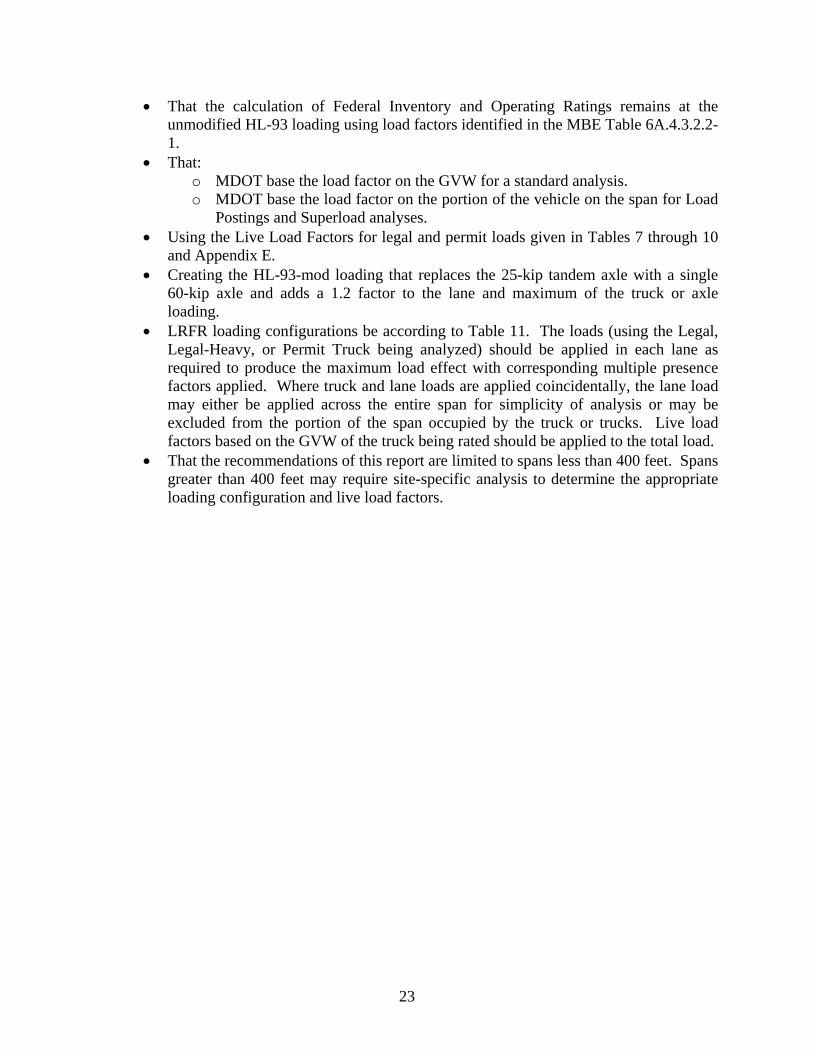
14.0 RECOMMENDATIONS This report recommends the following:
23
• That the calculation of Federal Inventory and Operating Ratings remains at the unmodified HL-93 loading using load factors identified in the MBE Table 6A.4.3.2.2-1.
• That: o MDOT base the load factor on the GVW for a standard analysis. o MDOT base the load factor on the portion of the vehicle on the span for Load
Postings and Superload analyses. • Using the Live Load Factors for legal and permit loads given in Tables 7 through 10
and Appendix E. • Creating the HL-93-mod loading that replaces the 25-kip tandem axle with a single
60-kip axle and adds a 1.2 factor to the lane and maximum of the truck or axle loading.
• LRFR loading configurations be according to Table 11. The loads (using the Legal, Legal-Heavy, or Permit Truck being analyzed) should be applied in each lane as required to produce the maximum load effect with corresponding multiple presence factors applied. Where truck and lane loads are applied coincidentally, the lane load may either be applied across the entire span for simplicity of analysis or may be excluded from the portion of the span occupied by the truck or trucks. Live load factors based on the GVW of the truck being rated should be applied to the total load.
• That the recommendations of this report are limited to spans less than 400 feet. Spans greater than 400 feet may require site-specific analysis to determine the appropriate loading configuration and live load factors.

24
REFERENCES AASHTO (1994). Manual for Condition Evaluation of Bridges, 4th Edition. Washington, DC. AASHTO (2003). Guide Manual for Condition Evaluation and Load and Resistance Factor
Rating (LRFR) of Highway Bridges 1st Edition, 2005 Interim. Washington, DC. AASHTO (2007). LRFD Bridge Design Specifications, 4th Edition. Washington, DC. AASHTO (2007). The Manual for Bridge Evaluation, Draft Edition, Washington, DC. AASHTO (2002). Standard Specifications for Highway Bridge Design, 17th Edition.
Washington, DC. Fu, G. and van de Lindt, J.W (2006). LRFD Load Calibration for State of Michigan Trunkline
Bridges. Research Report RC-1466. Michigan Department of Transportation, Lansing, Michigan.
Kulicki, J., Mertz, D. Evolution of Vehicular Live Load Models During the Interstate Design Era
and Beyond. In Transportation Research Circular E-C10, Transportation Research Board, National Research Council, Washington, DC, 2006, pp. 1-26.
Michigan Department of Transportation. Bridge Analysis Guide. Lansing, Michigan, 2005. Moses, F. NCHRP Report 454: Calibration of Load Factors for LRFR Bridge Evaluation.
Transportation Research Board, National Research Council, Washington, DC, 2001. Pelphrey, J., and Higgins, C. Calibration of LRFR Live Load Factors Using Weigh-In-Motion
Data Interim Report. SPR 635. Oregon Department of Transportation, Salem, Oregon, 2006. Sivakumar, B., Moses, F., Fu, G. and Ghosn, M. NCHRP Report 575: Legal Truck Loads and
AASHTO Legal Loads for Posting. Transportation Research Board, National Research Council, Washington, DC, 2007.
van de Lindt, J.W. and Fu. G (2002). Investigation of the Adequacy of Current Bridge Design
Loads In the State of Michigan. Research Report RC-1413. Michigan Department of Transportation, Lansing, Michigan.

25

Appendix A
26
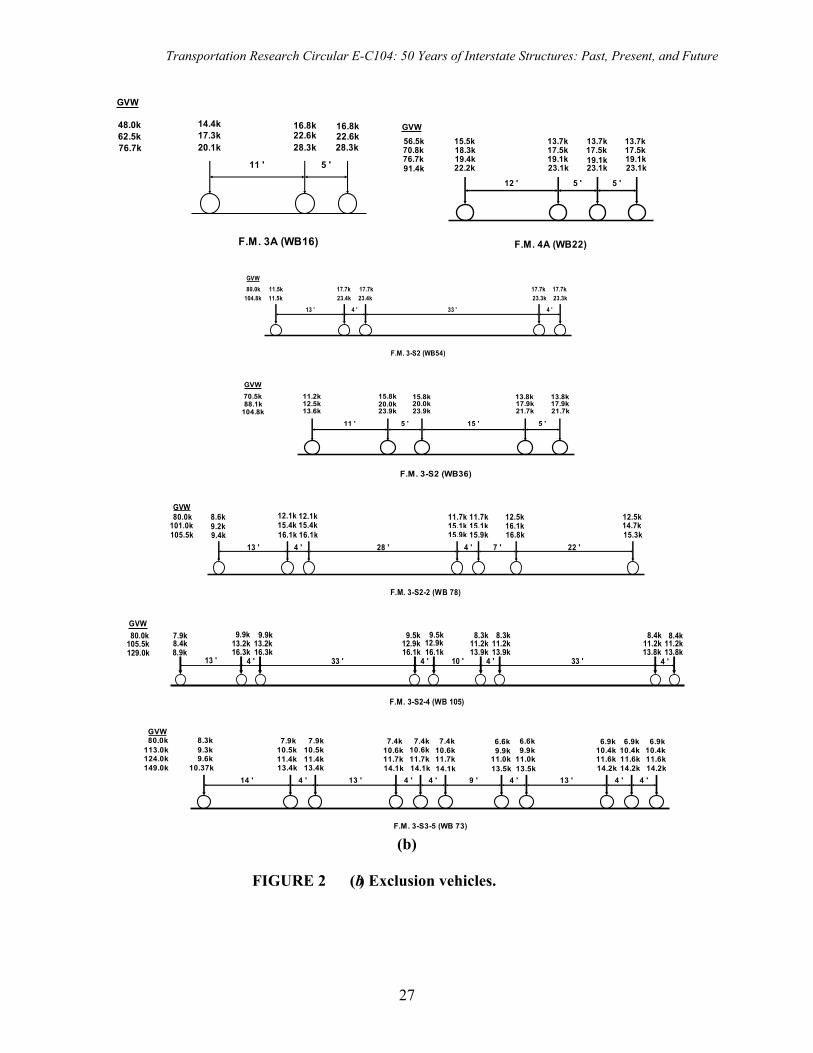
Transportation Research Circular E-C104: 50 Years of Interstate Structures: Past, Present, and Future
20.1k
11 '
28.3k
5 '
28.3k
F.M. 3A (WB16)
17.3k14.4k
22.6k16.8k 16.8k
22.6k48.0k62.5k76.7k
GVW
22.2k
12 '
23.1k
5 '
23.1k
5 '
23.1k
F.M. 4A (WB22)
19.1k17.5k 17.5k
19.1k17.5k19.1k19.4k
18.3k15.5k 13.7k 13.7k 13.7k
GVW56.5k
76.7k70.8k
91.4k
11.5k
13 '
23.4k
4 '
23.4k
33 '
23.3k
4 '
23.3k
F.M. 3-S2 (WB54)
11.5k 17.7k 17.7k 17.7k 17.7k
GVW
104.8k80.0k
13.6k
11 '
23.9k
5 '
23.9k
15 '
21.7k
5 '
21.7k
F.M. 3-S2 (WB36)
12.5k 20.0k15.8k20.0k 17.9k
13.8k17.9k13.8k11.2k 15.8k70.5k
88.1k104.8k
GVW
9.4k13 '
16.1k4 '
16.1k28 '
15.9k4 '
15.9k7 '
16.8k22 '
15.3k
F.M. 3-S2-2 (WB 78)
9.2k8.6k
15.4k12.1k
15.4k12.1k
15.1k11.7k 11.7k
15.1k 16.1k12.5k
14.7k12.5k
GVW80.0k
101.0k105.5k
8.9k13 '
16.3k4 '
16.3k33 '
16.1k4 '
16.1k10 '
13.9k4 '
13.9k33 '
13.8k4 '13.8k
F.M. 3-S2-4 (WB 105)
8.4k7.9k
13.2k9.9k
13.2k9.9k
12.9k9.5k 9.5k
12.9k 11.2k8.3k 8.3k
11.2k 11.2k8.4k
11.2k8.4k
GVW80.0k
105.5k129.0k
14.2k
6.9k10.4k11.6k
F.M. 3-S3-5 (WB 73)
10.37k14 '
13.4k4 '
13.4k13 '
14.1k4 '
14.1k4 '
14.1k9 '
13.5k4 '
13.5k13 '
14.2k4 '
14.2k4 '
9.6k9.3k
80.0k10.5k11.4k
10.5k11.4k
10.6k11.7k
10.6k11.7k
8.3k 7.9k 7.9k 7.4k 7.4k 7.4k10.6k11.7k 11.0k
9.9k6.6k 6.6k
9.9k11.0k 11.6k
10.4k6.9k 6.9k
10.4k11.6k
GVW
113.0k124.0k149.0k
(b)
FIGURE 2 (b) Exclusion vehicles.
27

Appendix B
28
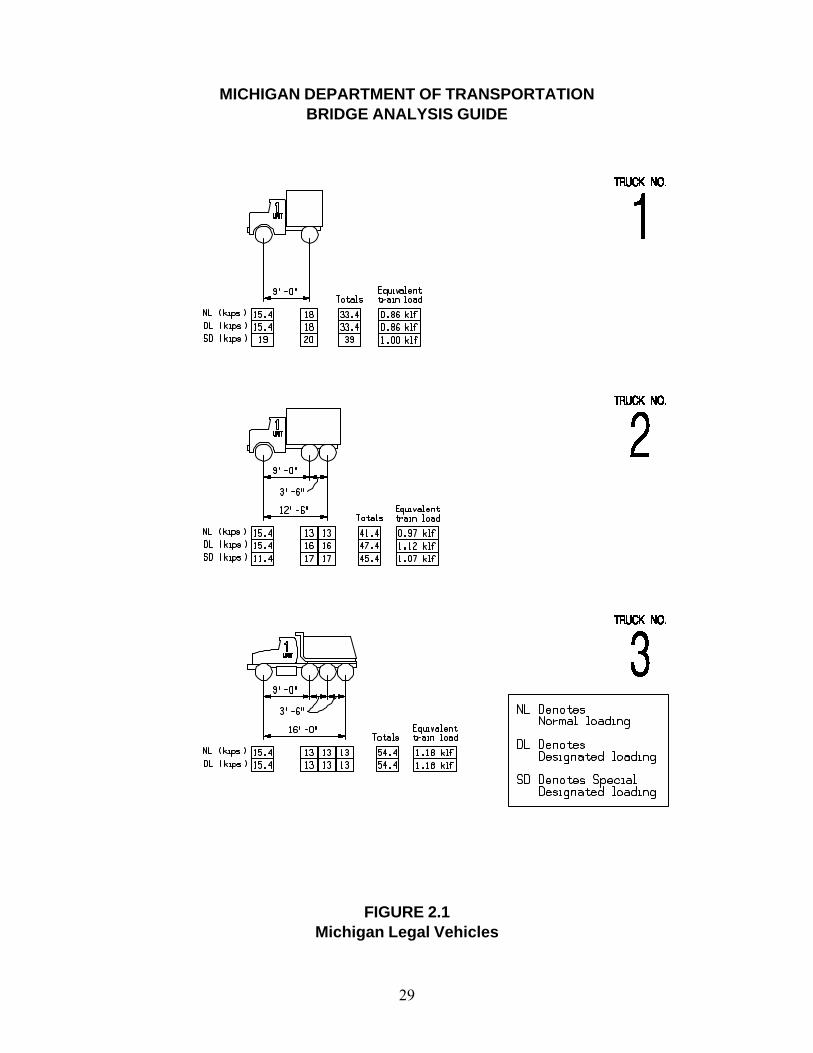
MICHIGAN DEPARTMENT OF TRANSPORTATIONBRIDGE ANALYSIS GUIDE
FIGURE 2.1Michigan Legal Vehicles
29
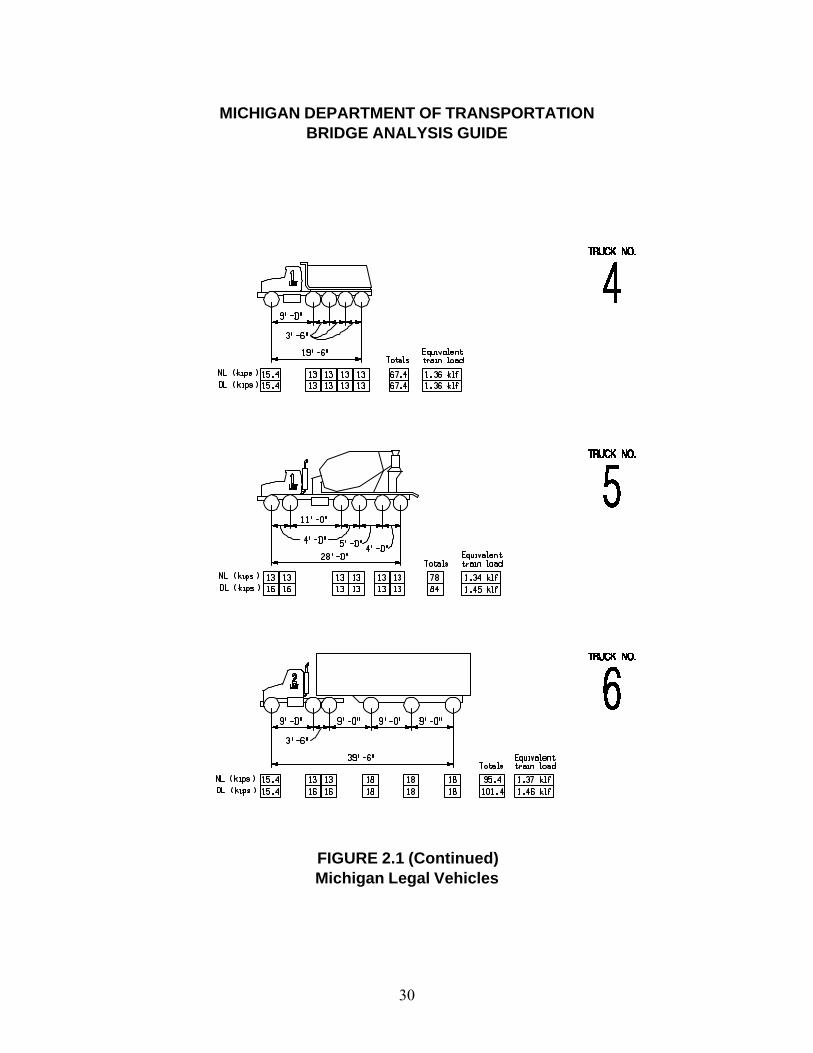
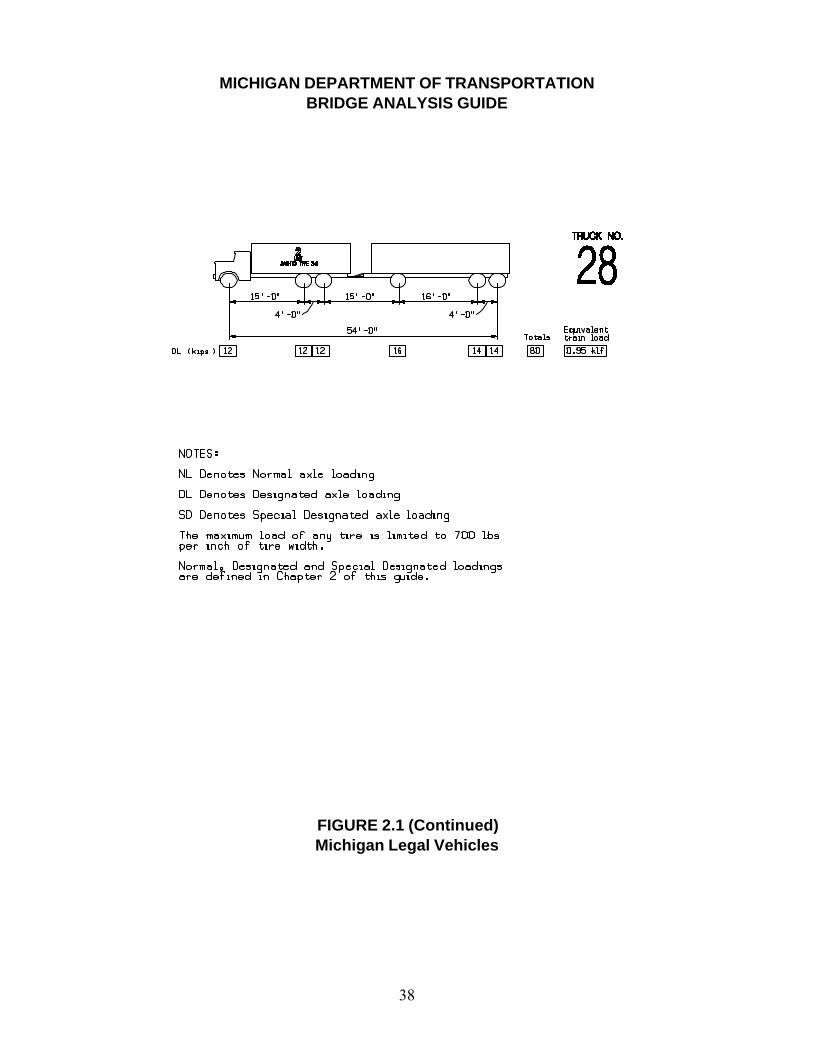
MICHIGAN DEPARTMENT OF TRANSPORTATIONBRIDGE ANALYSIS GUIDE
FIGURE 2.1 (Continued)Michigan Legal Vehicles
30

MICHIGAN DEPARTMENT OF TRANSPORTATIONBRIDGE ANALYSIS GUIDE
FIGURE 2.1 (Continued)Michigan Legal Vehicles
31

MICHIGAN DEPARTMENT OF TRANSPORTATIONBRIDGE ANALYSIS GUIDE
FIGURE 2.1 (Continued)Michigan Legal Vehicles
32

MICHIGAN DEPARTMENT OF TRANSPORTATIONBRIDGE ANALYSIS GUIDE
FIGURE 2.1 (Continued)Michigan Legal Vehicles
33
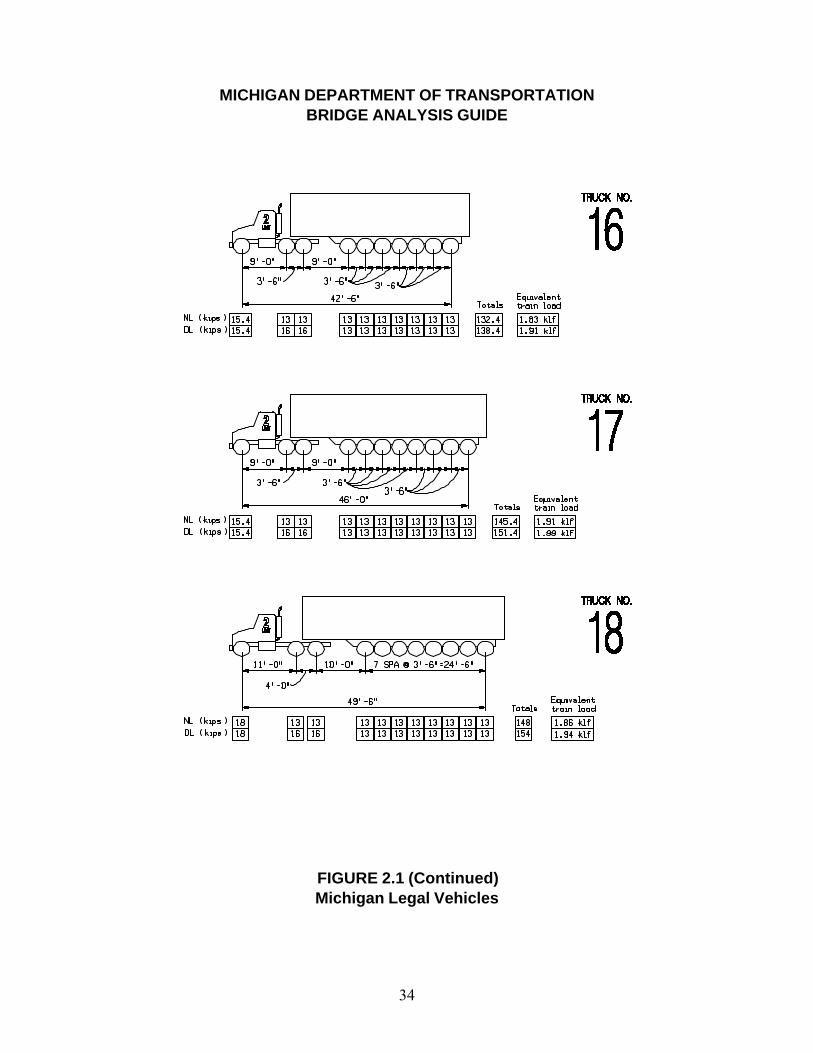
MICHIGAN DEPARTMENT OF TRANSPORTATIONBRIDGE ANALYSIS GUIDE
FIGURE 2.1 (Continued)Michigan Legal Vehicles
34

MICHIGAN DEPARTMENT OF TRANSPORTATIONBRIDGE ANALYSIS GUIDE
FIGURE 2.1 (Continued)Michigan Legal Vehicles
35
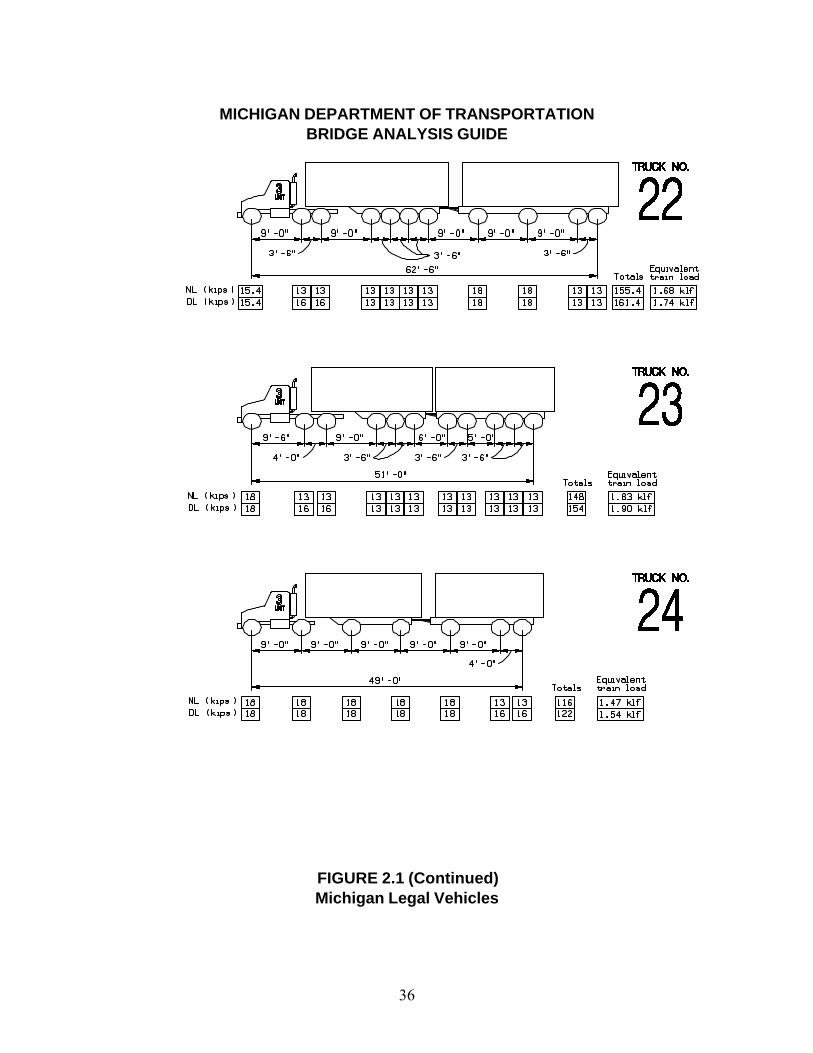
MICHIGAN DEPARTMENT OF TRANSPORTATIONBRIDGE ANALYSIS GUIDE
FIGURE 2.1 (Continued)Michigan Legal Vehicles
36
MICHIGAN DEPARTMENT OF TRANSPORTATIONBRIDGE ANALYSIS GUIDE
FIGURE 2.1 (Continued)Michigan Legal Vehicles
37
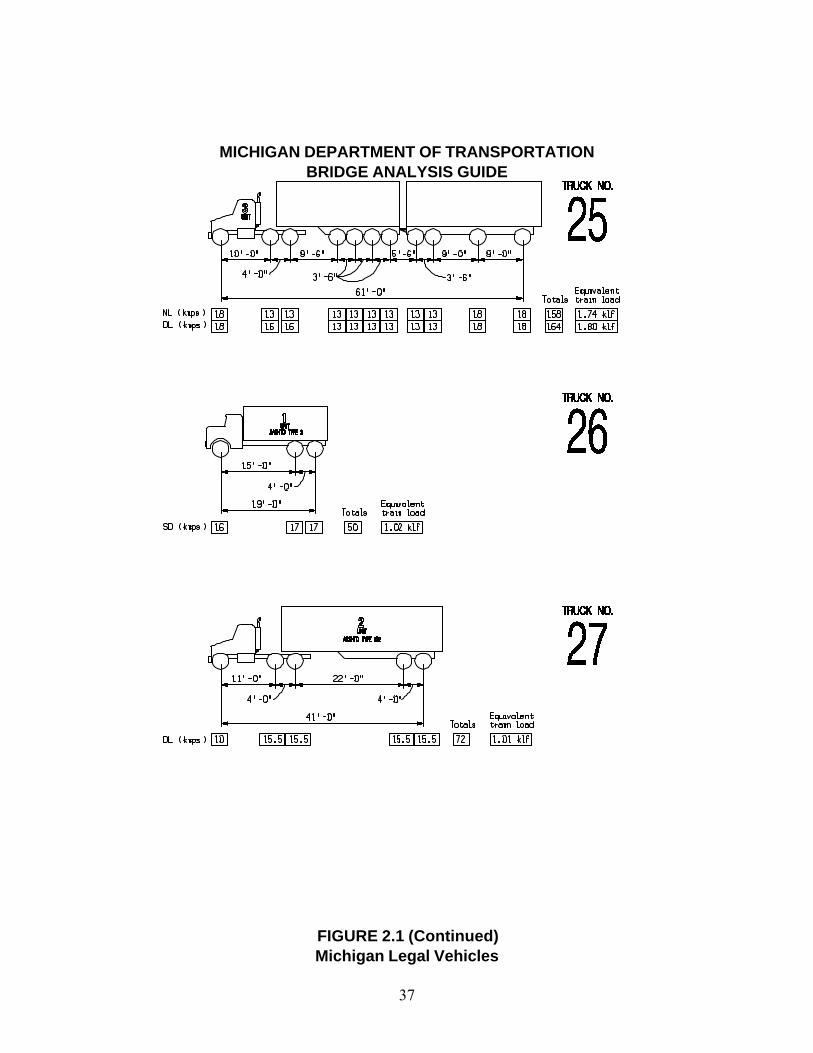
MICHIGAN DEPARTMENT OF TRANSPORTATIONBRIDGE ANALYSIS GUIDE
FIGURE 2.1 (Continued)Michigan Legal Vehicles
38
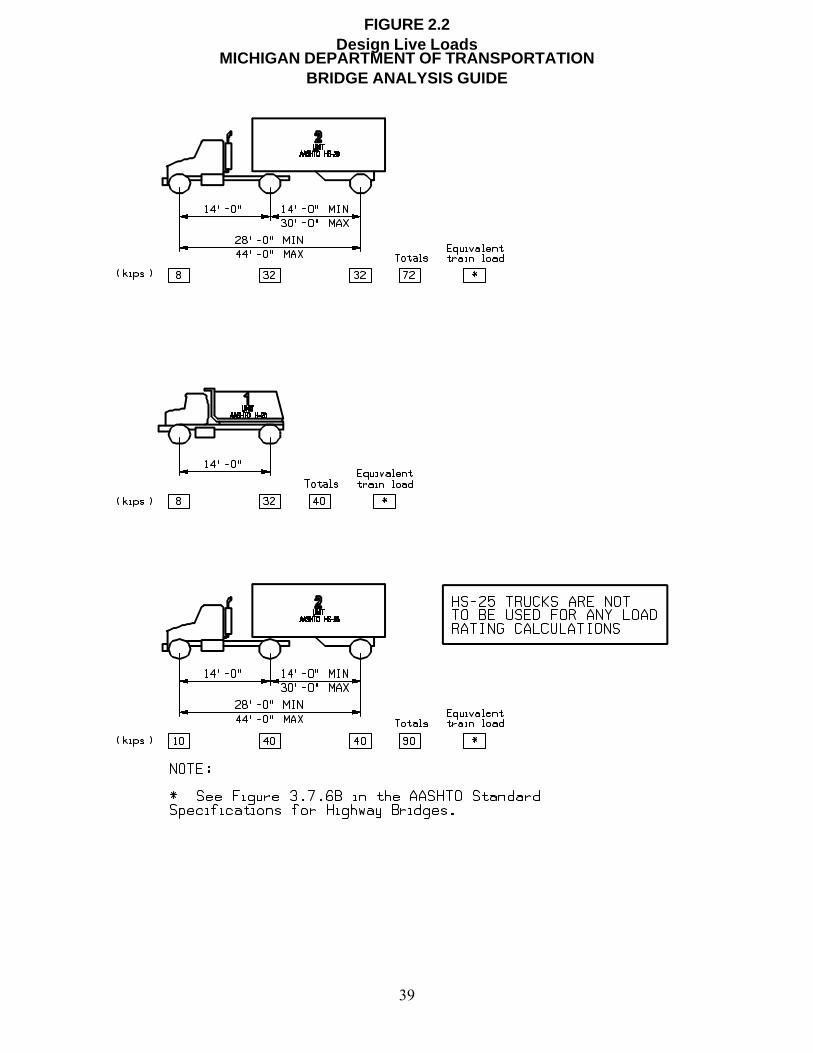
MICHIGAN DEPARTMENT OF TRANSPORTATIONBRIDGE ANALYSIS GUIDE
FIGURE 2.2Design Live Loads
39

Appendix C
40

MICHIGAN DEPARTMENT OF TRANSPORTATIONBRIDGE ANALYSIS GUIDE
FIGURE 8.1Permissible Overload Classes on State Bridges
41

MICHIGAN DEPARTMENT OF TRANSPORTATIONBRIDGE ANALYSIS GUIDE
FIGURE 8.1 (Continued)Permissible Overload Classes on State Bridges
42

Appendix D
43

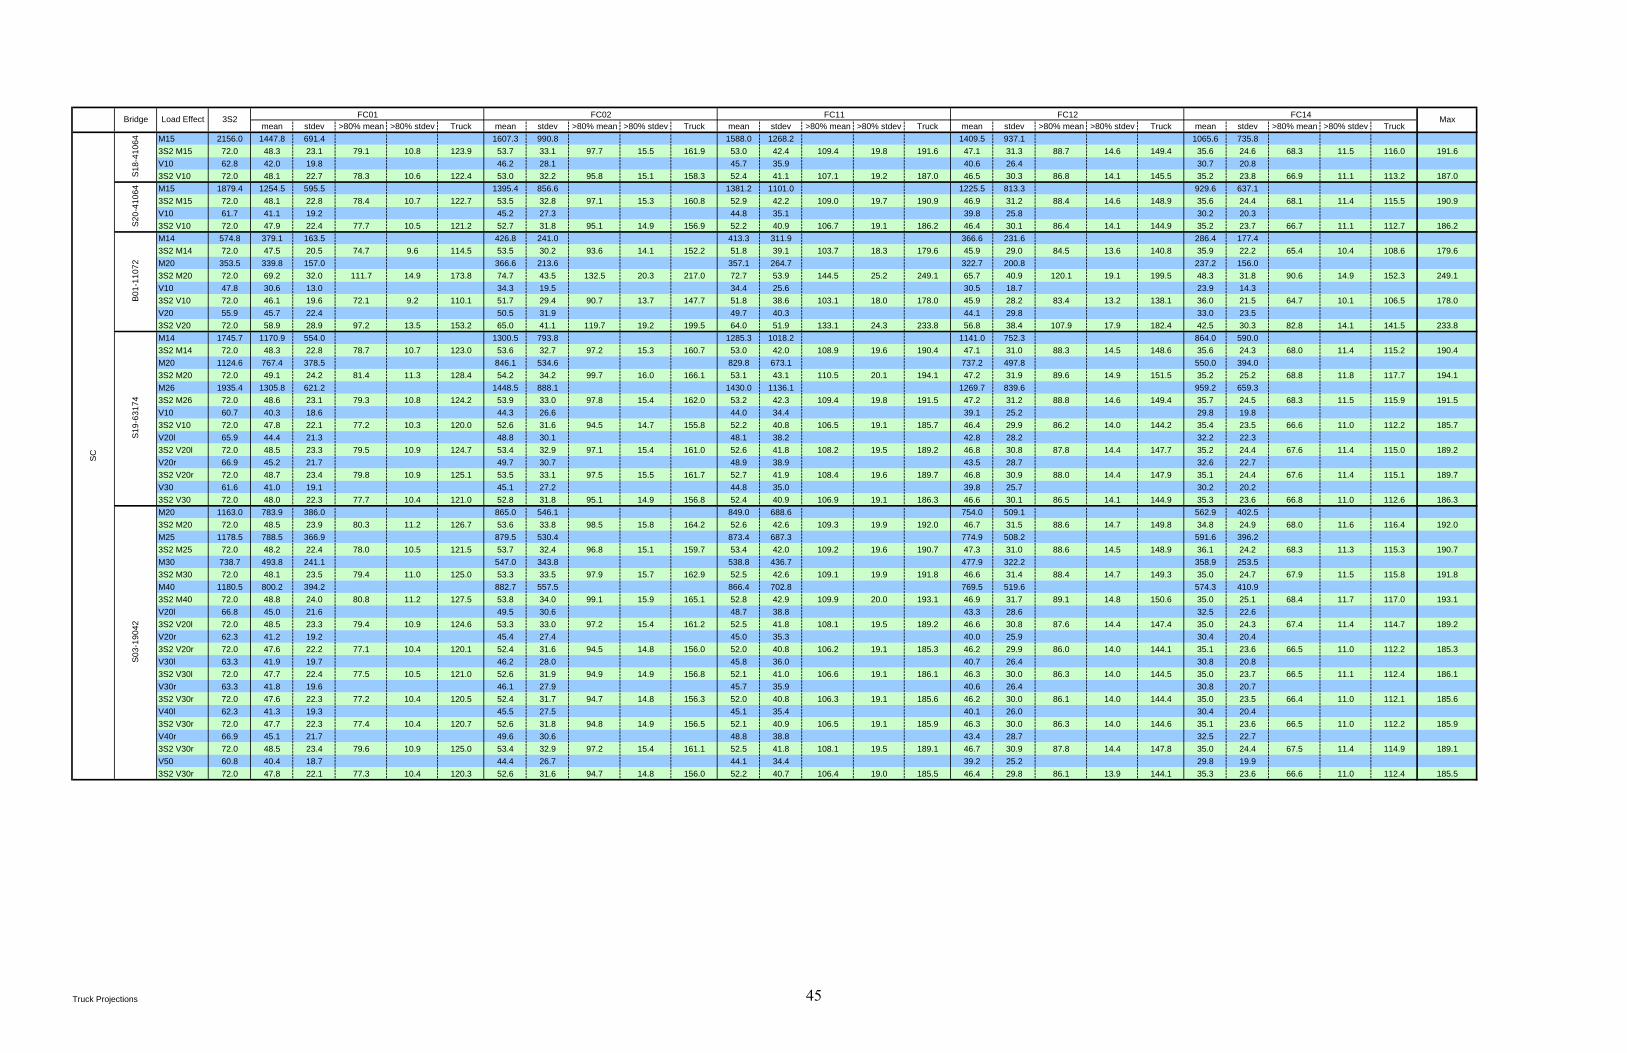
Each moment or shear location is identified in the following manner: The bridge type and bridge ID in the leftmost columns; in the column labeled “Load Effect” and “M” indicates a moment in K-ft and a “V” indicates a shear in K. The first number after the M or V indicates the span number, and the second number indicates how far from the leftmost support for that span in terms of percent of the span. Bridge types are defined as: steel beam bridges (SC), prestressed concrete I beam bridges (PI), adjacent prestress concrete box beam bridges (PCA), and spread prestressed box beam bridges (PCS). For example, bridge no. B01-11072 is a steel beam bridge, the M14 indicates the moment on the first span at a location 40 percent from the leftmost support. The v20 indicates the negative shear at the second support. The 3S2 is the AASHTO truck designation. The FC indicates Functional Class designation.
44
mean stdev >80% mean >80% stdev Truck mean stdev >80% mean >80% stdev Truck mean stdev >80% mean >80% stdev Truck mean stdev >80% mean >80% stdev Truck mean stdev >80% mean >80% stdev TruckM15 2156.0 1447.8 691.4 1607.3 990.8 1588.0 1268.2 1409.5 937.1 1065.6 735.83S2 M15 72.0 48.3 23.1 79.1 10.8 123.9 53.7 33.1 97.7 15.5 161.9 53.0 42.4 109.4 19.8 191.6 47.1 31.3 88.7 14.6 149.4 35.6 24.6 68.3 11.5 116.0 191.6V10 62.8 42.0 19.8 46.2 28.1 45.7 35.9 40.6 26.4 30.7 20.83S2 V10 72.0 48.1 22.7 78.3 10.6 122.4 53.0 32.2 95.8 15.1 158.3 52.4 41.1 107.1 19.2 187.0 46.5 30.3 86.8 14.1 145.5 35.2 23.8 66.9 11.1 113.2 187.0M15 1879.4 1254.5 595.5 1395.4 856.6 1381.2 1101.0 1225.5 813.3 929.6 637.13S2 M15 72.0 48.1 22.8 78.4 10.7 122.7 53.5 32.8 97.1 15.3 160.8 52.9 42.2 109.0 19.7 190.9 46.9 31.2 88.4 14.6 148.9 35.6 24.4 68.1 11.4 115.5 190.9V10 61.7 41.1 19.2 45.2 27.3 44.8 35.1 39.8 25.8 30.2 20.33S2 V10 72.0 47.9 22.4 77.7 10.5 121.2 52.7 31.8 95.1 14.9 156.9 52.2 40.9 106.7 19.1 186.2 46.4 30.1 86.4 14.1 144.9 35.2 23.7 66.7 11.1 112.7 186.2M14 574.8 379.1 163.5 426.8 241.0 413.3 311.9 366.6 231.6 286.4 177.43S2 M14 72.0 47.5 20.5 74.7 9.6 114.5 53.5 30.2 93.6 14.1 152.2 51.8 39.1 103.7 18.3 179.6 45.9 29.0 84.5 13.6 140.8 35.9 22.2 65.4 10.4 108.6 179.6M20 353.5 339.8 157.0 366.6 213.6 357.1 264.7 322.7 200.8 237.2 156.03S2 M20 72.0 69.2 32.0 111.7 14.9 173.8 74.7 43.5 132.5 20.3 217.0 72.7 53.9 144.5 25.2 249.1 65.7 40.9 120.1 19.1 199.5 48.3 31.8 90.6 14.9 152.3 249.1V10 47.8 30.6 13.0 34.3 19.5 34.4 25.6 30.5 18.7 23.9 14.33S2 V10 72.0 46.1 19.6 72.1 9.2 110.1 51.7 29.4 90.7 13.7 147.7 51.8 38.6 103.1 18.0 178.0 45.9 28.2 83.4 13.2 138.1 36.0 21.5 64.7 10.1 106.5 178.0V20 55.9 45.7 22.4 50.5 31.9 49.7 40.3 44.1 29.8 33.0 23.53S2 V20 72.0 58.9 28.9 97.2 13.5 153.2 65.0 41.1 119.7 19.2 199.5 64.0 51.9 133.1 24.3 233.8 56.8 38.4 107.9 17.9 182.4 42.5 30.3 82.8 14.1 141.5 233.8M14 1745.7 1170.9 554.0 1300.5 793.8 1285.3 1018.2 1141.0 752.3 864.0 590.03S2 M14 72.0 48.3 22.8 78.7 10.7 123.0 53.6 32.7 97.2 15.3 160.7 53.0 42.0 108.9 19.6 190.4 47.1 31.0 88.3 14.5 148.6 35.6 24.3 68.0 11.4 115.2 190.4M20 1124.6 767.4 378.5 846.1 534.6 829.8 673.1 737.2 497.8 550.0 394.03S2 M20 72.0 49.1 24.2 81.4 11.3 128.4 54.2 34.2 99.7 16.0 166.1 53.1 43.1 110.5 20.1 194.1 47.2 31.9 89.6 14.9 151.5 35.2 25.2 68.8 11.8 117.7 194.1M26 1935.4 1305.8 621.2 1448.5 888.1 1430.0 1136.1 1269.7 839.6 959.2 659.33S2 M26 72.0 48.6 23.1 79.3 10.8 124.2 53.9 33.0 97.8 15.4 162.0 53.2 42.3 109.4 19.8 191.5 47.2 31.2 88.8 14.6 149.4 35.7 24.5 68.3 11.5 115.9 191.5V10 60.7 40.3 18.6 44.3 26.6 44.0 34.4 39.1 25.2 29.8 19.83S2 V10 72.0 47.8 22.1 77.2 10.3 120.0 52.6 31.6 94.5 14.7 155.8 52.2 40.8 106.5 19.1 185.7 46.4 29.9 86.2 14.0 144.2 35.4 23.5 66.6 11.0 112.2 185.7V20l 65.9 44.4 21.3 48.8 30.1 48.1 38.2 42.8 28.2 32.2 22.33S2 V20l 72.0 48.5 23.3 79.5 10.9 124.7 53.4 32.9 97.1 15.4 161.0 52.6 41.8 108.2 19.5 189.2 46.8 30.8 87.8 14.4 147.7 35.2 24.4 67.6 11.4 115.0 189.2V20r 66.9 45.2 21.7 49.7 30.7 48.9 38.9 43.5 28.7 32.6 22.73S2 V20r 72.0 48.7 23.4 79.8 10.9 125.1 53.5 33.1 97.5 15.5 161.7 52.7 41.9 108.4 19.6 189.7 46.8 30.9 88.0 14.4 147.9 35.1 24.4 67.6 11.4 115.1 189.7V30 61.6 41.0 19.1 45.1 27.2 44.8 35.0 39.8 25.7 30.2 20.23S2 V30 72.0 48.0 22.3 77.7 10.4 121.0 52.8 31.8 95.1 14.9 156.8 52.4 40.9 106.9 19.1 186.3 46.6 30.1 86.5 14.1 144.9 35.3 23.6 66.8 11.0 112.6 186.3M20 1163.0 783.9 386.0 865.0 546.1 849.0 688.6 754.0 509.1 562.9 402.53S2 M20 72.0 48.5 23.9 80.3 11.2 126.7 53.6 33.8 98.5 15.8 164.2 52.6 42.6 109.3 19.9 192.0 46.7 31.5 88.6 14.7 149.8 34.8 24.9 68.0 11.6 116.4 192.0M25 1178.5 788.5 366.9 879.5 530.4 873.4 687.3 774.9 508.2 591.6 396.23S2 M25 72.0 48.2 22.4 78.0 10.5 121.5 53.7 32.4 96.8 15.1 159.7 53.4 42.0 109.2 19.6 190.7 47.3 31.0 88.6 14.5 148.9 36.1 24.2 68.3 11.3 115.3 190.7M30 738.7 493.8 241.1 547.0 343.8 538.8 436.7 477.9 322.2 358.9 253.53S2 M30 72.0 48.1 23.5 79.4 11.0 125.0 53.3 33.5 97.9 15.7 162.9 52.5 42.6 109.1 19.9 191.8 46.6 31.4 88.4 14.7 149.3 35.0 24.7 67.9 11.5 115.8 191.8M40 1180.5 800.2 394.2 882.7 557.5 866.4 702.8 769.5 519.6 574.3 410.93S2 M40 72.0 48.8 24.0 80.8 11.2 127.5 53.8 34.0 99.1 15.9 165.1 52.8 42.9 109.9 20.0 193.1 46.9 31.7 89.1 14.8 150.6 35.0 25.1 68.4 11.7 117.0 193.1V20l 66.8 45.0 21.6 49.5 30.6 48.7 38.8 43.3 28.6 32.5 22.63S2 V20l 72.0 48.5 23.3 79.4 10.9 124.6 53.3 33.0 97.2 15.4 161.2 52.5 41.8 108.1 19.5 189.2 46.6 30.8 87.6 14.4 147.4 35.0 24.3 67.4 11.4 114.7 189.2V20r 62.3 41.2 19.2 45.4 27.4 45.0 35.3 40.0 25.9 30.4 20.43S2 V20r 72.0 47.6 22.2 77.1 10.4 120.1 52.4 31.6 94.5 14.8 156.0 52.0 40.8 106.2 19.1 185.3 46.2 29.9 86.0 14.0 144.1 35.1 23.6 66.5 11.0 112.2 185.3V30l 63.3 41.9 19.7 46.2 28.0 45.8 36.0 40.7 26.4 30.8 20.83S2 V30l 72.0 47.7 22.4 77.5 10.5 121.0 52.6 31.9 94.9 14.9 156.8 52.1 41.0 106.6 19.1 186.1 46.3 30.0 86.3 14.0 144.5 35.0 23.7 66.5 11.1 112.4 186.1V30r 63.3 41.8 19.6 46.1 27.9 45.7 35.9 40.6 26.4 30.8 20.73S2 V30r 72.0 47.6 22.3 77.2 10.4 120.5 52.4 31.7 94.7 14.8 156.3 52.0 40.8 106.3 19.1 185.6 46.2 30.0 86.1 14.0 144.4 35.0 23.5 66.4 11.0 112.1 185.6V40l 62.3 41.3 19.3 45.5 27.5 45.1 35.4 40.1 26.0 30.4 20.43S2 V30r 72.0 47.7 22.3 77.4 10.4 120.7 52.6 31.8 94.8 14.9 156.5 52.1 40.9 106.5 19.1 185.9 46.3 30.0 86.3 14.0 144.6 35.1 23.6 66.5 11.0 112.2 185.9V40r 66.9 45.1 21.7 49.6 30.6 48.8 38.8 43.4 28.7 32.5 22.73S2 V30r 72.0 48.5 23.4 79.6 10.9 125.0 53.4 32.9 97.2 15.4 161.1 52.5 41.8 108.1 19.5 189.1 46.7 30.9 87.8 14.4 147.8 35.0 24.4 67.5 11.4 114.9 189.1V50 60.8 40.4 18.7 44.4 26.7 44.1 34.4 39.2 25.2 29.8 19.93S2 V30r 72.0 47.8 22.1 77.3 10.4 120.3 52.6 31.6 94.7 14.8 156.0 52.2 40.7 106.4 19.0 185.5 46.4 29.8 86.1 13.9 144.1 35.3 23.6 66.6 11.0 112.4 185.5
Max
B01-
1107
2S1
8-41
064
S20-
4106
4
FC02 FC113S2Load EffectBridge FC14FC12FC01
SC
S19-
6317
4S0
3-19
042
Truck Projections 45

mean stdev >80% mean >80% stdev Truck mean stdev >80% mean >80% stdev Truck mean stdev >80% mean >80% stdev Truck mean stdev >80% mean >80% stdev Truck mean stdev >80% mean >80% stdev TruckM15 1803.21 1235.1 585.8 1374.1 843.2 1360.4 1084.2 1207.0 800.9 915.9 627.23S2 M15 72.0 49.3 23.4 80.4 10.9 125.8 54.9 33.7 99.7 15.7 165.0 54.3 43.3 111.9 20.2 195.9 48.2 32.0 90.7 14.9 152.8 36.6 25.0 69.9 11.7 118.5 195.9V10 61.39 40.9 19.1 45.1 27.2 44.7 35.0 39.7 25.7 30.1 20.23S2 V10 72.0 48.0 22.4 77.8 10.5 121.2 52.9 31.9 95.3 14.9 157.2 52.4 41.0 107.0 19.2 186.7 46.6 30.1 86.7 14.1 145.2 35.3 23.7 66.8 11.1 112.8 186.7M15 1291.21 852.4 396.7 954.5 578.2 951.0 753.8 842.5 556.8 646.6 432.63S2 M15 72.0 47.5 22.1 77.0 10.3 119.9 53.2 32.2 96.1 15.1 158.7 53.0 42.0 108.9 19.6 190.5 47.0 31.0 88.3 14.5 148.5 36.1 24.1 68.1 11.3 115.0 190.5V10 58.3 38.2 17.4 42.2 25.2 42.1 32.7 37.3 23.9 28.6 18.73S2 V10 72.0 47.2 21.5 75.8 10.0 117.5 52.1 31.1 93.5 14.5 153.9 52.0 40.4 105.7 18.9 184.1 46.1 29.5 85.3 13.8 142.6 35.3 23.1 66.0 10.8 110.9 184.1M15 1717.08 1169.2 553.2 1301.9 797.5 1290.0 1027.2 1144.3 758.8 869.6 593.63S2 M15 72.0 49.0 23.2 79.9 10.8 124.9 54.6 33.4 99.1 15.6 164.0 54.1 43.1 111.4 20.1 195.0 48.0 31.8 90.3 14.9 152.1 36.5 24.9 69.6 11.6 117.9 195.0V10 60.97 40.6 18.9 44.7 26.9 44.4 34.7 39.4 25.5 30.0 20.03S2 V10 72.0 47.9 22.3 77.6 10.4 121.0 52.8 31.8 95.0 14.8 156.7 52.4 41.0 106.9 19.2 186.5 46.5 30.1 86.6 14.1 145.0 35.4 23.6 66.8 11.0 112.7 186.5M15 1648.72 1103.6 520.7 1230.0 752.0 1219.8 970.6 1081.8 716.9 823.4 560.23S2 M15 72.0 48.2 22.7 78.4 10.6 122.6 53.7 32.8 97.4 15.3 161.1 53.3 42.4 109.7 19.8 191.9 47.2 31.3 88.9 14.6 149.7 36.0 24.5 68.5 11.4 116.0 191.9M25 1616.98 1078.3 508.2 1202.2 734.5 1192.7 948.7 1057.7 700.7 805.6 547.33S2 M25 72.0 48.0 22.6 78.1 10.6 122.0 53.5 32.7 97.0 15.3 160.5 53.1 42.2 109.3 19.7 191.3 47.1 31.2 88.6 14.6 149.2 35.9 24.4 68.3 11.4 115.6 191.3V10 60.61 40.1 18.6 44.2 26.6 43.9 34.3 39.0 25.2 29.7 19.83S2 V10 72.0 47.6 22.1 77.0 10.3 119.9 52.5 31.6 94.5 14.8 155.9 52.1 40.7 106.4 19.0 185.4 46.3 29.9 86.2 14.0 144.3 35.3 23.5 66.6 11.0 112.2 185.4V20 60.44 40.0 18.5 44.0 26.5 43.8 34.2 38.9 25.0 29.6 19.73S2 V20 72.0 47.7 22.0 77.0 10.3 119.7 52.4 31.6 94.4 14.8 155.7 52.2 40.7 106.4 19.0 185.4 46.3 29.8 86.0 13.9 143.8 35.3 23.5 66.5 11.0 112.0 185.4M15 314.34 248.0 103.1 276.0 145.4 275.9 195.5 247.1 147.7 189.4 113.23S2 M15 72.0 56.8 23.6 88.2 11.0 134.1 63.2 33.3 107.5 15.6 172.2 63.2 44.8 122.8 20.9 209.7 56.6 33.8 101.6 15.8 167.3 43.4 25.9 77.9 12.1 128.2 209.7M25 234.41 179.6 74.7 199.6 103.5 194.4 133.1 174.4 101.6 133.4 78.23S2 M25 72.0 55.2 22.9 85.7 10.7 130.2 61.3 31.8 103.6 14.9 165.3 59.7 40.9 114.1 19.1 193.4 53.6 31.2 95.1 14.6 155.7 41.0 24.0 72.9 11.2 119.5 193.4V10 38.18 27.9 11.2 31.1 16.4 31.0 21.6 27.8 16.1 21.7 12.23S2 V10 72.0 52.6 21.1 80.7 9.9 121.7 58.6 30.9 99.8 14.5 159.8 58.5 40.7 112.6 19.0 191.7 52.4 30.4 92.8 14.2 151.7 40.9 23.0 71.5 10.8 116.2 191.7V20 34.21 26.1 10.2 28.9 14.6 28.5 18.8 25.7 14.3 20.0 10.83S2 V20 72.0 54.9 21.5 83.5 10.0 125.2 60.8 30.7 101.7 14.4 161.3 60.0 39.6 112.6 18.5 189.4 54.1 30.1 94.1 14.1 152.5 42.1 22.7 72.3 10.6 116.4 189.4
mean stdev >80% mean >80% stdev Truck mean stdev >80% mean >80% stdev Truck mean stdev >80% mean >80% stdev Truck mean stdev >80% mean >80% stdev Truck mean stdev >80% mean >80% stdev TruckM15 476.15 342.3 144.2 382.4 208.1 383.8 281.5 342.5 211.3 264.3 160.83S2 M15 72.0 51.8 21.8 80.8 10.2 123.1 57.8 31.5 99.7 14.7 160.8 58.0 42.6 114.7 19.9 197.3 51.8 32.0 94.3 14.9 156.3 40.0 24.3 72.3 11.4 119.5 197.3V10 46.21 29.9 12.7 33.6 18.9 33.8 25.0 29.9 18.3 23.5 14.03S2 V10 72.0 46.6 19.8 72.9 9.2 111.3 52.4 29.4 91.5 13.8 148.7 52.7 39.0 104.5 18.2 180.1 46.6 28.5 84.5 13.3 139.9 36.6 21.8 65.6 10.2 108.0 180.1M15 845 537.8 241.0 607.4 358.0 612.5 480.2 541.1 354.5 423.6 272.93S2 M15 72.0 45.8 20.5 73.1 9.6 113.0 51.8 30.5 92.3 14.3 151.5 52.2 40.9 106.6 19.1 186.0 46.1 30.2 86.3 14.1 144.9 36.1 23.3 67.0 10.9 112.2 186.0V10 53.6 34.2 15.2 38.2 22.5 38.3 29.5 33.9 21.4 26.3 16.53S2 V10 72.0 45.9 20.4 73.1 9.5 112.7 51.3 30.2 91.5 14.1 150.2 51.4 39.6 104.2 18.5 181.1 45.5 28.7 83.8 13.4 139.6 35.3 22.2 64.8 10.4 107.8 181.1M15 215.42 146.9 60.9 163.0 83.9 161.4 108.6 144.9 83.6 110.8 63.73S2 M15 72.0 49.1 20.4 76.2 9.5 115.7 54.5 28.0 91.8 13.1 146.2 53.9 36.3 102.2 17.0 172.7 48.4 27.9 85.6 13.1 139.8 37.0 21.3 65.4 10.0 106.7 172.7M25 895.8 549.6 247.0 620.7 366.8 625.7 491.4 552.8 362.7 432.5 279.33S2 M25 72.0 44.2 19.9 70.6 9.3 109.1 49.9 29.5 89.1 13.8 146.3 50.3 39.5 102.8 18.5 179.5 44.4 29.2 83.2 13.6 139.8 34.8 22.4 64.6 10.5 108.2 179.5M35 215.42 153.9 63.9 170.9 88.1 169.5 114.6 152.1 87.5 116.3 67.23S2 M35 72.0 51.4 21.4 79.8 10.0 121.3 57.1 29.4 96.3 13.8 153.4 56.7 38.3 107.6 17.9 181.9 50.8 29.2 89.7 13.7 146.5 38.9 22.5 68.7 10.5 112.3 181.9V10 33.78 24.9 9.7 27.6 13.7 27.2 17.5 24.6 13.4 19.1 10.13S2 V10 72.0 53.1 20.7 80.6 9.7 120.7 58.8 29.2 97.7 13.6 154.3 58.0 37.3 107.6 17.4 180.0 52.4 28.6 90.4 13.3 145.9 40.7 21.5 69.3 10.1 111.1 180.0V20 54.28 34.4 15.3 38.4 22.6 38.5 29.6 34.1 21.5 26.5 16.63S2 V20 72.0 45.6 20.3 72.6 9.5 112.0 50.9 30.0 90.8 14.0 149.0 51.1 39.3 103.3 18.4 179.5 45.2 28.5 83.2 13.3 138.5 35.2 22.0 64.4 10.3 107.2 179.5V30 33.78 25.2 9.8 27.9 13.9 27.6 17.8 24.9 13.6 19.3 10.33S2 V30 72.0 53.7 20.9 81.5 9.8 122.0 59.5 29.6 98.9 13.8 156.4 58.8 37.9 109.3 17.7 182.9 53.1 29.0 91.6 13.5 147.9 41.1 22.0 70.3 10.3 113.0 182.9M15 304.97 226.5 94.2 248.2 130.0 251.6 176.8 225.5 134.0 172.7 102.93S2 M15 72.0 53.5 22.2 83.1 10.4 126.2 58.6 30.7 99.4 14.3 159.0 59.4 41.7 114.9 19.5 195.9 53.2 31.6 95.3 14.8 156.7 40.8 24.3 73.1 11.4 120.2 195.9M25 868.36 515.0 229.4 581.4 340.6 586.5 458.0 518.4 338.2 406.0 260.13S2 M25 72.0 42.7 19.0 68.0 8.9 104.9 48.2 28.2 85.8 13.2 140.6 48.6 38.0 99.1 17.7 172.9 43.0 28.0 80.3 13.1 134.7 33.7 21.6 62.4 10.1 104.2 172.9M35 269.26 198.3 82.5 220.5 114.9 211.5 146.2 189.9 111.4 145.3 85.93S2 M35 72.0 53.0 22.1 82.4 10.3 125.2 59.0 30.7 99.8 14.4 159.5 56.6 39.1 108.6 18.3 184.4 50.8 29.8 90.4 13.9 148.2 38.9 23.0 69.4 10.7 114.0 184.4V10 37.6 27.4 10.9 30.5 15.8 30.4 20.8 27.2 15.6 21.3 11.83S2 V10 72.0 52.5 20.9 80.2 9.8 120.7 58.4 30.3 98.7 14.1 157.4 58.2 39.8 111.2 18.6 188.5 52.1 29.9 91.8 14.0 149.8 40.8 22.6 70.8 10.6 114.7 188.5V20 53.9 33.8 15.0 37.8 22.2 37.9 29.1 33.5 21.2 26.1 16.33S2 V20 72.0 45.2 20.0 71.8 9.4 110.7 50.5 29.7 89.9 13.9 147.5 50.6 38.9 102.3 18.2 177.8 44.7 28.3 82.4 13.2 137.4 34.9 21.8 63.8 10.2 106.1 177.8V30 35.14 26.7 10.5 29.6 15.0 29.1 19.4 26.2 14.7 20.4 11.13S2 V30 72.0 54.7 21.5 83.3 10.1 125.1 60.6 30.7 101.5 14.4 161.2 59.6 39.7 112.5 18.6 189.7 53.7 30.1 93.7 14.1 152.2 41.8 22.7 72.1 10.6 116.2 189.7M15 391.44 295.4 123.1 329.4 176.0 329.8 237.6 295.1 178.9 226.5 136.23S2 M15 72.0 54.3 22.6 84.5 10.6 128.4 60.6 32.4 103.7 15.1 166.5 60.7 43.7 118.8 20.4 203.6 54.3 32.9 98.1 15.4 161.9 41.7 25.1 75.0 11.7 123.6 203.6V10 43.23 28.9 11.9 32.4 17.6 32.5 23.4 28.9 17.3 22.7 13.23S2 V10 72.0 48.1 19.8 74.5 9.3 113.0 54.0 29.3 93.0 13.7 149.9 54.1 39.0 106.0 18.2 181.6 48.1 28.8 86.5 13.5 142.4 37.8 22.0 67.1 10.3 109.7 181.6
R01
-190
34
PI
Load Effect FC143S2 FC12FC01 FC02 FC11
B04-
0307
2
PCS
S11-
1903
3B0
2-11
052
B04-
1105
7B0
2-11
112
R01
-550
11S0
6-63
081
S14-
3308
4B0
1-79
031
Bridge Max
Bridge Load Effect 3S2 FC01 FC02 FC11 FC12 FC14 Max
Truck Projections 46

mean stdev >80% mean >80% stdev Truck mean stdev >80% mean >80% stdev Truck mean stdev >80% mean >80% stdev Truck mean stdev >80% mean >80% stdev Truck mean stdev >80% mean >80% stdev TruckM15 823.45 540.1 242.2 609.3 359.5 615.0 482.4 543.3 356.1 425.3 274.13S2 M15 72.0 47.2 21.2 75.4 9.9 116.5 53.3 31.4 95.1 14.7 156.1 53.8 42.2 109.9 19.7 191.8 47.5 31.1 88.9 14.6 149.4 37.2 24.0 69.1 11.2 115.6 191.8V10 53.27 34.3 15.2 38.3 22.6 38.3 29.5 33.9 21.4 26.4 16.53S2 V10 72.0 46.4 20.5 73.7 9.6 113.6 51.8 30.5 92.4 14.3 151.7 51.8 39.9 104.8 18.6 182.2 45.8 28.9 84.3 13.5 140.4 35.7 22.3 65.3 10.4 108.6 182.2M15 819 537.4 240.4 606.3 357.5 612.0 479.8 540.7 354.2 423.3 272.63S2 M15 72.0 47.2 21.1 75.4 9.9 116.4 53.3 31.4 95.1 14.7 156.1 53.8 42.2 109.9 19.7 191.8 47.5 31.1 89.0 14.6 149.4 37.2 24.0 69.1 11.2 115.6 191.8V10 53.2 34.2 15.2 38.3 22.5 38.3 29.5 33.9 21.4 26.3 16.53S2 V10 72.0 46.3 20.6 73.7 9.6 113.6 51.8 30.5 92.3 14.2 151.4 51.8 39.9 104.9 18.7 182.4 45.9 29.0 84.4 13.5 140.6 35.6 22.3 65.3 10.4 108.6 182.4M15 1252.7 816.1 378.8 914.0 552.9 912.2 722.6 808.0 533.8 621.0 414.23S2 M15 72.0 46.9 21.8 75.9 10.2 118.1 52.5 31.8 94.8 14.9 156.5 52.4 41.5 107.7 19.4 188.3 46.4 30.7 87.3 14.3 146.8 35.7 23.8 67.4 11.1 113.6 188.3V10 58 37.8 17.2 41.8 24.9 41.7 32.4 37.0 23.6 28.4 18.43S2 V10 72.0 46.9 21.4 75.3 10.0 116.8 51.9 30.9 93.0 14.4 153.0 51.8 40.2 105.3 18.8 183.3 45.9 29.3 84.9 13.7 141.8 35.3 22.8 65.6 10.7 110.0 183.3M15 288.3 212.3 88.3 235.5 123.2 235.4 164.5 211.2 124.9 161.6 96.23S2 M15 72.0 53.0 22.1 82.4 10.3 125.2 58.8 30.8 99.7 14.4 159.5 58.8 41.1 113.4 19.2 193.2 52.7 31.2 94.2 14.6 154.8 40.4 24.0 72.3 11.2 118.9 193.2V10 36.5 27.1 10.7 30.1 15.5 29.9 20.3 26.9 15.3 20.9 11.53S2 V10 72.0 53.5 21.1 81.5 9.9 122.5 59.4 30.6 100.0 14.3 159.4 59.0 40.0 112.2 18.7 190.0 53.1 30.2 93.2 14.1 151.8 41.2 22.7 71.4 10.6 115.4 190.0M25 915.2 591.8 268.3 667.1 397.2 672.0 529.6 593.9 391.1 463.3 301.33S2 M25 72.0 46.6 21.1 74.6 9.9 115.6 52.5 31.2 94.0 14.6 154.7 52.9 41.7 108.3 19.5 189.2 46.7 30.8 87.7 14.4 147.4 36.4 23.7 68.0 11.1 114.0 189.2V20 54.53 35.1 15.7 39.1 23.1 39.1 30.2 34.6 21.9 26.8 17.03S2 V20 72.0 46.3 20.7 73.9 9.7 114.2 51.6 30.5 92.2 14.3 151.4 51.7 39.9 104.7 18.6 182.1 45.7 28.9 84.2 13.5 140.3 35.4 22.4 65.2 10.5 108.8 182.1M45 344.4 257.8 107.2 286.5 151.3 229.4 159.8 205.8 121.5 157.5 93.63S2 M45 72.0 53.9 22.4 83.7 10.5 127.2 59.9 31.6 102.0 14.8 163.4 48.0 33.4 92.4 15.6 157.2 43.0 25.4 76.8 11.9 126.1 32.9 19.6 59.0 9.1 96.9 163.4V40 40.08 28.1 11.3 31.4 16.7 29.7 20.0 26.7 15.1 20.8 11.43S2 V40 72.0 50.5 20.3 77.5 9.5 116.9 56.4 30.0 96.3 14.0 154.5 53.4 35.9 101.1 16.8 170.9 48.0 27.1 84.0 12.7 136.7 37.4 20.5 64.6 9.6 104.4 170.9M15 337.94 250.8 104.3 279.2 147.2 279.0 197.9 250.0 149.5 191.5 114.53S2 M15 72.0 53.4 22.2 83.0 10.4 126.1 59.5 31.4 101.2 14.7 162.1 59.4 42.2 115.5 19.7 197.4 53.3 31.9 95.6 14.9 157.5 40.8 24.4 73.3 11.4 120.6 197.4V10 39.59 28.0 11.2 31.2 16.4 31.2 21.7 27.8 16.2 21.8 12.33S2 V10 72.0 50.9 20.4 78.0 9.5 117.6 56.7 29.8 96.4 13.9 154.3 56.7 39.5 109.2 18.4 185.8 50.6 29.5 89.7 13.8 146.9 39.6 22.4 69.4 10.5 112.8 185.8
Average 188.631Std Dev 11.52
S05-
8202
2S0
6-82
022
S25-
8202
2S0
1-11
015
B02-
4608
2
PCA
Bridge Load Effect 3S2 FC12 FC14FC01 FC02 FC11 Max
Truck Projections 47
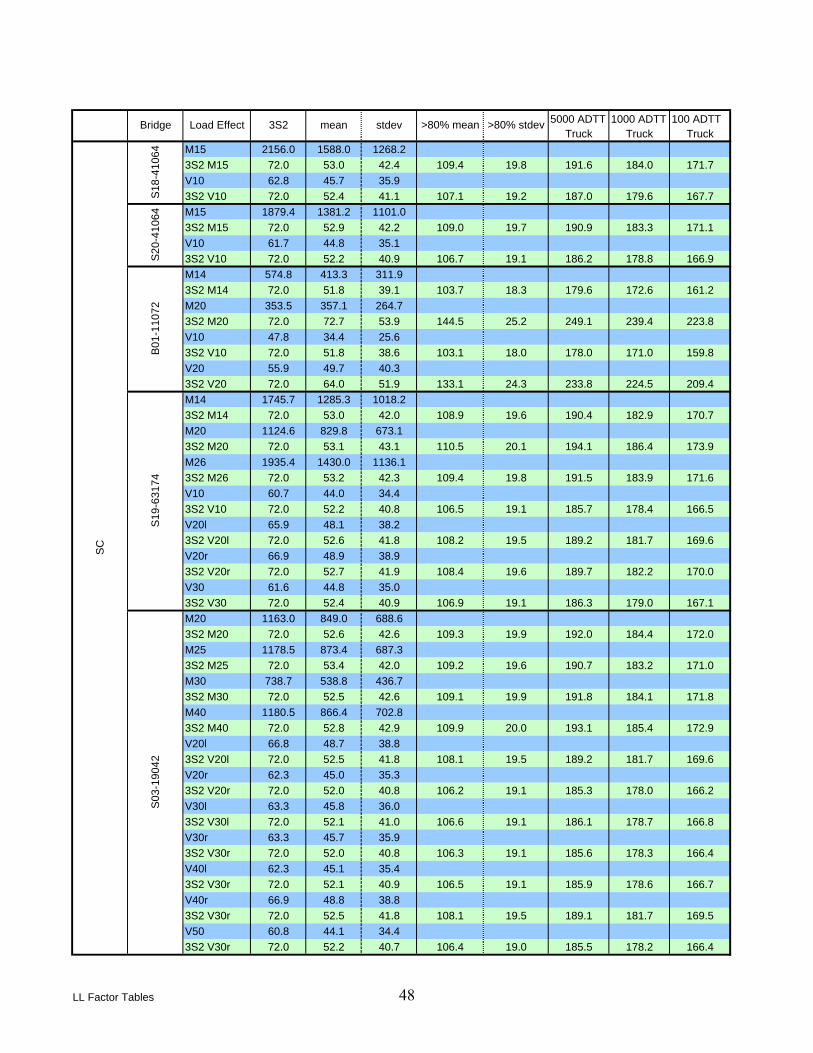
5000 ADTT 1000 ADTT 100 ADTTTruck Truck Truck
M15 2156.0 1588.0 1268.23S2 M15 72.0 53.0 42.4 109.4 19.8 191.6 184.0 171.7V10 62.8 45.7 35.93S2 V10 72.0 52.4 41.1 107.1 19.2 187.0 179.6 167.7M15 1879.4 1381.2 1101.03S2 M15 72.0 52.9 42.2 109.0 19.7 190.9 183.3 171.1V10 61.7 44.8 35.13S2 V10 72.0 52.2 40.9 106.7 19.1 186.2 178.8 166.9M14 574.8 413.3 311.93S2 M14 72.0 51.8 39.1 103.7 18.3 179.6 172.6 161.2M20 353.5 357.1 264.73S2 M20 72.0 72.7 53.9 144.5 25.2 249.1 239.4 223.8V10 47.8 34.4 25.63S2 V10 72.0 51.8 38.6 103.1 18.0 178.0 171.0 159.8V20 55.9 49.7 40.33S2 V20 72.0 64.0 51.9 133.1 24.3 233.8 224.5 209.4M14 1745.7 1285.3 1018.23S2 M14 72.0 53.0 42.0 108.9 19.6 190.4 182.9 170.7M20 1124.6 829.8 673.13S2 M20 72.0 53.1 43.1 110.5 20.1 194.1 186.4 173.9M26 1935.4 1430.0 1136.13S2 M26 72.0 53.2 42.3 109.4 19.8 191.5 183.9 171.6V10 60.7 44.0 34.43S2 V10 72.0 52.2 40.8 106.5 19.1 185.7 178.4 166.5V20l 65.9 48.1 38.23S2 V20l 72.0 52.6 41.8 108.2 19.5 189.2 181.7 169.6V20r 66.9 48.9 38.93S2 V20r 72.0 52.7 41.9 108.4 19.6 189.7 182.2 170.0V30 61.6 44.8 35.03S2 V30 72.0 52.4 40.9 106.9 19.1 186.3 179.0 167.1M20 1163.0 849.0 688.63S2 M20 72.0 52.6 42.6 109.3 19.9 192.0 184.4 172.0M25 1178.5 873.4 687.33S2 M25 72.0 53.4 42.0 109.2 19.6 190.7 183.2 171.0M30 738.7 538.8 436.73S2 M30 72.0 52.5 42.6 109.1 19.9 191.8 184.1 171.8M40 1180.5 866.4 702.83S2 M40 72.0 52.8 42.9 109.9 20.0 193.1 185.4 172.9V20l 66.8 48.7 38.83S2 V20l 72.0 52.5 41.8 108.1 19.5 189.2 181.7 169.6V20r 62.3 45.0 35.33S2 V20r 72.0 52.0 40.8 106.2 19.1 185.3 178.0 166.2V30l 63.3 45.8 36.03S2 V30l 72.0 52.1 41.0 106.6 19.1 186.1 178.7 166.8V30r 63.3 45.7 35.93S2 V30r 72.0 52.0 40.8 106.3 19.1 185.6 178.3 166.4V40l 62.3 45.1 35.43S2 V30r 72.0 52.1 40.9 106.5 19.1 185.9 178.6 166.7V40r 66.9 48.8 38.83S2 V30r 72.0 52.5 41.8 108.1 19.5 189.1 181.7 169.5V50 60.8 44.1 34.43S2 V30r 72.0 52.2 40.7 106.4 19.0 185.5 178.2 166.4
>80% mean >80% stdev
SC
S18-
4106
4S2
0-41
064
B01-
1107
2S1
9-63
174
S03-
1904
2
mean stdevBridge Load Effect 3S2
LL Factor Tables 48

5000 ADTT 1000 ADTT 100 ADTTTruck Truck Truck
M15 1803.21 1360.4 1084.23S2 M15 72.0 54.3 43.3 111.9 20.2 195.9 188.2 175.6V10 61.39 44.7 35.03S2 V10 72.0 52.4 41.0 107.0 19.2 186.7 179.3 167.4M15 1291.21 951.0 753.83S2 M15 72.0 53.0 42.0 108.9 19.6 190.5 183.0 170.8V10 58.3 42.1 32.73S2 V10 72.0 52.0 40.4 105.7 18.9 184.1 176.9 165.1M15 1717.08 1290.0 1027.23S2 M15 72.0 54.1 43.1 111.4 20.1 195.0 187.3 174.8V10 60.97 44.4 34.73S2 V10 72.0 52.4 41.0 106.9 19.2 186.5 179.1 167.2M15 1648.72 1219.8 970.63S2 M15 72.0 53.3 42.4 109.7 19.8 191.9 184.3 172.0M25 1616.98 1192.7 948.73S2 M25 72.0 53.1 42.2 109.3 19.7 191.3 183.7 171.5V10 60.61 43.9 34.33S2 V10 72.0 52.1 40.7 106.4 19.0 185.4 178.1 166.3V20 60.44 43.8 34.23S2 V20 72.0 52.2 40.7 106.4 19.0 185.4 178.1 166.3M15 314.34 275.9 195.53S2 M15 72.0 63.2 44.8 122.8 20.9 209.7 201.7 188.6M25 234.41 194.4 133.13S2 M25 72.0 59.7 40.9 114.1 19.1 193.4 186.1 174.2V10 38.18 31.0 21.63S2 V10 72.0 58.5 40.7 112.6 19.0 191.7 184.4 172.6V20 34.21 28.5 18.83S2 V20 72.0 60.0 39.6 112.6 18.5 189.4 182.3 170.8
>80% mean >80% stdev
PI
S11-
1903
3B0
2-11
052
B04-
1105
7B0
2-11
112
R01
-190
34
mean stdevBridge Load Effect 3S2
LL Factor Tables 49
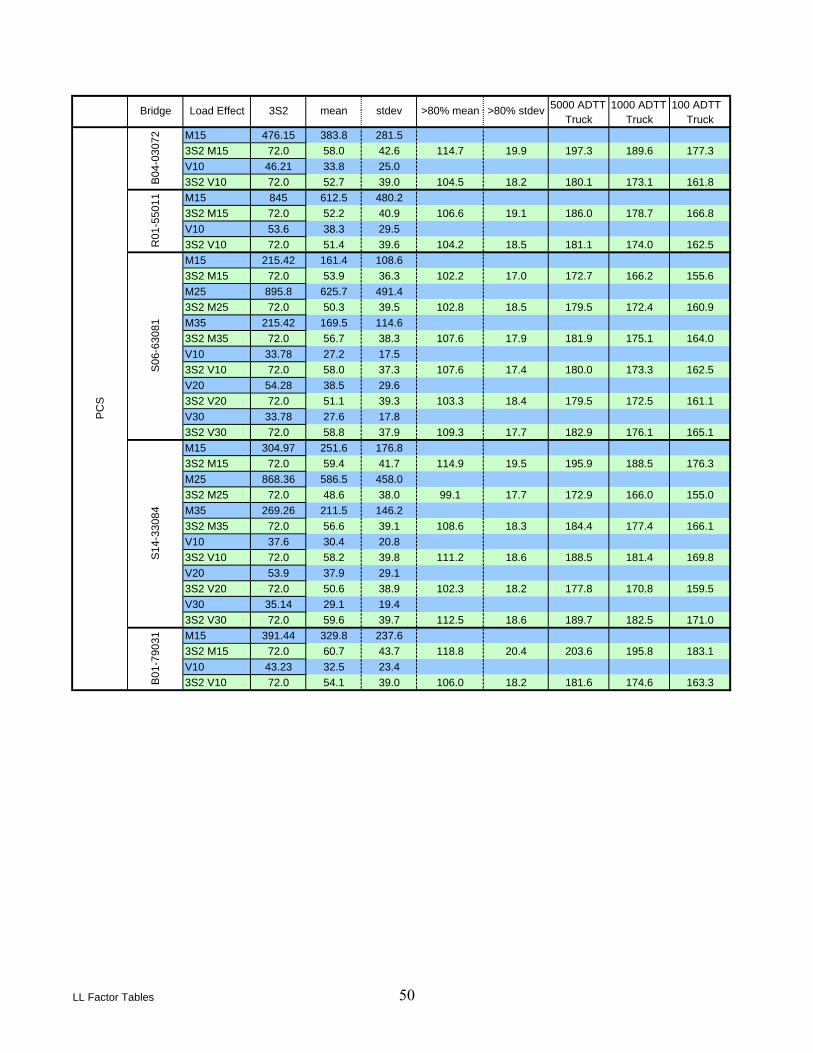
5000 ADTT 1000 ADTT 100 ADTTTruck Truck Truck
M15 476.15 383.8 281.53S2 M15 72.0 58.0 42.6 114.7 19.9 197.3 189.6 177.3V10 46.21 33.8 25.03S2 V10 72.0 52.7 39.0 104.5 18.2 180.1 173.1 161.8M15 845 612.5 480.23S2 M15 72.0 52.2 40.9 106.6 19.1 186.0 178.7 166.8V10 53.6 38.3 29.53S2 V10 72.0 51.4 39.6 104.2 18.5 181.1 174.0 162.5M15 215.42 161.4 108.63S2 M15 72.0 53.9 36.3 102.2 17.0 172.7 166.2 155.6M25 895.8 625.7 491.43S2 M25 72.0 50.3 39.5 102.8 18.5 179.5 172.4 160.9M35 215.42 169.5 114.63S2 M35 72.0 56.7 38.3 107.6 17.9 181.9 175.1 164.0V10 33.78 27.2 17.53S2 V10 72.0 58.0 37.3 107.6 17.4 180.0 173.3 162.5V20 54.28 38.5 29.63S2 V20 72.0 51.1 39.3 103.3 18.4 179.5 172.5 161.1V30 33.78 27.6 17.83S2 V30 72.0 58.8 37.9 109.3 17.7 182.9 176.1 165.1M15 304.97 251.6 176.83S2 M15 72.0 59.4 41.7 114.9 19.5 195.9 188.5 176.3M25 868.36 586.5 458.03S2 M25 72.0 48.6 38.0 99.1 17.7 172.9 166.0 155.0M35 269.26 211.5 146.23S2 M35 72.0 56.6 39.1 108.6 18.3 184.4 177.4 166.1V10 37.6 30.4 20.83S2 V10 72.0 58.2 39.8 111.2 18.6 188.5 181.4 169.8V20 53.9 37.9 29.13S2 V20 72.0 50.6 38.9 102.3 18.2 177.8 170.8 159.5V30 35.14 29.1 19.43S2 V30 72.0 59.6 39.7 112.5 18.6 189.7 182.5 171.0M15 391.44 329.8 237.63S2 M15 72.0 60.7 43.7 118.8 20.4 203.6 195.8 183.1V10 43.23 32.5 23.43S2 V10 72.0 54.1 39.0 106.0 18.2 181.6 174.6 163.3
>80% mean >80% stdevmean stdev
S14-
3308
4B0
1-79
031
PCS
B04-
0307
2R
01-5
5011
S06-
6308
1
Bridge Load Effect 3S2
LL Factor Tables 50

5000 ADTT 1000 ADTT 100 ADTTTruck Truck Truck
M15 823.45 615.0 482.43S2 M15 72.0 53.8 42.2 109.9 19.7 191.8 184.2 171.9V10 53.27 38.3 29.53S2 V10 72.0 51.8 39.9 104.8 18.6 182.2 175.1 163.5M15 819 612.0 479.83S2 M15 72.0 53.8 42.2 109.9 19.7 191.8 184.2 172.0V10 53.2 38.3 29.53S2 V10 72.0 51.8 39.9 104.9 18.7 182.4 175.3 163.7M15 1252.7 912.2 722.63S2 M15 72.0 52.4 41.5 107.7 19.4 188.3 180.8 168.8V10 58 41.7 32.43S2 V10 72.0 51.8 40.2 105.3 18.8 183.3 176.1 164.4M15 288.3 235.4 164.53S2 M15 72.0 58.8 41.1 113.4 19.2 193.2 185.8 173.9V10 36.5 29.9 20.33S2 V10 72.0 59.0 40.0 112.2 18.7 190.0 182.8 171.2M25 915.2 672.0 529.63S2 M25 72.0 52.9 41.7 108.3 19.5 189.2 181.7 169.6V20 54.53 39.1 30.23S2 V20 72.0 51.7 39.9 104.7 18.6 182.1 175.0 163.4M45 344.4 229.4 159.83S2 M45 72.0 59.9 31.6 102.0 14.8 163.4 157.7 148.5V40 40.08 29.7 20.03S2 V40 72.0 53.4 35.9 101.1 16.8 170.9 164.4 154.0M15 337.94 279.0 197.93S2 M15 72.0 59.4 42.2 115.5 19.7 197.4 189.8 177.6V10 39.59 31.2 21.73S2 V10 72.0 56.7 39.5 109.2 18.4 185.8 178.8 167.3
Average 109.1 19.2
Average 188.6 181.3 169.4
PCA
S05-
8202
2S0
6-82
022
S25-
8202
2S0
1-11
015
B02-
4608
2
>80% mean >80% stdevLoad Effect 3S2 mean stdevBridge
LL Factor Tables 51

Appendix E
52

Alongside Truck 188.6 kips
Number GVW (kips) Load Factor, γLL GVW (kips) Load Factor, γLL GVW (kips) Load Factor, γLL
1 33.4 1.80 33.4 1.80 39.0 1.802 41.4 1.80 47.4 1.80 45.4 1.803 54.4 1.80 54.4 1.80 54.4 1.804 67.4 1.80 67.4 1.80 67.4 1.805 78.0 1.80 84.0 1.75 84.0 1.756 95.4 1.61 101.4 1.54 101.4 1.547 113.4 1.44 119.4 1.39 119.4 1.398 85.4 1.73 91.4 1.65 91.4 1.659 51.4 1.80 51.4 1.80 49.5 1.8010 59.4 1.80 65.4 1.80 56.4 1.8011 77.4 1.80 83.4 1.76 67.1 1.8012 111.4 1.45 117.4 1.41 117.4 1.4113 119.4 1.39 125.4 1.35 125.4 1.3514 132.4 1.31 132.4 1.31 132.4 1.3115 137.4 1.28 143.3 1.25 143.3 1.2516 132.4 1.31 138.4 1.28 138.4 1.2817 145.4 1.24 151.4 1.21 151.4 1.2118 148.0 1.23 154.0 1.20 154.0 1.2019 111.4 1.45 117.4 1.41 117.4 1.4120 87.4 1.71 87.4 1.71 87.4 1.7121 145.4 1.24 151.4 1.21 151.4 1.2122 155.4 1.20 161.4 1.17 161.4 1.1723 148.0 1.23 154.0 1.20 154.0 1.2024 116.0 1.42 122.0 1.37 122.0 1.3725 158.0 1.18 164.0 1.16 164.0 1.1626 50.0 1.80 50.0 1.80 50.0 1.8027 72.0 1.80 72.0 1.80 72.0 1.8028 80.0 1.80 80.0 1.80 80.0 1.80
Number GVW (kips) Load Factor, γLL GVW (kips) Load Factor, γLL GVW (kips) Load Factor, γLL
1 120.0 1.39 120.0 1.39 120.0 1.392 120.0 1.39 120.0 1.39 120.0 1.393 120.0 1.39 118.0 1.40 114.0 1.434 120.0 1.39 108.0 1.48 98.0 1.585 120.0 1.39 104.0 1.52 88.0 1.706 126.0 1.35 108.0 1.48 90.0 1.677 138.0 1.28 114.0 1.43 93.0 1.648 149.6 1.22 127.6 1.34 105.6 1.509 158.4 1.18 129.6 1.33 105.6 1.5010 177.0 1.12 146.4 1.24 122.0 1.3711 180.0 1.11 159.0 1.18 138.0 1.2812 190.6 1.10 160.2 1.18 134.4 1.3013 195.0 1.10 168.8 1.14 147.4 1.2314 211.2 1.10 179.2 1.11 153.6 1.2015 238.0 1.10 204.0 1.10 170.0 1.1416 244.4 1.10 203.6 1.10 173.0 1.1317 272.6 1.10 232.4 1.10 182.8 1.1018 283.4 1.10 241.6 1.10 200.0 1.1019 277.2 1.10 234.4 1.10 200.8 1.1020 264.0 1.10 225.8 1.10 191.4 1.10
Overload Class Vehicle Load Factors for Strength Limit States, Annual Permits, 5000 ADTTClass A Class B Class C
Normal Loading Designated Loading Special Designated LoadingMichigan Legal Vehicle Load Factors for Strength Limit States, 5000 ADTT
LL Factor Tables 53
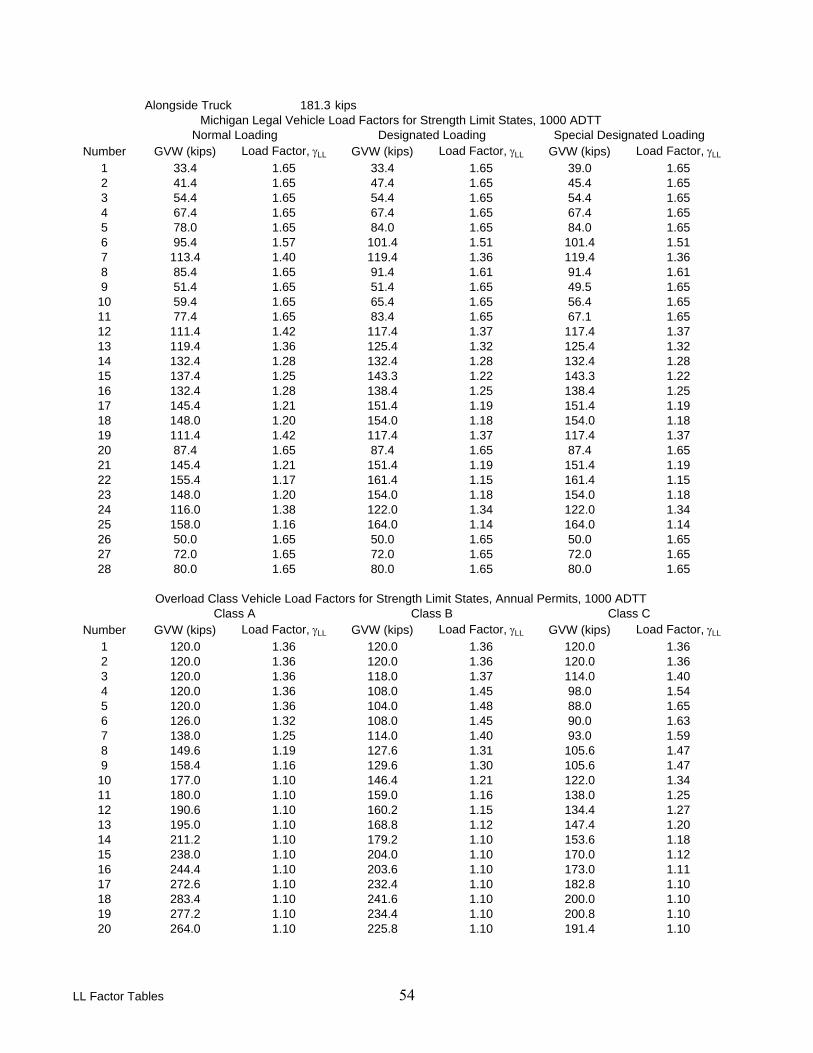
Alongside Truck 181.3 kips
Number GVW (kips) Load Factor, γLL GVW (kips) Load Factor, γLL GVW (kips) Load Factor, γLL
1 33.4 1.65 33.4 1.65 39.0 1.652 41.4 1.65 47.4 1.65 45.4 1.653 54.4 1.65 54.4 1.65 54.4 1.654 67.4 1.65 67.4 1.65 67.4 1.655 78.0 1.65 84.0 1.65 84.0 1.656 95.4 1.57 101.4 1.51 101.4 1.517 113.4 1.40 119.4 1.36 119.4 1.368 85.4 1.65 91.4 1.61 91.4 1.619 51.4 1.65 51.4 1.65 49.5 1.6510 59.4 1.65 65.4 1.65 56.4 1.6511 77.4 1.65 83.4 1.65 67.1 1.6512 111.4 1.42 117.4 1.37 117.4 1.3713 119.4 1.36 125.4 1.32 125.4 1.3214 132.4 1.28 132.4 1.28 132.4 1.2815 137.4 1.25 143.3 1.22 143.3 1.2216 132.4 1.28 138.4 1.25 138.4 1.2517 145.4 1.21 151.4 1.19 151.4 1.1918 148.0 1.20 154.0 1.18 154.0 1.1819 111.4 1.42 117.4 1.37 117.4 1.3720 87.4 1.65 87.4 1.65 87.4 1.6521 145.4 1.21 151.4 1.19 151.4 1.1922 155.4 1.17 161.4 1.15 161.4 1.1523 148.0 1.20 154.0 1.18 154.0 1.1824 116.0 1.38 122.0 1.34 122.0 1.3425 158.0 1.16 164.0 1.14 164.0 1.1426 50.0 1.65 50.0 1.65 50.0 1.6527 72.0 1.65 72.0 1.65 72.0 1.6528 80.0 1.65 80.0 1.65 80.0 1.65
Number GVW (kips) Load Factor, γLL GVW (kips) Load Factor, γLL GVW (kips) Load Factor, γLL
1 120.0 1.36 120.0 1.36 120.0 1.362 120.0 1.36 120.0 1.36 120.0 1.363 120.0 1.36 118.0 1.37 114.0 1.404 120.0 1.36 108.0 1.45 98.0 1.545 120.0 1.36 104.0 1.48 88.0 1.656 126.0 1.32 108.0 1.45 90.0 1.637 138.0 1.25 114.0 1.40 93.0 1.598 149.6 1.19 127.6 1.31 105.6 1.479 158.4 1.16 129.6 1.30 105.6 1.4710 177.0 1.10 146.4 1.21 122.0 1.3411 180.0 1.10 159.0 1.16 138.0 1.2512 190.6 1.10 160.2 1.15 134.4 1.2713 195.0 1.10 168.8 1.12 147.4 1.2014 211.2 1.10 179.2 1.10 153.6 1.1815 238.0 1.10 204.0 1.10 170.0 1.1216 244.4 1.10 203.6 1.10 173.0 1.1117 272.6 1.10 232.4 1.10 182.8 1.1018 283.4 1.10 241.6 1.10 200.0 1.1019 277.2 1.10 234.4 1.10 200.8 1.1020 264.0 1.10 225.8 1.10 191.4 1.10
Normal Loading Designated Loading Special Designated LoadingMichigan Legal Vehicle Load Factors for Strength Limit States, 1000 ADTT
Overload Class Vehicle Load Factors for Strength Limit States, Annual Permits, 1000 ADTTClass A Class B Class C
LL Factor Tables 54

Alongside Truck 169.4 kips
Number GVW (kips) Load Factor, γLL GVW (kips) Load Factor, γLL GVW (kips) Load Factor, γLL
1 33.4 1.40 33.4 1.40 39.0 1.402 41.4 1.40 47.4 1.40 45.4 1.403 54.4 1.40 54.4 1.40 54.4 1.404 67.4 1.40 67.4 1.40 67.4 1.405 78.0 1.40 84.0 1.40 84.0 1.406 95.4 1.40 101.4 1.40 101.4 1.407 113.4 1.35 119.4 1.31 119.4 1.318 85.4 1.40 91.4 1.40 91.4 1.409 51.4 1.40 51.4 1.40 49.5 1.4010 59.4 1.40 65.4 1.40 56.4 1.4011 77.4 1.40 83.4 1.40 67.1 1.4012 111.4 1.36 117.4 1.32 117.4 1.3213 119.4 1.31 125.4 1.27 125.4 1.2714 132.4 1.23 132.4 1.23 132.4 1.2315 137.4 1.21 143.3 1.18 143.3 1.1816 132.4 1.23 138.4 1.20 138.4 1.2017 145.4 1.17 151.4 1.14 151.4 1.1418 148.0 1.16 154.0 1.13 154.0 1.1319 111.4 1.36 117.4 1.32 117.4 1.3220 87.4 1.40 87.4 1.40 87.4 1.4021 145.4 1.17 151.4 1.14 151.4 1.1422 155.4 1.13 161.4 1.11 161.4 1.1123 148.0 1.16 154.0 1.13 154.0 1.1324 116.0 1.33 122.0 1.29 122.0 1.2925 158.0 1.12 164.0 1.10 164.0 1.1026 50.0 1.40 50.0 1.40 50.0 1.4027 72.0 1.40 72.0 1.40 72.0 1.4028 80.0 1.40 80.0 1.40 80.0 1.40
Number GVW (kips) Load Factor, γLL GVW (kips) Load Factor, γLL GVW (kips) Load Factor, γLL
1 120.0 1.30 120.0 1.30 120.0 1.302 120.0 1.30 120.0 1.30 120.0 1.303 120.0 1.30 118.0 1.32 114.0 1.344 120.0 1.30 108.0 1.39 98.0 1.405 120.0 1.30 104.0 1.40 88.0 1.406 126.0 1.27 108.0 1.39 90.0 1.407 138.0 1.20 114.0 1.34 93.0 1.408 149.6 1.15 127.6 1.26 105.6 1.409 158.4 1.12 129.6 1.25 105.6 1.4010 177.0 1.10 146.4 1.16 122.0 1.2911 180.0 1.10 159.0 1.12 138.0 1.2012 190.6 1.10 160.2 1.11 134.4 1.2213 195.0 1.10 168.8 1.10 147.4 1.1614 211.2 1.10 179.2 1.10 153.6 1.1415 238.0 1.10 204.0 1.10 170.0 1.1016 244.4 1.10 203.6 1.10 173.0 1.1017 272.6 1.10 232.4 1.10 182.8 1.1018 283.4 1.10 241.6 1.10 200.0 1.1019 277.2 1.10 234.4 1.10 200.8 1.1020 264.0 1.10 225.8 1.10 191.4 1.10
Overload Class Vehicle Load Factors for Strength Limit States, Annual Permits, 100 ADTTClass A Class B Class C
Normal Loading Designated Loading Special Designated LoadingMichigan Legal Vehicle Load Factors for Strength Limit States, 100 ADTT
LL Factor Tables 55

Appendix F
56

3.6.1.2 Design Vehicular Live Load
3.6.1.2.1 General
Vehicular live loading on the roadways of bridges or incidental structures, designated HL-93-mod, shall consist of a 1.2 factor times the combination of the:
• Design truck or design axle, and • Design lane load.
Except as modified in Article 3.6.1.3.1, each design
lane under consideration shall be occupied by either the design truck or axle, coincident with the lane load, where applicable. The loads shall be assumed to occupy 10.0 ft. transversely within a design lane.
3.6.1.2.2 Design Truck
The weights and spacings of axles and wheels for the design truck shall be as specified in Figure 1. A dynamic load allowance shall be considered as specified in Article 3.6.2.
Except as specified in Articles 3.6.1.3.1 and 3.6.1.4.1, the spacing between the two 32.0-kip axles shall be varied between 14.0 ft. and 30.0 ft. to produce extreme force effects.
57
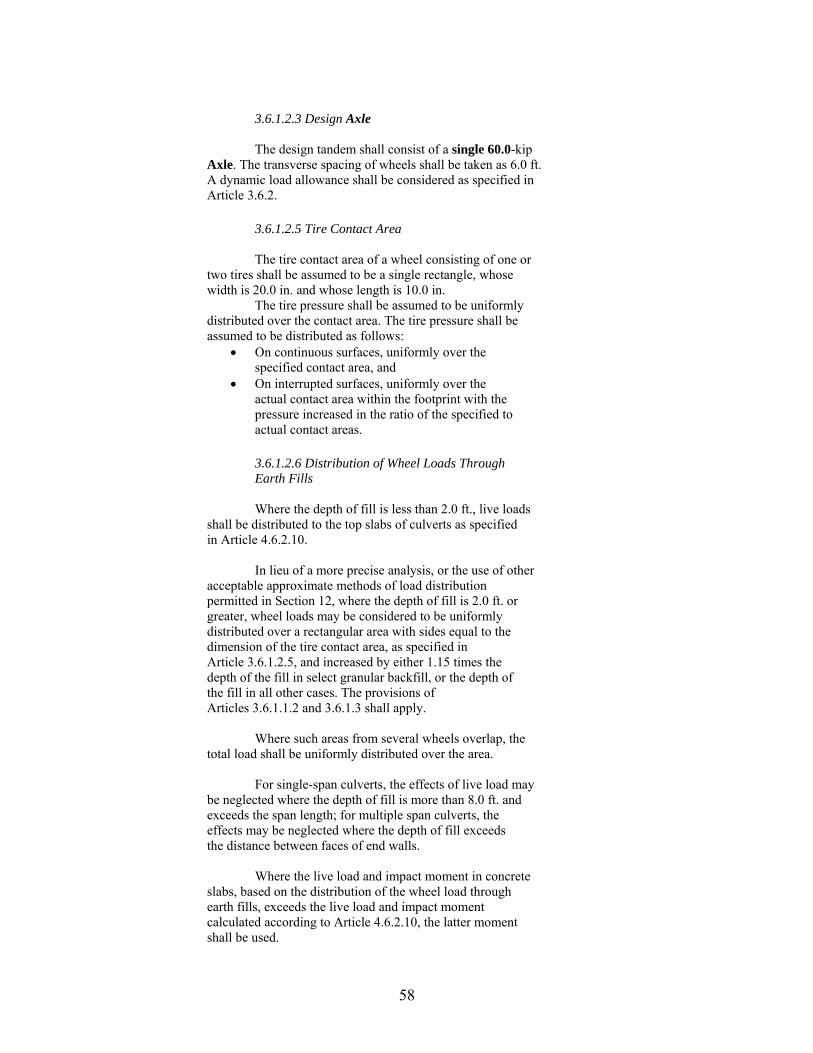
3.6.1.2.3 Design Axle
The design tandem shall consist of a single 60.0-kip
Axle. The transverse spacing of wheels shall be taken as 6.0 ft. A dynamic load allowance shall be considered as specified in Article 3.6.2.
3.6.1.2.5 Tire Contact Area
The tire contact area of a wheel consisting of one or two tires shall be assumed to be a single rectangle, whose width is 20.0 in. and whose length is 10.0 in.
The tire pressure shall be assumed to be uniformly distributed over the contact area. The tire pressure shall be assumed to be distributed as follows:
• On continuous surfaces, uniformly over the specified contact area, and
• On interrupted surfaces, uniformly over the actual contact area within the footprint with the pressure increased in the ratio of the specified to actual contact areas.
3.6.1.2.6 Distribution of Wheel Loads Through Earth Fills
Where the depth of fill is less than 2.0 ft., live loads
shall be distributed to the top slabs of culverts as specified in Article 4.6.2.10.
In lieu of a more precise analysis, or the use of other acceptable approximate methods of load distribution permitted in Section 12, where the depth of fill is 2.0 ft. or greater, wheel loads may be considered to be uniformly distributed over a rectangular area with sides equal to the dimension of the tire contact area, as specified in Article 3.6.1.2.5, and increased by either 1.15 times the depth of the fill in select granular backfill, or the depth of the fill in all other cases. The provisions of Articles 3.6.1.1.2 and 3.6.1.3 shall apply.
Where such areas from several wheels overlap, the total load shall be uniformly distributed over the area.
For single-span culverts, the effects of live load may be neglected where the depth of fill is more than 8.0 ft. and exceeds the span length; for multiple span culverts, the effects may be neglected where the depth of fill exceeds the distance between faces of end walls.
Where the live load and impact moment in concrete slabs, based on the distribution of the wheel load through earth fills, exceeds the live load and impact moment calculated according to Article 4.6.2.10, the latter moment shall be used.
58
3.6.1.3 Application of Design Vehicular Live Loads 3.6.1.3.1 General
Unless otherwise specified, the extreme force effect
shall be taken as the larger of the following: • 1.2 times the sum of the effect of the design axle and
the effect of the design lane load, or • 1.2 times the sum of the effect of one design truck
with the variable axle spacing specified in Article 3.6.1.2.2, and the effect of the design lane load, and
• For both negative moment between points of contraflexure under a uniform load on all spans, and reaction at interior piers only, 90 percent of the effect of two design trucks spaced a minimum of 50.0 ft. between the lead axle of one truck and the rear axle of the other truck, combined with 90 percent of the effect of the design lane load. The distance between the 32.0-kip axles of each truck shall be taken as 14.0 ft.
Axles that do not contribute to the extreme force
effect under consideration shall be neglected.
Both the design lanes and the 10.0-ft. loaded width in each lane shall be positioned to produce extreme force effects. The design truck or axle shall be positioned transversely such that the center of any wheel load is not closer than:
• For the design of the deck overhang—1.0 ft. from the face of the curb or railing, and
• For the design of all other components—2.0 ft. from the edge of the design lane. Unless otherwise specified, the lengths of design
lanes, or parts thereof, that contribute to the extreme force effect under consideration, shall be loaded with the design lane load.
59


