BULLETN 308REPRINTED JUNE 1958 SOURCES a NITROGEN o COTTON ad CORN p S Ur to'b FORI THE ADVANCEMENT~ \~ tUV AND ARTS X , 110 g l AGRICULTURAL EXPERIMENT STATION of M~e ALABAMA POLYTECHNIC INSTITUTE E. V. Smith, Director Auburn, Alabama BULLETIN 308
Transcript
BULLETN 308REPRINTED JUNE 1958
SOURCES a NITROGENo COTTON ad CORN
p S Ur to'b
FORI THE
ADVANCEMENT~ \~
tUV AND ARTS X ,
110 g l
AGRICULTURAL EXPERIMENT STATION
of M~e ALABAMA POLYTECHNIC INSTITUTE
E. V. Smith, Director Auburn, Alabama
BULLETIN 308
CONTENTSPage
DESCRIPTION OF FERTILIZER MATERIALSTHAT CONTAIN NITROGEN 5
GENERAL DESCRIPTION OF FIELD EXPERIMENTS 7
EXPERIMENTS WITH SEVERAL SOURCESOF NITROGEN, 1929-45 9RESULTS ON COTTON __-__ 9
Sand Mountain Substation, Hartsells Fine Sandy Loam 9Wiregrass Substation, Norfolk Fine Sandy Loam 13Tennessee Valley Substation, Decatur Clay Loam 18
RESULTS ON CORN .--------------- 17Sand Mountain Substation, Hartsells Fine Sandy Loam 17Wiregrass Substation, Norfolk Fine Sandy Loam 17Tennessee Valley Substation, Decatur Clay Loam 17
EXPERIMENTS WITH AMMONIUM SULFATE ANDSODIUM NITRATE, 1929-45 23RESULTS ON COTTON ---- 23
Wiregrass Substation, Norfolk Fine Sandy Loam 23Monroeville Experiment Field, Magnolia Fine Sandy Loam 23Sand Mountain Substation, Hartsells Fine Sandy Loam 23Tennessee Valley Substation, Decatur Clay Loam 26
RESULTS ON CORN -------- __ 26
Wiregrass Substation, Norfolk Fine Sandy Loam 26Monroeville Experiment Field, Magnolia Fine Sandy Loam 26Sand Mountain Substation, Hartsells Fine Sandy Loam 29Tennessee Valley Substation, Decatur Clay Loam 29
EXPERIMENTS WITH AMMONIUM -SULFATE, SODIUMNITRATE, AND AMMONIUM NITRATE, 1946-55 29RESULTS ON COTTON 80
Wiregrass Substation, Norfolk Fine Sandy Loam 30Monroeville Experiment Field, Magnolia Fine Sandy Loam 30Sand Mountain Substation, Hartsells Fine Sandy Loam 30Tennessee Valley Substation, Decatur Clay Loam 33
RESULTS ON CORN 35Wiregrass Substation, Norfolk Fine Sandy Loam 35Monroeville Experiment Field, Magnolia Fine Sandy Loam -- 35Sand Mountain Substation, Hartsells Fine Sandy Loam ----- 35Tennessee Valley Substation, Decatur Clay Loam 35
OTHER EXPERIMENTS WITH SOURCES OF NITROGENON COTTON 39SOURCES OF NITROGEN ON UNLIMED AND LIMED
CHESTERFIELD SANDY LOAM AT AUBURN, 1928-41 39
SODIUM NITRATE AND AMMONIUM SULFATE WITH AND WITHOUTLIME ON CHESTERFIELD SANDY LOAM, AUBURN, 1925-55 ---- 39
RATIOS OF ORGANIC TO INORGANIC NITROGEN IN FETILIZERSFOR COTTON ON DECATUR CLAY LOAM, ALEXANDRIAEXPERIMENT FIELD, 1929-43 41
FIRST PRINTING 31/2M, NOVEMBER 1957SECOND PRINTING 3M, JUNE 1958
SOURCES of NITROGEN oCOTTON ad CORN
i 4eaama
C. E. SCARSBROOK, Associate Soil Chemist
J. T. COPE, Jr., Associate Agronomist
N ITROGEN MUST BE applied to Alabama soils for economic pro-duction of all non-leguminous crops. Although these soils releasesome available nitrogen each season from their organic nitrogenreserve, the amount released is too small for satisfactory cropproduction. Additional nitrogen, therefore, must be obtainedfrom other sources. It may be added to the soil by leguminousplants, plant residues, animal residues, or by commercial ferti-lizers. Only nitrogen from commercial fertilizers is consideredin this report.
Plants can utilize several forms of nitrogen, but the ammoniaand nitrate forms are of primary importance. The ammonia formmay be attached to soil particles, and while thus attached it isnot subject to appreciable leaching. Nitrate is not held to soilparticles and is subject to leaching unless held by incorporationinto organic matter by soil organisms. Ammonia is rapidly con-verted to the more easily leached nitrate under most Alabamagrowing conditions.
Most plants absorb both nitrate and ammonia during all stagesof growth, but the relative proportion of each may vary duringthe life of the plant (1). Ammonia is rapidly converted to nitratewhen the soil is warm, moist, well aerated, and the pH is not toolow. This conversion, called nitrification, is a biological processof soil organisms. Most soils contain an ample supply of thenecessary organisms. Under favorable conditions, nitrificationbegins soon after application of ammonia and it is largely com-
ALABAMA AGRICULTURAL EXPERIMENT STATION
plete wxithini a fexx' daxys to aite fxx\ weeks. Thie rate of nitrificatiounis (deereased in wxin ter doue to hloxer sili tem peraturles, but in no)part of Alaa (10 soil temp[eratulres remain low enough toprexv(ent niitrification for lonig periods.
Thie (lenunits aceoli panx in g niitrogen in some fert ilizers maxhax c anI effeet on crop p)roduiction Cahlcium ciitrate [C(0 a7 NOaninoiiim nitrate pinls liiiistolie [I 11NO1 -~ (Xi( () and cal-cium c aniamid [( a(CN ) xvill produce a y ieldl responise in a(ddi-tioni to that fromi nitrogen xx1c heialeitilo is deficienit. Crops onl
sul I r-deficient soils lnam re sponid to ammvoiimi sulfate L(N itISod] b~ecause of the sulfur wxhielh it conitains. Thie sodiimi insodiiii nitrate [NAX():;1, though not an essentdial e'lemlent, haslcenl found( 1)eneficial for soniie crops. Thie amnli li phosphatessupljy txxo nmajor elemnts, nitro aeniand phosphorus, in the samemiaterial. Both iiitrogei and~ potassinii are supplied lIm potassinll
niitrate [h1\0:j. ( n the otlherhlalidl aiilixdrous ammiinlia [Nil],alioiioliiuli niitrlit( LNII NO:, and ureca [COANI) * airc of xvaluesolecx for the rnitrog'ii tlhex conltaini. T[le niaturial o1ganiics may
con tain niiimi elemnie ts of, xaloe to crops.Nitrogen fertilizers ii ax make the soil miore aeidl, l(ss acidl, or
liax c no0 (e1fect on aeidhit\ The dex eloplielt of aeihitxv froimialiiiioliia fertilizers is largelx a result of niitrification xxhei el\aunoi)1ia is chiairiedl to nitrate xx itli a release of acid into tlhe soil.
r 2.
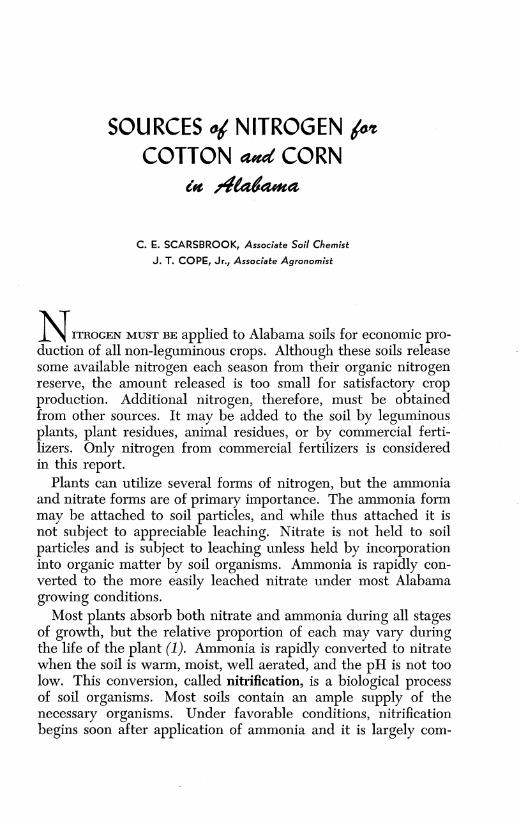
V AThis cotton is growing an Hartsells fine sandy loom where acidifying nitrogenfertilizers were used without lime from 1929 until 1956. Crabgrass severely infeststhese acid plots when cultivation is stopped.
SOURCES of NITROGEN 5
Some nitrogen fertilizers leave an excess of a base (such as cal-cium or sodium) in the soil, which reduces soil acidity.
DESCRIPTION or FERTILIZER MATERIALSTHAT CONTAIN NITROGEN
There are thousands of compounds that contain nitrogen, butonly a few can be produced economically for use as fertilizer.The materials listed and discussed here include those used inexperiments reported in this publication, as well as some othersthat have received considerable distribution in commercial trade.
Ammonium nitrate [NH 4NO 3] is produced by combining am-monia with nitric acid. The resulting product is white in color.It contains 32.5 to 33.5 per cent nitrogen, with equal parts ofammonia and nitrate nitrogen. The fertilizer grade is in the formof crystals or pellets that have been coated with a conditioner toreduce caking. It is acid-forming and requires 60 pounds of lime-stone to neutralize 100 pounds of material.
Ammonium nitrate and limestone are sometimes mixed to forma nonacid-forming product containing 16 to 20.5 per cent nitro-gen. This product has been marketed under various names. Itcontains only enough limestone to neutralize the acidity pro-duced by the ammonium nitrate.
Ammonium phosphates are manufactured by combining am-monia and phosphoric acid. There are two principal forms of thisfertilizer, monoammonium phosphate [NH 4H2PO 4] and diammo-nium phosphate [(NH 4)2HP0 4]. Monoammonium phosphate con-tains 11 per cent nitrogen and 48 per cent P20 5, and diammoniumphosphate contains 21 per cent nitrogen and 54 per cent P20 5.Both are acid-forming.
Ammonium sulfate [(NH 4)280 4] is produced by the reactionof ammonia with sulfuric acid. Large quantities have been pro-duced using by-product ammonia from coke ovens. More re-cently an increasing amount has been made by reacting syntheticammonia with sulfuric acid. The nitrogen content is 20.5 percent and the color may vary from white to yellow to gray. Ammo-nium sulfate is acid-forming and requires about 110 pounds oflimestone to neutralize 100 pounds of material.
Anhydrous ammonia [NH 3] is stored as a liquid under pres-sure. It has a gauge pressure of 75 p.s.i. at 50 ° F. and 197 p.s.i.
ALABAMA AGRICULTURAL EXPERIMENT STATION
at 100 ° F. The nitrogen content is 82 per cent. When releasedat atmospheric pressure, it forms a colorless gas that is extremelyirritating to the nose, eyes, skin, and lungs. It should be releasedin the soil deep enough so that soil above the release point willseal in the gas. The reaction of ammonia with soil constituentsis rapid; the initial product is ammonium hydroxide with a re-sulting alkaline reaction. This alkaline reaction is only temporary,and as a result of bacterial action, the alkaline reaction disappearsand the end result is an increase in soil acidity. One hundredpounds of anhydrous ammonia requires about 148 pounds ofcalcium carbonate for neutralization.
Nitrogen solutions of several different kinds are produced forfertilizer. These are water solutions of various combinations ofammonia, urea, and ammonium nitrate. The nitrogen contentranges from 21 to 53 per cent. They may have no pressure or arelatively high pressure depending upon the content of freeammonia. Pressure solutions are applied below the soil surfaceto seal in the gas, whereas non-pressure solutions may be appliedon top of the soil.
Calcium cyanamid [CaCN 2] is manufactured from coke, lime-stone, and atmospheric nitrogen. It was one of the earlier prod-ucts of the synthetic fixation of atmospheric nitrogen. It is pro-duced in powdered, granulated, and pelleted forms, and contains20 to 22 per cent nitrogen. It produces an alkaline reaction in thesoil equivalent to 63 pounds of limestone per 100 pounds ofcyanamid. The commercial product is black because of the pres-ence of free carbon. Calcium cyanamid is toxic on direct contactwith seeds and seedlings. For row crops it should be applied atleast one week prior to planting.
Calcium nitrate [Ca(NO3)2] is made by reacting limestone withnitric acid. The resulting product is a white material that readilyabsorbs moisture from the atmosphere. The tendency to becomewet and soggy has been reduced by mixing with limestone or bycoating the particles. The fertilizer must be used shortly afterthe moisture-resistant bags are opened. The fertilizer grade con-tains enough ammonium nitrate to bring the nitrogen percentageup to 15.5 It has a slight neutralizing effect on acid soils. It hasbeen produced as fertilizer in Europe, but has not been manu-factured on a large scale in this country.
6
SOURCES of NITROGEN 7
Cottonseed meal is a by-product of the cottonseed oil industry.It is yellowish brown in color and contains 6 to 9 per cent nitro-gen. Because of demand for the product as feed, it is now seldomused as a fertilizer.
Potassium nitrate [KNO3] is found in a few natural depositsor is manufactured by reacting nitric acid with caustic potashor potassium carbonate. It has less tendency to absorb moisturethan most other forms of nitrate. It contains about 13 per centnitrogen and 43 per cent potash and has a slight neutralizingeffect on acid soils.
Sodium nitrate [NaNO 3] has two important sources. One isthe refined product from deposits in the desert plateaus of Chile.The other is made by reacting nitric acid with sodium carbonate.Both products contains about 16 per cent nitrogen. Sodium ni-trate is white in color and is marketed in pellet form. It has aslight neutralizing effect on acid soils.
Urea [CO(NH 2) 2] is a synthetic product produced by reactingammonia and carbon dioxide under high pressure. The fertilizermaterial is white or greenish and is usually marketed in pelletform. It contains 42 to 45 per cent nitrogen. Nitrogen in ureahydrolyzes to ammonium form of nitrogen in the soil. The am-monia is changed to nitrate, resulting in increased acidity.
Some of the important characteristics of the various nitrogenmaterials discussed are listed in Table 1.
GENERAL DESCRIPTION OF FIELD EXPERIMENTS
The Agricultural Experiment Station of the Alabama Polytech-nic Institute has done a large amount of research on sources ofnitrogen. This work dates back to 1911 when the sources ofnitrogen were the natural organics, ammonium sulfate, calciumcyanamid, and sodium nitrate. This early work is covered inpublications issued prior to 1933. Pierre (2, 3) reported the effectsof various nitrogenous fertilizers on soil reaction and determinedthe equivalent acidity and basicity of the different sources ofnitrogen, Table 1. Tidmore and Williamson (4) reported resultsfrom many field and laboratory experiments conducted prior to1932 in a comprehensive bulletin. Volk and Tidmore (5) pub-lished data on the effect of different nitrogen sources on soilreaction, exchangeable ions, and yields of crops. The present
8 ALABAMA AGRICULTURAL EXPERIMENT STATION
TABLE 1. NUTRIENT CONTENT AND EQUIVALENT ACIDITY OR BASICITY OF CERTAINSOURCES OF NITROGEN
Nutrient content Equivalent acidity or basicity-lb. CaCO31
Treatment Per pound of Per 100 poundsTreatme NitrogenOther nitrogen of product
nutrientsAcidity Basicity Acidity Basicity
Pct. Pct. Lb. Lb. Lb. Lb.
Ammonium nitrate_ 33.5 1.80 60Ammonium nitrate_
limestone____________ 20.5 16 Ca 0 0 0 0Ammonium sulfate_ 20.5 23 S 5.35 110Anhydrous
ammonia ___________ 82.0 ____ 1.80 148Calcium cyanamid._ 22.0 38 Ca 2.85 63Calcium nitrate _____ 15.5 44 Ca 1.35 21Cottonseed meal-.... 6 to 9 2 P205 1.45 10
report covers the results of the continuation of some experimentsincluded in the previously mentioned publications plus work thatwas started subsequently.
Long-term experiments on sources of nitrogen for cotton andcorn at six locations are reported here. The soil types and theirlocations are: Decatur clay loam at the Tennessee Valley Sub-station and Alexandria Experiment Field, Hartsells fine sandyloam at the Sand Mountain Substation, Norfolk fine sandy loamat-the Wiregrass Substation, Magnolia fine sandy loam at theMonroeville Experiment Field, and Chesterfield sandy loam atthe Main Station at Auburn.
All except those on the Main Station were conducted on tiersconsisting of 34 1/30-acre plots. Plots 1A to 17A were laid outfrom left to right, and duplicate plots 1B to 17B from right to left.Plots 1, 5, 9, 13, and 17 in each duplicate were check plots.
Fertilizer and lime treatments, and methods of application aregiven in the introductions to the various experiments and as foot-notes to the tables. Pre-planting fertilizers were applied in afurrow and bedded on before planting. Sidedress applicationswere applied beside the row 35 to 40 days after planting.
SOURCES of NITROGEN 9
In experiments that involved both cotton and corn, these cropswere in a 2-year rotation. Both crops were planted each yearon alternate tiers. Crop residues were left on the plots in allexperiments.
Since the cost of nitrogen from the various sources and pricesreceived by farmers for cotton and corn vary from year to year,relative returns per unit cost of nitrogen are not included in thispublication. Returns may be calculated from the yield data pre-sented, using prices that prevail at any time.
EXPERIMENTS WITH SEVERAL SOURCESOF NITROGEN, 1929-45
Sources of nitrogen experiments were conducted at the SandMountain, Tennessee Valley, and Wiregrass substations using acotton-corn rotation. Sources used were ammonium nitrate, so-dium nitrate, ammonium sulfate, urea, calcium nitrate, diammo-nium phosphate, cottonseed meal, and calcium cyanamid. Bothlimed and unlimed tiers were included at the Tennessee Valleyand Wiregrass substations. Limed tiers received 2,250 poundsof calcitic limestone per acre when the experiments were begunand sufficient dolomitic limestone annually mixed with the ferti-lizer to neutralize the acid-forming sources of nitrogen. Thelimed tiers were adjacent to the unlimed tiers. Cotton received86 pounds of N, 48 pounds of P2 05, and 24 pounds of K20 peracre annually. Corn received 86 pounds of N, 24 pounds of P20 5,and 12 pounds of K20 per acre annually. Nitrogen, phosphate,and potash treatments were the same on both limed and unlimedtiers. Sidedressed plots received one-fourth of the N at plantingand three-fourths as a sidedressing.
Relative yield increases were calculated by using a value of100 per cent for the yield increase from a split application ofsodium nitrate. This source was selected as a base since it wasused in all tests.
RESULTS ON COTTON
Sand Mountain Substation, Hartsells Fine Sandy Loam
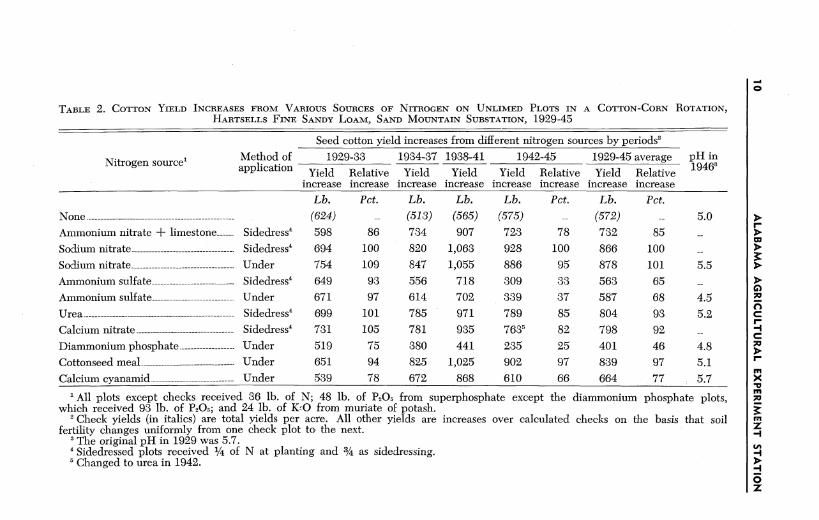
UNLIMED (TABLE 2). Average yields at this location for the1929-45 period show little or no differences between sodium ni-trate, cottonseed meal, urea, and calcium nitrate. These sources
TABLE 2. COTTON YIELD INCREASES FROM VARIOUS SOURCES OF NITROGEN ON UNLIMED PLOTS IN A COTTON-CORN ROTATION,HARTSELLS FINE SANDY LOAM, SAND MOUNTAIN SUBSTATION, 1929-45
Seed cotton yield increases from different nitrogen sources by periods'
Method of 1929-33 1934-37 1938-41 1942-45 1929-45 average pH in
1All plots except checks received 36 lb. of N; 48 lb. of P20 5 from superphosphate except the diammonium phosphate plots,which received 93 lb. of P205; and 24 lb. of Kf0 from muriate of potash.
2 Check yields (in italics) are total yields per acre. All other yields are increases over calculated checks on the basis that soilfertility changes uniformly from one check plot to the next.'The original pH in 1929 was 5.7.
4Sidedressed plots received / of N at planting and / as sidedressing.' Changed to urea in 1942.
r
.TI-O
rYic)
C
8rr
3I-
3-I
C
mxm
z
0z
SOURCES of NITROGEN
r~4 ~ / ~ -
,y < a yC
'] 3",d ' "e.. W t'p v r -^ ' A
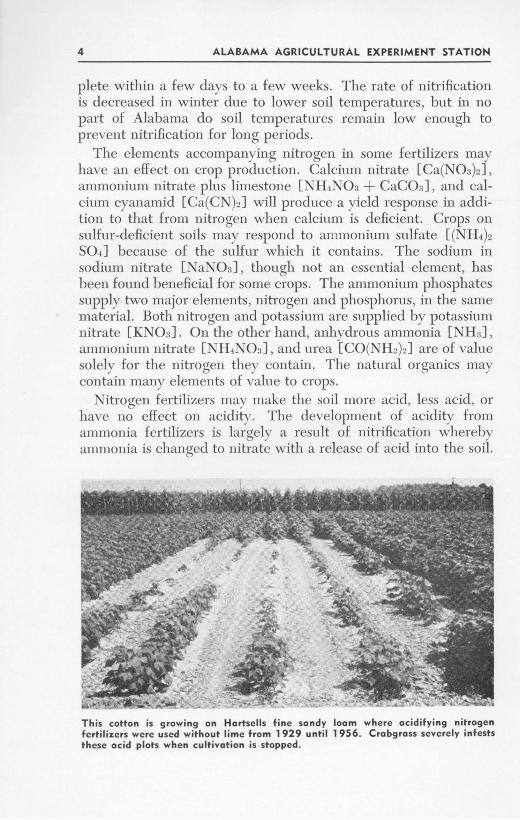
Cotton at right is nitrogen deficient, whereas rows at left received ample nitrogen.The soil is Magn~olia fine sandy loam.
XX lcrcas alliiiii iiiil iiitrato phois liiiicsti c and calciiiii cx naiid
occuipi'd ii tc'rnliat(' p)osition s. The lower ci eiids fiomi amiiino
linki XX ('ic assoiciatedl Xithi tiheir aiciditx as iiiclicatcd Imx thir cflcctoil soil JAL1 Siincc all ('\cept thi( (liaiiiiiiliii phiosphat' plotsi'occiN ((I calciiiii suilfate ini thoc torii of, sil)lp lii)5jsliat. a pjart
a sfin ii lficiciicx oil this saiikl sil.'Ilic ci umllilatki c effect of thic sioiirccs is ihest Inciasi-e ir(Il thc
x icitis ill thc last period. 1942-45. This periodl xwill 1e UcI sedtiiroliglaout thc dliscus1ion as a incasi ic of thic loiig-t iluc ('flectf roni thic soiii'cs. Sodiln ni iitrate aiid cottoi isccd imcal xwere su-
pcrli to all otlier -oooirccs. -1' differci'iecs iii X icid 1 ctxX cci thI iscandiit(ailii oiiiii phosphaite and~ aimmioniiuiml suilfate XXcac nitili1(rceatcr thaii had beeni thie case ill tihe first period.
fich oliox soiirccs that miainitainecd the pnil nicar thec oiinal icx ciX\ ('c calcii ntX cai ait andi sodiumii nitrate. Plots that rcccix'd
hme (rced thic nil to 4.5, wiichl is f&ar bl)ioXX op~tiiii lil fori cottoii
prodictioilApl iii ! thre't-fouirths of th(' iiti'ogci as si(1('(lr(ssil dg(1i nt
Appar' tIX leachii as iiot a sious piidiciim oil this soil.
TABLE 3. COTTON YIELD INCREASES FROM VARIOUS SOURCES OF NITROGEN ON UNLIMED PLOTS IN A COTTON-CORN ROTATION,NORFOLK FINE SANDY LOAM, WIREGRASS SUBSTATION, 1930-40
'All plots except checks received 36 lb. of N: 48 lb. of P20 from superphosphate except the diammonium phosphate plots,which received 93 lb. of PO,; and 24 lb. of K2 0 from muriate of potash.
2 Check yields (in italics) are total yields per acre. All other yields are increases over calculated checks on the basis that soilfertility changes uniformly from one check plot to the next.'Th original pH in 1929 was 5.7.
Sidedressed plots received 4 of N at planting and as sideressing.
C
mxm
z-a
-a
0z
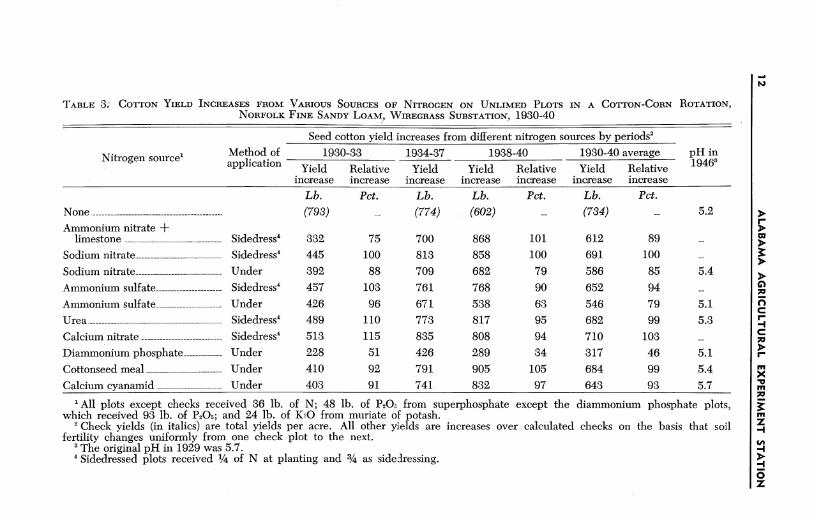
Wiregrass Substation, Norfolk Fine Sandy Loam
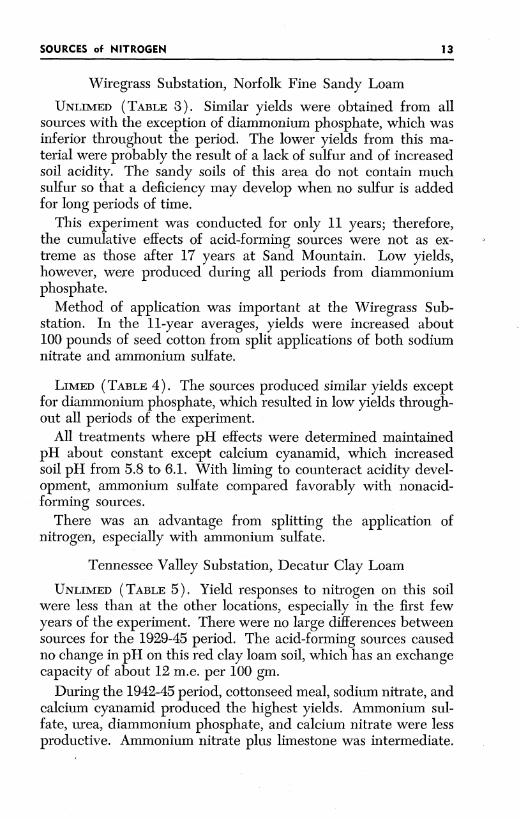
UNLIMED (TABLE 3). Similar yields were obtained from allsources with the exception of diammonium phosphate, which wasinferior throughout the period. The lower yields from this ma-terial were probably the result of a lack of sulfur and of increasedsoil acidity. The sandy soils of this area do not contain muchsulfur so that a deficiency may develop when no sulfur is addedfor long periods of time.
This experiment was conducted for only 11 years; therefore,the cumulative effects of acid-forming sources were not as ex-treme as those after 17 years at Sand Mountain. Low yields,however, were produced during all periods from diammoniumphosphate.
Method of application was important at the Wiregrass Sub-station. In the 11-year averages, yields were increased about100 pounds of seed cotton from split applications of both sodiumnitrate and ammonium sulfate.
LIMED (TABLE 4). The sources produced similar yields exceptfor diammonium phosphate, which resulted in low yields through-out all periods of the experiment.
All treatments where pH effects were determined maintainedpH about constant except calcium cyanamid, which increasedsoil pH from 5.8 to 6.1. With liming to counteract acidity devel-opment, ammonium sulfate compared favorably with nonacid-forming sources.
There was an advantage from splitting the application ofnitrogen, especially with ammonium sulfate.
Tennessee Valley Substation, Decatur Clay Loam
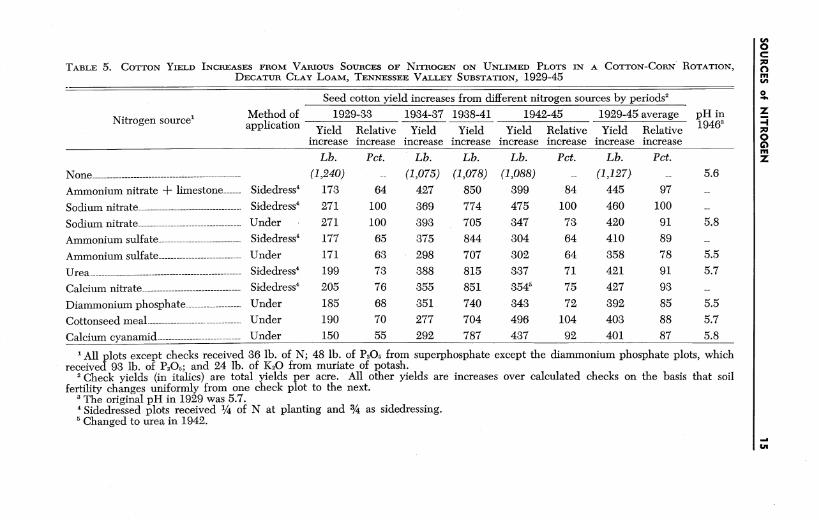
UNLIMED (TABLE 5). Yield responses to nitrogen on this soilwere less than at the other locations, especially in the first fewyears of the experiment. There were no large differences betweensources for the 1929-45 period. The acid-forming sources causedno change in pH on this red clay loam soil, which has an exchangecapacity of about 12 m.e. per 100 gin.
During the 1942-45 period, cottonseed meal, sodium nitrate, andcalcium cyanamid produced the highest yields. Ammonium sul-fate, urea, diammonium phosphate, and calcium nitrate were lessproductive. Ammonium nitrate plus limestone was intermediate.
SOURCES of NITROGEN 13
TABLE 4. COTTON YIELD INCREASES FROM VARIOUS SOURCES OF NITROGEN ON LIMED' PLOTS IN A COTTON-CORN ROTATION, NORFOLKFINE SANDY LOAM, WIREGRASS SUBSTATION, 1930-40
Nitrogen source'
N one-- - - - - - - - - -
Ammonium nitrate +limestone
Sodium nitrate
Sodium nitrate---------
Ammonium sulfate-----
Ammonium sulfate-----.
U rea -- - - - - - - - - - - - - - - -Calcium nitrate--------
Diammonium phosphate
Cottonseed meal -------Calcium cyanamid------
Method ofapplication
Seed cotton yield increases from different nitrogen sources by periods 3
1 All plots limed with 2,250 lb. of calcitic lime in 1930. Sufficient dolomitic lmestone mixed with fertilizer each year to neu-tralize acid-forming sources of nitrogen.
2 All plots except checks received 36 lb. of N; 48 lb. of P2 05 from superphosphate except the diammonium phosphate plots, whichreceived 93 lb. of P2O 5; and 24 lbs. of K2O from muriate of potash.
'Check yields (in italcs) are total yields per acre. All other yields are increases over calculated checks on the basis that soilfertility changes uniformly from one check plot to the next.'Th original pH in 1930 was 5.8.
5 Sidedressed plots received / of N at planting and / as sidedressing.
0
Cr--IC
r-
mMum
mz
0z
TABLE 5. COTTON YIELD INCREASES FROM VARIOUS SOURCES OF NITROGEN ON UNLIMED PLOTS IN A COTTON-CORN ROTATION,DECATUR CLAY LOAM, TENNESSEE VALLEY SUBSTATION, 1929-45
Seed cotton yield increases from different nitrogen sources by periods2
Method of 1929-33 1934-37 1938-41 1942-45 1929-45 average pH inNitrogen application Yield Relative Yield Yield Yield Relative Yield Relative
'All plots except checks received 86 lb. of N; 48 lb. of P20 5 from superphosphate except the diammonium phosphate plots, whichreceived 93 lb. of P2O; and 24 lb. of K 20 from muriate of potash.
2 Check yields (in italics) are total yields per acre. All other yields are increases over calculated checks on the basis that soilfertility changes uniformly from one check plot to the next.
SThe original pH in 1929 was 5.7.4 Sidedressed plots received /4 of N at planting and 3/ as sidedressing.
5 Changed to urea in 1942.
O0C
nII
O
m
z
NI
TABLE 6. COTTON YIELD INCREASES FROM VARIOUS SOURCES OF NITROGEN ON LIMED1
PLOTS IN A COTTON-CORN ROTATION, DECATUR
CLAY LOAM, TENNESSEE VALLEY SUBSTATION, 1929-45
Seed cotton yield increases from different nitrogen sources by periods3
2 Method of 1929-83 1984-37 1938-41 1942-45 1929-45 average pH inNitrogensoureapplication Yield Relative Yield Yield Yield Relative Yield Relative
1 All plots limed with 2,250 lb. calcitic lime in 1929. Sufficient dolomitic limestone mixed with fertilizer each year to neutralizeacid-forming sources of nitrogen.
2 All plots except checks received 86 lb. of N; 48 lb. of P20 5 from superphosphate except the diammonium phosphate plots, whichreceived 98 lb. of P20; and 24 lb. of K2O from muriate of potash.
3 Check yields (in italics) are total yields per acre. All other yields are increases over calculated checks on the basis that soilfertility changes uniformly from one check plot to the next.
'The original pH in 1929 was 5.8.Sidedressed plots received 1/4 of N at planting and 3/4 as sidedressing.
6 Changed to urea in 1942.
r-
v
C
yI-
I
C
rI-lmxIim
z-L
-I
z
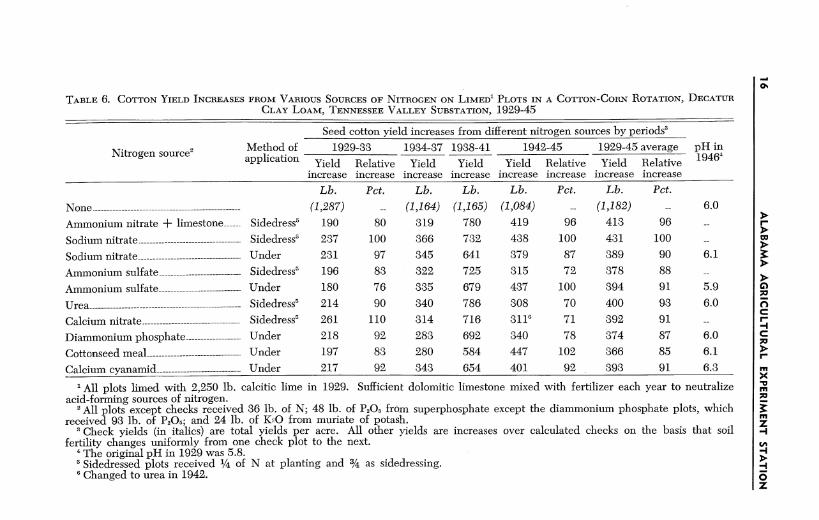
LIMED (TABLE 6). The increases in cotton yields from the nitro-gen sources ranged from 366 to 431 pounds of seed cotton. Dif-ferences in yields were much less than those obtained at mostother locations.
Comparison of yields from the limed and unlimed tiers at thislocation shows very little difference due to lime. Lime tended tomake the acid-forming nitrogen sources compare more favorablywith the others than was the case on the unlimed tiers.
RESULTS ON CORN
Sand Mountain Substation, Hartsells Fine Sandy Loam
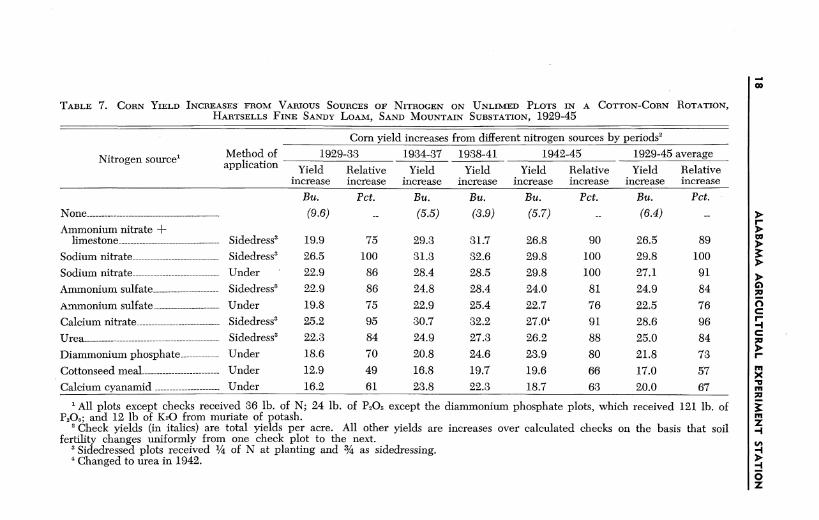
UNLIMED (TABLE 7). The list of yields obtained in all periodsshows ammonium sulfate applied under, diammonium phosphate,cottonseed meal, and calcium cyanamid at the bottom.
The response of corn to 36 pounds of nitrogen was large at thislocation. The best sources increased the yield as much as 29bushels per acre (17-year average). This yield increase is morethan three-fourths of a bushel of corn per pound of nitrogenapplied.
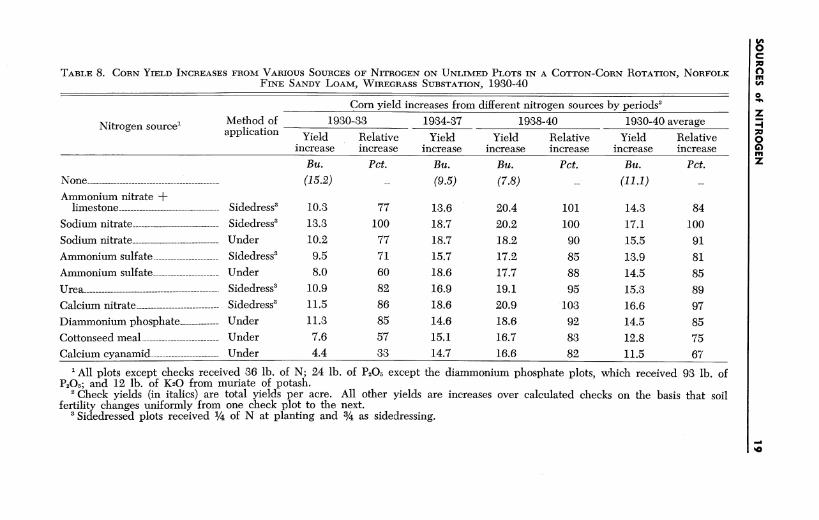
Wiregrass Substation, Norfolk Fine Sandy Loam
UNLIMED (TABLE 8). Yield differences in this experiment werenot as large as those at the Sand Mountain Substation. In gen-eral, differences between sources were small. Cottonseed mealand cyanamid produced the lowest yields, as was found at SandMountain. These two sources were not nearly as effective oncorn as they were on cotton.
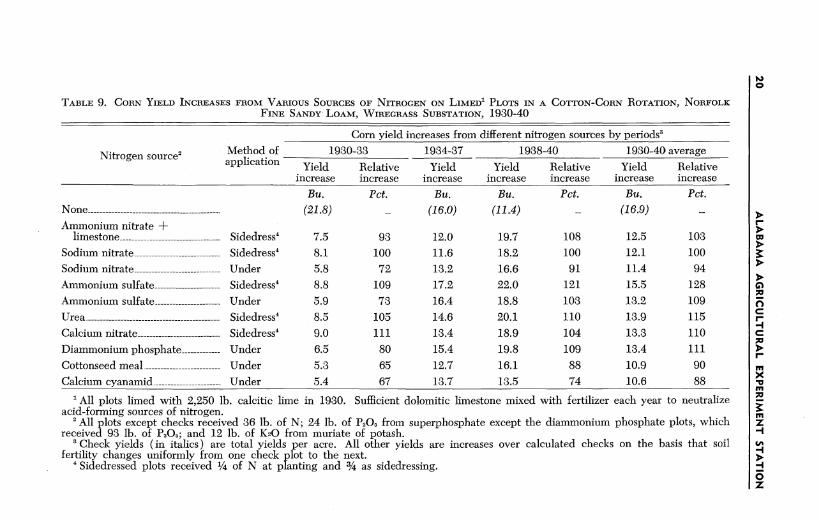
LIMED (TABLE 9). Differences between sources at this loca-tion were small, but yield levels were so low that large differencescould not be expected.
Tennessee Valley Substation, Decatur Clay Loam
UNLIMED (TABLE 10). Yields from all sources at this locationwere about equal.
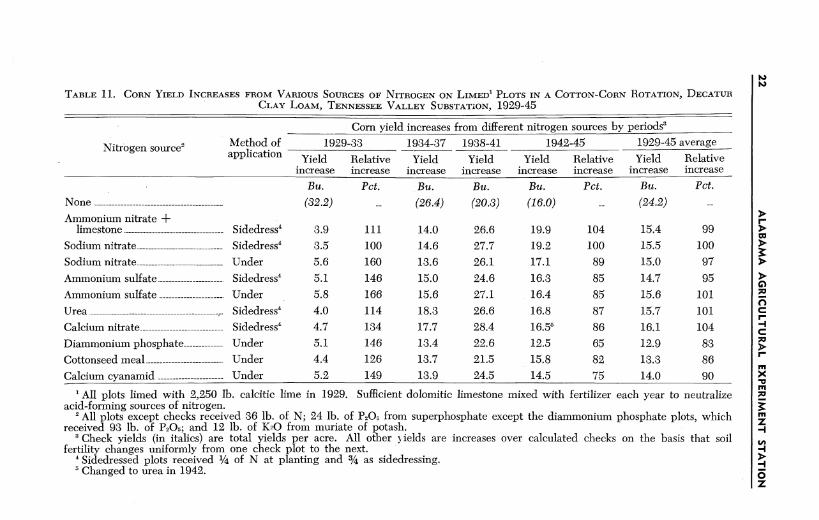
LIMED (TABLE 11). Differences in corn yield between sourcesof nitrogen were small. Lowest yields were produced by diammo-nium phosphate, cottonseed meal, and cyanamid.
SOURCES of NITROGEN 17
TABLE 7. CORN YIELD INCREASES FROM VARIOUS SOURCES OF NITROGEN ON UNLIMED PLOTS IN A COTTON-CORN ROTATION,HARTSELLS FINE SANDY LOAM, SAND MOUNTAIN SUBSTATION, 1929-45
Corn yield increases from different nitrogen sources by periods 2
Calcium cyanamid ----------- Under 16.2 61 23.8 22.3 18.7 63 20.0 67 m
' All plots except checks received 36 lb. of N; 24 lb. of P205 except the diammonium phosphate plots, which received 121 lb. ofP2O5; and 12 lb of K20 from muriate of potash. M
2 Check yields (in italics) are total yields per acre. All other yields are increases over calculated checks on the basis that soil .-.fertility changes uniformly from one check plot to the next.
4Sidedressed plots received 1/4 of N at planting and 3/ as sidedressing. -
Changed to urea in 1942.
0Z
TABLE 8. CORN YIELD INCREASES FROM VARIOUS SOURCES OF NITROGEN ON UNLIMED PLOTS IN A COTTON-CORN ROTATION, NORFOLKFINE SANDY LOAM, WIREGRASS SUBSTATION, 1930-40
Corn yield increases from different nitrogen sources by periods2
1 All plots except checks received 36 lb. of N; 24 lb. of P205 except the diammonium phosphate plots, which received 98 lb. ofP205; and 12 lb. of K2O from muriate of potash.
2 Check yields (in italics) are total yields per acre. All other yields are increases over calculated checks on the basis that soilfertility changes uniformly from one check plot to the next.
3Sidedressed plots received 1/ of N at planting and / as sidedressing.
TABLE 9. CORN YIELD INCREASES FROM VARIOUS SOURCES OF NITROGEN ON LIMED' PLOTS IN A COTTON-CORN ROTATION, NORFOLKFINE SANDY LOAM, WIREGRASS SUBSTATION, 1930-40
Corn yield increases from different nitrogen sources by periods'
1 All plots limed with 2,250 lb. calcitic lime in 1930. Sufficient dolomitic limestone mixed with fertilizer each year to neutralizeacid-forming sources of nitrogen.
2All plots except checks received 36 lb. of N; 24 lb. of P20 5 from superphosphate except the diammonium phosphate plots, whichreceived 93 lb. of P2 0 5; and 12 lb. of K2O from muriate of potash.
3'Check yields (in italics) are total yields per acre. All other yields are increases over calculated checks on the basis that soilfertility changes uniformly from one check plot to the next.
4Sidedressed plots received 1/ of N at planting and 3/ as sidedressing.
i0
IrI-
a
Fa
Suo
a
!070
-iC
7-
m
z-I
z
TABLE 10. CORN YIELD INCREASES FROM VARIOUS SOURCES OF NITROGEN ON UNLIMED PLOTS IN A COTTON-CORN ROTATION,
DECATUR CLAY LOAM, TENNESSEE VALLEY SUBSTATION, 1929-45
Corn yield increases from different nitrogen sources by periods2
' All plots except checks received 36 lb. of N; 24 lb. of P20 5 except theof P2O; and 12 lb. of K20 from muriate of potash.
2 Check yields (in italics) are total yields per acre. All other yields arefertility changes uniformly from one check plot to the next.
3Sidedressed plots received / of N at planting and / as sidedressing.4Changed to urea in 1942.
diammonium phosphate plots, which received 93 lb.
increases over calculated checks on the basis that soil
0C
mIIn
0
Z'N0
:Tm
/___________________________-_ VIILL~I I V IVV IV l YV..
TABLE 11. CORN YIELD INCREASES FROM VARIOUS SOURCES OF NITROGEN ON LIMED' PLOTS IN A COTTON-CORN ROTATION, DECATURCLAY LOAM, TENNESSEE VALLEY SUBSTATION, 1929-45
1All plots limed with 2,250 lb. calcitic lime in 1929. Sufficient dolomitic limestone mixed with fertilizer each year to neutralizeacid-forming sources of nitrogen.
All plots except checks received 36 lb. of N; 24 lb. of P2 0 5 from superphosphate except the diammonium phosphate plots, which
received 93 lb. of P2 05 ; and 12 lb. of K2O from muriate of potash.'Check yields (in italics) are total yields per acre. All other yields are increases over calculated checks on the basis that soil
fertility changes uniformly from one check plot to the next.4Sidedressed plots received / of N at planting and / as sidedressing.5Changed to urea in 1942.
a-
r
a
C
I -
-I
m
-v
'I
z
EXPERIMENTS WITH AMMONIUM SULFATE AND
SODIUM NITRATE, 1929-45
Experiments with ammonium sulfate and sodium nitrate werebegun in 1929 at the Sand Mountain and Tennessee Valley sub-stations, and in 1930 at the Wiregrass Substation and the Mon-roeville Experiment Field. They were conducted on cotton andcorn in a 2-year rotation. Both crops were grown each year onalternate tiers. Treated plots received 36 pounds of nitrogen peracre for each crop. All plots received 48 pounds of P20 5 and 24pounds of K20 per acre for cotton and one-half these amountsfor corn.
RESULTS ON COTTON
Wiregrass Substation, Norfolk Fine Sandy Loam
Treatment differences, as shown in Table 12, were small exceptfor the unneutralized ammonium sulfate, which produced a rela-tive yield increase of only 58 per cent in the last period. After10 years of application, unneutralized ammonium sulfate wasproducing only 64 per cent as much cotton as sodium nitrate.
Basic slag with sodium nitrate increased the pH to 6.6 andslightly decreased the effectiveness of the sodium nitrate. Un-neutralized ammonium sulfate decreased the pH from 6.0 to 5.2in 16 years.
Monroeville Experiment Field, Magnolia Fine Sandy Loam
Results from all treatments on this soil were similar to those onthe Norfolk fine sandy loam, Table 12. The effectiveness of un-neutralized ammonium sulfate decreased with time. While therelative yield increase produced by ammonium sulfate in thefirst period, 1930-33, was 89 per cent of that of sodium nitrate,it decreased to 80 per cent in 1984-37 and to 55 per cent in1942-45.
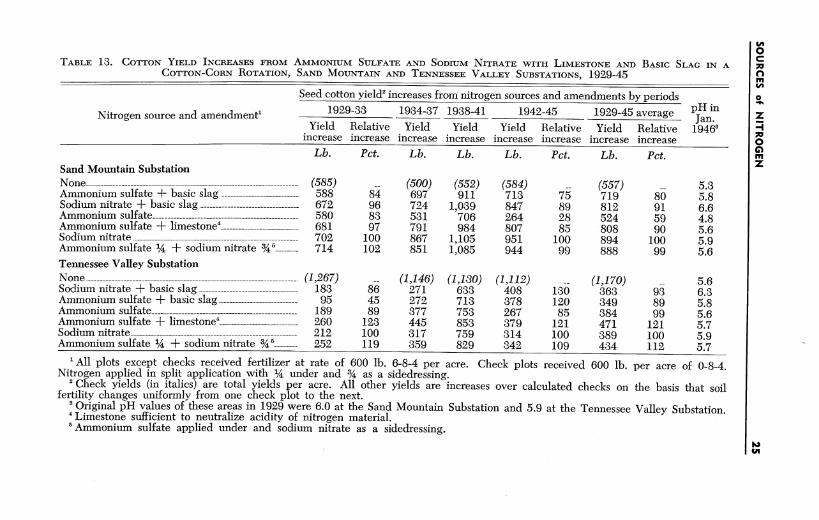
Sand Mountain Substation, Hartsells Fine Sandy Loam
The highest yields at this location were produced by sodiumnitrate and by the combination of 1/ ammonium sulfate and 3/4sodium nitrate, Table 13. Sodium nitrate maintained soil pHabout constant over the 16-year period. Basic slag, when used
SOURCES of NITROGEN 23
TABLE 12. COTTON YIELD INCREASES FROM AMMONIUM SULFATE AND SODIUM NITRATE WITH LIMESTONE AND BASIC SLAG IN ACOTTON-CORN ROTATION, WIREGRASS SUBSTATION AND MONROEVILLE EXPERIMENT FIELD, 1930-45
Seed cotton yield 2 increases from nitrogen sources and amendments by periods
Ntg suena e1 1930-33 1934-37 1938-41 1942-45 1930-45 average JanNitrogen source and amendment Jn
1All plots except checks received fertilizer at rate of 600 lb. 6-8-4 per acre. Check plots received 600 lb. per acre of 0-8-4.Nitrogen applied in split application with 1/ under and 34 as a sidedressing.
2 Check yields (in italics) are total yields per acre. All other yields are increases over calculated checks on the basis that soilfertility changes uniformly from one check plot to the next.'The original pH in 1930 was 6.0 at both locations.'Limestone sufficient to neutralize acidity of nitrogen material.'Ammonium sulfate applied under and sodium nitrate as a sicledressing.
Yr
0
Fr
cc
rr
mz
m
z
TABLE 13. COTTON YIELD INCREASES FROM AMMONIUM SULFATE AND SODIUM NITRATE WITH LIMESTONE AND BASIC SLAG IN ACOTTON-CORN ROTATION, SAND MOUNTAIN AND TENNESSEE VALLEY SUBSTATIONS, 1929-45
Seed cotton yield' increases from nitrogen sources and amendments by periods1929-33 1934-37 1938-41 1942-45 1929-45 average
1 All plots except checks received fertilizer at rate of 600 lb. 6-8-4 per acre. Cbeck plots received 600 lb. per acre of 0-8-4.Nitrogen applied in split application with 1/ under and 34 as a sidedressing.
'Check yields (in italics) are total yields per acre. All other yields are increases over calculated checks on the basis that soilfertility changes uniformly from one check plot to the next.'Original pH values of these areas in 1929 were 6.0 at the Sand Mountain Substation and 5.9 at the Tennessee Valley Substation.'Limestone sufficient to neutralize acidity of nitrogen material.'Ammonium sulfate applied under and sodium nitrate as a sidedressing.
0C70mN
z
0mz
~N
ALABAMA AGRICULTURAL EXPERIMENT STATION
with sodium nitrate, increased soil pH to 6.6 and depressed theyield of cotton.
Ammonium sulfate without lime was 83 per cent as effectiveas sodium nitrate in the first period, 1929-33, but only 61 percent as effective in the second period, 1984-37. In the last periodthe relative yield increase was only 28 per cent. The soil pHdecreased from 6.0 to 4.8 in 16 years where ammonium sulfatewas added without lime. Where limestone was added with am-monium sulfate, yields were similar to those obtained with sodiumnitrate. Since some of the calcium requirements of the cottoncould be obtained from superphosphate, the low yields withunneutralized ammonium sulfate are probably largely a result ofthe soil acidity produced.
Tennessee Valley Substation, Decatur Clay Loam
Yield increases from nitrogen at this location were low for thefirst few years of the experiment because of the high initial stateof fertility of the soil. Differences between sources were notgreat under these conditions. The 17-year averages in Table 13show that ammonium sulfate neutralized with limestone was themost productive treatment. Ammonium sulfate when not neu-tralized decreased soil pH from 5.9 to 5.6. This did not drasticallyreduce the yield on this heavy soil, even in the 1942-45 period.Basic slag when used with sodium nitrate increased pH to 6.3,but it had little effect on yields as compared to sodium nitratealone.
RESULTS ON CORN
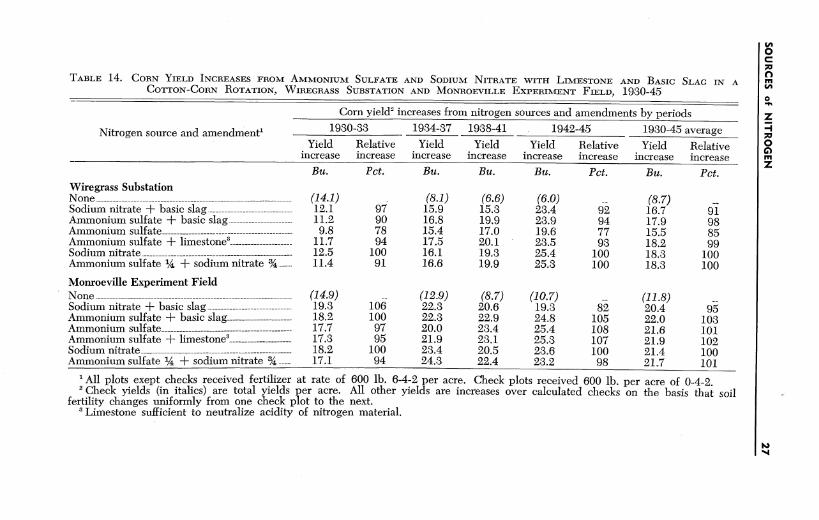
Wiregrass Substation, Norfolk Fine Sandy Loam
Yield differences between treatments were small. Unneutral-ized ammonium sulfate produced slightly less than the othersources in the last years of the experiment, Table 14.
Monroeville Experiment Field, Magnolia Fine Sandy Loam
Data in Table 14 show that all treatments were equally satis-factory on corn except that yields from sodium nitrate plus basicslag plots were lower than the others in the last few years ofthis experiment. Evidence obtained in later years indicated thatthis was caused by zinc deficiency resulting from increased pHon these plots.
26
TABLE 14. CORN YIELD INCREASES FROM AMMONIUM SULFATE AND SODIUM NITRATE WITH LIMESTONE AND BASIC SLAG IN ACOTTON-CORN ROTATION, WIREGRASS SUBSTATION AND MONROEVILLE EXPERIMENT FIELD, 1930-45
Nitrogen source and amendment'
Corn yield2 increases from nitrogen sources and amendments by periods1930-33 1934-37 1938-41 1942-45 1930-45 average
1All plots exept checks received fertilizer at rate of 600 lb. 6-4-2 per acre. Check plots received 600 lb. per acre of 0-4-2.2 Check yields (in italics) are total yields per acre. All other yields are increases over calculated checks on the basis that soil
fertility changes uniformly from one check plot to the next.'Limestone sufficient to neutralize acidity of nitrogen material.
0C
0ZI
E0
ze
0G)Z
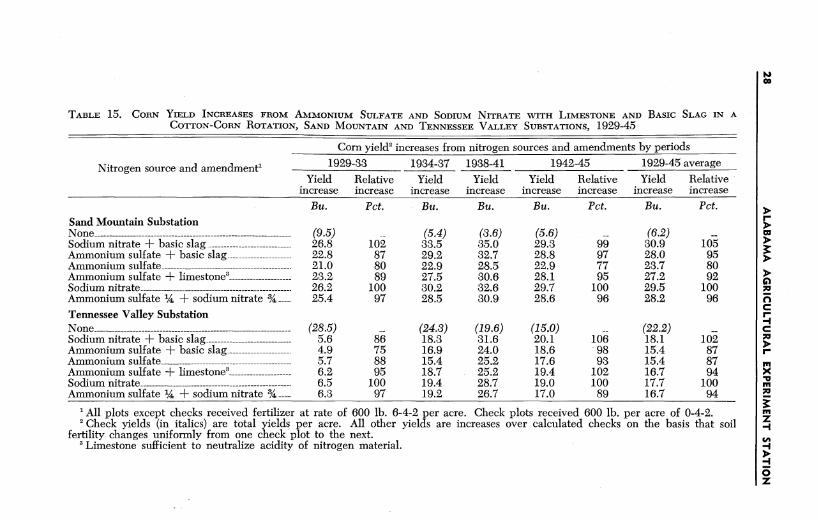
TABLE 15. CORN YIELD INCREASES FROM AMMONIUM SULFATE AND SODIUM NITRATE WITH LIMESTONE AND BASIC SLAG IN ACOTTON-CORN ROTATION, SAND MOUNTAIN AND TENNESSEE VALLEY SUBSTATIONS, 1929-45
1All plots except checks received fertilizer at rate of 600 lb. 6-4-2 per acre. Check plots received 600 lb. per acre of 0-4-2.2 Check yields (in italics) are total yields per acre. All other yields are increases over calculated checks on the basis that soil
fertility changes uniformly from one check plot to the next.3 Limestone sufficient to neutralize acidity of nitrogen material.
aa
C
-
z
SOURCES of NITROGEN
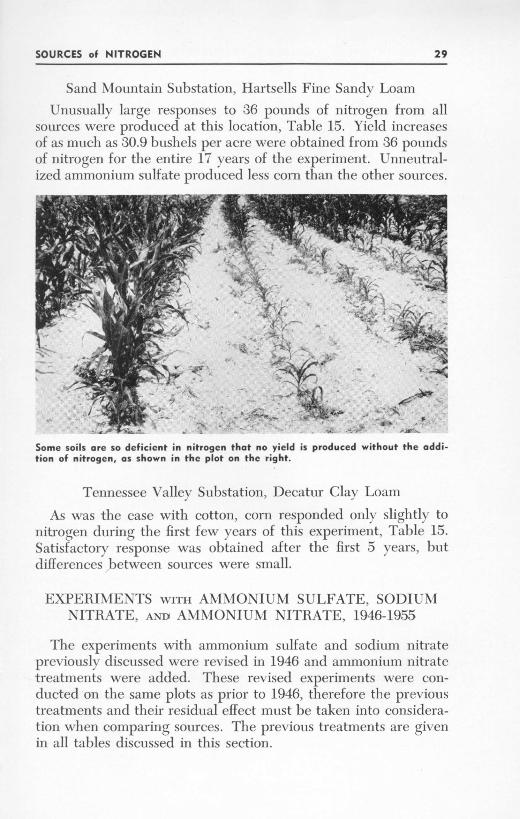
Sand \Ioutttain Suibstation, Hlartsells Fine Sauidx Lotant
1 tiisttai, lamge r-esp~onses to 36 pounds of ntitrogen fromt allSot rees 'ere produted~ at th~is location, T ab le 15. 'ield increasesof as nnieh as :30.9 butsh~els per ac-re wxer e obtainted tront ;36 pottodsofI nitrogten f or- thet entire 1 (cans of the- (\p(rittlett. V'ittetttral-I ii( I l ii t iii ii '.1iif If r dn it [11 ( 1( -' i m- 144 1 ti ll ( il \(l l
v+'e~~~~,~ _.r-<1+.<t! . .
.y2
Some soils arc so deficient in nitrogen that no yield is produced without the addi-tion of nitrogen, os shown in the plot on the right.
Tet n essee Vallex\ Si ibstatiott. D~ecatttr ( laI\ Lo)at
As was the ease wxith cottoll, corn respotn(edl ottly sli gihth~ toni Ut (It it in the first fcwX w ars of thlis ('\periboelt t bilt 1.5.Satistactot \ re spotnse vv as obltaitned after thet fiirst 5 (curs, )ut
diffetreince's I et xx '(' si Itr-es weret~ smaIll.
XEAPE I \l PATS wor AMlM\I\ONIUMTN SU FI.ATE, SOIUM 'NITIIATI'> AND AMM\ONILUM\ NITRIATE. 1946-1955
The expernitetts wxitlh attttoutittt sttlfate atid sodlitttl ntitrateprex iottsl* disciissed wxere rex isedi ini 1946 atid atmmonIittmt ntitrate
treatttetnts xxere added. Tcsc r('Xisedi ('\peritietts XX tie cont -
(Ituttedl onl theO satmte plots as prior to 19-16, th erefore the pc itU oltstreatmnie ts atndt their r-esidutal ('fleet most 1bet taken it to eoiisidera-tion whet Icot mparing soutrces. T'e prex i( nst treatt et its are gix eiinl all tab les (liset sseti in this section.I
In the revised experiment, rates of P20 5 and K20 were in-creased to 60 pounds each for both cotton and corn. Rates ofnitrogen were increased to 48 pounds per acre on all plots wheresources were compared and former check plots received 36pounds per acre from neutralized ammonium nitrate. Since theexperiments contained no plots that received less than 36 poundsof nitrogen, it is impossible to calculate the total yield increasefrom nitrogen in the 1946-55 period. The relative yield percent-ages presented in Tables 16 through 19, therefore, are based ontotal yield rather than on yield increase from nitrogen as was thecase in the previous tables.
RESULTS ON COTTON
Wiregrass Substation, Norfolk Fine Sandy Loam
Unneutralized ammonium sulfate was inferior to all other treat-ments, Table 16. When used with basic slag or limestone it pro-duced satisfactorily. Ammonium nitrate produced as much assodium nitrate during 1946-50, but during 1951-55 when unneu-tralized only 80 per cent as much as sodium nitrate. When usedon land that was properly limed, ammonium nitrate producedsatisfactorily.
Soil pH values in 1955 ranged from 5.1 on the ammonium sul-fate plots to 6.5 on the sodium nitrate plus basic slag plots.
Monroeville Experiment Field, Magnolia Fine Sandy Loam
As shown in Table 16, there were no important differences inyields from the nitrogen sources when ammonium sulfate andammonium nitrate were neutralized in 1946-55 period. Ammo-nium sulfate without limestone or basic slag produced only 55per cent as much as sodium nitrate. Unneutralized ammoniumnitrate resulted in a relative yield of 92 per cent.
Sand Mountain Substation, Hartsells Fine Sandy Loam
Unneutralized ammonium sulfate was much inferior to all othertreatments. The 10-year average was only 196 pounds of seedcotton, Table 17. The pH on these plots had decreased to 4.4 by1955. This was a cumulative effect of ammonium sulfate addi-tions since 1929. A stand of cotton was difficult to maintain onthese plots, and when cotton survived it was unthrifty. Crab-grass was always difficult to control on these plots, but it is not
30 ALABAMA AGRICULTURAL EXPERIMENT STATION
TABLE 16. COTTON YIELDS FROM AMMONIUM NITRATE, AMMONIUM SULFATE, AND SODIUM NITRATE WITH LIMESTONE OR BASICSLAG IN A 2-YEAR ROTATION OF COTTON AND CORN, WIREGRASS SUBSTATION AND MONROEVILLE EXPERIMENT FIELD, 1946-55
Seed cotton yields and soil p1, by location and period
Nitrogen and Previous nitrogen Wiregrass Substation Monroeville Experiment Fieldamendment treatment' and amendment 1946-55 1946-55sources' 1980-45 1946-50 1951-55 pH in 1946-50 1951 -55 p1 1 in
' All plots received 48 lb. of nitrogen, 60 lb. P20, from superphosphate or basic slag as noted, and 60 lb. K20 from muriate ofpotash.
2Plots received fertilizer at rate of 600 lb. 6-4-2 to corn and 600 lb. 6-8-4 to cotton in 1930-45 period.'Limestone sufficient to neutralize acidity of the nitrogen material.
0e
900scn
z
00
z
A)
TABLE 17. COTTON YIELDS FROM AMMONIUM NITRATE, AMMONIUM SULFATE, AND SODIUM NITRATE WITH LIMESTONE OR BASICSLAG IN A 2-YEAR ROTATION OF COTTON AND CORN, SAND MOUNTAIN AND TENNESSEE VALLEY SUBSTATIONS, 1946-55
Seed cotton yields and soil pH, by location and period
Nitrogen and Previous nitrogen Sand Mountain Substation Tennessee Valley Substationamendment treatment' and amendment 1946-55 1946-55
1 All plots received 48 lb. of nitrogen, 60 lb. P20 5 from superphosphate or basic slag as noted, and 60 lb. K2 0 from muriate ofpotash.
2 Plots received fertilizer at rate of 600 lb. 6-4-2 to corn and 600 lb. 6-8-4 to cotton in 1929-45 period.'Limestone sufficient to neutralize acidity of the ammonium sulfate.
wjIoJNNN
Sta
5.I
5.I4.o
a
a
C
C
z
known whether this was caused by lack of competition from cot-ton plants or by an affinity of crabgrass to low pH. Yields ofcotton from these plots represent the most severe loss due toacidity that has ever been obtained by the Agricultural Experi-ment Station.
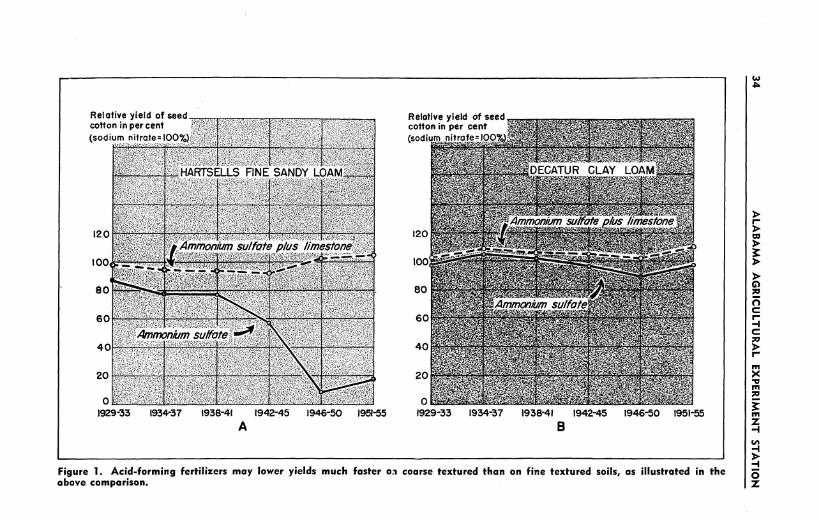
Figure 1-A shows the relative yield increase from ammoniumsulfate with and without neutralization with lime and from sodiumnitrate from the beginning of the experiment in 1929 to 1955. Inthe 1951-55 period unneutralized ammonium sulfate producedonly 17 per cent as much as did sodium nitrate. With the additionof enough lime for neutralization, however, the ammonium sulfategave a relative yield of 103 per cent.
All other treatments produced about 1,500 pounds of seed cot-ton per acre. Sodium nitrate and ammonium nitrate were satis-factory sources both with and without lime; however, the plotsfertilized with ammonium nitrate had received a neutral fertilizerprior to 1946. When the acidity of ammonium sulfate was neu-tralized with limestone, the yield was 1,591 pounds, an increase of1,395 pounds over the unneutralized ammonium sulfate plots.
The pH values of the plots in 1955 ranged from 4.4 to 6.6. Con-tinued use of ammonium sulfate after 1946 further decreased thepH from 4.8 to 4.4, while ammonium nitrate decreased the pHfrom 5.8 to 5.1 in the same period when no lime or basic slag wasapplied. Although ammonium nitrate without lime had not yetgreatly affected the yield, it is expected that yields from thistreatment would soon decline because of the low pH produced.
Tennessee Valley Substation, Decatur Clay Loam
Differences in yield between sources were relatively small, asshown in Table 17. Average yields ranged from 1,385 poundsof seed cotton from unneutralized ammonium sulfate to 1,595pounds from ammonium nitrate plus lime. Soil pH values in1955 ranged from 5.0 for unneutralized ammonium sulfate to 6.7from sodium nitrate plus basic slag.
Figure 1-B shows that on this fine textured soil yields from un-neutralized ammonium sulfate were as satisfactory as nonacid-forming sources, even after 27 years of application. A comparisonof 1-A and 1-B clearly illustrates that acid-forming fertilizers mayquickly lower yields on coarse textured soils, whereas yields maybe satisfactory for much longer periods on fine textured soils.
SOURCES of NITROGEN 33
Relative yield of seed Relative yield of seedcotton in per cent cotton in per cent -
(sodium nitrate 004) (sodium nitrate= 009')HARTSELLS r FINE SANDY LOAM 4 r ^._*l**!7 ,r 7 ,; J.2 . r:": +yL +s' ! J ""I . rrestone120 . Ammon.urr, sulfate ilmestane"__100 100 < dJ" , f + 1.80f}'' ;.h f?'
," ; f r
1.(J + mmo-n i m Su/f !te60. , - 60 mAmanb/urn sulfate
s P" t'M v r "f .f,,.. "i t/.PO;s~r2'.+dw .%, + b7,r i ,S..' js; : ,::i X
20 nr20 Al ( 95
199-3 19437 1384! 14-4S 94-01 91-5 1993 1347 981 4245 1946-SO . I 1'!' A19-5a vi
r Amonium; sufate plus d~~9!
*--I
100
f r 's
f!°1'./FigureA1.,Aiing fe J J.r l ii r may lower yoillustrateabove comparison.
,r i ri , 7't e rrtr t~ r t I t i , w fr r a. y,, y ,q
so 80 y J , «9yx p
' h. I Is2 .. r. n r 1 ee y ;t tt4 J~ 1 ri4. I TJ~r Ik,1 r WI :.7i "ti..r S* . .',".7.L-N" r " yfC }+ /
r ) !r + 1 ti t 'i t. r J ! +}V 4C.;: A m07im suf te"'t J i 1 7ti Ij r," 1 ^rPZV: :, n "7 . 'rJ n"I i S, i 4+Ln.M
? 1 r i 4:i::": :
.... ,J.. .,. , , i 1t t.rv Va r r~"rtt:it ~r7 4iY'? l1. y ,' ~vw''r 'h'' '?Am onu
N Ly $ !7 , ~ Ci I. ,"I an
I , rJF y*i1 J ' + Y >/i " 1,} y . r . , r^ d1 f>. .?
/
RESULTS ON CORN
Wiregrass Substation, Norfolk Fine Sandy Loam
Average yields of corn at this location were low because ofseveral drouthy years, Table 18. Yield differences between treat-ments were small and not considered to represent importantdifferences between the sources tested. The maximum averageyield was 27.4 bushels in the 1946-55 period. Yields that arelimited to this level by weather or other uncontrollable factors donot represent reliable measures of differences between treatments.
Monroeville Experiment Field, Magnolia Fine Sandy Loam
Average yields in the 1946-55 period ranged from 41.7 bushelsfrom ammonium sulfate plus basic slag to 48.2 bushels fromammonium nitrate plus lime, Table 18. Yields from sodium nitratewere intermediate. Within recent years, zinc deficiency symp-toms occurred in corn on plots that received sodium nitrate plusbasic slag. The pH of these plots in 1955 was 6.9. Zinc sulfatewas added to corn plots in this experiment beginning in 1956.No zinc deficiency symptoms were noted during that season. Thisincident emphasizes the likelihood of zinc deficiency occuring incorn on sandy soil in which the pH gets too high.
Sand Mountain Substation, Hartsells Fine Sandy Loam
Highest yields of corn were obtained from sodium nitrate inthe experiment at Sand Mountain. The three treatments thatincluded this source produced the three highest yield averages,Table 19. Ammonium sulfate was not as effective as sodium ni-trate, even when neutralized with dolomite or basic slag. Thelowest yield was from unneutralized ammonium sulfate, whichproduced only 50 per cent as much corn as did sodium nitrate.The acidity produced by ammonium sulfate did not reduce cornyields as drastically as it did cotton yields. The final pH of theseplots was 4.4 and corn has been unthrifty on these plots in recentyears. Soil pH values of these plots are presented with the cottonyields in Table 17.
Tennessee Valley Substation, Decatur Clay Loam
All sources of nitrogen were equally satisfactory for corn atthe Tennessee Valley Substation, Table 19. The decreases in soilpH caused by the acid-forming nitrogen sources were not greatenough to affect corn yields on this heavy red Decatur clay loam.
SOURCES of NITROGEN 35
TABLE 18. CORN YIELDS FROM AMMONIUM NITRATE, AMMONIUM SULFATE, AND SODIUM NITRATE WITH LIMESTONE OR BASIC SLAGIN A 2-YEAR ROTATION OF COTTON AND CORN, WIREGRASS SUBSTATION AND MONROEVILLE EXPERIMENT FIELD, 1946-55
'All plots received 48 lb. of nitrogen, 60 lb. PRO5 from superphosphate or basic slag as noted, and 60 lb. K2 0 from muriate ofpotash.
2 Plots received fertilizer at rate of 600 lb. 6-4-2 to corn and 600 lb. 6-8-4 to cotton in 1930-45 period.'Limestone sufficient to neutralize acidity of the nitrogen material.
w04
jI-telr
I-
0
1c
1F
mx
m
z-IIn
z
0C
TABLE 19. CORN YIELDS FROM AMMONIUM NITRATE, AMMONIUM SULFATE, AND SODIUM NITRATE WITH LIMESTONE OR BASIC SLAG XIN A 2-YEAR ROTATION OF COTTON AND CORN, SAND MOUNTAIN AND TENNESSEE VALLEY SUBSTATIONS, 1946-55
Corn yields by location and period
Previous nitrogen Sand Mountain Substation Tennessee Valley Substation Z
1 All plots received 48 lb. of nitrogen, 60 lb. P2O 5 from superphosphate or basic slag as noted, and 60 lb. K20 from muriate ofpotash.
2 Plots received fertilizer at rate of 600 lb. 6-4-2 to corn and 600 lb. 6-8-4 to cotton in 1929-45 period.2 Limestone sufficient to neutralize acidity of the nitrogen material.
N
ALABAMA AGRICULTURAL EXPERIMENT STATION
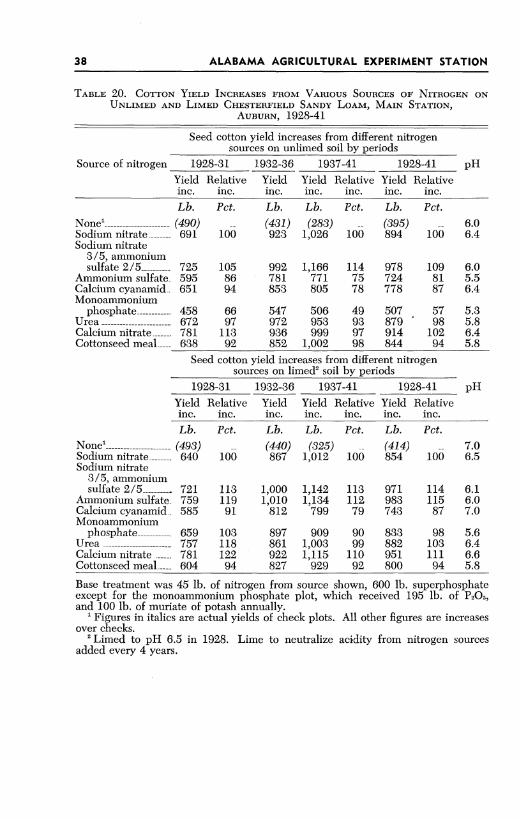
TABLE 20. COTTON YIELD INCREASES FROM VARIOUS SOURCES OF NITROGEN ONUNLIMED AND LIMED CHESTERFIELD SANDY LOAM, MAIN STATION,
AUBURN, 1928-41
Seed cotton yield increases from different nitrogensources on unlimed soil by periods
Source of nitrogen 1928-31 1932-36 1937-41 1928-41 pH
Yield Relative Yield Yield Relative Yield Relativeinc. inc. inc. inc. inc. inc. inc.
Base treatment was 45 lb. of nitrogen from source shown, 600 lb. superphosphateexcept for the monoammonium phosphate plot, which received 195 lb. of P2Os,and 100 lb. of muriate of potash annually.
1 Figures in italics are actual yields of check plots. All other figures are increasesover checks.
2 Limed to pH 6.5 in 1928. Lime to neutralize acidity from nitrogen sourcesadded every 4 years.
,.,,,,, ~II I I I I Irl l I Ir ~
38
OTHER EXPERIMENTS WITH SOURCES orNITROGEN ON COTTON
SOURCES OF NITROGEN ON UNLIMED AND LIMED CHESTERFIELD
SANDY LOAM AT AUBURN, 1928-1941
The experiment consisted of 16 plots, each of which was di-vided into a limed and unlimed half. Treatments were un-replicated except for the sodium nitrate treatment, which wasreplicated six times. Yield increases over the no nitrogen treat-ment are presented by periods, Table 20.
On unlimed plots, monoammonium phosphate was the lowestyielding treatment. The relative increase from this source wasonly 57 per cent of the average increase from the sodium nitrateplots. The pH of this plot in 1942 was 5.3, the lowest producedby any source. Ammonium sulfate produced a relative yield of81 per cent and had a pH of 5.5 in 1942. Calcium cyanamid wasslightly inferior to sodium nitrate, calcium nitrate, and urea. Thelatter three produced about the same yields.
Yields on the limed plots were about the same as on the un-limed, except on the monoammonium phosphate and the ammo-nium sulfate plots. Lime greatly improved the efficiency of thesetwo sources.
An experiment was conducted on Chesterfield sandy loam atAuburn to determine the cause for the low yields obtained withammonium phosphates. Diammonium phosphate was found tobe a satisfactory source of nitrogen and phosphorus when limeand sulfur were applied. With 36 pounds of nitrogen and 48pounds of P20 5 from urea and diammonium phosphate, the 5-yearaverage seed cotton yield was 501 pounds. The addition of limeincreased the yield to 755 pounds and lime plus a source of sulfur(gypsum) increased the yield to 947 pounds. This comparesfavorably with yields of 929 pounds from superphosphate andsodium nitrate.
SODIUM NITRATE AND AMMONIUM SULFATE WITH AND
WITHOUT LIME ON, CHESTERFIELD SANDY LOAM,AUBURN, 1925-55
In 1925 an experiment was started on the Main Station Agron-omy Farm at Auburn to compare sodium nitrate and ammoniumsulfate at two rates of nitrogen with and without lime. All treat-
SOURCES of NITROGEN 39
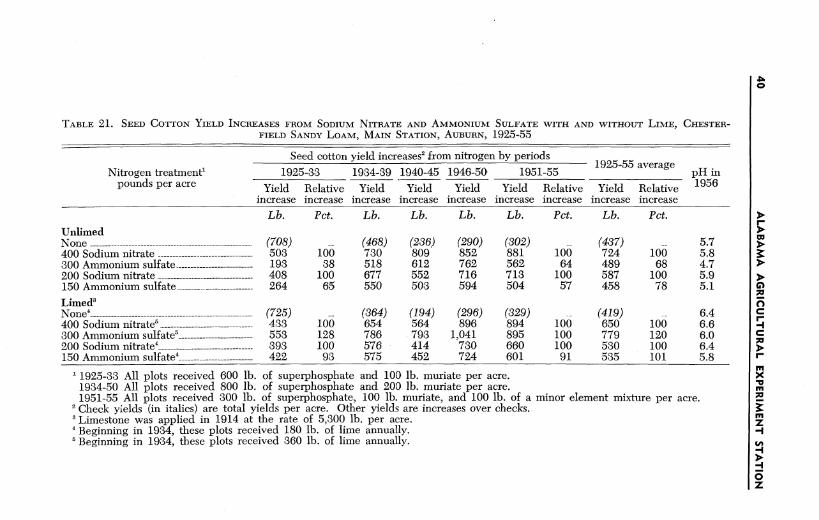
TABLE 21. SEED COTTON YIELD INCREASES FROM SODIUM NITRATE AND AMMONIUM SULFATE WITH AND WITHOUT LIME, CHESTER-FIELD SANDY LOAM, MAIN STATION, AUBURN, 1925-55
Seed cotton yield increases2 from nitrogen by periods
4 1925-33 All plots received 600 lb. of superphosphate and 100 lb. muriate per acre.1934-50 All plots received 800 lb. of superphosphate and 200 lb. muriate per acre.1951-55 All plots received 300 lb. of superphosphate, 100 lb. muriate, and 100 lb. of a minor element mixture per acre.2 Check yields (in italics) are total yields per acre. Other yields are increases over checks.'Limestone was applied in 1914 at the rate of 5,300 lb. per acre.'Beginning in 1934, these plots received 180 lb. of lime annually.'Beginning in 1934, these plots received 360 lb. of lime annually.
O
pH in1956
ncc
LL
8a
0
z
7C5I
ments were replicated twice. A summary of 31 years' results fromthis experiment is presented in Table 21.
On the unlimed plots, sodium nitrate was superior to ammo-nium sulfate at both nitrogen rates throughout the 31 years. Therelative increases for the entire period from ammonium sulfatewere only 78 and 68 per cent as much as from sodium nitrate atthe acre rate of 32 and 64 pounds of nitrogen, respectively. The300-pound rate of ammonium sulfate reduced soil pH to 4.7 in31 years. The final pH on the 150-pound rate was 5.1, while thesodium nitrate and no nitrogen plots had pH values of 5.7 to 5.9.The original soil pH of this area is not known.
When ammonium sulfate was added to limed soils, yields wereabout the same as from similar rates of nitrogen from sodium ni-trate on unlimed soil.
On the limed plots, the two sources produced about the sameyields at the low nitrogen rate throughout the 31 years. However,at the high nitrogen rate, ammonium sulfate was superior to so-dium nitrate in each period through 1950. In 1951 the superphos-phate and muriate applications were reduced and a minor elementmixture was added to all plots because it was feared that the highpH on the sodium nitrate plus lime plots was causing a minor ele-ment deficiency. Yields from 1951 through 1955 averaged thesame for these two treatments, indicating that minor elementsmay have been in deficient supply. The final soil pH on the limedplots ranged from 5.8 on the 150-pound ammonium sulfate treat-ment to 6.6 on the 400-pound sodium nitrate treatment.
Comparison of the limed and unlimed treatments shows theeffect of lime on cotton yields. The average response to limewhen used with 150 and 300 pounds of ammonium sulfate were77 and 390 pounds of seed cotton, respectively. Small and prob-ably insignificant yield decreases from lime were produced on the200- and 400-pound sodium nitrate treatments.
RATIOS OF ORGANIC TO INORGANIC NITROGEN IN FERTILIZERS
FOR COTTON ON DECATUR CLAY LOAM, ALEXANDRIA
EXPERIMENT FIELD, 1929-43
An experiment to determine the relative efficiencies of organicand inorganic nitrogen for cotton was conducted on the Alexan-dria Experiment Field for 15 years. Cottonseed meal and sodiumnitrate were used as sources of nitrogen. Each treatment was
SOURCES of NITROGEN 41
TABLE 22. SEED COTTON YIELD INCREASES FROM VARIOUS PERCENTAGES OF ORGANIC AND INORGANIC NITROGEN, DECATUR CLAYLOAM SOIL, ALEXANDRIA EXPERIMENT FIELD, 1929-43
Percentage nitrogen1 from Seed cotton yield increases by periods2
All nitrogen was applied at the rate of 36 lb. per acre before planting. All plots received 60 lb. of P2 0 5 and 24 lb. K20 annually.2 Check yields (in italics) are total yields per acre. All other yields are increases over calculated checks for each plot based on
uniform soil variation between four evenly spaced check treatments.
rI-
CI--IC
i-
mx
mz-I
-I
-I
z
replicated twice except the no nitrogen treatment, which wasreplicated eight times.
Results showed that yields were related to the percentage ofinorganic nitrogen used in the fertilizer, Table 22. Treatmentsreceiving 90 and 100 per cent of their nitrogen from sodiumnitrate produced the highest yields. Plots receiving 50 per cent ormore of their nitrogen from cottonseed meal were decidedly in-ferior. Since inorganic nitrogen is normally cheaper than organicnitrogen, fertilizers should be formulated with inorganic nitro-gen unless some organic material is needed for conditioning thefertilizer.
GENERAL DISCUSSION
Efficient production of cotton and corn in Alabama is impossiblewithout a source of nitrogen in addition to that occurring in soilorganic matter.
Although the value of the nitrogen sources in the experimentsreported here varied with soil conditions and management prac-tices, all increased yields over those obtained without addednitrogen.
Several sources of nitrogen were satisfactory for cotton andcorn. The effectiveness of nitrogen sources on crop growth wasinfluenced by soil properties other than the supply of availablenitrogen. Yields became progressively lower when acid-formingsources of nitrogen were applied without neutralization. How-ever, when adequately neutralized with lime, yields were satisfac-tory unless some other factor was limiting. The cost of sufficientlime for neutralization is small. With cropping, soils tend to be-come more acid and the use of neutral fertilizers will not preventa gradual reduction in soil pH. The soil should be tested everyfew years and lime applied according to recommendation. Such aliming program will supply the requirements for efficient cropproduction and prevent development of excessive acidity fromacid-forming fertilizers with no danger of overliming.
The risk of using acid-forming fertilizers without adequate lim-ing is that they gradually reduce yields as the soil becomes moreacid. Thus the grower may not be aware of the loss of yield untilthe yield level has become seriously reduced. Acid-forming ferti-lizers may cause low yields in a few years on coarse textured soils,such as sands and sandy loams. On the other hand, it may take
SOURCES of NITROGEN 43
many years before yields are affected on fine textured soils, suchas clays and clay loams. However, reduced yields will eventuallyoccur if acid-forming fertilizers are used without the addition ofadequate lime.
The use of basic slag with sodium nitrate on certain sandy soilsproduced symptoms on corn indicating zinc deficiency. After in-clusion of zinc in the fertilizer, no deficiency symptoms appeared.Since the zinc supply in these soils is low and becomes less avail-able with increasing basicity, the higher pH produced by con-tinuous use of these two basic materials apparently caused thedeficiency symptom.
Where cotton and corn received 24 and 12 pounds per acre ofpotash, greater response was obtained from nitrogen fertilizerswhen phosphorus was supplied as superphosphate than whenbasic slag was used. When the rate of potash was increased to 60pounds per acre, the plots receiving basic slag produced as wellas those receiving superphosphate. The low yields obtained fromlow rates of potash on plots receiving basic slag may be attributedto an increase in potash deficiency caused by the added calciumand the increase in pH.
Some loss of nitrogen may have occurred by volatilization ofammonia from the ammonium nitrate-limestone mixtures. Thismixture was slightly less efficient than some other sources in sev-eral of the experiments. Application of this mixture on the surfaceof moist soil without immediately covering with soil could resultin some loss of ammonia.
The low yields produced by the ammonium phosphates werethe result of developed acidity and/or sulfur deficiency. Wherethese materials were the source of phosphate, the plots receivedno sulfur, whereas ample sulfur was applied on the plots receivingsuperphosphate (about one-half of superphosphate is calcium sul-fate). Unless sulfur is added, cotton yields are often reduced onAlabama soils. Plots receiving the ammonium phosphates oftenhad poor stands, but the cause of the reduced stands is not known.
Cottonseed meal, the only natural organic source used in theexperiments, was satisfactory on cotton but was no better thanthe inorganic sources. It did not produce as much corn as someof the inorganic sources. Accordingly, these experiments furnishno basis for the purchase of expensive natural organic materialsfor cotton and corn.
44 ALABAMA AGRICULTURAL EXPERIMENT STATION
A split application of nitrogen was generally superior to allnitrogen applied before planting. This was probably a result ofleaching losses of nitrogen applied before planting, particularlyon coarse textured soils in years when heavy spring rains werereceived. The increased yields as a result of the split applicationaveraged about 8 per cent.
SUMMARY
This bulletin summarizes the results from 1925 through 1955of field experiments on sources of nitrogen for cotton and corn.Experiments were conducted on the Main Station, substations,and experiment fields of the Agricultural Experiment Station.
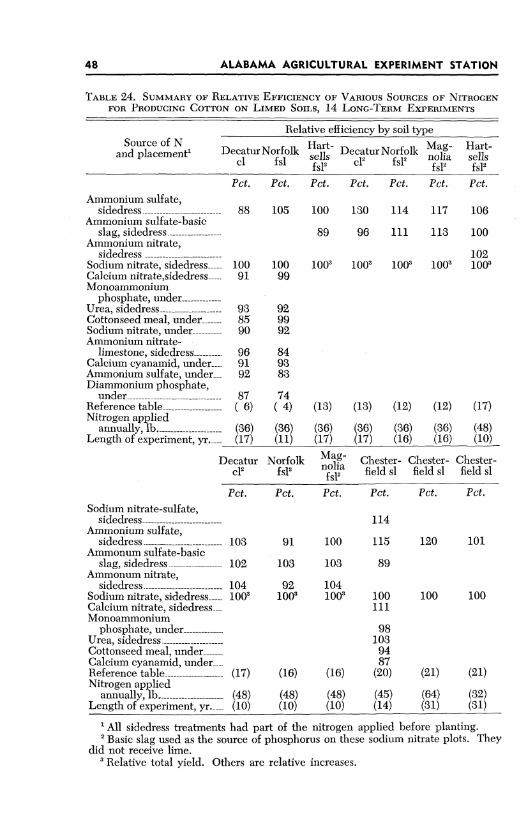
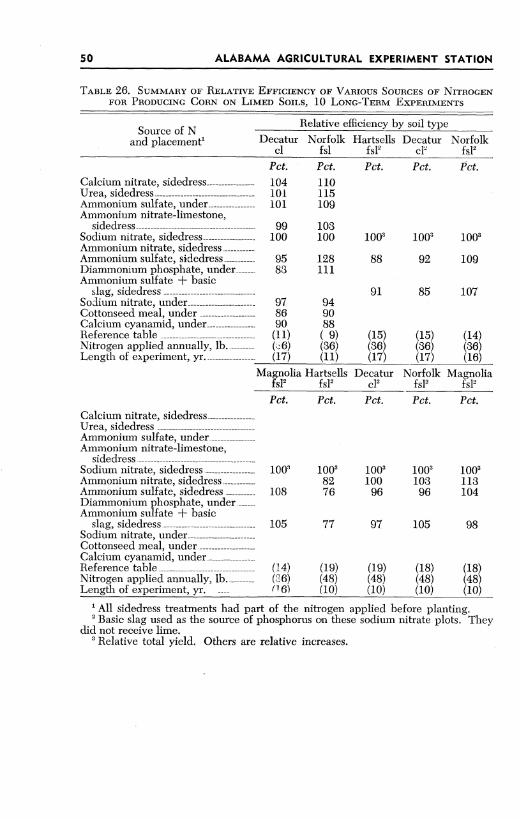
Summary tables of the relative yield increases from the nitro-gen sources reported in the results section are given in Tables 23through 26. In making comparisons between percentage figuresin these tables, valid comparisons can be made only betweensources that appear together in experiments.
Ammonium nitrate, ammonium nitrate-limestone mixtures, am-monium sulfate, calcium nitrate, sodium nitrate, and urea aresatisfactory sources of nitrogen for cotton and corn provided theacidity produced by the acid-forming sources is neutralized. Theammonium phosphates are satisfactory sources of nitrogen pro-vided the acidity produced is neutralized and the sulfur require-ments of the crop are met from other materials. Other sourcesnot used in these experiments may be equally satisfactory.
Cottonseed meal as a nitrogen source was satisfactory on cot-ton, but it was unsatisfactory on corn.
Calcium cyanamid and the ammonium phosphates often pro-duced low yields of cotton and corn. Low yields from the am-monium phosphates were probably due to (1) the acidifyingeffect of the material, and/or (2) sulfur deficiency, since no sulfurwas applied to these plots.
A primary cause of reduced yields was the low pH producedby the acid-forming sources. Reduced yields resulting from in-creased acidity were obtained much more rapidly on coarsetextured than on fine textured soils. For example, the addition of36 pounds of nitrogen from ammonium sulfate for 17 yearsreduced the pH of Hartsells fine sandy loam from about 5.7 toabout 4.5, while the pH of Decatur clay loam remained prac-tically unchanged. Yields were reduced after about 5 years of
SOURCES of NITROGEN 45
ALABAMA AGRICULTURAL EXPERIMENT STATION
application on the Hartsells soil but were not noticeably affectedafter 17 years on the Decatur soil. Continued use of acid-formingsources of nitrogen without the addition of lime will, however,eventually cause reduced yields on nearly all soils in Alabama.
Sodium nitrate, at the rates applied in the experiments reported,maintained the soil pH at an approximately constant level withoutthe addition of lime.
Placing a portion of the nitrogen from sodium nitrate or am-monium sulfate under at planting and the remainder as a sidedressing usually produced higher yields than when all nitrogenwas applied under at planting, especially on sandy soils.
A combination of 1/4 nitrogen from ammonium sulfate and 3/4from sodium nitrate produced as high yields as any single materialand maintained the original soil pH at an approximately constantvalue.
The application of limestone at rates determined by the methodof Pierre (2) was effective in neutralizing the acidity of the acid-forming materials.
These experiments show no evidence of a superiority of eitherthe ammonia or nitrate forms of nitrogen for cotton and cornprovided other factors, such as soil acidity, are not limiting yields.
The major consideration in selecting a source of nitrogen aftersupplying the lime requirement of the soil, is to use the sourcethat can be purchased and applied at the lowest cost per poundof nitrogen. A price conversion table for sources of nitrogen isfound on page 51.
46
SURCES of NITROGEN 4
TABLE 23. SUMMARY OF RELATIVE EFFICIENCY OF VARIOUS SOURCES OF NITROGENFOR PRODUCING COTTON ON UNLIMED SOILS, 14 LONG-TERM EXPERIMENTS
Relative efficiency by soil type
Source of N Hart- DeauDeauplcmn' sls ecatur Norfolk Hart-sDecatur Norfolk Mag-a
fs l fl fscl f sl fslPct Pct. Pct. Pct. Pct. Pct. Pet.
1 All sidedress treatments had part of the nitrogen applied before planting.2 Basic slag used as the source of phosphorus on these sodium nitrate plots. They
did not receive lime.2 Relative total yield. Others are relative increases.
48 ALABAMA AGRICULTURAL EXPERIMENT STATION
SOURCES of NITROGEN 4
TABLE 25. SUMMARY OF RELATIVE EFFICIENCY OF VARIOUS SOURCES OF NITROGENFOR PRODUCING CORN ON UNLIMED SOILS, 11 LONG-TERM EXPERIMENTS
1 All sidedress treatments had part of the nitrogen applied before planting.2 Basic slag used as the source of phosphorus on these sodium nitrate plots. They
did not receive lime.3Relative total yield. Others are relative increases.
so
SOURCES of NITROGEN 5
RELATIVE COST PER POUND OF NITROGEN IN VARIOUS NITROGEN FERTILIZERS
Cost per pound of nitrogenPrice Ammo- Anhy-
per ton Sodium nium nAm Nitrogen Urea Nitrogen drousof material nitrate solution solution
16% N sulfate nitrate 3 45%N20.5% N 33.5% % N 82.2% N
In preparing this report, the authors compiled the results ofwork by many workers of this Station.
Experiments at the Main Station from which results are pre-sented were carried out by R. Y. Bailey*, W. V. Chandler*, R. J.Jones*, E. L. Mayton, F. W. Parker*, W. H. Pierre*, D. G. Stur-kie, and J. W. Tidmore**.
Studies at the substations were conducted by John Boseck, C.A. Brogden, R. C. Christopher*, S. E. Gissendanner, Fred Stew-art***, and J. P. Wilson "*.
Studies on experiment fields were conducted by H. R. Benford*,C. L. Breedlove*, J. T. Cope, Jr., W. D. Lucas*, J. W. Richardson,J. R. Taylor R. W. Taylor*, and J. T. Williamson " .
* Resigned** Deceased
*** Retired
52
SOURCES of NITROGEN 53
LITERATURE CITED
(1) NAFTEL, J. A. The Absorption of Ammonium and Nitrate Nitrogen byVarious Plants at Different Stages of Growth. Jour. Amer. Soc. Agron.23: 142-158. 1931.
(2) PIERRE, W. H. Nitrogen Fertilizers and Soil Acidity: I Effect of Va-rious Nitrogenous Fertilizers on Soil Reaction. Jour. Amer. Soc. Agron.20: 254-269. 1928.
(3) PIERRE, W. H. Nitrogen Fertilizers and Soil Acidity: II The Use ofFertilizer Combinations, Lime, and Basic Slag in Correcting the AcidityFormed by Various Nitrogenous Fertilizers. Jour. Amer. Soc. Agron.20: 270-279. 1928.
(4) TIDMORE, J. W. AND WILLIAMSON, J. T. Experiments with CommercialNitrogenous Fertilizers. Ala. Agr. Expt. Sta. Bul. 288. 1932.
(5) VOLK, N. J. AND TIDMORE, J. W. Effect of Different Sources of Nitrogenon Soil Reaction, Exchangeable Ions, and Yield of Crops. Soil. Sci. 61:477-492. 1946.