POLITICAL ECONOMY RESEARCH INSTITUTE Rising Inequality as a Root Cause of the Present Crisis Engelbert Stockhammer April 2012 WORKINGPAPER SERIES Number 282 Gordon Hall 418 North Pleasant Street Amherst, MA 01002 Phone: 413.545.6355 Fax: 413.577.0261 [email protected]www.peri.umass.edu
Transcript
PO
LIT
ICA
L E
CO
NO
MY
R
ESEA
RC
H IN
ST
ITU
TE
Rising Inequality as a Root Cause of the Present Crisis
Acknowledgements. An earlier version of this paper has been presented at the workshop Getting
Out of the Crisis: the role of distribution, 2e Colloque international, CEPN, Paris 13, June 2011. The
author is grateful to the participants and to Paul Auerbach for comments.
2
1. Introduction
The recession that began in 2008 has been the worst economic crisis since the 1930s. The discussion
of its causes usually focuses on defects in the financial system: incentives of bank managers;
financial instruments that lacked transparency; an exaggerated trust in the ability of sophisticated
statistical models to insure against risks; the shift from the originate‐and‐hold to the originate‐and‐
distribute module of banking made possible by mortgage‐backed securities; increasing international
imbalances. The list could be continued and the literature on this is long and growing. What it shares
in common is that it highlights malfunctions within the financial sector. While there can be no doubt
that financial factors are critical in the making of the crisis, the present debate runs the danger of
neglecting other socio‐economic aspects. The rise of inequality has been one of the most profound
changes in modern societies since the early 1980s. Several authors have recently highlighted that
inequality may have played a role, but often without clarifying the mechanisms. This paper will
explore the role that rising inequality has played in creating the preconditions of the crisis.
Since the early 1980s an increase in inequality has occurred in all OECD countries. At first sight, this
seems to have taken on different forms in different countries. In the Anglo Saxon countries we
observe a sharp increase in personal income inequality. Top incomes have experienced a spectacular
growth (Piketty und Saez 2003, 2007; OECD 2008). Since 1980 the top income percentile has
increased its share in national income by more than 10 percentage points. In continental European
countries we see a strong decline in the functional distribution of income. Since 1980 the (adjusted)
wage share has fallen by around 10 percentage point (of national income). Given the extent of
redistribution that has taken place, one might expect that there are macroeconomic effects. While
several authors have noticed that there might be a link between rising inequality and the crisis
(Stiglitz 2010, Wade 2009, Rajan 2010), there is as of yet little systematic analysis. This article gives a
conceptual framework, based on post‐Keynesian theory, for the different channels through which
rising inequality may have contributed to the crisis and, secondly, presents some preliminary
evidence to substantiate these channels.
Our hypothesis is that the crisis should be understood as the interaction of the deregulation of the
financial sector (or financialisation, more generally) with the effect of rising inequality. In a nutshell
our story is the following: since the early 1980s the rise of Neoliberalism has brought about
important economic and societal changes, including the deregulation of financial sector and various
legislative measures that have weakened organised labour and the welfare state. From a
macroeconomic point of view two growth models have emerged: a debt‐led growth model and an
export‐led growth model. The USA and the UK are prime examples of the former, Germany and
3
China for the latter. Both growth models can be regarded as a reaction to the lack of domestic
demand due to rising inequality. Potentially stagnating domestic demand is compensated for, in the
first case, by debt‐financed consumption and residential investment booms and, in the second case,
by export demand. Several macroeconomic imbalances have emerged: growing trade imbalances
across countries; rising household debt levels, namely in the debt‐led economies; a rise in the size of
the financial sector relative to others; and a rise of asset and property prices. These imbalances are
at the root of the crisis. They have been facilitated by financial deregulation, but most of them are
intrinsically linked to the rise of inequality.
The paper takes a view that is informed by Kaleckian macroeconomics and by French Regulation
Theory. We identify four channels through which rising inequality has contributed to the crisis.
Firstly, rising inequality creates a downward pressure on aggregate demand, since it is poorer
income groups that have high marginal propensities to consume. Second, international financial
deregulation has allowed countries to run large current account deficits and for extended time
periods. Thus, in reaction to potentially stagnant domestic demand two growth models have
emerged: a debt‐led model and an export‐led model. Third, (in the debt‐led growth models) higher
inequality has led to higher household debt as working class families have tried to keep up with
social consumption norms despite stagnating or falling real wages. Fourth, rising inequality has
increased the propensity to speculate as richer households tend hold riskier financial assets than
other groups. The rise of hedge funds and of subprime derivatives in particular has been linked to
rise of the superrich.
The paper will clarify these channels and present some (preliminary) evidence to substantiate these
channels. Our analysis leads to the following research questions: is there evidence for the
emergence of debt‐led versus export–led growth models? Is there evidence for the effect of changes
in income distribution on consumption demand and aggregate demand? Is there a link between
rising inequality and rising debt levels? Has increased inequality contributed to a higher propensity
for speculation?
The paper is structured as follows. Section 2 gives an overview of the crisis and its different phases.
Section 3 makes some comments on the debate on the origins of the crisis. Section 4 documents the
rise in inequality in the past decades. Section 5 discusses four channels through which rising
inequality has contributed to the crisis and presents evidence for these channels. Section 6
concludes.
4
2. The crisis 2007‐2011
In mid 2006 house prices in the USA started to decline. With hindsight, that probably marks the
beginning of the crisis, but the US growth model had given rise to imbalances along several
dimensions. Rapidly rising house prices, and the mortgage lending that came with it, had been the
basis of a boom driven by credit‐financed consumption and construction investment in the USA. The
boom came with large current account surpluses and, due to financial innovation, the financial
sector increased its assets and liabilities on a massive scale. This section gives a brief overview of the
unfolding of the crisis itself.
The crisis broke out in spring 2007 in a seemingly obscure niche of the US financial system: the
subprime market, which is the market for derivatives on low‐quality mortgage credit; thus the initial
name of the crisis as the subprime crisis. This is a rather small segment of the overall mortgage
market, though it accounted for a substantial portion of the credit growth in the years before the
crisis. As subprime credit is, by definition, of low quality, it was the natural field for a securitization
of these loans that was supposed to reduce risk (e.g. IMF 2006). What was going on here was the
extreme form of what happened on a much broader scale in the entire mortgage industry. In August
2007 the crisis spilt over into the interbank market, where banks lend to each other, usually very
short term. The interbank market is at the very centre of the modern financial system. Interest rates
rose to more than one percentage point above those on government bonds. This increase in the risk
premium of lending reflected that banks did not trust each other. And rightly so, as it turned out.
Central banks reacted quickly and pumped billions (of dollars and Euros) into the market to maintain
liquidity.
However, while the interbank market stabilized, the crisis evolved. In spring 2008 Bear Stearns, one
of the leading investment banks, was bankrupt and could only be sold with the FED guaranteeing
some 20 bn US$ worth of assets. A first (small) fiscal stimulus packet was implemented in the USA.
At this stage the impact of the crisis on the real economy outside the USA was limited. In
August/September 2008 the crisis turned into a full scale financial crisis – and it did so with a bang:
Lehman Brothers, one of Wall Street’s leading investment banks, went bankrupt. The end of the
world (or at least of big finance) as we knew it seemed to have arrived. Interest rates soared
(interest rate spreads rose to several percentage points) and liquidity froze.
Again governments reacted. The principles of neoliberal free‐market economics were suspended for
a few weeks. Central banks provided more liquidity, but that proved insufficient to stabilize markets.
Governments had to intervene directly: in the U.S., AIG, an insurance firm that had insured huge
volumes of credit derivates, was taken over by the state, as were Fannie Mae and Freddie Mac, the
5
two state‐sponsored mortgage refinancing giants. Within a few weeks European countries followed
suit with the recapitalization of financial institutions and massive guarantees for interbank credits
becoming mainstream economic policy. Recapitalization meant that governments effectively
nationalized (fully or partly) financial institutions – but governments abstained from interfering with
the management of banks despite obvious management failures. In late October 2008 an EU summit
issued a statement that no systemically important financial institutions would be allowed to fail – a
capitalism without bankruptcies (of big banks) was declared!
By fall 2008 the financial crisis had turned into a full blown economic crisis. World trade contracted
by more than 20% and GDP in most developed countries shrank at a speed not seen since the 1930s
(in most countries by around 5%). And it not only hit those countries that had experienced property
bubbles, but also countries like Germany and Japan where property prices had been practically flat;
it spread as well to emerging countries. Eastern European countries were particularly bad hit, with
the Baltic countries suffering GDP declines of around 20%. The IMF had to be called in to save
Hungary, Pakistan and the Baltic states. But the most conspicuous symbol of the downturn was
certainly the fall of GM: once the world’s largest firm and employer, it now had to rescued by the US
government.
While complete meltdown seemed imminent in fall 2008, in the course of spring 2009 it became
clear that the – historically unprecedented – scale of government intervention had prevented
outright collapse. A cascade of bank breakdowns could only be prevented by rescue packages that
amounted to 80% of GDP in the USA and the UK (UNCTAD 2009, Table 1.8) and by the FED
expanding its balance sheet by a trillion US$, mostly by acquiring assets that it would not have
touched in normal times. Risk premia remained elevated, banks were making phenomenal losses,
unemployment started rising, but normality of a sort returned. The pressure to reform the system
had receded. Earlier declarations of a fundamental restructuring of the financial system (e.g. the G20
meeting of Nov. 2008) had been forgotten and the debate on reform turned into specialists’ debate
about technicalities, with all but private bankers and central bankers being excluded from decision
making circles. The arrogance of the financial elite, however, is best captured by the fact that, in
spite of the obvious disaster in finance, bankers’ bonuses returned to pre‐crisis levels.
But the normality that was about to restore itself was not quite the normality existing before the
crisis. After all, the crisis was by no means over, though for the bankers it seemed so. For large parts
of the population, it had only just had begun. Production fell and unemployment rose. In the USA
foreclosures were rising. People lost their jobs and their homes. And there was another devastating
effect of the crisis: budget deficits were increasing, surpassing 10% of GDP in many cases, with public
6
debt increasing accordingly. Financial markets started to worry whether governments would be able
to pay their debts. So in the course of 2009 the crisis thus took its next turn: a sovereign debt crisis.
Its most prominent victim was to be Greece and with it the Euro system. In terms of economic policy
there has been a shift towards austerity.
In early 2010 Greece faced punitive interest rates on its (public) debt issues. Greece had fudged
public debt statistics (with the help of leading Wall Street banks) and now had difficulties refinancing
its debt. Indeed, what had been exposed was a fundamental flaw in the construction of the Euro
system. With exchange rates frozen, the southern countries had, despite much lower inflation since
adopting the Euro, slowly but steadily lost competitiveness to Germany and its economic satellites.
Germany’s net exports (mostly to other Euro countries) amounted to more than 5% of GDP,
achieved largely by wage suppression and, consequently, low inflation rates (Lapavitsas et al 2010).
The Euro area had no instruments to deal with the internal imbalances that emerged, other than
trusting in labour market flexibility to adjust price levels in the nations of the Euro area to bring
about stability (Stockhammer 2011).
While it was relatively simple to blame the Greek crisis on irresponsible fiscal policy the structural
problems of the Euro area were illustrated by the Irish crisis shortly thereafter. Ireland had
government surpluses before the crisis, but still needed a huge rescue package (€ 85 bn, more than
half of Irish GDP). As in Greece, the rescue package was really one for the European financial sector
rather than for states. Ireland had experienced an enormous real estate bubble that burst und
effectively bankrupted its banks. Because of the bank bailouts, Irish debt soared by 40 percentage
points of GDP from 2007 to 2010. Literally all of the obligations of the bust Irish banking system were
guaranteed, which led to an angry article by Eichengreen (2010).
The Euro crisis is still going on at the time of writing. While the economic situation is desperate in
Greece, the bigger danger for the Euro is posed by Italian and Spanish debt markets. But the
underlying problem is a European one: European countries have given up on independent monetary
policy, but there are no effective institutions and fiscal transfers in place that would stabilise these
countries in times of crisis. Rather the crisis is amplified by pro‐cyclical austerity policies that are
increasingly imposed by Brussels (and Berlin).
3. The debate on causes of the crisis
Many insightful contributions to the debate on the causes of the crisis emphasize microeconomic
factors. They come in different versions. First, there are contributions that highlight incentives for
7
bank managers that encourage risk taking (Roubini and Mihm 2010) and the extensive use of
statistical models that were aimed at diversifying risk and equated risks with past volatility (based on
short time series) and underestimated the correlation of risks in the event of a crisis. These
arguments discuss problems within the private sector and, typically, assume rational behaviour.
Second, there is group of arguments highlighting wrong incentives created by government
institutions. A prime example is the Basle II accord, which is thought to have created incentives for
private banks to shift activities off‐balance to minimize adherence to capital requirements. Rajan
(2009) argues that successive US governments have encouraged lending to the poor through state‐
backed mortgage refinancing institutions. Implicitly these arguments assume rational behaviour on
part of private actors. Third, there is a growing behavioural finance literature that suggests that
people, even financial investors, often don’t act rationally and are prone to irrational exuberance
(Akerlof and Shiller 2009).
As modern economics is dominated by a microeconomic approach it is perhaps not surprising that
the macroeconomic dimension is less prominent. Two factors stand out in the debate. First, there is
a growing interest in debt‐cycle and debt‐deflation models. Rising property prices (in the USA) are a
key element, helping to engender a substantial rise in household debt. For whatever reason, the
private savings ratio had been on a declining trend in the decades before the crisis – consumption
was in part being financed by rising debt. Rising house prices were also central for the (residential)
investment boom that parts of the USA, Spain and Ireland had witnessed.
A second macroeconomic factor that has received widespread attention has been the rising
international trade imbalances and increases in capital flows. The USA had experienced massive
capital inflows (and trade deficits) prior to the crisis. There is no consensus as to whether trade
imbalances or savings decisions drove capital flows – or whether capital flows have been driving
asset prices and macroeconomic performance, but there is a widespread perception that
international imbalances had something to do with the crisis. The ‘savings glut’ hypothesis of
Bernanke (2005) essentially blamed south East Asian central banks for the imbalances (as if the
inflows were forced upon the USA). Borio and Disyatat (2011) argue that capital flows are not due to
savings decisions, but to portfolio decisions and that they are prone to large swings due to what they
call an excess elasticity of the financial system. Without much theoretical ado, Reinhart and Reinhart
(2008) have shown that episodes of capital inflows (‘capital flow bonanzas’) typically lead to
speculative bubbles on financial markets and property markets and, ultimately, to financial crises.
Figure 1 summarises the macroeconomic mechanisms of the crisis that have been highlighted in the
literature graphically. Changes in the financial system, due to the deregulation (or wrong regulation)
8
allowed for a bubble on financial and property markets, which in turn allowed for the massive
increase in household debt. Rising household debt levels fuelled consumption expenditures and
residential investment and thus led to economic growth that also resulted in current account
deficits. The resulting capital inflows, in turn, helped keep interest rates low and fuelled the bubbles.
Figure 1. Standard crisis explanation
There is disagreement about the microeconomic dimension for these developments. These range
from neoclassical approaches that highlight government (regulation failure), behavioural economics,
which highlights irrational behaviour, to post‐Keynesian approaches that highlight, in the tradition of
Hyman Minsky, the intrinsic and endogenous instability of the financial system, which has been
amplified by financial deregulation. Some commentators have emphasised a parallel between the
rising inequality of the 1920s and the present crisis (Livingston 2009). Usually these arguments
remain rudimentary. The discussion that follows will present a post‐Keynesian and regulationist
framework for the inequality argument and substantiate some the channels empirically.
4. Rising inequality
Income distribution has experienced dramatic changes in the last decades. And there are remarkable
differences across countries. Since 1980 (adjusted) wage shares have fallen by some ten percentage
points in continental European countries, and even more in Japan (Figure 2). The decline in the USA
and the UK was moderate and is around five percentage points. The Anglo Saxon countries, on the
other hand, experienced a much more dramatic change in personal income distribution (Figure 3). In
the USA the top 1% of the income distribution has increased its share in national income from 8%
(1980) to above 21% (2005). Developments in other English‐speaking countries are similar. In
continental European countries and Japan personal income has become more unequal, but to a
much more moderate degree. The dramatic rise in personal inequality is, to a significant extent, due
to sharply rising management remuneration (in English‐speaking countries). These are counted as
labour costs in the national account and thus form part of the wage share. If management salaries
were counted as distributed profits, i.e. adjusting the US wage share for the wage payments of top
income percentile, it looks much more like European wage shares. Overall, increasing inequality has
thus resulted in stagnating incomes for the working classes (in the USA real median wages have
grown by a total of 2.8% in the quarter century from 1980 to 2005; OECD 2008), whereas profit
9
incomes have increased sharply, even as the form that this increase has taken differs across
countries.
Figure 2
Figure 3
These dramatic changes in income distribution still await satisfactory explanation. Several studies
have tried to quantitatively identifying its causes. Remarkably, recently several mainstream studies
have addressed the issue of changes in functional income distribution. IMF (2007a) and European
Commission (2007) identify technological change as the main determinant of changes in the wage
share in OECD countries; globalisation is considered a secondary factor. Stockhammer (2012) argues
that these results are not robust and finds that financialisation, globalisation and welfare state
retrenchment all have contributed to falling wages shares and that technological change only had
moderate effects. Financialisation had also been highlighted by ILO (2008), though without
econometric evidence. Rodrik (1998), Harrison (2002) und Jayadev (2007) showed for a sample of
developing and developed economies that globalisation has had negative effects on the wage share.
Onaran (2009) shows for a four emerging economies that financial crisis have long‐lasting effects on
income distribution.
5. Rising inequality and the causes of the crisis: four channels
There is an obvious parallel between the present crisis and that of the 1930s: both were preceded by
sharp increases in inequality. This has led some authors to speculate about a possible connection
between the two phenomena (Livingston 2009), but there are yet few studies that detail the causal
relation. This section discusses four channels through which rising inequality has contributed to the
imbalances that caused the crisis. These channels operate in interaction with financial factors. Our
explanation has some similarities with Horn and van Treeck (2011), who identify inequality,
international imbalances and under‐regulated financial markets as the causes of the crisis.
Channel 1: Rising inequality has led to stagnating domestic demand, namely consumption demand.
10
Section 4 presented evidence for the dramatic changes in income distribution that occurred in the
past 30 years. What are the macroeconomic effects of this redistribution? More precisely, what are
its effects on aggregate demand? First, other things equal, one would expect a falling wage share to
have a negative effect on consumption demand: wage earners, and especially the poor, will have a
higher consumption propensity than recipients of profit incomes. Second, a falling wage share, i.e. a
rising profit share, ought to have positive effect on investment expenditures (at least for a given
level of demand). Third, a falling wage share in any one county ought to have a positive effect on net
exports as competitiveness increases. This last effect, however, is not relevant in our context, as
wage shares have fallen in all countries. The total or net effect of a change in wage share on
aggregate demand is theoretically ambiguous and depends on the relative size of the partial effects.
Bhaduri and Marglin (1990) proposed a post‐Kaleckian macro model that encompasses these three
effects. It allows for aggregate demand to be either wage led or profit led. A wage‐led demand
regime is one where an increase in the wage share leads to higher aggregate demand, which will
occur if the consumption effect in larger than the investment and net export effect. A profit‐led
demand regime is one, where an increase the wage share has a negative effect on aggregate
demand. The Kaleckian hypothesis is that (at least as far as the domestic components are
concerned) demand is wage led.
This model has inspired a series of empirical studies including Bowles and Boyer (1995),
Stockhammer and Onaran (2004), Naastepad and Storm (2006/07), Hein and Vogel (2008),
Stockhammer and Stehrer (2011), Onaran and Galanis (2012). For example Stockhammer et al.
(2009) find a consumption differential of around 0.4 for the Euro area. Thus the decline in the wage
share by around ten percentage points would have led to a reduction of consumption by four
percentage points of GDP.
The effects of changes in personal income distribution on consumption demand are more
straightforward, as standard consumption theory predicts that the poor will have higher marginal
consumption propensity than the rich. To illustrate, Stein (2009) reports that, for Germany, in 2007
the top quartile had an average saving rate of 15.8%, the second quartile of 9%, the third of 8% and
the bottom quartile 4.1%. Indeed saving differentials across income groups have increased, with the
difference between the top and the bottom quartile increasing from 5.5% in 1995 to 11.7%. [OECD?]
The increase in the saving differential is, according to Stein, due to increasing inequality in this
period. Brenke (2011) argues that rising inequality has been an important contributing factor to
Germany’s weak consumption demand.
11
Channel 1 argues that rising inequality has, other things equal, a negative effect on consumption
expenditures and thus on aggregate demand. Other things, however, were not equal during
neoliberalism.
Channel 2: The deregulation of international capital flows has relaxed the external balance constraint
and allowed countries to run larger current account deficits. This has allowed for the development of
two distinct growth models: a debt‐led growth model that came with a consumption boom and
current account deficits, and an export‐led growth model.
Figure 4 plots the standard deviation of current account positions of OECD countries. This is an
measure of international imbalances. The figure illustrates that international imbalances did not
occur recently, but are part of a longer term trend: the liberalisation of capital flows after Bretton
Woods did not lead to stable exchange rates, but rather to increasing international imbalances
because exchange rates are increasingly determined by capital flows rather than trade balances. As
capital flows have financial, often speculative, motives and are typically pro‐cyclical, the
deregulation of international capital flows has loosened external trade constraints. It has allowed
countries to run larger current account deficits for longer periods (compared to the Bretton Woods
period). Reinhart and Reinhart (2008) show that episodes of strong capital inflows (‘capital flow
bonanzas’) usually come with speculative bubbles on financial and property markets and typically
end in recessions.
Figure 4 [std deviation current account]
Financial globalisation has thus ironically increased the room for different developments across
countries. Current account imbalances can be maintained for longer – essentially as long as markets
trust the situation. This is the background to the emergence of two different growth models.
The imbalances at the eve of the crisis are well known. In 2007 Germany had a current account
surplus of 7.5% of GDP; the USA had a deficit of 5.07% (OECD.stats, accessed Feb 2012). Figure 4
suggest that these imbalances are part of a long‐term trend. Our hypothesis is that these imbalances
are the expression and results of different growth models that developed in different countries.
More specifically, we argue that countries can be usefully grouped in debt‐led growth models and
12
export‐led growth models.1 Importantly, we interpret these models as a reaction to the same
underlying problem: stagnating domestic demand due to rising inequality. Table 1 classifies some
important countries. Debt‐led and finance‐led growth models exist in core as well as in peripheral
countries. While on a global scale the debt‐led economies were at the core, within the Euro area, the
roles are reversed and the export‐led economies are at the centre and debt‐led growth took place in
the periphery.
Table 1
The historical paths that led the countries to their positions in Table 1 are complex and we make no
claim of being able to explain them here. Financial institutions as well as industrial relations and
industrial policy play a role. The USA and the UK have long been leading examples of market‐based
financial systems and they led the way in neoliberal financial deregulation of the 1970s and 80s. In
particular in the USA home ownership has a special economic and ideological connotation. For the
countries of the European periphery financial liberalisation was very much an outcome of European
integration, one which imposed the liberalisation of capital flows and provided the framework for
capital inflows. There is also an aspect of historical continuity on the side of the export‐led model,
complemented by a new dynamic due to changing circumstances. Germany has long had an export‐
oriented growth strategy. The entire era of European integration is marked by German surpluses and
subsequent revaluations. However, German demand composition only tilts decisively towards an
export‐led growth model after unification and the introduction of the Euro (Horn et al. 2010). In
Japan the export‐led growth model is arguably a reaction to its debt‐led growth model going into
reverse after 1992. In the emerging economies of South East Asia, export‐led growth is in part a
reaction to the humiliating experience of the crisis 1097/98, and, certainly in the case of China, the
result of strategy of undervaluation in order to accumulate reserves.
Given the contrasting current account positions, it is hardly surprising that countries have different
compositions of final demand. Figure 5 illustrates the stark difference in consumption shares across
1 No particular weight is given to names. What we label ‘debt-led’ has been called
financialized, finance-led models. Our ‘export-led’ model has also been called neo-
mercantilist. Hein and Mundt (2012) offer a more detailed analysis of debt-led and export-led
growth models. The conceptual distinction is found in Becker (2002).
13
countries. Whereas debt‐led economies have typically experienced a substantial increase in the
consumption share, export‐led economies have experienced a decline in the consumption share.
Figure 5
Increases in the consumption share have typically been accompanied by increases in household
debt. Table 2 shows the in household debt in percent of GDP as well as its change from 2000 to
2008. We focus on the change in household debt rather than on its level, because, arguably
increases in debt (rather than a level of debt) can feed consumption expenditures. For the stability
of the growth regime, of course the change as well as the level of debt may be important. While
household debt declined in Germany from 2000 to 2008 by 11 percentage points of GDP (and it
increased in Austria by a moderate 7%‐points), household debt rose by 26 percentage points in the
USA and by 28 percentage points in the UK. In peripheral Europe the increases were even sharper
(though levels in Mediterranean Europe were usually low). In Ireland it rose by 61, in Spain by 33
percentage points.2
Table 2 [HH debt]
Overall, our crude classification in debt‐led and export‐led growth models seems consistent with the
data: countries with current account deficits are also those with higher increases in household debt.
The USA and the UK on the one side and Germany and Japan on the other are prime example of
these growth models. The classification also is helpful in understanding developments in Greece,
Portugal, Ireland, and Spain. The Irish case, admittedly, is somewhat more complicated as Ireland
had, at the same time current account deficits and net export surpluses, the difference being
explained by repatriated profits. The Irish external position deteriorated in the decade prior to the
crisis. Several countries would, however, not fit neatly into our dichotomy, for example the new
member states in central and eastern Europe, but also the Netherlands and Denmark, which seem to
have had, at the same time, sharp increases in household debt and export surpluses. Notably these
are small countries.
2 We were unable to find comparable data for Japan. Girouard et al (2006, Figure 1) report
falling household debt levels from 1995 to 2004.
14
Channel 3. Rising inequality contributed to household debt (in the debt‐led models).
The distribution of household debt is an under‐researched topic. Primary data are often not readily
available and, where they are, they usually not reported in a form that would encourage
distributional analysis. For the USA, data are available and will be discussed below.
In the literature there are opposite views on the distributional dimension of rising household debt in
the USA. On the one hand Barba and Pivetti argue that ‘rising household indebtedness should be
seen principally as a response to stagnant real wages and retrenchments in the welfare state, i.e. as
the counterpart of enduring changes in income distribution’ (Barba and Pivetti 2009, 114); rising
inequality has thus contributed to household debt in that the poor were driven into debt by
declining wages and social services. On the other hand, it has been argued that rising household
debt, and more precisely falling saving rates, is due to the behaviour of the rich. Maki and Palumbo
claim that ‘all of the consumption boom really can be attributed to the richest groups of
households’ (Maki und Palumbo (2001, 22). This argument has been cited widely, including by
Marxist authors (Brenner 2003, Glyn 2006). While rising household debt is related to rising inequality
in this story, it is not the poor who are accumulating debt, but it is the top end of the distribution.
The study by Maki and Palumbo was one of the first on this topic. They analyse wealth effects in the
consumption behaviour of US households based on data of the Survey of Consumer Finances (SCF)
from 1992 to 2000. The SCF also formed the basis for later studies that yielded different results.
Some comments are in place. First, their study focuses on saving rates rather than on debt levels.
While it is tempting to assume that the groups that reduced their saving rates are also the ones
whose debt levels increased, this need not be the case. Second, their study focuses on the 1990s, i.e.
the period in the run up to the dot com bubble. In this period, arguably gains in wealth were
concentrated in financial assets that are more highly concentrated than the gains in housing wealth
that took place in the 2000s. Third, later studies are unable to replicate the findings of Maki and
Palumbo. Bibow (2010) finds that the decline in the saving can be attributed to home owners.
While Barba and Pivetti (2009) do not present empirical analysis, Wolff (2010) offers extensive
analysis of primary data. He argues that the increase in household debt is due mostly to the
attempts of middle class households to maintain their consumption position in the face of falling or
stagnating real wages. Maintaining social status was only possible through increasing debt.
Kennickell (2009) gives an extensive overview of the results of various cohorts of SCF data from 1989
to 2007. We will use this study to illustrate the different points. Table 3 summarises the share of
15
debt held by different income groups. Kennickell groups them into the bottom 50%, the 50‐90th
percentile, the 90‐95th percentile, the 95‐99th percentile and the top percentile. Looking at the
distribution of debt over time, the overall impression is one of stability. (As the SCF is based on a
small sample, not all fluctuations necessarily reflect changes in the underlying population.) The
bottom 90% of the distribution had 74.9% of all household debt in 1989 and 73.3% in 2007.
Table 3 [debt by income group.]
Debt has to be serviced out of current income. And the distribution of current income had changed
in the relevant period. Table 4 thus summarises the debt‐to‐income ratio by income group. This
gives a very different picture. There is a clear trend: relative to income, debt has increased more
sharply in lower income groups. The debt‐to‐income ratio for the bottom 50% increased from 61%
(1989) to 137% (2007); for the next 40 percentiles it increased from 81% to 148%; while the debt to
income ratios also increased for the top 10% of the income distribution, the dynamic was a much
weaker one.
Table 4 [debt‐to‐income by income group.]
Thus while the distribution of debt has remained rather stable, debt relative to income has increased
more for lower income groups. In this sense the hypothesis that lower income groups have been
driven into debt by falling wages (and social services) is consistent with the data.
Channel 4. Rising inequality has increased the propensity to speculate.
There is a widespread perception that increasing inequality, and in particular the growth of small
group of superrich individuals has contributed to the total ‘propensity to speculate’. The intuition
behind this perception is that, with increasing income, the consumption possibilities get exhausted
and speculative use of wealth increases. For example Huffschmied (2002), argues that increasing
inequality has resulted in ‘excess liquidity’ that has had an inflationary effect on the prices of
financial assets. The term excess liquidity is somewhat confusing in this context, but the intuition is
16
clear enough: because of the growth of the superrich there is an increased volume of wealth that is
looking for risky investment.
However, there are few empirical studies on this topic. This is due to conceptual as well as empirical
difficulties. Conceptually it is difficult to operationalise the concept of speculation. We use the term
pragmatically, in the sense of risky investment strategies. Empirically the problem is that data
availability on wealth distribution is extremely poor.
SCF data confirms that rich household hold riskier assets. In 2007 the top10% of the income held
60.5% of the holdings of checking, savings, money market and call accounts and 50.3% of the
holdings of certificates of deposits, but 90.4% of direct holdings of stocks and 87.9% of bonds, 51.9%
of mutual funds and hedge funds (Kennickell 2009, Figure A3a). This lends itself to the conclusion
that a shift in wealth distribution in favour of the rich would also result in a shift towards riskier
portfolios of financial assets. Things are more complicated as regards with regard to non‐financial
wealth: principal residences are the largest form of non‐financial wealth and the bottom 90% hold
(in 2007) 61.5% of that wealth – and they have turned out to be quite a risky asset.
Photis Lysandrou (2011) sheds light on a particular mechanism by which rising (wealth) inequality
has contributed to the crisis. Lysandrou argues that, firstly, the crisis broke out in the market for
derivatives on subprime loans. Second, this market segment developed so substantially because
hedge funds demanded these high‐risk and (at the time it seemed) high‐return assets. These assets
are not off the shelf, but were created by investment banks to fit the demands of hedge funds.
Third, hedge funds are by and large an investment vehicle for the super‐rich (at a later stage
institutional investors increasingly invested in hedge funds): ‘the chief driving force behind the
creation of the structured credit products that triggered the crisis was a global excess demand for
investable securities and that key to the build‐up of this excess demand was the huge accumulation
of private wealth’ (Lysandrou 2011, 3).
Hedge funds held about half of all CDOs (Lysandrou 2011, Fig 9). The assets managed by hedge funds
grow fourfold between 2000 and 2007, which explained their strong demand for exotic financial
instruments. Because of their high minimum investment requirements hedge funds are primarily for
superrich individuals (‘high net wealth individuals’) and, more recently, institutional investors, which
want to hold some high risk assets. Whereas hedge funds were essentially catering rich individuals in
2000, by 2007 almost half of their assets came from institutional investors. Lysandrou identifies the
superrich as what is called High Net Wealth Individuals (HNWI), who own net wealth of more than a
million US$. HNWI own about one fifth of all financial assets, but more than half of alternative
17
investment assets, which include CDOs and other derivatives (Lysandrou 2011, Tab 1). Lysandrou
concludes: ‘A major policy implication that follows from the above analysis is that the world’s
wealth has to be more equitably distributed if global financial crises are to be avoided’ (Lysandrou
2011, 22).
6. Conclusion
This paper has investigated the question whether rising inequality has contributed to the imbalances
that erupted in the present crisis, in other words, whether rising inequality is a cause of the crisis.
We have discussed four channels through which inequality may have contributed. This is not to be
understood as an alternative to financial factors, but as a complementary explanation that highlights
the interaction of financial and social factors. First, increasing inequality leads potentially to a
stagnation of demand, since lower income groups have higher consumption propensity. Second,
countries developed two alternative strategies to deal with this shortfall of demand. In the English‐
speaking countries (and in Mediterranean countries), a debt‐led growth model emerged, in contrast
with the export‐led growth model in countries such as Germany, Japan or China. These two growth
models became feasible because financial liberalisation of international capital flows allowed for
unprecedented international imbalances. Third, in debt‐led countries rising inequality contributed
to the growth of debt as the poor have increased their debt levels relative to income faster than the
rich. For the USA this can be clearly seen in debt‐to‐income ratios for different income groups.
Financialization has meant debt growth instead of wage growth. This growth model that is not
sustainable. Fourth, increasing inequality has increased the propensity to speculate, i.e. it has led to
a shift to more risky financial assets. One particular aspect of these developments is that subprime
derivatives, the segment where the financial crisis broke out in 2008, were developed to cater to the
demands of hedge funds that manage the assets of the superrich. Increasing inequality has thus
played a role in the origin of the imbalances that erupted in the crisis as well as in the demand for
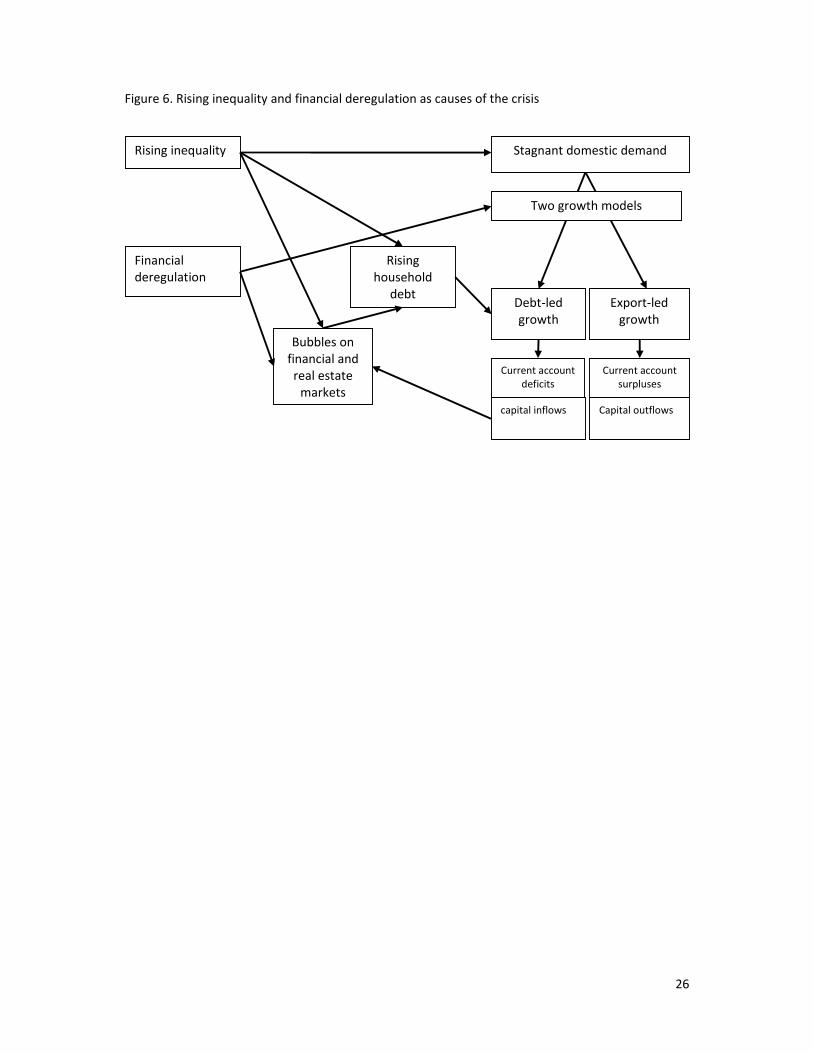
the very assets in which the crisis broke out. Our conclusion that increasing inequality, in interaction
with financial deregulation, should be seen as root causes of the crisis. Figure 6 summarises our
argument graphically.
Figure 6. Rising inequality and the causes of crisis
18
This argument has direct implications for economic policy. A broad consensus exists that financial
reform is necessary to avert similar crises in the future (even if little has yet changed in the
regulation of financial markets). The analysis here highlights that income distribution will have to be
a central consideration in policies dealing with domestic and international macroeconomic
stabilisation. The avoidance of crises similar to the recent one and the generation of stable growth
regimes will involve simultaneous consideration of income and wealth distribution, financial
regulation and aggregate demand. It is this first element – the distribution of income and wealth –
that has not conventionally been incorporated in macroeconomic analysis. Put more bluntly,
creating a more equal society is not an economic luxury that can be taken care of after the real
issues, such as financial regulation, have been sorted out. Rather, a far more equitable distribution
of income and wealth than presently exists would be an essential aspect of a stable growth regime:
wage growth is a precondition of an increase in consumption that does not rely on the growth of
debt. And financial assets are less likely to be used for speculation if wealth is more broadly
distributed.
A more equitable distribution of income and wealth will involve changes in tax as well as in wage
policy. Reformed tax policies will include increases in upper income tax rates, rises in wealth taxes
and the closure of tax loopholes and of tax havens (Shaxson 2011). In the area of wage policy far
reaching changes are necessary. Present policy prescriptions aim at cutting wages in a recession. But
higher wage growth is a necessary aspect of a balanced economy. It can only be achieved by
strengthening of labour union and collective bargaining structures.
7. References
Atkinson, A, Piketty, T, Saez, E, 2011. Top Incomes in the Long Run of History. Journal of Economic Literature 49(1): 3–71
Barba, A, Pivetti, M, 2009. Rising household debt: Its causes and macroeconomic implications—a long-period analysis. Cambridge Journal of Economics 33, 113-37
Becker, J. (2002): Akkumulation, Regulation Territorium. Zur kritischen Rekonstruktion der französischen Regulationstheorie. Marburg: Metropolis Verlag
Beigewum, Attac Österreich 2010. Mythen der Krise: Einsprüche gegen falsche Lehren aus dem großen Crash. Hamburg: VSA Verlag
Bernanke, Ben, 2005. The Global Saving Glut and the U.S. Current Account Deficit. Speech by Ben Bernanke at the Sandridge Lecture, Virginia Association of Economists, Richmond, Virginia http://www.federalreserve.gov/boarddocs/speeches/2005/200503102/
Bibow, J. (2010): Financialization of the U.S. household sector: The “subprime mortgage crisis” in U.S. and global perspective, IMK Studies 3/2010
Borio, C, Disyatat, P. 2011. Global imbalances and the financial crisis: Link or no link? BIS Working Paper 346
Brenke, Karl, 2011. Einkommensumverteilung schwächt privaten Verbrauch. Wochenberichte des DIW Berlin Nr 8/2011, 2-12
19
Brenner, R. (2003): The boom and the bubble. London: Verso
Cynamon, B., Fazzari, S. (2009): Household debt in the consumer age: source of growth – risk of collapse. Capitalism and Society, 3 (2), Art 3 http://www.bepress.com/cas/vol3/iss2/art3/
Eggert, W, Krieger, T, 2009. „Home Ownership“ als Substitut für Sozialpolitik. Zum Entstehen der Finanzkrise in den USA. Wirtschaftsdienst 6/2009, 390-96
Eichengreen, Barry, 2010. Ireland’s reparations burden. [original appeared as Jämmerliches Versagen, Handelsblatt, 1 Dec 2010] http://www.irisheconomy.ie/index.php/2010/12/01/barry-eichengreen-on-the-irish-bailout/ (accessed 21 Jan 2011)
Ertürk, Ismail, Julie Froud, Sukhdev Johal, Adam Leaver, and Karel Williams (eds.) 2008. Financialization At Work. Key Texts and Commentary. London: Routledge
European Commission 2007. The labour income share in the European Union. Chapter 5 of: Employment in Europe, pp. 237-72
Fitoussi, J.-P./Stiglitz, J. E. (2009): The Ways Out of the Crisis and the Building of a More Cohesive World, OFCE Document de travail, 17
Girouard, N, Kennedy M, André, C, (2006) Has the rise in debt made households more vulnerable? OECD Economics Working Paper 535 (ECO/WKP(2006)63)
Glyn, A. (2006). Capitalism unleashed: Finance, Globalization and Welfare. Oxford University Press.
Harrison, A, 2002. Has globalization eroded labor’s share? Some cross-country evidence, Mimeo, UC Berkeley.
Harvey, D. (2005): A Short History of Neoliberalism. Oxford: Oxford University Press
Hein, E. Mundt, M. 2012. Financialisation and the requirements and potentials for wage-led recovery – a review focussing on the G20. Paper written for the project ‘New perspectives on wages and economic growth: the potentials of wage-led growth’.
Hein, E., Vogel, L. (2008): Distribution and growth reconsidered – empirical results for Austria, France, Germany, the Netherlands, the UK and the USA. Cambridge Journal of Economics, 32 (3), 479-511
Horn, G, Sturn, S, van Treeck, T, 2010. Die Debatte um die deutsche Exportorientierung. Wirtschaftsdienst 1/2010, 22-28
Horn, G, van Treeck, T, 2011. Ungleichheit und aussenwirtschaftliche Ungleichgewichte. Eine Keynesiansiche Erklärung. In: Tagungsband zur Tagung der Keynes-Gesellschaft 2010, im Erscheinen
Horn, Gustav A. / Dröge, Katharina / Sturn, Simon / van Treeck, Till / Zwiener, Rudolf (2009) Von der Finanzkrise zur Wirtschaftskrise (III). Die Rolle der Ungleichheit. IMK Report, Nr. 41, September 2009. http://www.boeckler.de/show_product_imk.html?productfile=HBS-004487.xml
Huffschmied, Jörg, 2002. Politische Ökonomie der Finanzmärkte. Aktualisierte und erweiterte Auflage. Hamburg: VSA Verlag
ILO, 2008. World of Work Report 2008. Income inequalities in the age of financial globalization. Geneva: ILO
IMF (2006) The Influence of Credit Derivative and Structured Credit Markets on Financial Stability. Chapter 2 of: Global Financial Stability Report 2006 April
IMF, 2007a. The globalization of labor. Chapter 5 of World Economic Outlook April 2007. Washington: IMF
IMF, 2007b. Globalization and inequality. Chapter 4 of World Economic Outlook, Oct 2007
Jayadev, A, 2007. Capital account openness and the labour share of income. Cambridge Journal of Economics 31, 423-443
Kennickell, Arthur, 2009. Ponds and streams: Wealth and income in the U.S., 1989 to 2007. Federal Reserve Board Finance and Economics Discussion Series 2009-13
Livingston, James, 2009. Their Great Depression and ours. Challenge 52, 3, 34-51
Lysandrou, Photis, 2009. Global Inequality and the Global Financial Crisis: The New Transmission Mechanism. Paper presented at the conference The World Economy in Crisis – The Return of Keynesianism?, Berlin Oct 2009
Lysandrou, Photis, 2011. Global inequality, wealth concentration and the subprime crisis: a Marxian commodity theory analysis. Development and Change 42, 1, 183-208
Maki, D, Palumbo, M, 2001 Disentangling the Wealth Effect: A Cohort Analysis of Household Saving in the 1990s, Board of Governors of the Federal Reserve System, Finance and Economics Discussion Series, 2001-21.
20
Naastepad, R, Storm, S (2006/07), OECD demand regimes (1960-2000), Journal of Post-Keynesian Economics 29 (2): 213-248
OECD 2008. Growing unequal? Income distribution and poverty in OECD countries. Paris: OECD
Onaran, Ö. (2009): Wage share, globalization, and crisis: The case of manufacturing industry in Korea, Mexico, and Turkey, International Review of Applied Economics, 23(2), 113-134
Onaran, Ö., Galanis, G. 2012. Wage-led and profit-led demand: a global mapping. Paper written for the project ‘New perspectives on wages and economic growth: the potentials of wage-led growth’.
Piketty, T, Saez, E, 2003. Income inequality in the United States, 1913-1998. Quarterly Journal of Economics, 118 (1): 1-39
Piketty, T, Saez, E, 2007. Income inequality in the United States, 1913-1998. In: A.B. Atkinson and T. Piketty (eds.): Top Incomes in a Global Perspective, Oxford University Press
Rajan, Raghuram, 2010. Fault Lines. How Hidden Fractures Still Threaten the World Economy. Princeton: Princeton University Press
Reinhart, C, Reinhart, V, 2008. Capital Flow Bonanzas: An Encompassing View of the Past and Present. NBER Working Paper No. W14321
Rodrik, D, 1998. Capital mobility and labor. Manuscript. http://ksghome.harvard.edu/~drodrik/capitalm.pdf
Roubini, N, Mihm, S, 2010. Crisis Economics: A Crash Course in the Future. New York: Penguin
Shaxson, Nicholas, 2011. Treasure Island. Tax havens and the Men Who Stole the World. London: Ransom House
Stein, Ulrike, 2009. Zur Entwicklung der Sparquoten der privaten Haushalte - eine Auswertung von Haushaltsdaten des SOEP. IMK Working Paper 10-2009
Stiglitz, Joseph (2009). Freefall: Free Markets, and the Sinking of the World Economy, New York: Norton & Co
Stockhammer, E (2011). Wage-led growth. An introduction. International Journal of Labour Research 3 (2): 167-188
Stockhammer, E, 2011. Peripheral Europe’s debt and German wages. International Journal for Public Policy 7 (1-3): 83-96
Stockhammer, E, 2012. Financialization, income distribution and the crisis. Investigación Económica forthcoming
Stockhammer, E, Onaran, Ö and Ederer, S. (2009) Functional income distribution and aggregate demand in the Euro area. Cambridge Journal of Economics 33 (1): 139-159
Stockhammer, E, Stehrer, R, 2011.Goodwin or Kalecki in demand? Functional income distribution and aggregate demand in the short run. Review of Radical Political Economics 43(4), 506–522
Stockhammer, E. (2009): Determinants of functional income distribution in OECD countries. IMK Studies, Nr. 5/2009 . Düsseldorf 2009.
Stockhammer, E. 2012. Decline in wage share: causes and prospects. Paper written for the project ‘New perspectives on wages and economic growth: the potentials of wage-led growth’.
Wade, Robert, 2009. The global slump. Deeper causes and harder lessons. Challenge 52, 5, 5-24
Wolff, Edward, 2010. Recent trends in household wealth in the United States: Rising debt and the middle-class squeeze—An Update to 2007. Levy Economics Institute Working Paper 589