This PDF is a selection from a published volume from the National Bureau of Economic Research Volume Title: Means-Tested Transfer Programs in the United States Volume Author/Editor: Robert A. Moffitt, editor Volume Publisher: University of Chicago Press Volume ISBN: 0-226-53356-5 Volume URL: http://www.nber.org/books/moff03-1 Conference Date: May 11-12, 2000 Publication Date: January 2003 Title: The Temporary Assistance for Needy Families Program Author: Robert A. Moffitt URL: http://www.nber.org/chapters/c10258
Transcript
This PDF is a selection from a published volume from theNational Bureau of Economic Research
Volume Title: Means-Tested Transfer Programs in the UnitedStates
Volume Author/Editor: Robert A. Moffitt, editor
Volume Publisher: University of Chicago Press
Volume ISBN: 0-226-53356-5
Volume URL: http://www.nber.org/books/moff03-1
Conference Date: May 11-12, 2000
Publication Date: January 2003
Title: The Temporary Assistance for Needy Families Program
Author: Robert A. Moffitt
URL: http://www.nber.org/chapters/c10258
291
The Temporary Assistance for Needy Families (TANF) program was cre-ated by legislation passed by the U.S. Congress and signed by the presidentin 1996. The Personal Responsibility and Work Reconciliation Act(PRWORA) created the TANF program out of the preexisting Aid to Fam-ilies with Dependent Children (AFDC) program, which itself was createdby Congress in 1935 as part of the Social Security Act. The PRWORA leg-islation represented the most fundamental restructuring of the AFDC pro-gram since its inception. The most important restructured elements are(a) the devolution of major program design elements, and financingthrough block grants, to the individual states; (b) the imposition of strictwork requirements in order to qualify for federal aid; and (c) lifetime lim-its on the number of years of benefit receipt which could be paid out of fed-eral funds.
This paper reviews the rules and structure of the TANF program andcompares them with the historical AFDC program. In addition, it reviewsthe caseloads, costs, and participation rates of the TANF and AFDC pro-grams. Finally, it reviews the research that has been conducted on bothprograms. Given the relative youth of the former, relatively little scholarlyresearch has been conducted on it to date. Consequently, the bulk of the re-search will be reviewed for the AFDC program. Some discussion will alsobe provided of the extent to which the results of the AFDC research can beexpected to apply to the TANF program.
Robert A. Moffitt is professor of economics at Johns Hopkins University and a research as-sociate of the National Bureau of Economic Research.
The author would like to thank Daniel Gubits for research assistance.
5The Temporary Assistance forNeedy Families Program
Robert A. Moffitt
The first section reviews the rules and history of the programs. The sec-ond section reviews the trends in caseloads and expenditures and otherprogram characteristics, followed by a section on the research results. Sec-tion 5.4 reviews research on the TANF program. A final section discussesreforms of the financial incentives in the program.
5.1 History, Rules, and Goals
5.1.1 History and Rules of the AFDC Program
Table 5.1 shows the major pieces of legislation creating and altering theAFDC program over its history, 1935–96.1 The program was created by theSocial Security Act of 1935 along with the Old-Age Social Security andUnemployment Insurance programs. The AFDC program provided cashfinancial support to families with “dependent” children, who are definedas those who were deprived of the support or care of one natural (i.e., bio-logical) parent by reason of death, disability, or absence from the home,and were under the care of the other parent or another relative. Althoughthe language of the legislation was gender-neutral, in practice the vast ma-jority of families of this type consisted of a mother and her children, orwhat are today called single-mother families. Although the presence of thefather was possible if he was the single parent or if he was disabled, the
292 Robert A. Moffitt
Table 5.1 Major Legislation in the AFDC and TANF Programs
Date Title of Legislation Main Provision
1935 Social Security Act Created the AFDC program for low-income children without a parent present in household
1961 Amendments to the Social Created AFDC-UP program for children in two-parent families Security Act where primary earner is unemployed
1967 Amendments to the Social Lowered the benefit reduction rate to two-thirds; created the Security Act WIN program
1981 Omnibus Budget Recon- Increased the benefit reduction rate to 1; imposed a gross ciliation Act of 1981 income limit; counted income of stepparents; expanded
waiver authority1988 Family Support Act of 1988 Created the JOBS program for education, skills training, job
search assistance, and other work activities; created transitional child care and Medicaid programs; mandated AFDC-UP in all states
1996 Personal Responsibility and Abolished the AFDC program and created the TANF programWork Reconciliation Act
1. A short, but more detailed, history of the major developments in the AFDC program canbe found in Garfinkel and McLanahan (1986, chap. 4). That discussion also includes an ac-count of the history of income support programs prior to AFDC.
overwhelming majority of participating families were initially, and havecontinued to be, those in which the father is not present. In 1935 the pri-mary reason for the absence of the father was death, but this was to changein later years as that absence was more a result of divorce or out-of-wedlock childbearing. Eligibility also required that families have incomeand assets below specified levels.
The AFDC program was created as a shared federal and state responsi-bility. The states had a large role in the program, for they were responsiblefor not only creating and administering their own AFDC programs butalso setting the level of basic benefits. States subsequently picked verydifferent benefit levels, with benefits ranging sixfold from the most gener-ous to the least generous. The federal role was both financial and regula-tory. Financially, the federal government was responsible for providingopen-ended matching grants to the states, with declining match rates athigher state benefit levels. On the regulatory side, the federal governmentput many restrictions on the definition of eligibility and allowable re-sources but also on the benefit formula. In terms of eligibility, for example,the federal government defined what family structures were eligible andput restrictions on who could and could not be counted as part of the as-sistance unit, and also on what income and assets could be counted for el-igibility determination. Regarding the benefit formula, the federal govern-ment put restrictions on allowable deductions for earned income and alsofor child care and work-related expenses, effectively constraining the state’sability to set the benefit reduction rate in the program. Thus the statesended up being primarily responsible for the level of benefits, or what econ-omists call the “guarantee,” while the federal government effectively set thebenefit reduction rate, which economists sometimes call simply the “taxrate.” The nominal benefit reduction rate in the program in 1935 was 100percent, for benefits were determined by a straightforward subtraction ofincome from “needs” (i.e., the guarantee), and there were few deductionsfor income allowed.2
The definition of a dependent child as resulting from the absence or dis-ability of a parent implicitly allowed families to be eligible where themother (or father) had remarried or was cohabiting with a partner who
The Temporary Assistance for Needy Families Program 293
2. Additional complexities were present because the states actually had the right to manip-ulate the benefit formula in ways that altered even the tax rate. For example, states could im-pose maximums on the benefit paid to a family, which creates a range of a zero tax rate; theycould reduce the difference between the guarantee and net income (defined as income less de-ductions) by a defined fraction (called the “ratable reduction”), which effectively reduces thetax rate by that fraction; and they could impose gross income ceilings for eligibility, which cre-ate a notch in the budget constraint. They also had discretion in setting allowable deductions,which alters the effective tax rate as well. See U.S. Congress, Committee on Ways and Means(1996), Keane and Moffitt (1998, appendix), and Meyer and Rosenbaum (2001, appendix 1)for more details on the formula in different states. States are allowed even more discretionover the benefit formula under the new TANF program (see subsequent discussion).
was not a parent of the child. Further, stepparents and cohabitors were ex-cluded from the definition of the assistance unit for purposes of eligibilityand benefit determination, so their income was not automatically countedagainst benefits. In principle the income they provided to the eligible chil-dren should be counted as income to the assistance unit, but rigorouslymeasuring intrahousehold income flows is difficult, so the enforcement ofthis principle was minimal. However, in 1935 the rate of remarriage wasfairly low and the rate of cohabitation was even lower, so these issues didnot attract discussion; they did so only later when these types of familiesgrew in the general population and in the AFDC recipient population.
A significant expansion of the program took place in 1961 when Con-gress created the AFDC-UP (for “unemployed parent”) program to in-clude families in which both natural parents were present but where the pri-mary earner was unemployed, with unemployment defined as the inabilityto find work in excess of 100 hours per month. The income and asset eligi-bility conditions and benefit formulas were identical to those in the basicAFDC program. The AFDC-UP program was made optional to the states,with financing at the same rate as in basic AFDC, and twenty-five stateshad created and operated such programs by the end of the decade.
The next major change in the program occurred in 1967 when Congress,concerned with work incentives in the program, lowered the nominal taxrate on earnings from 100 percent to 67 percent (by two-thirds, to be ex-act). States were required to deduct $30 and one-third of remainingmonthly earnings from total monthly income before calculating the bene-fit (hence the “thirty-and-one-third” rule). The Social Security Amend-ments in 1967 also created a program called the Work Incentive (WIN)Program, which required women whose youngest child was older than sixand who did not fall into a number of exempt categories (disabled, inschool, etc.) to register for some type of work or education activity, usuallysome type of job placement program. The WIN program was never effec-tive, for, while the majority of nonexempt recipients were registered, statesdid not provide the funds or exert the effort to set up the necessary activi-ties to engage more than a small number of registrants. Although therewere almost no evaluation studies of WIN conducted (see below), therewas nevertheless a widespread perception that the job placement opera-tions in place were also quite ineffective.3
A number of Supreme Court decisions in the late 1960s and early 1970swere also important in modifying key features of the program. One out-lawed what were called state “man-in-the-house” rules, rules which madeineligible for benefits mothers who were living, even on a temporary basis,with men who were not the natural fathers of the children. The court
294 Robert A. Moffitt
3. See Lalonde (chap. 8 in this volume) for a more detailed discussion of the WIN programand its evolution.
judged these laws to violate the original Social Security Act provision stip-ulating that eligibility was based solely on the absence of the natural father.A second, related decision prohibited states from counting the income ofany such cohabiting men against the AFDC benefit without specific evi-dence that the men were providing income support to the woman and chil-dren; some states had been automatically including the male’s incomewhen calculating benefits. A third decision outlawed so-called residencyrequirements that some states had adopted, which required families whohad moved into a state to live there for a few years before eligibility couldbe established. The court judged these laws to violate the equal protectionclause of the Constitution and to impose an unlawful restriction on free-dom of residential location.
The growth of the Food Stamp and Medicaid programs in the late 1960sand early 1970s also affected the AFDC program. Eligibility for the FoodStamp Program, although open to all individuals regardless of family type,was made automatic for AFDC recipients. Thus a close tie between theprograms was established, and participation in the AFDC program con-stituted a guaranteed entry to the Food Stamp Program. Families in theAFDC program were also made categorically eligible for the Medicaidprogram, significantly raising the generosity of program benefits. Unlikethe case of food stamps, however, non-AFDC recipients faced more diffi-cult eligibility hurdles for Medicaid and were often ineligible until the1980s (see the chapter on Medicaid in this volume). A third program ofsome importance that grew more in the 1980s is the Earned Income TaxCredit, whose amounts were required by Congress to be excluded fromAFDC recipient income for the purpose of benefit calculation in order toencourage work.4
Throughout the 1970s a number of welfare reform proposals were con-sidered by the federal executive branch but were either never proposed toCongress or were proposed and not passed. The Nixon administration pro-posed, with its Family Assistance Program, replacing AFDC with a pro-gram more resembling a negative income tax—with a low marginal taxrate—and which would have federalized the program and hence removedit from the control of the states, a reform much discussed in the 1970s in anattempt to eliminate the large cross-state variation in benefits. The legisla-tion did not pass Congress. The Ford administration considered a welfarereform proposal with a number of features but, most notably, a consider-able strengthening in the work requirements of the program. The programwas never submitted to Congress. The Carter administration submitted toCongress a major welfare reform proposal which, like the Family Assis-
The Temporary Assistance for Needy Families Program 295
4. Food stamp benefits were also excluded from the AFDC benefit calculation, as werehousing subsidies in most states. Supplemental Security Income benefits were excluded, butSSI recipients were not allowed to be covered by AFDC anyway (i.e., they were excluded fromthe AFDC assistance unit).
tance Program, would have federalized the program but which introduced,for the first time, significant added work requirements. The legislation wasnot passed by Congress.
The next major piece of legislation passed by Congress was the OmnibusBudget Reconciliation Act of 1981, which had several important features.The tax rate on earnings in the program was increased to 100 percent, upfrom the 67 percent provided for in the 1967 amendments, on the argumentthat this would concentrate benefits on the lowest income families andhence those most in need.5 In addition, for the first time Congress requiredstates to count a portion of stepparent income against the grant regardlessof the amount of financial support that the stepparent might be deter-mined, by some calculation, to have provided to the mother and her chil-dren. Congress also put an upper limit on the gross income that a familycould have to be eligible, thus eliminating the possibility that high levels ofdeductions could allow such families onto the rolls. A fourth importantfeature of the legislation, little noticed at the time but which became im-portant later, was a provision encouraging states to experiment with newAFDC work provisions that were at variance with federal law and federalregulations, and to seek waivers to test alternative provisions that theymight be interested in. The “WIN demonstrations” of the 1980s, as theywere called because they were modifications of WIN, allowed states to ex-periment with community work programs, work supplementation pro-grams, heightened job search, and other programs to strengthen the em-phasis on work and improve upon their WIN programs.
Subsequent to 1981 and throughout the early and mid-1980s, states be-gan taking advantage of the waiver provisions in the 1981 Act and, even-tually, virtually all states conducted WIN demonstrations. These demon-strations typically tested low-cost programs that required some type of jobsearch activity, although some also required recipients to simply work—usually in some community service job like cleaning up a public park—inexchange for their benefits (“workfare”). A few states were more ambitiousand tested more expansive employment programs that attempted to pro-vide more basic skills training or substantive work experience. Many of thedemonstrations also narrowed the list of conditions allowing a recipient tobe exempt from participating in these programs. The 1980s thus witnessedthe beginning of significant AFDC reform activity initiated at the state andlocal levels, a new trend in light of the history of reform activity, which hadtheretofore occurred primarily at the federal level.
The state activity on increased work requirements led to increased con-gressional interest in work and culminated in the passage of the 1988 Fam-
296 Robert A. Moffitt
5. The recipient was allowed to work for four months with the thirty-and-one-third reduc-tion rule, but further earnings were taxed at the 100 percent rate. Later, the flat $30 exemptionamount was allowed for twelve months.
ily Support Act, whose most important feature was the creation of theJob Opportunities (JOBS) program. The JOBS program replaced WINand was to require much larger numbers of welfare recipients to engage inwork-related activities, both by reducing the number of exempt recipientsand by mandating that states engage a minimum fraction of eligible recip-ients in some type of acceptable activity (called “participation” require-ments). In addition, and equally important, the legislation strongly en-couraged, and partly required, states to conduct not only low-cost jobsearch programs that had been dominant in the WIN demonstrations butalso some human capital, education, and training programs that would in-crease job skills of AFDC recipients, a major change in orientation.6
However, over the years subsequent to 1988, states failed to implementJOBS programs to any significant degree. They failed to draw down all thefederal matching funds made available to them to subsidize the programs,and they did not put in place the necessary programs to enroll eligibles ona wide scale. As a result, many states never achieved the participation re-quirements in the act. The most common explanation for this failure wasthe onset of a recession in the late 1980s, which put pressure on state bud-gets and made it difficult to allocate funds to JOBS, but the administrativedifficulty in creating JOBS programs was gradually realized to have beenunderestimated, and this also played a role. It was also gradually realizedthat full implementation of the JOBS program would require a significantincrease of expenditures and hence was unlikely in the short run to gener-ate cost savings.7
In an attempt to provide more financial work incentives, the Family Sup-port Act also required states to offer transitional child care and Medicaidbenefits, benefits provided to families who had left the welfare rolls becauseof employment or increased earnings, for up to twelve months followingexit. States were allowed to require copayments for child care and were re-quired to charge premiums for the second six months of Medicaid benefits.In practice, these provisions were little used by exiting welfare mothers, forreasons that have never been fully studied. Some experts speculated thatthe paperwork burden of continuing to establish eligibility combined withthe relatively short time frame of extended benefits (twelve months), to-gether with the copayment and premium provisions, discouraged take-up.
Finally, the Family Support Act expanded AFDC-UP, mandating thatall states offer the program. However, the law only required states to offerbenefits to unemployed families for six months out of the year, and manystates initially without UP programs elected to meet only this minimum re-quirement when creating their program subsequent to the act.
The Temporary Assistance for Needy Families Program 297
6. See U.S. Congress, Committee on Ways and Means (1994) for a discussion of the JOBSprogram rules and see Gueron and Pauly (1991) for a discussion of the shift in employmentphilosophy that JOBS represented.
7. See the chapter by LaLonde in this volume for a more detailed discussion of JOBS.
Although the Family Support Act of 1988 was considered at the time tobe landmark legislation that would lead to fundamental changes in theprogram, its failure to do so has left it as a fairly minor and transitionalpiece of legislation in the history of the AFDC program. Interest in furtherreforms of the system did not die down after the act but instead increasedin intensity. For example, the goals of reform started shifting almost im-mediately from the human capital, education, and training emphasis em-bodied in the act to an emphasis on work per se, regardless of trainingcontent. Another notable shift subsequent to the act was a shift towardcaseload reduction per se as a goal, which had not been a major focus ofthe act. In part this change may have been a result of the rising caseloadsand expenditures in AFDC over the late 1980s and early 1990s (see below).Finally, an increased interest in family structure issues and nonmaritalchildbearing occurred in the period subsequent to the act.
This increased welfare reform activity took place, as it had in the 1980s,mainly at the state level. With encouragement from the Bush and Clintonadministrations, states over the early 1990s increased their initiation ofAFDC waiver programs testing alternative features of reform. An in-creased emphasis on work requirements, in particular to the exclusion ofhuman capital and education programs as just noted, was present in al-most all state efforts. Most states also began imposing sanctions (i.e., tem-porary or permanent withdrawal of benefits) on recipients for failure tocomply with work and other requirements. Although such sanctions hadbeen present in some form previously, they had never been as aggressivelyenforced. The increased emphasis on work requirements was often ac-companied in the waiver programs as well by a reduction of marginal taxrates on earnings to provide financial incentives to work, for the federalrules still required 100 percent rates. Many other features also began to beintroduced, including (a) the provision of time limits on benefits, stipulat-ing that recipients could not receive benefits for more than a certain num-ber of years (two to five, for example), at least within a given calendarperiod; (b) the imposition of family caps, which specified that AFDCrecipients would not receive higher benefits if they had additional childrenwhile on AFDC; and (c) an attempt to reintroduce residency requirementsby formulating two-tier programs under which immigrants were not deniedbenefits but rather were given lower benefits than initial residents for somespecified period.
Another new feature of the state waiver programs in this period was anincreased tendency to test programs that contained multiple reform fea-tures simultaneously, for example, simultaneously strengthening work re-quirements, enforcing sanctions, imposing time limits and family caps, andthe like. Prior to this period, the waiver programs formulated by states hadtested only one or two reform features at one time. These reform packageswere intended to test new programs that differed in their entirety from the
298 Robert A. Moffitt
AFDC program and were intended to have a cumulative impact greaterthan the sum of the impact of each reform individually. More generally,they represented a political desire for a major, wholesale change in theAFDC program rather than incremental change.8
A final new feature of the waiver programs over this period was an in-creased tendency to test the new programs on the entire state AFDC case-load, whereas prior to this period the waiver programs had been tested onthe caseload in only one or two counties, cities, or local offices. Thesestatewide waivers had the effect of essentially replacing the existing AFDCprogram with the reform program for the entire state, at least for the life-time of the waiver, which was usually several years. As waivers of this typegrew in number—forty states had requested and been granted waivers by1995—the waivers gradually ceased to be small-scale experiments and be-gan to envelope a major portion of the national caseload and hence togradually eliminate the AFDC program de facto.9
5.1.2 TANF
Congress subsequently took action in 1996 by enacting PRWORA,which simultaneously reduced federal authority over the program but alsomandated many (but not all) of the popular state-level waiver features withfederal law. Table 5.2 summarizes the differences between AFDC andTANF. The PRWORA legislation converted the previous matching grantto a block grant and removed much of the federal regulatory authority overthe design of the program. Thus states are free to set their benefit levels, asbefore, but also the tax rate, income limits, asset requirements, and even theform of assistance (cash or in-kind services). The last provision is impor-tant because it allows states to use TANF dollars to support child care, jobsearch support, social services, and other types of expenditure; there areno requirements on how much or little must be spent on cash aid directly.In addition, no federal definition of who is to be included in the assistanceunit is imposed; the AFDC-UP program is abolished, and states cover two-parent families at their own discretion. States are free to impose familycaps. In addition, and importantly, the entitlement nature of the programis abolished and states are not required to serve all eligibles.
At the same time, however, the law imposed new federal authority in a
The Temporary Assistance for Needy Families Program 299
8. See U.S. Department of Health and Human Services (DHHS; 1997) and Harvey, Ca-masso, and Jagannathan (2000) for a summary of the provisions of the state waiver programsin this period.
9. The federal government generally required states to conduct random-assignment evalu-ations of their reforms. When states moved to implementing reform programs on the full statecaseload, they usually complied with this requirement by holding out a small group of con-trol families to be administered the old AFDC program. A major problem with these experi-ments was that it was difficult to prevent the control families from perceiving, and beingaffected by, the overall programmatic change in the state that occurred around them. See sub-sequent discussion.
Table 5.2 Comparison of the AFDC and TANF Programs
Item AFDC TANF
Financing Matching grant Block grant
Eligibility Children deprived of support of one Children in low-income families as parent or children in low-income two- designated by state; AFDC-UP abol-parent families (AFDC-UP) ished; minor mothers must live with
parents; minor mothers must also at-tend school
Immigrants Illegal aliens ineligible Aliens ineligible for five years after en-try and longer at state option
Form of aid Almost exclusively cash payment States free to use funds for services andnon-cash benefits
Benefit levels At state option Same
Entitlement status Federal government required to pay No individual entitlementmatched share of all recipients
Income limits Family income cannot exceed gross No provisionincome limits
Asset limits Federal limits No provision
Treatment of After four months of work, only a No provisionearnings disregards lump sum $90 deduction plus child
care expenses, and nothing after twelve months
Time limits None Federal funds cannot be used for pay-ments to adults for more than sixtymonths lifetime (20 percent of caseloadexempt)
JOBS program States must offer a program that JOBS program abolishedmeets federal law
Work requirements Parents without a child under three Exemptions from work requirements required to participate in JOBS are narrowed and types of qualified
activities are narrowed and prespeci-fied (generally excludes education and classroom training) and must be twenty hours per week rising to thirty hours per week for single mothers
Work requirement JOBS participation requirements Participation for work requirements participation rise to 50 percent by fiscal year 2002requirements
Child care Guaranteed for all JOBS participants No guarantee, but states are given in-creased child care funds
Sanctions General provisions Specific provisions mandating sanc-tions for failure to comply with workrequirements, child support enforce-ment, schooling attendance, and otheractivities
Child support States required to allow first $50 of No provisionchild support received by mother to not reduce benefit
Source: Burke (1996).
few specified areas. Federal funds are not to be used to pay adults for morethan sixty months of TANF benefits over their lifetimes, although statesare allowed an exemption from this requirement for 20 percent of theircaseloads. Minors who have dependent children are required to stay inschool and live with their parents in order to receive federal TANF dollars.Aliens are ineligible for five years after their entry into the United Statesand longer at state option. In addition, while the JOBS program is abol-ished, new work requirements are imposed that require that much greaterfractions of the caseload be involved in them, and which exempt manyfewer families (as many as 50 percent of single mother recipients and 90percent of two-parent families must comply). Recipients involved in gen-eral education and training cannot be counted toward these participationrequirements. The hours of work per week required are also greatly in-creased (up to thirty hours per week for single mothers and more for two-parent families).10
The most dramatic departures from the AFDC program are the timelimit and work requirement provisions. Lifetime time limits are a new con-cept in U.S. transfer programs and are based on a quite different philoso-phy of the aims of public assistance than has been the case heretofore.States are allowed certain types of exemptions from the time limits and arealso allowed to grant temporary extensions to individual families, so longas the total number does not exceed 20 percent of the caseload. The workrequirements in the new legislation are much stronger than in previous lawand change the orientation from education and training to work per se.The law also allows states to impose sanctions on recipients for failure tocomply with the work requirements, sanctions that are much stronger thanin past law and which have been enforced rigorously. The work emphasisof the law is further reinforced by an increase in the funds made availablefor child care.11 At the same time, any system of work requirements mustspecify some exemptions from them, and states are allowed to exempt fam-ilies with specified types of difficulties.
Several other PRWORA provisions are worth noting for their impor-tance. States are required to maintain expenditures from their own fundsat a level at least 75 percent of that prior to PRWORA (the so-called
The Temporary Assistance for Needy Families Program 301
10. The law imposed specific penalties on the states for not complying with these mandatedprovisions. These penalties took the form of percentage reductions in the block grant alloca-tion for each type of violation. The work participation requirements have been considerablyameliorated thus far by another provision of the law that reduces those requirements in pro-portion to the amount of caseload reduction a state experiences. Because caseloads havefallen dramatically, these participation requirements have been greatly reduced as well. How-ever, this provision of the law also gives states an incentive to reduce the caseload because itlowers the level of mandated work requirements.
11. However, the guarantee of child care that existed under AFDC is abolished. That guar-antee was widely seen by states as a constraint on their ability to increase employment amongrecipients.
“maintenance of effort” provisions). This maintains a semblance of amatching grant system in the short to medium run. A major point of dis-cussion between the federal government and the states has been overwhether these funds can only be spent on recipients eligible for TANF dol-lars or can be more generally spent and, if the latter, whether there are anycategories of expenditure that funds cannot be spent on. Regulations is-sued in the spring of 1999 by the U.S. Department of Health and HumanServices (DHHS) interpret the law fairly broadly and allow the funds to bespent on a wide variety of sources, giving states considerable flexibility asa result. Another important financing provision was the creation of a con-tingency fund for the states to draw on in times of high unemployment. Thestrong performance of the U.S. economy since 1996 has made this contin-gency fund of little relevance thus far, but it could be important in the fu-ture if the economy turns down. Another provision in PRWORA providesfor bonuses to the five states who most reduce their out-of-wedlock child-bearing rates and their abortion rates.
Since the 1996 act, states have moved forward vigorously to designTANF programs that are very different from their AFDC programs priorto 1990, not only to comply with the provisions of the law but also to alterprogram features that go beyond the minimum required. A good exampleis the important case of time limits. Table 5.3 shows the limits adopted bythe states in the first year after TANF. Only a slight majority of the states—twenty-seven—have adopted the simple PRWORA standard of a sixty-month lifetime time limit. The rest of the states have adopted some othertype of plan and, in fact, most of these states have adopted time limits that
302 Robert A. Moffitt
Table 5.3 State Time Limits, August 1998
States Time Limits
27 states 60 months8 states Intermittent (e.g., 24 out of 60 months); lifetime of 60 months8 states Less than 60 months lifetimeArizona, Indiana 24 out of 60 months, lifetime of 60 for adults only; 60 months lifetimeCalifornia For applicants: 18 months but can be extended to 24 months if extension will
lead to employment or 60 months if no job available and adults participate incommunity service. For recipients: 24 months but can be extended to 60 monthsif no job available and adults participate in community service
Illinois No limit if family has earned income and works 20 hours per week; 24 monthsfor families with no child under age 13 and no earnings; 60 months for all otherfamilies
Iowa Individualized; lifetime of 60 monthsMassachusetts 24 out of 60 months; no lifetime limitMichigan No time limit; will use state funds after 60 monthsTexas 12, 24 and 36 months lifetime for adults only; time period depends on employ-
ability of head of household
Source: U.S. DHHS (1998).
are stricter than those required by PRWORA, sometimes dramatically so.12
For example, eight states impose not only a lifetime limit but also a shorterlimit over fixed calendar intervals (e.g., no more than twenty-four monthsof receipt in every sixty months of calendar time). Eight other states simplyimpose a shorter lifetime limit than sixty months; the shortest of these isConnecticut, at twenty-one months, a very stringent limit. However, Ari-zona illustrates a variation that many states have considered—a lifetimelimit only for adults, so that children can continue to receive benefits be-yond sixty months (paid for out of state funds). Six other states besidesArizona have adopted these “reduction” rather than “termination” poli-cies, which constitute a relaxing of the time limits implicit in PRWORA(Gallagher et al. 1998, table 6).13 The other six states in the table have morecomplex provisions that introduce new criteria into the time limit imposedand hence open the door to individual-specific considerations related toneed and job availability.
The states have also embraced work requirements and sanctions vigor-ously. The most notable movement has been toward a “work first” ap-proach in which recipients and new applicants for benefits are moved asquickly as possible into work of any kind, with a deemphasis on educationand training. States have imposed strong sanctions for failure to complywith these requirements, usually beginning with an initial partial sanctionat first noncompliance and then graduating to a more severe, full sanctionat subsequent noncompliance. Seven states have imposed a lifetime ban oneligibility if an adult receives a certain number of sanctions; in Georgia, forexample, two sanctions will trigger this prohibition. Many states have alsolowered the age of the youngest child that furnishes exemption from the re-quirement to one year or six months and have otherwise tightened up onexemptions from the regulations (Gallagher et al. 1998). The work re-quirements have also been strengthened by frequent requirements for jobsearch and work registration at the point of application for TANF benefitsthat must be complied with before benefit receipt can begin.
With the aim of reinforcing these work requirements, states have gener-ally lowered their tax rates. Table 5.4 shows state-by-state changes as of Oc-tober 1997. Although ten states have kept the AFDC disregards (i.e., nodisregards beyond $90 after twelve months of benefit receipt), the rest ofthe states have lowered their tax rates considerably. Many states have a taxrate of 50 percent, while there is a distribution above and below this valueas well. A few states have 100 percent disregards, implying a tax rate of
The Temporary Assistance for Needy Families Program 303
12. However, the large states in the United States—who have a disproportionate share ofthe caseload—do not have time limits below sixty months (and Michigan has none at all).
13. It is worth noting at this point that the PRWORA legislation imposes the limit only ona family in which there is an adult caretaker who has been on welfare for sixty months, re-gardless of how long the children have been supported. In principle, children could be put un-der the care of a different relative and be eligible for another sixty months of benefits.
304 Robert A. Moffitt
Table 5.4 Monthly Earnings Disregards in TANF as of October 1997
zero; these states limit benefits by imposing income limits of one form oranother on eligibility (at which point the tax rate is effectively greater than100 percent).
States have altered some of the other financial aspects of eligibility andthe benefit formula but not all.14 Asset limits have generally been raised, ashave gross income limits, but benefit levels themselves have for the mostpart been left the same as they were prior to PRWORA (Gallagher et al.1998). The 100-hour rule limiting work in two-parent families has beendropped in the majority of states, although work requirements are now im-posed on both parents in such families. Family caps have been adopted intwenty-two states, and one state (Wisconsin) has adopted a flat benefit thatdoes not vary at all with family size. There has been significant reductionin the use of the child support pass-through (the requirement that the wel-fare recipient receive the first $50 of child support payment from the fa-ther). Finally, the majority of states have adopted some type of “diversion”program which seeks to divert families who have applied for TANF fromcoming onto the rolls. One type provides a family with a lump-sum cashpayment together with a stipulation that they cannot reapply for a fixednumber of months. Another provides families with child care, medical, ortransportation services to assist them in cases where they are judged to beonly temporarily needy. A third, common, program requires recipients toengage in a specified period of job search, sometimes merely by registeringwith a work agency but often requiring that the applicant show evidence ofhaving applied for jobs or having contacted employers. The individual can-not be considered for assistance until the requirement is met.
The Temporary Assistance for Needy Families Program 305
Table 5.4 (continued)
West Virginia 0 40 on average (varies)Wisconsin 0 0Wyoming $200–400 0
Source: Gallagher et al. (1998, table 14)Notes: In cases where the disregards change with the length of the spell, those for the longestspell are shown. AFDC = $90 flat disregard and zero percent of remainder after twelvemonths.aDisregard is 100 percent as long as earnings are below poverty line; benefit goes to zeroabove.bDisregard is $90 or 20 percent, whichever is greater.cThere is an additional disregard that varies with earnings and family size.dDisregard is 100 percent as long as net income is below poverty line; disregard is 0 if net in-come is above poverty line but earnings are below poverty line; and benefits go to zero if earn-ings are above poverty line.
14. Details on state-specific benefit formulas can be found in the Welfare Rules Databaseof the Urban Institute (http://anfdata.urban.org/wrd).
5.1.3 Goals of AFDC and TANF
The AFDC and TANF rules implicitly reveal many of the goals of theprograms as they have changed over time. Originally the AFDC programwas intended only to provide cash support for widows and their children,at a time when married women were commonly expected not to work andto stay at home to raise their children. Over time, as the general labor forceparticipation rate of women with children rose, and as the composition ofthe caseload shifted toward divorced and unmarried mothers, the goals ofthe program gradually shifted as well, toward encouraging and requiringwork to accompany the cash benefit. This shift took a major additionalstep with the state-level welfare reform efforts in the early 1990s and withthe 1996 passage of PRWORA, whereby the goals of the program weremoved toward the employment goal much more strongly than had been thecase in the past.
Another significant shift in goals in the 1990s has been the shift from aneducation-training strategy toward a pure work strategy. There has been atension between these two strategies ever since the employment goal beganto enter into programmatic discussions in the late 1960s. The education-training strategy, or what was sometimes called the human capital strategy,aimed to improve recipient skills and potential wage rates in the labor mar-ket, whereas the pure work strategy emphasized instead work per se, evenif the education or training content was not high. The education-trainingstrategy is more expensive and has an uncertain rate of return but holds thepromise of long-run improvement, whereas the pure work strategy is rela-tively inexpensive and promotes employment directly but may do less forlong-run earnings capacity. The education-training, or human capital,strategy was most forcefully embodied in the Family Support Act of 1988,but the 1996 PRWORA strongly reoriented the strategy toward a purework goal.
But the PRWORA legislation represented more than simply a redirec-tion of the employment goal and an increased emphasis on work. A newgoal appeared, which was to reduce “dependency,” a term much used inpublic discussions, which is more or less defined as long-term receipt ofwelfare benefits. Such dependency is presumed by the PRWORA legisla-tion to have deleterious effects on adults and children, a hypothesis uponwhich research has a bearing. The time limits embodied in PRWORA areintended to reduce dependency directly by simply disallowing long-termreceipt, thereby providing only temporary assistance to families. There isalso an implicit hypothesis in the notion of a time limit by which welfare re-cipients are capable of becoming “self-sufficient” off the rolls, where “self-sufficiency” is meant as the attainment of a reasonable and sustainablelevel of income that is enough to allow a family not to have to apply forpublic support. The time limit provisions implicitly presume that it is pos-
306 Robert A. Moffitt
sible to become self-sufficient after five years or less of welfare receipt, an-other hypothesis that is in principle possible to test.
Another new goal of welfare programs in the 1990s has been to reducethe rate of nonmarital childbearing and to encourage marriage. This goalis explicitly stated in the preamble to the PRWORA legislation, but the lawitself has very few provisions directly relating to it.15 In part this is becauseit is presumed that reductions in dependency will lead to reductions in suchchildbearing and an increase in marriage, another hypothesis that can besubjected to test. The lack of direct provisions in PRWORA on childbear-ing and marriage is also partly the result of a lack of confidence by Con-gress in the efficacy of any specific set of programs directly aimed at thoseoutcomes.
5.2 Caseloads, Expenditures, Participation, and Recipient Characteristics
5.2.1 Expenditure, Caseload, and Benefit Trends
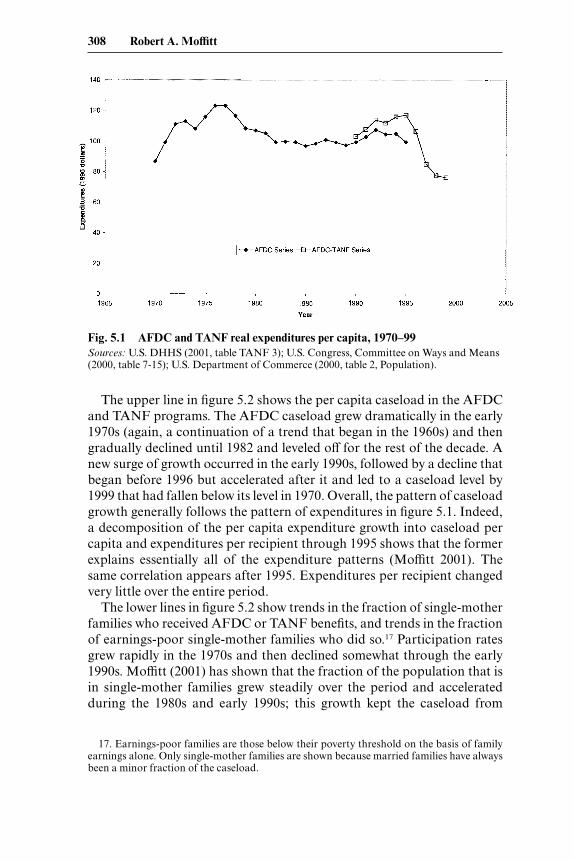
The AFDC program experienced uneven growth of expenditures andcaseloads over its lifetime. Whereas program growth was essentially com-parable to population growth from 1935 through the late 1950s, expendi-tures and caseloads began to pick up in the 1960s. Figure 5.1 shows thegrowth of real per capita expenditures in the AFDC program from 1970 to1995.16 A notable increase in AFDC expenditures occurred in the early1970s (a continuation of an upward trend that began in the late 1960s) andran through about 1977, a period known as the “welfare explosion.” Ex-penditures subsequently declined in real terms, until the early 1990s, whenthey underwent another period of growth, albeit much smaller in magni-tude than that in the 1970s. This period of growth was not sufficient tooffset the long-period decline, however, and by 1995 per capita expendi-tures on the AFDC program were at about the same level they were in 1972.
The second line in figure 5.1 shows per capita expenditure trends in theTANF program and for a reconstructed set of expenditures for the AFDCprogram to restore some measure of comparability. The TANF program’sexpenditures cover many types of activities (e.g., jobs programs and emer-gency assistance) that were not included in official AFDC expenditures. Asthe line shows, expenditures including these additional programs wereslightly higher than official AFDC expenditures but have fallen rapidly inthe TANF program. This decline is largely a result of the decline in thecaseload, as discussed next.
The Temporary Assistance for Needy Families Program 307
15. Of the four principal goals of the PRWORA legislation given in its preamble, only onerelates solely to assisting the poor; the other three relate to increasing marriage and employ-ment and to reducing nonmarital childbearing.
16. This figure and all subsequent ones use the Personal Consumption Expenditure defla-tor (base 1996) for conversion to real amounts.
The upper line in figure 5.2 shows the per capita caseload in the AFDCand TANF programs. The AFDC caseload grew dramatically in the early1970s (again, a continuation of a trend that began in the 1960s) and thengradually declined until 1982 and leveled off for the rest of the decade. Anew surge of growth occurred in the early 1990s, followed by a decline thatbegan before 1996 but accelerated after it and led to a caseload level by1999 that had fallen below its level in 1970. Overall, the pattern of caseloadgrowth generally follows the pattern of expenditures in figure 5.1. Indeed,a decomposition of the per capita expenditure growth into caseload percapita and expenditures per recipient through 1995 shows that the formerexplains essentially all of the expenditure patterns (Moffitt 2001). Thesame correlation appears after 1995. Expenditures per recipient changedvery little over the entire period.
The lower lines in figure 5.2 show trends in the fraction of single-motherfamilies who received AFDC or TANF benefits, and trends in the fractionof earnings-poor single-mother families who did so.17 Participation ratesgrew rapidly in the 1970s and then declined somewhat through the early1990s. Moffitt (2001) has shown that the fraction of the population that isin single-mother families grew steadily over the period and acceleratedduring the 1980s and early 1990s; this growth kept the caseload from
308 Robert A. Moffitt
Fig. 5.1 AFDC and TANF real expenditures per capita, 1970–99Sources: U.S. DHHS (2001, table TANF 3); U.S. Congress, Committee on Ways and Means(2000, table 7-15); U.S. Department of Commerce (2000, table 2, Population).
17. Earnings-poor families are those below their poverty threshold on the basis of familyearnings alone. Only single-mother families are shown because married families have alwaysbeen a minor fraction of the caseload.
The Temporary Assistance for Needy Families Program 309
Fig. 5.2 AFDC and TANF caseload per capita and participation rates per capita,1970–99Sources: U.S. DHHS (2001, table TANF 1); U.S. Department of Commerce (2000, table 2,Population); author tabulations from the Current Population Survey.
falling even more than it did from the decline in participation rates of singlemothers alone. Indeed, the spike in the caseload in the early 1990s is not re-flected in participation rates and is instead a result of the continued growthof single-mother families. Starting around 1994, participation rates de-clined drastically along with the caseload. The caseload decline was en-tirely the result of the drop in participation, for, at least through 1999, therewas no dropoff in the number of single mother families (U.S. DHHS 2001,pp. III–50).18
Figure 5.3 shows trends in real welfare benefits for a family of four overthe 1970–98 period.19 The lower line in the figure shows trends for AFDC-TANF, while the upper two lines show figures for the combined sum ofAFDC-TANF, food stamps, and Medicaid. The higher of the two latterlines shows the straight sum of the three, and the lower of the two discountsthe Medicaid benefit by an estimate of its cash-equivalent value and alsotakes into account the taxation of AFDC-TANF income by the FoodStamp Program.
The figure shows that AFDC-TANF benefits by themselves have de-clined secularly since 1970, and hence cannot provide an explanation for
18. The decline in participation was not a result of increases in income that made moresingle mothers ineligible. The decline in the participation rate of poor single mothers in figure5.2 suggests this, but when income eligibility is more precisely determined, the data show a de-cline in the participation rate of income-eligible families as well (U.S. DHHS 2001, pp. II–21).
19. The figures show the maximum amount paid for a family with no other income, or whateconomists commonly call the guarantee.
any of the positive or negative fluctuations in the caseload or in participa-tion rates conditional on single motherhood shown in figure 5.2. Mechan-ically, the decline in benefits results from a failure of states to raise nomi-nal benefit levels to keep up with inflation. There has been very little changein this trend during the TANF program, although the benefit decline hasslightly leveled off.
Nevertheless, it is important to note that food stamps and Medicaidwere not received by many families in the late 1960s and came into theirown only in the early 1970s, when they rapidly expanded around the coun-try. Recipients of AFDC were automatically eligible for benefits from bothprograms (as TANF recipients continue to be). Consequently, a propercomparison of the change in benefits received by AFDC recipients is moreclosely approximated by comparing the AFDC benefit alone in 1970 to thecombined benefit in 1975 and after. By that comparison, there was a stronggrowth of benefits in the early 1970s, thus providing a possible explanationfor the growth in the caseload and in participation rates over that period.Moreover, the decline in the combined benefit subsequently has been en-tirely the result of the decline in AFDC benefits, for food stamp benefitshave remained relatively constant in real terms and real Medicaid benefitshave grown slightly. On net, by 1998, the combined benefit was still higherthan the AFDC benefit alone in 1970.
The AFDC-TANF benefit decline after 1996 is also somewhat mislead-ing because of the increase in the fraction of TANF expenditures spent onnoncash services. Figure 5.4 shows the distribution of 1999 TANF expen-ditures by spending category and shows that only 59 percent of monies
310 Robert A. Moffitt
Fig. 5.3 Real monthly AFDC-TANF, food stamp, and Medicaid benefits, 1970–98Source: Welfare benefits data file, [http://www.econ.jhu.edu/People/Moffitt/DataSets.html].
The Temporary Assistance for Needy Families Program 311
Fig. 5.4 TANF expenditures by spending category, FY 1999Source: U.S. DHHS (2000, chart 2.4).
were expended on cash aid. The rest was spent on work activities, childcare, administration, and a number of other categories (including socialservices). Indeed, when the post-TANF expenditures in figure 5.1 are di-vided by the number of cash recipients shown in figure 5.2, it can easily beseen that expenditures per recipient have actually increased after 1996,rather than fallen. In large part this is simply because the caseload has de-clined so drastically that states have used their block grant monies forother, noncash categories.20
5.2.2 Recipient Characteristics
Table 5.5 shows the trends in a few characteristics of the AFDC andTANF caseload 1969 to 1999. The percent of the caseload with earningswas only 13 percent in 1979 but dropped further in the 1980s, largely be-cause of 1981 federal legislation that increased the tax rate on earnings to100 percent (see table 5.1), effectively making many working families for-merly on AFDC ineligible for benefits. The percent with earnings is a muchhigher 25 percent by 1999, a reflection of the emphasis of current welfarereform on work.
The age of recipients appears to be slightly increasing and family size isdeclining, although most of this decline occurred in the 1970s. The fraction
20. There are unfortunately no concrete data on how many of the recipients of the noncashexpenditures are AFDC-TANF recipients and how many are either former recipients—namely, those who have left the welfare rolls—or even poor families who have never been onAFDC-TANF. This makes the expenditure per recipient calculation potentially misleading,for the monies are now spread over a large population. Along with the decline in expenditureshas probably been a redistribution within the poor population.
whose youngest child is less than two has also decline in the 1990s, eitherbecause of a general decline in the population of families with children inthis age range or because mothers with very young children have left thewelfare rolls. Another important trend has been an enormous increase inthe 1990s in the fraction of the caseload composed of child-only cases.These are cases in which benefits are received by children but the parent, orother adult caretaker, is herself ineligible for benefits. Such ineligibility canoccur if the parent is a noncitizen immigrant but the children are citizens;if the children are cared for by a nonparent with income above the TANFeligibility level; or if the parent has been sanctioned for violating one ofmany TANF rules (including those for work requirements) or has reacheda TANF time limit and has gone off the rolls. The last category occurs onlyin those states with partial sanctions—that is, in the case of a violation onlythe portion of the benefit designated for the adult is terminated—and inthose states where the time limit is applied only to the adult, not to the chil-dren. In child-only families, none of the work requirements or time limitsaffect benefits or eligibility because they are assessed only on adults.
The last row of the table shows trends in the fraction of the caseloadwithout a high school education. This fraction declined secularly, as it didfor the population as a whole from rising levels of education. However, ithas increased slightly since 1996, possibly a sign that more educated recip-ients have left the rolls in the massive caseload decline illustrated earlier.This would leave the caseload more disadvantaged than it had been be-fore.21
The types of single mothers on AFDC also shifted over time, as shownin figure 5.5. Initially most single mothers were widows, but in the 1960s
312 Robert A. Moffitt
Table 5.5 Selected Characteristics of AFDC and TANF Families, 1969–99
1969 1979 1988 1999
% with earnings — 12.8 8.4 25.2age (median) — — 29.0 31.2% with less than high school education 76.7 57.8 47.2 48.9Family size 4.0 3.0 3.0 2.8% whose youngest child is less than two — — 43.1 32.3% child-only families 10.1 14.6 9.6 29.1
Sources: First, fourth, and sixth rows: U.S. DHHS (2001, table TANF 7). Second and fifthrows: Oellerich (2001, table 3). Third row: for 1969, 1979, and 1988, U.S. Congress, Commit-tee on Ways and Means (1998, table 7-19); for 1999, U.S. DHHS (1999, table 17); figuresshown here represent the originals inflated by the fraction nonmissing.Note: Dashes indicate data not available.
21. The evidence on whether this type of selectivity has occurred is weaker than one wouldpredict. See Moffitt and Stevens (2001), Moffitt et al. (2001), and Smith (2001), and the refer-ences therein.
The Temporary Assistance for Needy Families Program 313
Fig. 5.5 Basis of AFDC eligibility, 1942–94Source: U.S. DHHS (1995, 63).
and 1970s the majority were divorced and separated women. In the 1980sand 1990s, the majority were unmarried single mothers. These trends havecontributed importantly to the perception of welfare recipients by the gen-eral public and have probably increased its unpopularity.22
5.3 Research on the AFDC Program
This section reviews the research literature on the AFDC program. TheAFDC program has received more research attention from economiststhan any other welfare program. It was the best-known cash means-testedprogram in the mind of the general public and policymakers. Its benefitstructure was also fairly simple and came closest, among all means-testedprograms, to the simple textbook model of such a program with a singleguarantee and a single tax rate on income. This made it particularly wellsuited to the study of work incentives, which has always been the main in-terest of economists, beginning with the discussions of a negative incomein the 1960s.
Research on the TANF program is considered later in a separate sec-tion.23 There is much less research on TANF, and, further, the characterof that research is generally quite different from that on the AFDC pro-
22. For a study of how the general public perceives welfare recipients, and how that per-ception is affected by the marital status of recipients, see Moffitt (1999b).
23. That section includes research on the AFDC waivers of the 1990s because thosewaivers, while conducted within the AFDC program, are best understood as precursors toTANF.
gram, as will be seen from the review. Nevertheless, research on AFDC isstill quite relevant to the TANF program because academic AFDC re-search deals, by and large, with fundamental response issues—the effectsof benefits and tax rates on behavior—and not with the effects of specificsubfeatures of AFDC, which are not so generalizable. Consequently,AFDC research is still relevant in the TANF era, albeit in a generalizedsense.
Although the issue of work incentives is by far the major area in whichAFDC research has been conducted, some studies have also been con-ducted on many other issues as well. The review below will include themain areas of such research: dynamics and turnover in the program; em-ployment and training programs; effects of the program on demographicand family outcomes; and research on the state determination of benefits.The sections below on each of these topics will first consider the economicmodels used to analyze them, followed by a review of the empirical evi-dence.
5.3.1 Work Incentives
Models
Economists’ research on AFDC, as on most welfare programs, generallyhas taken the redistributive goals of the program as given and has tendedto focus on the behavioral incentives and disincentives provided by the pro-gram structure and benefit formula. For work incentives, there is a well-developed model for analyzing these incentives—the static labor supplymodel—which has been the workhorse of this literature. The model has en-dured because it can capture the simple labor supply effects of a wide rangeof elementary program alternatives.
The model is illustrated with the familiar income-leisure diagram in fig-ure 5.6, where the nontransfer constraint is shown as ADE with slope –W(the hourly wage rate) and it is assumed that there is no nonprogram non-labor income (N ). The benefit formula (allowing positive N ) is B � G –t(WH � N ), where H is hours of work, generating the transfer constraintshown as ACD, with slope –W(1 – t). Here t is the marginal tax rate onbenefits and the intercept G is the guarantee level. The introduction of theprogram where there was none before uncontrovertibly reduces (or at leastdoes not increase) labor supply because income and substitution effectsgo in the same direction. Those initially on constraint AD will move toCD, reducing labor supply, and a few of those initially above point D willreduce labor supply to go onto the program (indifference curves notshown).
An increase in G, which shifts segment CD up in parallel fashion, re-duces hours of work in this model if leisure is a normal good, but the more
314 Robert A. Moffitt
important comparative static is that induced by a reduction in t. Thenegative income tax, a program originally proposed by Friedman (1962)and promoted by Lampman (1968), Tobin (1966), Tobin, Pechman, andMieszkowski (1967), and many others thereafter, was intended to providework incentives by such a reform. Figure 5.7 shows the effect of a reductionin t from 1.0 to some lesser value by the shift from CD to CD�. It is now awell-known result that the effect of such a reduction on average hours ofwork is ambiguous in sign. While some of those who are initially on wel-fare and not working increase their hours of work (arrow 1), those in thenewly created eligible region will reduce their labor supply (arrow 2), as willsome of those at higher income levels who are initially ineligible (arrow 3).Whether labor supply on net increases or decreases depends on the relativenumbers of individuals at different points and on the magnitudes of their
The Temporary Assistance for Needy Families Program 315
Fig. 5.6 Budget constraint with a means-tested transfer program
Fig. 5.7 Effect of change on t on labor supply
responses.24 The ranges of G and t in the AFDC program typically resultedin a program breakeven point (D or D�) somewhere in the part-time hoursrange, so the effect of a reduction in t was thought to increase part-timework both by pulling nonworkers up to that range and inducing some full-time workers to reduce work to part time (to obtain benefit supplementa-tion).
This result is a special case of a larger principle that has bedeviled wel-fare reform, namely, that any reform that provides a benefit to those on wel-fare that is not available off welfare tends to draw families onto the pro-gram, thereby increasing the caseload and decreasing labor supply.Providing benefit supplementation to those who work while on welfare—but not to those who are off welfare—is one example, but so is providingmedical benefits, child care subsidies, and education and training pro-grams, if those are provided only to those on welfare and not those off.There is no way within this general class of budget-constraint manipula-tions of the welfare formula to avoid these effects entirely, although theymay be avoided by making such benefits universal and hence available tothose off welfare as well as on.
With a minor modification, the model also provides a simple theory ofwelfare participation, which is also a useful tool in analyzing the AFDCprogram. Denoting V(W�, N�) as the indirect utility obtained by an indi-vidual on a linear budget segment with slope W� and rightmost interceptN�, we can write the determinants of welfare participation—P, equal to 1if the individual participates and 0 if not—as
(1) P∗ � V [W(1 � t), N(1 � t) � G ] � V [W, N ] � C
(2) P � 1 iff P∗ � 0; P � 0 otherwise
where C is some implicit cost attached to being a welfare recipient. Thatcost may be a stigma cost—the individual suffers a utility loss from beingon welfare per se—or a time and money cost arising from the process ofapplying for the program and complying with its ongoing reporting andother requirements. The first two terms in equation (1) imply that partici-pation propensities are increasing in G and decreasing in t, and there is apresumption (although not strictly required by theory) that they are de-creasing in W. The basic trade-off in the model faced in the participationchoice is between the potential benefit, on the one hand, and potentialearnings off welfare, on the other. Welfare costs (C ) are needed to explainwhy participation rates of eligibles are less than 100 percent—as all data
316 Robert A. Moffitt
24. The decrease in t has ambiguous effects on work effort but unambiguously increases thecaseload and the participation rate in the program. The early literature on reductions in t (e.g.,Aaron 1973) emphasized that there is a trade-off between work incentives and program costsfor this reason. But, in fact, the trade-off is more unfavorable than this implies because a re-duction in t may not only increase costs, it may also not increase labor supply.
calculations show them to be—for this implies that some families will beobserved to be on segment AD in figure 5.1 and do not take advantage ofa potential increase in income by going onto welfare. Note that equations(1)–(2) also cover the participation choice between locating above thebreak-even point D in figure 5.1 and below it, as well as the choice betweensegment AD and CD.
Evidence
There have been three major reviews of the literature on the effect ofAFDC on labor supply (Danziger, Haveman, and Plotnick 1981; Moffitt1992b; Hoynes 1997), which cover most of the work on that topic. Thestudies as a whole confirm that AFDC reduces labor supply, and the esti-mates of its effect range from 10 to 50 percent of non-AFDC levels. Meanlabor supply in the absence of AFDC is generally only about twenty hoursper week, however (including nonworkers), so the absolute magnitude ofthe reduction is not as large as might be expected.25 Probably the majormethodological problem with these estimates is the obvious one that theyare not based on any data in which AFDC was literally absent, but ratherare extrapolations from estimated effects of the existing, positive level ofAFDC benefits down to a benefit level of zero. Benefit-level estimates (re-ally, effects of G ) are obtained from cross-state variation in benefits, which,although large, does not include zero benefits. These estimates must there-fore be treated with some caution.
This literature also generally estimates income and substitution effectson labor supply, usually based, at least in part, on variation in G and tacross states. This itself is also problematic because, while there was con-siderable variation in G in the AFDC program, as just noted, the nominallevel of the tax rate was set by the federal government and hence was con-stant across states. Sometimes this problem was circumvented by con-straining the effect of t to enter the labor supply function through W(1 – t),thereby allowing wage variation to identify the coefficient, but often varia-tion in effective tax rates arising from a variety of sources was used.26 Ei-ther approach has problems. In any case, however, the elasticities estimatedin the papers generally fell into acceptable ranges as those are defined
The Temporary Assistance for Needy Families Program 317
25. The estimates suffer from a data problem, namely, that they use household surveys thatonly contain information on hours of work over an entire year (divided by 52), which includesboth welfare and nonwelfare weeks. Thus the estimates are themselves some average overweeks in which the individual was on welfare and weeks in which she was not.
26. See note 2 for ways in which states could manipulate the tax rate. These variations onlychanged the tax rate over some ranges of the data and hence still require some parametric re-strictions to obtain general estimates of substitution effects. Some studies, rather than usingthe official manipulations of the tax rate, simply used estimated effective tax rates obtained byregressing benefits on income on a state-by-state basis (see Fraker, Moffitt, and Wolf 1985,and McKinnish, Sanders, and Smith 1999 for such estimates). However, these incorrectly lin-earized the benefit formula and also incorporated taxes and work-related expenses thatshould not be included.
by the general labor supply literature for women and single mothers, withmoderately large and negative income effects and moderately sized andpositive uncompensated substitution effects.
However, as noted in the Models section above, the net effect of changesin t on labor supply depends on the relative magnitudes of offsetting posi-tive and negative effects, regardless of whether uncompensated substitu-tion effects are positive. On this issue, the evidence suggested that the neteffect was reasonably close to zero; that is, that the positive and negative in-centive effects of changes in t essentially cancel each other out. The non-experimental evidence, such as that provided by simulations from nonex-perimental labor supply elasticities, demonstrates this, as does evidencefrom the NIT experiments. In the latter, comparisons of labor supplyacross alternative treatment groups that had the same G but different tshowed no consistent evidence of differences in hours of work (SRI Inter-national 1983, table 3.9). As noted by Moffitt (1992b), the finding of a smallor nonexistent effect of changes in t on labor supply is consistent with therelative invariance of hours of work among female heads in time series be-fore and after the 1967 and 1981 changes in the tax rate in the AFDC pro-gram.
There have been relatively few new studies of AFDC and labor supplysince the past reviews. Three are noted in table 5.6. Hoynes (1996) studiedthe AFDC-UP program and found it to have significant negative effects onthe labor supply of husbands and wives, but that marginal reductions in thad little effect, consistent with prior work. Keane and Moffitt (1998) fo-cused on the labor supply effects of participating in multiple programs, in-cluding not only AFDC but also food stamps, subsidized housing, and theMedicaid program. They showed that cumulative marginal tax rates weregenerally greater than 100 percent in this case. Nevertheless, although theirestimated substitution and income elasticities were sizable, the net effect onlabor supply of reducing the marginal tax rates to a level below 100 percentwas negligible, again for the same reasons already noted. Meyer andRosenbaum (2001) focused on an attempt to explain the increase in em-ployment rates among single mothers from 1984 to 1986. They found thatAFDC benefits and tax rates (the latter affecting potential benefits if work-ing) had expected effects on employment probabilities, but that the time se-ries increase in single-mother employment was less affected by changes inthose parameters and other welfare variables than by a change in the gen-erosity of the Earned Income Tax Credit (EITC) over the period (see theEITC chapter in this volume).27
Simple static models of participation in AFDC also form a part of this
318 Robert A. Moffitt
27. Because Meyer and Rosenbaum examined employment rather than hours of work, the“perverse” effect of a change in t could not occur. They briefly examined effects on hours ofwork as a sensitivity test, but they noted that the model independent variables were not set upfor that dependent variable.
Tab
le 5
.6R
ecen
t Stu
dies
of t
he E
ffec
t of A
FD
C o
n L
abor
Sup
ply
Stud
yD
ata
Popu
lati
onD
epen
dent
Var
iabl
eW
elfa
re V
aria
bles
Res
ults
Hoy
nes
(199
6)Su
rvey
of I
ncom
e an
d L
ow-a
sset
mar
ried
L
abor
sup
ply
and
par-
AF
DC
gua
rant
ee a
nd
AF
DC
-UP
has
siz
able
P
rogr
am P
arti
cipa
-co
uple
sti
cipa
tion
in th
e ta
x ra
te e
valu
ated
at
nega
tive
eff
ect o
n la
-ti
on, 1
983–
86A
FD
C-U
P p
rogr
amsp
ecifi
c la
bor
supp
ly
bor
supp
ly; m
argi
nal
poin
tsch
ange
s in
Gan
d t
have
litt
le e
ffec
t
Kea
ne a
nd M
offitt
Su
rvey
of I
ncom
e an
d L
ow-a
sset
sin
gle
Lab
or s
uppl
y an
d pa
r-G
uara
ntee
s an
d ta
x Su
bsti
tuti
on e
last
icit
y (1
998)
Pro
gram
Par
tici
pati
on,
mot
hers
tici
pati
on in
AF
DC
, ra
tes
in A
FD
C, f
ood
is 1
.82
and
tota
l in-
1984
food
sta
mps
, and
sub
-st
amps
, and
sub
sidi
zed
com
e el
asti
city
is –
.21;
si
dize
d ho
usin
gho
usin
g ev
alua
ted
at
mar
gina
l cha
nges
in t
spec
ific
labo
r su
pply
ha
ve n
o eff
ect o
n la
bor
poin
tssu
pply
Mey
er a
nd R
osen
baum
C
urre
nt P
opul
atio
n Si
ngle
mot
hers
Pro
babi
lity
of w
orki
ngA
FD
C a
nd fo
od s
tam
p G
uara
ntee
s re
duce
(2
001)
Surv
ey, 1
984–
96gu
aran
tee
and
exp
ecte
d em
ploy
men
t pro
babi
l-be
nefit
s if
wor
kit
y an
d be
nefit
s if
w
ork
incr
ease
it
literature, generally estimating some version of equations (1)–(2). Again,most of this literature is summarized by prior reviews. The studies over-whelmingly confirm that participation propensities are positively affectedby G and negatively affected by t, and generally confirm that those propen-sities are negatively affected by W and N. Two of the recent studies (Hoynes1996 and Keane and Moffitt 1998) estimated participation equationsjointly with labor supply equations and obtained results consistent withthese findings.
Researchers have also sought to use this model to explain the time-seriespattern of caseload and participation rates in different periods shown inFigure 2. Most explanations for the welfare caseload increase in the late1960s and early 1970s rely on the gradual expansions of the Food Stampand Medicaid programs to more counties in the United States, which,given the ties of these programs to AFDC receipt, made the program moreattractive. Such an explanation is consistent with the economic model.However, most observers attribute part of the increase as well to court de-cisions relaxing eligibility restrictions and to declines in welfare stigma, al-though the latter may be endogenous. The relatively stable caseload trendin the late 1970s and 1980s is generally attributed to two offsetting and con-tradictory forces, one an increase in the fraction of single mother familiesin the population and the other a decline in the participation rate condi-tional on single motherhood. The latter is most often attributed to the de-cline in the real benefit level, while the causes of the former are still in con-siderable dispute. The economic model is better at explaining changes inparticipation conditional on single motherhood than changes in singlemotherhood, in general. Finally, the increase in caseloads in the early1990s, which resulted from a rise in the participation rate conditional onsingle motherhood more than a rise in single motherhood, is more difficultto explain with the economic model, for neither declining wage rates norincreasing benefits can be reasonably tied to most of the growth. Blank(2001) shows that the majority of the caseload increase over this periodarose from increases in child-only cases and the AFDC-UP caseload, nei-ther of which is easily explainable by the economic model, whereas the re-maining growth of the traditional single-mother AFDC caseload is rea-sonably well explained by an expanded model that includes not onlybenefits but also demographics, political factors, and other policy vari-ables.28
320 Robert A. Moffitt
28. Blank also argues, however, that the growth of the single-mother AFDC caseload overthis period was more a result of an increase in the number of single mothers with income be-low the eligibility level than of an increase in take-up conditional on this eligibility. Moffitt(2001) showed that the caseload increase over this period was half a result of increases in thenumbers of single mothers and half a result of increases in take-up conditional on singlemotherhood (but not conditional on income). Moffitt also argued that, over the period 1971–95, participation rates so defined fluctuated around a constant mean and hence had no effecton the long-run growth of the caseload, which is instead essentially entirely explained by thegrowth in single motherhood.
A small literature has also developed on the concept of welfare stigma,which, as mentioned above, is conceived of as a disutility of welfare partic-ipation which lowers participation rates in the program. Moffitt (1983) in-troduced the concept to the literature but considered it to be an exogenousheterogeneous parameter of the individual utility function that could beused to rationalize the need to estimate a participation equation and notjust a labor supply equation.29 However, other studies have developed theidea of welfare stigma as a disutility that declines with the number of otherfamilies who are on welfare, setting up a social interactions, or contagion,model that can have multiplier effects once participation rates exceed athreshold. Besley and Coate (1992a), for example, assumed that the utilityof being on welfare is reduced by some function of the fraction of the pop-ulation that is not truly needy and is instead reducing labor supply to goonto welfare. Lindbeck, Nyberg, and Weibull (1999) simply assumed thatthe utility of being on welfare is reduced by the number of others who areon welfare, but they went on to analyze the voting equilibria that would setbenefit levels that would generate different welfare caseloads as an equilib-rium outcome. In a somewhat different vein, Nechyba (2001) assumed thatthe stigma of having nonmarital births (which is a condition for welfare el-igibility) is reduced by the magnitude of the aggregate nonmarital birthrate, and he then showed that a change in welfare benefits can initiate anontrivial change in that birth rate through multiplier effects.
5.3.2 Participation Dynamics
A continuing area of research on the AFDC program focuses on partic-ipation dynamics, that is, the study of entry rates, exit rates, and spell dis-tributions of time on AFDC. Interest in this issue arises from severalsources. One is the recognition that, contrary to the impression given bythe static labor supply model where participation seems to be a one-time,permanent decision, turnover rates in the AFDC program are quite high.Another is that attitudes toward the program, and policy measures to as-sist recipients, may differ depending upon whether recipients have onlyshort spells of AFDC receipt or long spells. Short-spell recipients are likelyto be those with stronger labor market skills who use the program for tem-porary support, whereas long-term recipients are likely to be those with theweakest skills. Further, long-term receipt may reduce skill levels further, astime out of the labor force results in deterioration of skills.
Models
The two building blocks of dynamic participation analysis are an entryrate and an exit rate. The standard static labor supply–participation model
The Temporary Assistance for Needy Families Program 321
29. If participation rates of eligibles are 100 percent, then all individuals are on the bound-ary of their constraints, and their observed values of labor supply uniquely determine theirwelfare participation status; hence there is no need to estimate a welfare participation equa-tion.
is easily adapted to entry and exit in order to generate a conventional eco-nomic model of turnover. Supposing that the relevant population of eligi-bles is composed of myopic individuals who make decisions only on the ba-sis of current period values, the decision for women who are off welfare attime � – 1 to enter or not enter the program (designate EN� as an entrydummy variable) and the decision for women who are on welfare at time� – 1 to exit or not exit the program (designate EX� as an exit dummy) canbe formulated as
(3) EN�∗ � V [W�(1 � t), N�(1 � t) � G ] � V [W� , N� ] � C � F1
(4) EN� � 1 iff EN�∗ � 0; EN� � 0 otherwise
(5) EX�∗ � V [W� , N� ] � V [W� (1 � t), N�(1 � t) � ] � C � F2
(6) EX� � 1 iff EX�∗ � 0; EX� � 0 otherwise,
where F1 are fixed costs associated with moving onto welfare and F2 arefixed costs associated with moving off welfare (and possibly into the work-force). Starting with initial positions on or off welfare, and with G, t, andC fixed, transitions on and off welfare are driven by fluctuations in privatemarket income opportunities W� and N� , which are assumed to follow somestochastic process. Individuals leave welfare when good job or other in-come opportunities arise and enter welfare when those job or income cir-cumstances deteriorate; benefit levels and tax rates affect the relative at-tractiveness of welfare in the decision.
Given that the utility structure of the entry and exit decisions in equa-tions (3)–(6) is the same as that in equation (1), the same comparative stat-ics apply: Entry rates are increasing in G and decreasing in t and W, whileexit rates are decreasing in G and increasing in t and W. Since labor supplyon welfare is always less than labor supply off welfare, we can also say thatthese entry and exit decisions operate to make labor supply decreasing inG and increasing in t and W. That work incentives are implied to increasein t reflects the adverse work incentive effects noted above and can be seenin a dynamic context to operate through entry and exit: Decreases in mar-ginal tax rates tend to decrease exit from the rolls and increase entry ontothe rolls. Although the fixed costs reduce transition rates, an individual’sparticipation will tend to gradually move over time toward welfare if equa-tion (3) is more positive than equation (5) conditional on W� and N� and to-ward nonwelfare if the opposite occurs.
If � is the entry probability, � is the exit probability, and p� is the proba-bility of being on welfare at time �, then we have the flow identity
(7) p� � �(1 � p��1) � (1 � �)p��1
� � � (1 � � � �)p��1
which approaches the equilibrium value
322 Robert A. Moffitt
(8) p� � � �
�
�
Thus participation on welfare will be more likely if � is greater than �, andnonwelfare participation will be more likely if � is greater than �. Unlessthe fixed costs are large relative to the utility differences, these participa-tion tendencies will be driven by the relative values of G, t, W, and N, asbefore.
In this simple setup, short-term recipients can be thought of as thosewith higher values of mean W� and N� , which will generate lower entry rates,higher exit rates, and shorter spell lengths, and long-term recipients can bethought of as those with lower mean values of those variables, resulting inhigher entry rates, lower exit rates, and longer spell lengths. A logical al-ternative in this model is that short-termers and long-termers have thesame means for wages and nonlabor income, but short-termers have ahigher variance, which will lead them to have higher turnover rates as well.If the variation in wage and nonlabor income from period to period, whichgenerates turnover in this model, is not exogenous but rather depends oneffort, then it is also possible that short-termers are those who put moreeffort into job search. Heterogeneity in the distaste for welfare can alsogenerate differences in turnover rates, as those with greater distaste have alower reservation wage for going off or failing to enter welfare.
These models can be made more realistic by allowing foresight, particu-larly if wage growth is made endogenous and allowed to be affected bywhether the individual is on or off welfare. Current entry and exit decisionswill then be affected by expectations of the future consequences for wagesand labor market opportunities. Liquidity constraints are important be-cause those going onto welfare may be those who are more greatly con-strained and who cannot sustain themselves off welfare after a negativewage shock, and those on welfare may be discouraged from saving by theasset tests in the program (see Hubbard, Skinner, and Zeldes 1995).
Evidence
The empirical literature on participation dynamics has two strands, oneconsisting of simple descriptive work on the distribution of AFDC spellsin the population and of what types of individual characteristics are asso-ciated with that distribution, and another consisting of estimates of entryand exit rate equations. The most influential descriptive work in the litera-ture is that of Bane and Ellwood (1983, 1994) and Ellwood (1986), whoused panel data to estimate distributions of AFDC spell lengths and alsodistributions of “total time on” AFDC in a fixed calendar interval. Theseauthors realized upon examination of the data not only that turnover rateswere high but that many of those who exited the AFDC rolls returned infairly short order, a finding that has been repeatedly found in subsequent
The Temporary Assistance for Needy Families Program 323
work. This implies that many women do not have many long spells but nev-ertheless accumulate a considerable amount of time on welfare because oftheir high return rates. Consequently, they may have a high total time onwelfare even though they do not have long spells. The data used by Baneand Ellwood indicated that up to one-quarter of all (new) recipients wouldbe on AFDC for more than ten years in the subsequent twenty-five-yearperiod, as compared to only 10 percent who would have a spell that lastedthat long.30
In their later work (Bane and Ellwood 1994), the authors took the exis-tence of high reentry rates to extend the categorization of welfare recipi-ents to a threefold classification, consisting of long-termers, short-termers,and “cyclers.” Long-termers have long spells, short-termers have only briefperiods of AFDC receipt, and cyclers have relatively short spells but returnto the rolls frequently. The authors argued that policy toward the threegroups should be different. In a recent paper, Moffitt (2002) has providedevidence, however, that cyclers do not appear to have greater labor marketskills than long-termers, which is an implication of the conventional eco-nomic model, where high turnover is generated by higher labor marketskill. Moffitt found that the education and wage rates of cyclers were equalto those of long-termers, if not lower, and that they are a very disadvan-taged group of recipients. This suggests that their cycling on and off for therolls must be arising from some other kind of behavior, such as an inabilityto comply with program rules.
The literature on estimating entry and exit equations is fairly large andis well summarized, for the most part, by the previous reviews of researchon AFDC referred to earlier. Table 5.7 lists some of the more recent stud-ies that have been conducted, which explore a variety of issues. On the is-sue of whether AFDC benefits affect the probability of entry and exit, theliterature confirms prior work that the guarantee generally decreases exitand increases reentry. None of the studies estimated the effects of the taxrate. Blank and Ruggles (1994) emphasized the high rates of reentry in theprogram, and Blank and Ruggles (1996) emphasized that spells of eligibil-ity are not the same as spells of welfare receipt, and some women enter therolls after being eligible for some time and others leave the rolls and remaineligible, usually for unknown reasons. Fitzgerald (1995) and Hoynes (2000)examined the effects of local labor market conditions on exit rates, whileHarris (1993, 1996) examined the “routes” to exit from the rolls and reen-
324 Robert A. Moffitt
30. The U.S. Department of Health and Human Services now routinely publishes these to-tal time on figures. A recent report (U.S. DHHS 2001, table IND 10) shows that, in a periodlater than Bane and Ellwood considered and for the total recipient population (not just thosewith a new spell), one-quarter of recipients were on AFDC more than five years in a ten-yearperiod, a much higher rate of dependence. Gottschalk and Moffitt (1994) examined how to-tal-time-on had been trending, however, and found no trend from the 1970s to the 1980s. Theyalso proposed an alternative measure, which was the percentage of income received fromAFDC over a fixed calendar period.
Tab
le 5
.7R
ecen
t Stu
dies
of P
arti
cipa
tion
Dyn
amic
s in
the
AF
DC
Pro
gram
Stud
yD
ata
Popu
lati
onD
epen
dent
Var
iabl
eW
elfa
re V
aria
bles
Res
ults
Bla
nk a
nd R
uggl
es
Surv
ey o
f Inc
ome
and
Sing
le m
othe
rs w
ho
Pro
babi
lity
of r
etur
n-A
FD
C g
uara
ntee
Gua
rant
ee p
osit
ivel
y (1
994)
Pro
gram
Par
tici
pati
on,
have
bee
n on
AF
DC
in
g to
AF
DC
affec
ts r
eent
ry r
ate
1986
and
198
7 pa
nels
and
have
left
Bla
nk a
nd R
uggl
es
Surv
ey o
f Inc
ome
and
Sing
le m
othe
rsP
roba
bilit
y of
exi
ting
A
FD
C g
uara
ntee
Gua
rant
ee h
as a
neg
-(1
996)
Pro
gram
Par
tici
pati
on,
AF
DC
and
pro
babi
lity
ativ
e eff
ect o
n ex
it;
1986
and
198
7 pa
nels
of b
ecom
ing
inel
igib
le
man
y w
omen
are
sti
ll fo
r A
FD
Cel
igib
le a
fter
the
exit
Fit
zger
ald
(199
5)Su
rvey
of I
ncom
e an
d Si
ngle
mot
hers
on
Pro
babi
lity
of e
xiti
ng
AF
DC
gua
rant
eeG
uara
ntee
neg
ativ
ely
Pro
gram
Par
tici
pati
on,
AF
DC
AF
DC
affec
ts e
xit r
ate
1984
and
198
5 pa
nels
Har
ris
(199
3)M
ichi
gan
PSI
D,
Sing
le m
othe
rs w
ho
Pro
babi
lity
of e
xiti
ng
AF
DC
gua
rant
eeG
uara
ntee
is in
sign
ifi-
1984
–86
are
on A
FD
CA
FD
Cca
nt; t
wo-
thir
ds o
f ex
its
are
for
empl
oy-
men
t
Har
ris
(199
6)M
ichi
gan
PSI
D,
Sing
le m
othe
rs w
ho
Pro
babi
lity
of r
etur
n-A
FD
C g
uara
ntee
Gua
rant
ee is
insi
gnifi
-19
83–8
8ha
ve e
xite
d A
FD
Cin
g to
AF
DC
cant
; oth
er v
aria
bles
do
mat
ter
Hoy
nes
(200
0)C
alifo
rnia
adm
inis
tra-
Cal
iforn
ia w
elfa
re
Pro
babi
lity
of e
xiti
ng
Non
eL
ocal
labo
r m
arke
t ti
ve d
ata
on A
FD
C
reci
pien
tsA
FD
C a
nd p
roba
bilit
y va
riab
les
affec
t tra
nsi-
reci
pien
ts, 1
987–
92of
ree
ntry
tion
rat
es
Hoy
nes
and
Mic
higa
n P
SID
, Si
ngle
mot
hers
who
P
roba
bilit
y of
exi
ting
A
FD
C g
uara
ntee
Gua
rant
ee e
xpla
ins
MaC
urdy
(199
4)19
68–8
9re
ceiv
ed A
FD
CA
FD
Cch
ange
s in
leng
th o
f w
elfa
re s
pel
ls in
som
e p
erio
ds b
ut n
ot o
ther
s
try to it. The literature on “routes” was initiated to a large extent by Baneand Ellwood (1983), who found that most exits from AFDC were to mar-riage. Harris (1993, 1996) and others found that this was a result of usingannual data and that when monthly data are used, exits are usually to work.The literature on these routes on and off welfare and reasons for exit arefrought with conceptual problems, for the immediate reasons for entry andexit may not be the long-run reasons. In addition, reasons that particularindividuals enter and exit are endogenous to their unobserved characteris-tics, and it is difficult, as a result, to draw any implications about whethergovernment policy should be to encourage certain routes off welfare.31
5.3.3 Employment Programs
In addition to simply providing cash with a specified benefit formula, theAFDC program long conducted various types of employment programs forrecipients. One type was an education or training program that attemptedto provide labor market skills and hence to improve the wage rate of therecipient. In policy discussions, these programs are often termed “humancapital” programs. A second type provided assistance in job search, or as-sisted recipients in locating transportation and child care for employment,or even instructed recipients on the kinds of behavior and dress needed atregular jobs. In policy discussions, these are generally not termed humancapital programs, but economists’ conception of human capital should in-clude them because there is some type of investment, or instruction, in-volved, which has a future return, however small and short-lived that returnmight be. A third type was a pure workfare program that simply requireda recipient to work some minimum number of hours per week, without theassistance or other guidance from the welfare department (except, in thecase of public service employment, to actually provide the job). Such a pro-gram should not be expected to affect the wage rate and is not a human cap-ital program under any definition. Most programs had at least some ele-ments of two or more of these ideal types, and it is not always easy to findany of the types in pure form. Nevertheless, prior to TANF and the pre-PRWORA waiver programs, AFDC employment programs typically drewmostly on elements from the first two of these program types, even thoughvariations on the third were present to some degree.
Models
These programs, when viewed as human capital programs that requirean investment of time (in education, training, job search, etc.) and yieldsome rate of return in the form of a higher future wage, can be simply ana-
326 Robert A. Moffitt
31. In a review of the earlier literature in this subarea (Moffitt 1992b, 26), I noted that thestudies needed more theoretical structure and content. This observation would seem still tohold.
lyzed with the standard investment framework familiar from human capi-tal theory.32 The value to an individual of participating in the program isthe present value of future wage and earnings gains minus the present valueof the time costs and, if any, money costs. Here it is important to knowwhether the program is voluntary or mandatory. If it is voluntary, no re-cipient will participate in the program unless its net present value is posi-tive, but if it is mandatory, then it is conceivable that the net present valuewill be negative for some recipients. If so, this will reduce the value of be-ing on welfare and should be subtracted from the welfare benefit itself (orthe present value of such benefits) to obtain the value of being on welfare.
There are a number of minor alterations in this familiar model thatchange things slightly but not in the main. Future gains in earnings mustbe multiplied by the probability of employment if the latter is less than one,and programs that change only that probability and not wages also have apotentially positive net present value. Second, the rate of return will de-pend on whether earnings are raised sufficiently to induce the individual togo off welfare altogether; if so, incremental earnings gains go untaxed (bythe welfare department), but if not, earnings gains will be taxed at the wel-fare tax rate t and hence will be reduced. The rhetoric of most educationand training programs is that they are intended to move recipients off wel-fare altogether, but the reality is otherwise (see empirical review). Thephrase “welfare trap” is sometimes used to describe a situation in which avery large rate of return is needed to make the recipient financially betteroff off welfare—this is particularly likely to occur if there is a notch at thepoint of going off welfare where tax rates are over 100 percent. Third, ifthere are opportunity costs in the form of forgone earnings—as in the clas-sic education case of human capital—these forgone earnings will only beW(1 – t), not W, and hence will be lower than they would be for such in-vestment off welfare.33 If the recipient is not working, there is forgoneleisure rather than forgone earnings but the former is not taxed.
Assuming that the opportunity cost is in earnings rather than leisure, thenet present value of the program in a two-period model can be written as
(9) NPV � �W1(1 � t)I � 1 �
1
r {P2 [(W2 � W1 )(1 � t)H2 ]
� (1 � P2 )[(W2 � W1 )H2 � (G � tW1H2 )]}
The Temporary Assistance for Needy Families Program 327
32. Although traditional human capital theory presumes the effect of investment to affectthe wage rate, a generalized interpretation would allow it to affect employment as well. Forexample, an investment in teaching a recipient improved job search techniques may lead to abetter ability of the recipient to find a job at all, which would affect hours of work and not thewage rate. Although the theoretical discussion here assumes it is the wage rate that is affected,the same model can be extended to include effects on hours of work.
33. This point was made long ago by Kesselman (1976). The theoretical literature on theeffect of transfer programs on human capital investment is virtually nonexistent. See Kessel-man and Miller and Sanders (1997).
where W1 is the wage if the recipient does not undergo the program, W2 isthe (higher) wage in period two if she does, I is the amount of time requiredin period one, H2 is hours worked in period 2, and P2 is a welfare participa-tion dummy in period two if the recipient undergoes the program.34 A sec-ond equation for the determination of P2 is required but that is omitted forbrevity. The welfare trap is illustrated by the last term, which shows that thegain to the program if the recipient goes off welfare subtracts off the lostbenefit relative to the earnings gain.
The key empirical questions raised by this model are (a) what effect pastprograms have had on the wage rate or earnings and (b) to what degree theyhave moved recipients off welfare in subsequent periods.
Moffitt (1996) has noted that there is a third empirical question, whichis (c) whether these programs affect the desirability of being on welfare inthe first place, which is commonly termed an effect on entry into the pro-gram.35 If the program is voluntary, no recipient can be made worse off byits presence and the welfare program can only be enhanced in value, whichwill increase the caseload by making welfare more attractive. If the pro-gram is mandatory, it may reduce the caseload to the extent that recipientsor potential recipients see it as making them worse off.
Evidence
The main employment programs in the history of the AFDC program—at least prior to the waiver programs of the 1990s—were the WIN pro-gram, the WIN demonstrations of the 1980s, and the JOBS program, allreferred to in section 5.2 in the discussion of the history of the AFDCprogram. As noted there, the WIN program was a work-registration pro-gram that provided simple job placement and job search assistance to eli-gible recipients; the WIN demonstrations tested new employment pro-grams involving community work experience (close to workfare), worksupplementation, and heightened job search; and the JOBS program re-quired states to offer some mix of education, job skills training, job search,on-the-job training, work supplementation, and community work experi-ence.36
328 Robert A. Moffitt
34. The change in H2 resulting from the increase in the wage is ignored for simplicity.35. This is a slight misnomer given the high turnover in the program. Recipients who are al-
ready on welfare but who know that they may be engaged in a program subsequently may alsochange their exit decisions given the presence of the program (e.g., whether to accept a joboffer off the rolls or not).
36. “Community work experience” meant workfare because it was usually work at a pub-licly created job in the community such as cleaning up public parks. “Work supplementation”allowed welfare departments to use welfare benefits to subsidize private sector jobs. See U.S.Congress, Committee on Ways and Means (1994, table 10.4) for the programs chosen by thestates under the JOBS programs; these usually were job search, on-the-job training, and com-munity work experience, with sometimes some type of education. Although education was re-quired to be one of the programs offered, states rarely supplied the necessary funds to estab-lish significant programs of that type.
Neither the WIN demonstrations nor the JOBS program was ever eval-uated in a nationally representative sense, that is, by a random sample ofall programs around the country or by a universal sample of all programs.Instead, there were a series of evaluations of the programs in selected stateand local areas. In both cases, probably enough areas were selected that areasonably good sense of the effects of different types of programs were ob-tained. For the WIN program, however, there was one major evaluation,which was national in scope (Ketron 1980). It used a methodology that isnow regarded as undesirable (the use of individuals on waiting lists as acomparison group) and found very modest impacts of the program on re-cipient earnings, between $200 and $300 per year on average but larger forpublic service employment.
The results of the WIN demonstration and JOBS evaluations have beenreviewed and summarized in several other places (Burtless 1995a, b; De-vere, Falk, and Burke 2000; Gueron and Pauly 1991; Moffitt 1992b; O’Neilland O’Neill 1997; Plimpton and Nightingale 2000; U.S. General Account-ing Office 1999; see also LaLonde, chap. 8 in this volume). Both the WINdemonstration and JOBS evaluations concentrated on answering the firstempirical question noted above, namely, whether there is a positive returnto the programs in terms of wage rates or earnings, and devoted some at-tention as well to the second question—whether caseloads were reduced.Virtually no attention was paid to the third question (whether there was in-duced entry) primarily for methodological reasons, for most of the esti-mates of program effects were obtained from random assignment trials,and those trials are inherently incapable of estimating entry effects (Moffitt1992a).
The results of the evaluations of the WIN demonstration programs showgenerally positive impacts on employment and earnings, with impacts onthe latter usually in the range of $300 to $600 per year. However, some pro-grams had a much smaller impact, close to zero, and others had larger im-pacts, occasionally around $900 per year. These impacts are not largeenough to make a major dent in the poverty rate, but are large enough tomake the programs worth considering, especially in light of the view in the1980s that most employment programs for welfare recipients had no im-pact at all. Furthermore, the expenditure on the WIN demonstration pro-grams was quite small, around $500 per recipient in some cases, becauseonly a modest amount of services were provided; these were very small-scale programs. The earnings impacts are perhaps larger than one mightexpect from such a minor investment.37
The Temporary Assistance for Needy Families Program 329
37. The evaluations also showed that most employment impacts arose from increases in theamount of time employed rather than on the hourly wage rate. This is not too surprising giventhat the programs made little investment in human capital. However, it also implies that theimpacts are likely to fade over time, and, indeed, Friedlander and Burtless (1995) showed thatthey were gone in most sites after five years.
On the other hand, another finding from the WIN demonstrations wasthat the reduction in AFDC participation, caseloads, and expenditures onAFDC benefits was quite modest. The employment and earnings impactswere either not enough to move recipients over the break-even point, ornot enough to prevent recipients from coming back onto the AFDC rollsin sufficient frequency to result in significant declines in welfare expendi-tures.
The evaluations of the JOBS program have also generally yielded posi-tive impacts on employment and earnings. Evaluations of the CaliforniaGreater Avenues to Independence (GAIN) program, the best-known ofthe early JOBS evaluations, showed positive earnings gains of $636 (about25 percent) in the third year after the evaluation began (Riccio, Friedlan-der, and Freedman 1994). The GAIN evaluation involved six differentcounties in California, and the results from an evaluation of one of thecounties—Riverside—showed especially large earnings gains (almost 50percent) for reasons that have never been completely resolved, partly be-cause the random assignment methodology used does not enable any rig-orous investigation of mechanisms by which the treatment has an effect.Speculation has been that the Riverside program was so successful becauseit offered a particularly strong “work first” program that emphasized im-mediate job placement through job search (although others believe it hada good mix of rapid-employment job search and human capital educationand training); because the labor market in Riverside was relatively weakand hence control families did not do well; and even because of a charis-matic and energetic director. Whatever the reason, the Riverside evalua-tion has come to be one of the genuine success stories of employment pro-grams in the 1990s.
One of the problems with evaluations that this illustrates is that con-ducting experimental tests of a program in only a handful of areas, and al-lowing each area to offer a different variation on the general program, es-sentially prevents learning whether differential effects that occur acrossareas are the result of site-specific factors (the economy, charismatic direc-tors, etc.) or of the particular program that was tested in the area. Hotz,Imbens, and Klerman (2000) compared different sites in the GAIN evalu-ation to determine if the different impacts across sites could be ascribed in-stead to differences in the types of recipients enrolled in each site; theyfound that such differences did not explain the cross-site differences.Greenberg et al. (2001) ran regressions of the estimated program effects ineach of several JOBS sites on characteristics of the area, the sample, andthe program, and found it impossible to explain the cross-site differences.This makes it difficult to use the results for policy because extrapolation tothe nation as a whole or to any other particular area around the country isvery problematic.
A JOBS evaluation involving eleven different sites has also yielded re-
330 Robert A. Moffitt
sults but is still in progress at this writing.38 A unique aspect of this evalua-tion was that it tested different program strategies within the same sites,thus eliminating some of the site effects just described. For the most part,the variation of interest was whether the program tested a rapid-employment, low-cost job search program or a human capital, high-costeducation and training program. The distinction is important because theTANF program that replaced AFDC emphasized the former over the lat-ter, as part of the work first philosophy (this was also an issue in the River-side GAIN program, as just noted). The results to date indicate that, fouryears after the evaluation began, positive employment and earnings gainsresulted, falling generally in the range of $300 to $500 per year (Freedman2000). Both rapid-employment and human capital programs were found inthis range, although some of the human capital programs yielded resultsthat were lower. The trend in impacts after three years suggests that therapid-employment programs have large initial impacts that fade over time,whereas the human capital programs have impacts that do not decline asfast or may even grow over time, and that the earnings and employmentgains end up by the third year not far different (Bloom and Michalopoulos2001).39 This has led some observers to conclude that the two strategiesyield about the same impacts.40 If the two have the same impacts, then, be-cause the human capital strategy is more expensive than the job-searchstrategy (up to double the cost by some estimates), the former must neces-sarily have a lower rate of return than the latter.
Another important finding from this JOBS evaluation was that, al-though earnings impacts of the programs were positive, household incomechanged very little as a result of the program. This occurred because the in-creases in earnings were mostly cancelled out by declines in welfare bene-fits. This implies that recipients would have very little incentive themselves
The Temporary Assistance for Needy Families Program 331
38. The evaluation began in the early 1990s, and results from a five-year follow-up measur-ing impacts have not yet been completed.
39. In a study of the earlier GAIN program that followed recipients nine years after enroll-ment, Hotz, Imbens, and Klerman (2000) found the same pattern when comparing treatmenteffects in different counties—those with rapid-employment programs had impacts that fadedover time compared to those emphasizing education, and after nine years they were statisti-cally no different from each other.
40. A later analysis (Bloom and Michalopoulos 2001) concluded that “mixed” strategieswere best, rather than a pure rapid-employment or pure human capital strategy. This conclu-sion was based largely on a comparison of pure strategies in this JOBS evaluation with sev-eral of the earlier GAIN evaluations, which were characterized as “mixed” as well—with adominant emphasis on one strategy but with elements of the other. The only JOBS evaluationwith such a mixed strategy was tested in one site (Portland), which stood out from the rest andhad above-average impacts. Portland was initially known as a rapid-employment programcity, but in fact it offered some education and training to certain recipients. Perhaps more im-portant, it offered individualized treatments to different types of individuals after assessingtheir needs. There were other differences in the program operated in Portland as well, togetherwith differences in its local economic environment from those in the other cities. Unfortu-nately, as with the Riverside GAIN program, it is almost impossible to determine what thetrue reason for the difference in impacts in Portland was.
to engage in these programs, unless they expected greater gains in the fu-ture than were measured by the evaluation. This suggests that the programswould have to be mandatory in order for the welfare departments to inducerecipients to enroll in them.
Although the overall sense of the JOBS evaluations is that there are in-deed employment and earnings gains from these programs, both inherentproblems and practical problems with the random-assignment methodol-ogy limit what has been learned. Aside from the difficulty of incorporatingentry effects and separating site effects from treatment effects, as alreadynoted, many of the programs allowed control group members to start re-ceiving the program after three years or so. Thus, impact estimates beyondthat period are not true estimates of the program by itself. In addition, inmany of the areas the local program environment continued to change af-ter the evaluation was initiated, further affecting the outcomes of experi-mentals and controls.
5.3.4 Family Structure
Models
The suggestion that the AFDC program encourages women to havechildren out of wedlock has been a staple of popular views of welfare fordecades. This popular view is consistent with the fact that AFDC benefitsare primarily provided only to single-parent families and those are virtu-ally all families with a female single parent. This view has been addressedby a large volume of research by economists in the last fifteen years or soand by a smaller volume of work by demographers in prior years. It hasbeen accompanied by a more expansive examination of the effects ofAFDC on family structure in general, including not only its effects onwhether a woman is a single mother, but also on cohabitation, childbear-ing, and whether a woman lives with her parents or other relatives.
Virtually any economic model of marriage, including Beckerian utility-differences, or gains-to-marriage, models, predicts that the offer of a bene-fit to an individual contingent entirely on whether he or she is unmarriedand has children will induce behavior that leads to a higher incidence ofsuch events. One theoretical framework that would predict the opposite isone in which marriage is entered into voluntarily but where marital disso-lution is an exogenous event. In this case, single motherhood is in part anunlucky random outcome of marriage that should in principle be insuredagainst, and AFDC is a form of public insurance that plays that role. Thepresence of such insurance should, therefore, encourage individuals totake the risky action, namely, to enter into marriage, to a greater degreethan they would in the absence of insurance. However, the moral hazardproblem is severe, for individuals can clearly exert much control over be-coming a single mother and, further, much single motherhood takes place
332 Robert A. Moffitt
prior to marriage. This makes insurance forces unlikely to change the netdirection of effect of AFDC.
The precise rules of the AFDC program, and its two-parent counterpart,the AFDC-UP program, complicate the incentives in several respects(Moffitt, Reville, and Winkler 1994). Because eligibility for AFDC is basedon the deprivation of the support of a biological parent, a woman whomarries a man who is not the father of her children, or who cohabits witha man who is similarly not the biological parent, is eligible for AFDC. ThusAFDC does not discourage marriage or cohabitation universally but onlyif it is with the male who is the children’s actual father. If a woman doesmarry or cohabit with a nonbiological male, and that male provides finan-cial support to the children, the income will be counted in full or in partagainst the grant, and it is possible that the woman in question may end upfinancially ineligible for the program. However, at least for cohabitation,enforcing this provision is difficult. On the other hand, the AFDC-UP pro-gram does provide some outlet, for it provides benefits not only to familieswhere both biological parents are married, but also where they cohabit; el-igibility is only based on the presence of both parents, not on the presenceof a legal union. However, the eligibility provisions in AFDC-UP havebeen sufficiently strict historically that it is more difficult to qualify for ben-efits under it than under AFDC, so the incentives for a woman against join-ing up with the father of her children are still quite strong.
The literature on the effects of AFDC on marriage has a parallel in mod-els of the effect of the income tax, and of the Earned Income Tax Credit(EITC), in creating marriage disincentives (for the latter, see Hotz andScholtz, chap. 3 in this volume). That literature is instructive because it im-plies that even if AFDC benefits were provided to married couples (or un-married biological parents), there would still be a potential for incentivesfor or against marriage. If the unit of taxation is the family, then marriedcouples are more likely to be above the income eligibility point—assumingthat both male and female have income—than if they are separate, to takejust one example. As the taxation literature demonstrates, the only neutralprogram that does not distort family structure private incentives is one inwhich benefits are paid entirely on an individual basis. But then such a pro-gram would violate vertical equity considerations and would also be com-plicated by the presence of children. As Hotz and Scholz note, a tax or ben-efit system cannot simultaneously be progressive, treat the family as theunit of taxation, and be neutral with respect to marriage (see also Alm,Dickert-Conlin, and Whittington 1999).
Another theoretical observation worth noting in this context is that auniversal benefit system that provides nonzero benefits to all householdstructures—in particular, to single individuals—could alter predictions ofthe effect of AFDC on marriage. If the AFDC system were altered so as toallow benefits to be paid to both married couples and single individuals,
The Temporary Assistance for Needy Families Program 333
then some marriages would dissolve so that the single individual—most of-ten the male—could collect the benefits for which he is newly eligible. Inaddition, some currently single mothers and absent fathers would choosenot to marry despite the new benefits they could obtain from that actionbecause the absent father would now also receive increased income. Theseeffects would have to be counted against the marriage-increasing results ofthe program change, with unknown, and therefore ambiguous, net effect.
The AFDC program alters incentives for childbearing and living ar-rangements as well. With regard to childbearing, the effect is through theroute of single motherhood, for childbearing outside of marriage makes amother eligible for benefits whereas childbearing inside marriage generallydoes not. An additional incentive for childbearing appears in the benefitstructure in states in which benefits are calibrated to family size and higherbenefits are paid to larger families. In this case there is an income gain tohaving additional children that is not present in the absence of a govern-ment welfare program and hence distorts choices in that direction. Livingarrangements refer generally to whether a single mother lives with others,either her parents or a cohabiting male. The rules governing cohabitationhave already been discussed, and it is only necessary to note that living withparents is governed by the same rules. That is, living with parents does notalter the basic eligibility condition based on the absence of a biological par-ent, and it will affect the grant only if the parents provide financial supportto the mother or child. However, because that type of support is more ver-ifiable than support from a cohabiting male, states are more likely to reducethe benefit in this case. The less-than-full taxation of parental support pro-vides an incentive for a woman to live with her parents, as noted byHutchens, Jakubson, and Schwartz (1989). The fact that support is partlytaxed provides a disincentive for a woman to live with her parents relativeto a family-structure-neutral system in which the AFDC benefit is notaffected by this type of family structure. This provides another example ofthe trade-offs noted above that always come up in balancing equity withneutrality in tax and transfer systems.
Evidence
There has been built up in recent years a fairly large literature on theeffect of AFDC benefits on family structure, mostly concerned with theeffects of benefits on the probability of being a single mother. The literaturehas been reviewed many times, but the most recent review is by Moffitt(1998) and reviewed sixty-eight separate estimates of the effect of AFDCon various aspects of marriage, fertility, and single motherhood. This re-view covered studies conducted through approximately 1996. The resultsof this survey are shown in table 5.8, which reports counts of estimatesshowing insignificant, significant, or a mixture of insignificant and signif-icant effects of welfare. The results are broken down by race, when pos-
334 Robert A. Moffitt
Tab
le 5
.8C
ount
s of
Est
imat
es o
f Eff
ect o
f Wel
fare
on
Mar
riag
e an
d Fe
rtili
ty
All
Rac
esW
hite
Non
whi
te o
r B
lack
Typ
eIn
sign
ifica
ntSi
gnifi
cant
Mix
edIn
sign
ifica
ntSi
gnifi
cant
Mix
edIn
sign
ifica
ntSi
gnifi
cant
Mix
ed
All
85
18
135
1012
6C
ross
-sta
te le
vels
63
12
94
76
3C
ross
-sta
te c
hang
es1
2—
44
—1
52
Wit
hin-
stat
e1
——
1—
—1
——
Tim
e se
ries
——
—1
—1
11
1
Sou
rce:
Moffi
tt (1
998,
tabl
e 1)
.N
ote:
Das
hes
indi
cate
abs
ence
of d
ata.
sible, and by the source of variation in benefits used to identify welfareeffects—either cross-state variation in benefit levels, cross-state changes inbenefits (i.e., state fixed effects models), within-state variation assumingthe existence of some determinant of benefits that does not simultaneouslydirectly affect family structure, or pure time series studies. Overall, al-though there is a very slight excess of significant estimates over insignifi-cant ones across all races, it is quite small. However, the patterns differ byrace and source of benefit variation, with stronger effects appearing forwhite women, and for white women using cross-state levels and for blackwomen using cross-state changes in benefits. The difference in how benefitvariation affects family structure between the two races is a result of adifferent sorting of single mothers by state for the two races, with whitesingle mothers tending to be concentrated in high-benefit states but blacksingle mothers tending to be concentrated in low benefit states.
Nevertheless, the most important implication of the review is that noneof the significant estimates were in the “wrong” direction—all were in theexpected direction (positive on single motherhood, negative on marriage,etc.). A simple unweighted average of the estimates, therefore, reveals acentral tendency suggesting the presence of an effect of welfare benefits onfamily structure. Moreover, when distinctions are made between the stud-ies by the likely credibility of the estimates—those controlling for the mostother variables, which concentrate on the most appropriate part of thedistribution of women, and use the most careful econometric methods—effects are sometimes stronger, sometimes substantially so (Moffitt 1998).Therefore, although there is still considerable uncertainty in the literatureand there remain a large number of studies reporting insignificant esti-mates, this reading of the literature leads to the conclusion that welfare islikely to have some effect on family structure.41
There have been a few newer studies not included in the review just de-scribed. One of particular note is that of Hoffman and Foster (2000), whowere able to replicate a study of Rosenzweig (1999) using Michigan PanelStudy of Income Dynamics data, finding significant effects of welfare onnonmarital fertility, albeit only in certain age ranges. Foster and Hoffman(2001) conducted another study with the National Longitudinal Survey ofYouth and found, as have many prior studies, that welfare impacts aregreatly reduced when state fixed effects are added to the model. Blau,Kahn, and Waldfogel (2000) use microdata from the 1970, 1980, and 1990censuses to estimate metropolitan-area fixed effects models of the effect of
336 Robert A. Moffitt
41. This is a slight change from the author’s earlier reading of the literature (Moffitt 1992b).As discussed in Moffitt (1998), the magnitude of the effect is more uncertain than the existenceof an effect. Estimates range from quite small effects to rather large ones. The difference is noteasily explainable by the preferred study characteristics just mentioned, and is consequentlynot currently resolved.
AFDC benefits on marriage rates and find them to have no statistically sig-nificant effect in their preferred models.
An issue in the literature has been that real AFDC benefits have declinedover time while single motherhood rates have increased, suggesting thatbenefits could not have caused the rise in headship. Nechyba (2001) con-structs a theoretical model in which social interactions between low-income families cause lags in the response to a change in benefits, consis-tent with the hypothesis that rising welfare benefits in the late 1960s andearly 1970s could have had lagged effects over the next two decades (a hy-pothesis also suggested by Murray 1984). Moffitt (2000) takes a more di-rect approach and conducts a time series analysis of the relative impor-tance of trends in female wages, male wages, and welfare benefits, and findsthat a decline in the wages of less-educated males was the main contribu-tor to the rise in female headship, and that the decline in welfare benefitsslowed that rise, thus providing one possible reconciliation between thecross-sectional and time series evidence.
The living arrangements literature has examined the effects of welfare onthe propensity of a single mother to live with her parents, and on herpropensity to cohabit. Ellwood and Bane (1985) found that higher AFDCbenefits were associated with greater propensities for single mothers to liveindependently of parents, whereas Hutchens, Jakubson, and Schwartz(1989) argued that the proper variable is the relative benefit between livingwith and without parents—equal to the benefit penalty imposed for livingwith parents—and found it to have a statistically significant effect on thepropensity to live independently. Hu (2001) found that the probability thata teenager in a welfare family leaves the household is inversely related tothe size of the benefit reduction suffered by the parent if the teen were toleave. Moffitt, Reville, and Winkler (1998) found cohabitation rates to bevery high among AFDC recipients, but their econometric model did notturn up any strong effects of benefits, or state rules governing cohabitation,on the likelihood of cohabiting. Evenhouse and Reilly (1999), examiningthe issue with the Survey of Income and Program Participation, findstronger effects of benefits, however, on the likelihood of cohabiting with amale who is not the natural parent of the children.
5.3.5 State Benefit Determination
Models
A final area of considerable economic research has been on the determi-nants of state benefit level and on the effects of federal matching grants onthe level of state benefits. The models used in this literature for state bene-fit determination are generally drawn straight from the literature on me-dian voter models of public choice, considering aid to the poor as a posi-
The Temporary Assistance for Needy Families Program 337
tive argument in that voter’s utility function but with the taxes needed topay for those benefits to be a negative argument. Income effects are gener-ally assumed to be positive, with higher median voter income leading togreater benefit levels. In the typical model, assuming a head tax on all vot-ers to finance benefits, the price of benefits is equal to the per capita case-load times one minus the federal matching rate. Thus higher caseloadsimply that the cost of a dollar increase in the benefit level is greater, and alower matching rate implies the same. Lower matching rates, assumingthey are partially spent on tax relief or other public goods, have some“leakage” because a dollar of grant does not translate into an extra dollarof welfare expenditure. For many years the matching rate structure of thefederal subsidy formula for AFDC was progressive, with higher matchingrates at low benefit levels than at high benefit levels, thus indirectly en-couraging a reduction in the dispersion of benefit levels across differentstates. However, this structure was gradually replaced over the 1970s by asimple constant proportional matching rate, regardless of the level of thestate benefit, in an open-ended match at that rate.
Evidence
One focus of the empirical literature has been to estimate price and in-come elasticities for benefits, usually from a regression of benefit levels onstate median income and on a price variable, usually constructed as thecaseload times one minus the matching rate, as just discussed.42 There areseveral econometric issues that arise in such estimation that will not be dis-cussed in detail here. The first model of this type was conducted by Orr(1976), who found that the federal matching rate, state per capita income,and other variables measuring the characteristics of the taxpaying popula-tion and the recipient population all had effects on a state’s chosen benefit.Orr concluded that the results were generally supportive of a public choiceview of state benefit determination. A number of additional studies wereconducted thereafter and a range of price and income elasticities obtained.Ribar and Wilhelm (1999) have surveyed the estimates, and they concludethat price elasticities are of the correct sign but weak in significance andrelatively small in magnitude—in the range (–0.14, 0.02)—in contrast toincome effects, which are generally significantly positive and somewhatlarger in size—in the range (0.11, 0.82). Chernick (1998) also reviews theevidence and argues that the price elasticities of changing the matchingrate are somewhat greater than this. Baicker (2001) uses a different estima-tion strategy and obtains yet higher price elasticities.
A puzzle that has garnered additional attention is the reason for the
338 Robert A. Moffitt
42. There are a number of issues in using aggregate state median income to proxy the in-come of the median voter, and also whether median income itself identifies the median pref-erence voter. See Moffitt, Ribar, and Wilhelm (1998) for a discussion.
long-term decline in real AFDC benefits over the 1970s and 1980s. Neitherchanges in matching rates nor in income can explain the decline; in fact,real income growth should have led to an increase in benefits. Several hy-potheses have been suggested, including that AFDC benefits were replacedby food stamp and, possibly, Medicaid benefits in the voter’s utility func-tion, or simply that voters’ preferences shifted. Shifts in the nature of thecaseload, from divorced women to unmarried mothers, has also beenposited to be partly responsible for the trend. Others have suggested thatthe decline in real wages for low-skilled workers led to an increase in theprice of redistribution as well as an increase in “distance” from the medianvoter, both leading to a decline in the desire for redistribution. No consen-sus has emerged in the literature on the reasons for the change.43
5.4 Research on the TANF Program
Research on the TANF program is much smaller in volume than that onAFDC, not only because TANF has been in existence for a shorter periodbut also because economists and other researchers have encountered manydifficulties in studying the program that were not present, at least to thesame degree, for the AFDC program. Estimating the overall impact—thatis, the combined effect of all individual component changes—of the tran-sition from AFDC to TANF, for example, is hampered by the fact that itwas introduced in all states at approximately the same time. This is a tradi-tional problem in studying the effects of national legislation that intro-duces a program simultaneously in all states and areas.44 A second problemis that cross-state variation under TANF is much more complex than it wasunder AFDC, for in the AFDC environment most state programs were ofthe same general type—because they were required to be so by federal reg-ulation—and hence differences could be characterized by differing levelsof only a few simple parameters (the guarantee, tax rate, etc.). UnderTANF, each state has freedom under the block grant to develop programsthat differ from those in other states in dozens of ways. States have takenadvantage of this freedom to tailor their programs individually, with the re-sult that there are more than fifty-one dimensions by which state programsdiffer, leaving no degrees of freedom to estimate their effects. A relatedproblem is that each dimension is itself quite complex and difficult to mea-sure; for example, the way a simple concept such as time limits is imple-
The Temporary Assistance for Needy Families Program 339
43. See Orr (1979) and Gramlich (1982) for two early contributions, and Moffitt, Ribar, andWilhelm (1998) for a recent one. See Chernick (1998) for some discussions of the issues and areview of the literature and Moffitt (1999b) for a discussion of the implications of this litera-ture for explaining the 1996 welfare legislation.
44. As will be noted below, some of the pre-TANF AFDC waiver programs discussed in sec-tion 5.2 have, however, been used in an attempt to estimate TANF effects. Also, not all statesimplemented their TANF programs at exactly the same time.
mented can vary tremendously by the number and types of exemptions andextensions granted, whether the state allows the “clock” to stop temporar-ily for families, and so on. Documentation of these differences across stateshas also been spotty, at times, and this has also limited research.
In what follows, the discussion will first consider models of behavior un-der TANF and will then consider evidence on those behaviors as well asany other TANF issues that have been discussed in the literature.
5.4.1 Models
Many of the features of TANF can be understood as variations in pa-rameters that were present in the simple AFDC models discussed earlier,with equivalent predictions. Among these are reductions in welfare taxrates, which, as noted previously, should increase the employment rate ofwomen initially on welfare but which has ambiguous effects on overall la-bor supply including initial ineligibles.45 Another is the imposition of fam-ily caps, which reduce or eliminate the increase in benefits ordinarily pro-vided by the presence of additional births; this represents a simple changein the relationship of the guarantee level to family size, with expected effectson both welfare participation and the birth rate. A third is the provisionswhich make minor mothers ineligible for benefits if they live apart fromtheir parents, which, as the living arrangements literature in AFDC makesclear, should be expected to reduce the incidence of such living apart.
There are three new features of TANF whose effects are not directly ap-parent in the simple AFDC models discussed previously. These are workrequirements, time limits, and, to some extent, the increase in general costsof welfare participation through provisions for diversion, numerous re-quirements for continued participation, and informal pressure on womento leave the welfare rolls. Each of these three will be discussed in turn.
Work requirements can, at one level, be easily incorporated in the stan-dard static labor supply model, for they can be modeled simply as a re-quirement that a recipient work some minimum number of hours. As illus-trated in figure 5.8, where Hmin is the minimum required work hours, theportion of the welfare constraint CJ is eliminated by the requirement. Anindividual initially at C (work requirements are aimed at nonworkers) willmove either to J (arrow 3) or to segment AK (arrow 2)—increasing laborsupply in either case—or to point A (arrow 1), remaining as a nonworker.46
The caseload and participation rate in welfare both fall, as do expenditures
340 Robert A. Moffitt
45. Giannarelli and Wiseman (2000) have suggested that the popularity of earnings disre-gards in the post-TANF period may partly arise from the need to satisfy federal requirementsunder the TANF program that minimum fractions of the caseload be employed or engagedin a work-like activity. Ironically, the more successful a state is in moving employable recipi-ents off welfare and into jobs, the more likely it is to run afoul of these federal requirements.These create a perverse incentive for states.
46. The latter is more realistic if N is positive.
on benefits, and average hours of work rise. If Hmin falls to the left of thehours corresponding to point D, the work requirement is equivalent toeliminating welfare completely. Holding Hmin fixed, this is more likely inlow-guarantee states and has been shown to hold for some recipients inthose states with sufficiently high hourly wage rates and using the officialhours of work requirements in PRWORA.
Although work requirements achieve the goals of increased labor supplyand reduced caseloads, they do so by redefining the underlying goals of theprogram. Work requirements achieve work incentives by giving up on theoriginal negative income tax goal of achieving work incentives at the sametime as providing support to those who “cannot” work in a single, inte-grated system that provides a guarantee to all families with no questionsasked. Welfare programs with work requirements at their center must in-stead predefine those who can work and those who cannot work; the for-mer are provided with the benefit formula illustrated in figure 5.8, and thelatter are simply given G, or possibly G plus a low tax rate as an encour-agement to work even a small number of hours. Because making the sepa-ration of the population—or categorization—into those who can and can-not work is fraught with practical as well as conceptual problems, thedesirability of work requirements depends upon the magnitude of the costsincurred by whatever system of categorization is implemented.
There have been two strands of research on these issues. One dates fromthe late 1960s and early 1970s, during debates over the negative income tax.Categorical systems were heavily criticized by economists at that time for avariety of reasons. One was that the administrative difficulty in assigning re-cipients to categories is too great, and, more generally, because economiststend to believe that everyone can work, at least some amount, at some wage
The Temporary Assistance for Needy Families Program 341
Fig. 5.8 Effect of work requirements on labor supply
and with some kind of work support; that is, the variation in individual abil-ity is continuous rather than discrete. Another was that, because true abil-ity to work is partly unobserved by the policy maker, work requirement sys-tems provide individuals with incentives to switch categories by altering, tothe extent possible, the observable characteristics that the government usesto assign recipients to different categories. Yet another was that, becausework requirements necessarily involve individual-specific judgments onability to work, they would result in excessive caseworker discretion andconsequent inequitable treatment across individuals.47
The second strand of literature examines the possible optimality of workrequirements in various models of optimal taxation. An early set of papersdemonstrated that, if heterogeneity in preferences and abilities is unob-served by the government, then tying in-kind transfers to cash transferscould be used to induce individuals to self-select into welfare according toneed (Blackorby and Donaldson 1988; Dye and Antle 1986; Nichols andZeckhauser 1982). Work requirements are an inverse case in which the im-position of negative tied transfer—work—along with cash can be used toinduce those with higher ability to opt out of the welfare program. Beaudryand Blackorby (1998) and Cuff (2000) make this connection explicit andintroduce additional heterogeneities into the model, in both cases demon-strating the optimality of workfare as a screening device when unobserv-ables are present. Besley and Coate (1992b, 1995) showed that, under adifferent optimization criterion, workfare can be also used as a screeningdevice to ensure that higher-wage individuals do not take advantage of theprogram. In this rather different justification for work requirements, all re-cipients must undergo the cost of complying with work requirements, butbenefits can be higher because high-wage individuals no longer have an in-centive to apply. Another strand of the literature was that begun by Akerlof(1978), who showed that if individuals can be tagged as truly needy, theycan be given a greater G and lower t than they could under a noncategori-cal negative income tax. He likewise directly dealt with the incentive prob-lem to change categories by requiring that an incentive compatibility con-straint be set that would discourage such behavior. Although not directlyrelated to work requirements, it is easily extended in that direction. Unlikethe prior papers, Akerlof assumes that there are at least some observablesthat can be used to discriminate between different types of individuals.This literature is continuing with further refinements and special cases.48
The 1996 legislation has made these issues of renewed importance. The
342 Robert A. Moffitt
47. See Barth and Greenberg (1971), Browning (1975), Lurie (1975) for examples of theseearly critiques of work-requirement systems as compared to a negative income tax. Barth andGreenberg note that the drawbacks to a system that requires separating the employable andnonemployable was a principle criticism of the AFDC program as it existed in the 1960s.
48. For example, Chone and Laroque (2001) and Immonen et al. (1998). See also Parsons(1996) for an analysis, albeit in the context of social insurance programs, of the consequencesfor these models of assuming “two-sided” error—that is, that some tagged individuals can in-deed work as well as that some untagged individuals cannot work.
PRWORA requires states to more rigorously enforce work requirements byregularly assessing benefit penalties (called “sanctions”) on those who donot comply with the requirements (i.e., those who work less than Hmin). In-deed, to some extent the most important work-related feature in the legis-lation was the requirement that states, for the first time, actually enforce thebenefit reductions that figure 5.8 portrays. Within the federal guidelines,states now have much more freedom to assess sanctions than they did un-der the AFDC program, and many have adopted very stringent sanctionpolicies.49 The federal government has also tightened up the definition ofHmin, setting specific values for it such as twenty hours per week for singlemothers with children under six, for example. States are allowed to exemptfamilies from the work requirement (e.g., women who are ill or incapaci-tated, elderly, pregnant, or have a child under one year old), which can beinterpreted as the assignment of families to the “cannot work” status. How-ever, the federal legislation also sets numerical minimums on the fraction ofa state’s recipients that must be engaged in a work activity and most of theseexempt families are not excluded from the denominator of the ratio.
Time limits are a relatively new programmatic feature and have yet to besubjected to much economic analysis. In one sense time limits require nonew models because they simply eliminate welfare after some point andthis necessarily moves the individual to the nonwelfare constraint in figure5.5, thereby increasing labor supply and decreasing the welfare caseload.However, the dynamics of this response could be fairly complex if welfarerecipients anticipate the onset of time limits and alter their behavior beforehitting the limit. For example, similar to behavior that has been found forthe response to unemployment benefits with a fixed exhaustion point, wel-fare recipients may begin to leave welfare prior to the time limit date, andtheir leaving rates may accelerate as the time limit approaches. In the un-employment insurance (UI) case, this behavior is generally explained bythe randomness of wage offers and the desire to accept an attractive offerwhen it arrives even if it does so somewhat in advance of the benefit ex-haustion date. The same may apply for welfare recipients approaching atime limit. A more complex response can occur if recipients “bank” theirbenefits by going off the rolls during good (labor market) times and savingtheir benefits for bad times (a downturn in the labor market, unexpectednegative income shock, etc.).50 Whatever the model, time limits will tend toincrease labor supply and reduce welfare participation and the caseload.
The implementation of time limits in the states has been far from this
The Temporary Assistance for Needy Families Program 343
49. For example, as noted previously, in Georgia, two violations result in a lifetime ban onwelfare receipt. Lurie (2001, 4), in a study of implementation of sanctions in local welfareoffices, notes as well that discretion in using sanctions is widespread and inevitable: “Whilestates decide the amount of the sanctions, the decision to impose or lift a sanction is inevitablyat the discretion of the frontline worker.”
50. A few states have programs that allow recipients to receive benefits for a maximum of xyears out of every y years, y � x. This would set up cyclical welfare participation response aswell as banking within the y interval.
textbook portrayal. Many states have made liberal use of exemptions andextensions from time limits, resulting in many fewer families’ hitting thelimits than anticipated. In many cases these exemptions and extensionsare granted at the discretion of individual caseworkers and local welfareoffices, who make subjective judgments on whether recipients have madea good faith effort to find work. Other states have put in place programsfunded out of state revenues that will support families after they exhausttheir benefits, although sometimes at a reduced level and sometimes onlyfor the children. Still other states stop the clock from ticking if the recipi-ent works more than a specified number of hours of work, if the recipienthas not been offered a job training slot, or under other conditions. At thiswriting, many fewer families have exhausted their benefits than anticipatedfor all these reasons as well as because so many families have left the rolls;the latter could be either because of the favorable economy or from bank-ing behavior. However, despite these factors, in the long run the time limitwill bind on more families if it is kept in place.
Finally, the numerous additional costs and penalties that have been im-posed on welfare participation have resulted in many more involuntary ter-minations under TANF than were present under AFDC. Indeed, it is nolonger clear that a simple voluntary model of welfare participation—evenone with work requirements and time limits added to the model—ade-quately describes reality. Diversion programs and related devices to dis-courage women who apply for the rules can still be retained in a voluntarymodel but one in which the cost of application is much higher than before,discouraging application. The cost of being on welfare even after applyingand being accepted is also raised by the many rules that TANF recipientsmust obey, ranging from mandatory attendance at meetings with case-workers to compliance with child support enforcement, requirements forschool attendance (minor TANF mothers without a high degree only), andrequirements that children of the TANF mother have regular school at-tendance, receive immunization shots, or have health exams. Failure tocomply with any of these rules carries a penalty that may either reduce ben-efits or even terminate the families from the rolls. Finally, much anecdotalevidence suggests that welfare departments have exercised discretion topush women off welfare by using administrative devices to end eligibility.These administrative terminations were thought to be present in theAFDC program but are now much more common. This should probablybe modeled as a random involuntary termination rate from the program.
5.4.2 Evidence on TANF and Pre-TANF Waiver Reforms
As noted previously, the volume of research on TANF is necessarilymuch less than that for the AFDC program. In addition, the largest volumeof data analysis conducted on TANF is descriptive in nature and does notseek to estimate the effect of the 1996 legislation in a causal sense—that is,the effect of the legislation on outcomes relative to what would have hap-
344 Robert A. Moffitt
pened if the law had not been passed. The descriptive literature, for ex-ample, has demonstrated that poverty rates have mostly fallen since 1996,the TANF caseload has dropped by over 50 percent since 1994, womenwho have left the TANF rolls have employment rates of approximately 60percent, and there is a lower tail of the single-mother income distributionwhose income has fallen since 1996. Separating the PRWORA contribu-tion to these outcomes from the effects of general trends, the improvingeconomy, and other programmatic developments (e.g., EITC and Medic-aid expansions) is not attempted in this literature. The review to follow willinstead discuss only studies that attempt to make causal inferences.51
Table 5.9 lists the studies that have estimated the overall impact of 1990swelfare reform (i.e., the effect of all the individual components combined)on income, employment, and welfare participation outcomes.52 Studies ofthe effects of pre-1996 waiver reforms are shown in the first panel of thetable. Most of these studies made use of the differential timing at whichstates introduced their reforms in the pre-1996 period. With a few excep-tions, the studies show waivers to have had positive effects on most mea-sures of labor supply and negative effects on measures of AFDC partici-pation, as expected. All of these studies include variables for the stateunemployment rate or related cyclical variables in their models, and hencethe estimated effects of welfare reform are all intended to be net of thestrong economy.
Two exceptions to the results are Bartik and Eberts (1999) and Ziliak etal. (2000) who find very little effect of welfare reform, net of the economy,on the size of the AFDC caseload. The main difference between these twostudies and the others is that these two enter the lagged AFDC caseloadinto the regression model. The reduction in the estimated size of the effectof welfare reform is an indirect sign that states that implemented reformshad above-average caseloads and that caseloads regressed to the meanthereafter, causing a spuriously estimated decline in the caseload in thestudies that omit this lag. A debate has ensued over the econometric prop-erties of including lagged dependent variables in the models in question,which has not yet been resolved.53
Randomized trials are represented in two of the entries in table 5.9.
The Temporary Assistance for Needy Families Program 345
51. See Moffitt and Ver Ploeg (2001) for a list of all types of studies that have been con-ducted on TANF as of approximately spring 2001, including descriptive studies, as well as acomprehensive discussion of the alternative evaluation methodologies that have been used toestimate causal effects of welfare reform.
52. A number of studies are excluded from the table, including those conducted on a singlestate but which were not random assignment, and a number of random assignment evalua-tions that were discontinued or that have not produced results (Harvey, Camasso, and Jagan-nathan 2000 has a comprehensive list).
53. Klerman and Haider (2001) demonstrate that building up an aggregate caseload modelfrom a more fundamental set of entry and exit equations will necessarily result in the need forlags in the aggregate model. However, they argue that the caseload model that results fromthis aggregation is easily misspecified because of duration dependence and other propertiesof the underlying dynamic model.
Tab
le 5
.9S
tudi
es o
f the
Ove
rall
Eff
ect o
f Wel
fare
Ref
orm
on
Lab
or S
uppl
y, E
arni
ngs,
Inc
ome,
and
AF
DC
-TA
NF
Par
tici
pati
on
Stud
yP
rogr
am(s
) Stu
died
Dep
ende
nt V
aria
ble
Sour
ce o
f Pro
gram
Var
iati
onE
stim
ated
Eff
ect o
f Wel
fare
Ref
orm
Pre
-199
6 W
aive
r P
rogr
ams
Bar
tik
and
Ebe
rts
All
stat
e w
aive
r A
FD
C c
asel
oad
Cro
ss-s
tate
var
iati
on in
tim
ing
of
Ess
enti
ally
zer
o(1
999)
prog
ram
sw
aive
r in
trod
ucti
on
Bla
nk (2
001)
All
stat
e w
aive
r A
FD
C c
asel
oad
Cro
ss-s
tate
var
iati
on in
tim
ing
of
Neg
ativ
epr
ogra
ms
wai
ver
intr
oduc
tion
Blo
om a
nd
Wai
ver
prog
ram
s in
E
mpl
oym
ent,
ear
ning
s,
Ran
dom
ized
ass
ignm
ent o
n po
pu-
Posi
tive
eff
ect o
n em
ploy
men
t and
M
icha
lopo
ulos
(200
1)C
onne
ctic
ut, F
lori
da,
inco
me,
AF
DC
par
tici
-la
tion
of A
FD
C r
ecip
ient
sea
rnin
gs, n
o eff
ect o
n in
com
e, s
mal
l an
d V
erm
ont
pati
onor
zer
o eff
ects
on
AF
DC
par
tici
pa-
tion
Cou
ncil
of E
cono
mic
A
ll st
ate
wai
ver
AF
DC
cas
eloa
dC
ross
-sta
te v
aria
tion
in ti
min
g of
N
egat
ive
Adv
isor
s (1
997)
prog
ram
sw
aive
r in
trod
ucti
on
Fei
n et
al.
(200
1)W
aive
r pr
ogra
m in
E
mpl
oym
ent,
ear
ning
s,
Ran
dom
ized
ass
ignm
ent o
n po
pu-
Aft
er tw
o ye
ars,
no
effec
t on
em-
Del
awar
eA
FD
C p
arti
cipa
tion
lati
on o
f AF
DC
rec
ipie
nts
and
ploy
men
t and
ear
ning
s bu
t neg
a-ap
plic
ants
tive
eff
ect o
n A
FD
C p
arti
cipa
tion
Fig
lio a
nd Z
iliak
(199
9),
All
stat
e w
aive
r A
FD
C c
asel
oad
Cro
ss-s
tate
var
iati
on in
tim
ing
of
Ess
enti
ally
zer
oZ
iliak
et a
l. (2
000)
prog
ram
sw
aive
r in
trod
ucti
on
Moffi
tt (1
999a
)A
ll st
ate
wai
ver
AF
DC
par
tici
pati
on
Cro
ss-s
tate
var
iati
on in
tim
ing
of
No
effec
t on
empl
oym
ent o
r ea
rn-
prog
ram
sra
te, l
abor
sup
ply,
and
w
aive
r in
trod
ucti
onin
gs; p
osit
ive
effec
t on
wee
ks a
nd
earn
ings
of l
ess
edu-
hour
s w
orke
d; n
egat
ive
effec
t on
cate
d w
omen
AF
DC
par
tici
pati
on r
ate
Mue
ser
et a
l. (2
000)
Wai
ver
prog
ram
s in
five
A
FD
C e
ntry
and
exi
t C
ross
-sta
te v
aria
tion
in ti
min
g of
N
egat
ive
effec
t on
entr
y ra
te, p
osi-
urba
n ar
eas
rate
s, e
mpl
oym
ent r
ate
wai
ver
intr
oduc
tion
tive
eff
ect o
n ex
it r
ate,
pos
itiv
e bu
t of
wel
fare
leav
ers
smal
l eff
ect o
n em
ploy
men
t rat
e of
le
aver
s
O’N
eill
and
Hill
(200
1)A
ll st
ate
wai
ver
Em
ploy
men
t, A
FD
C
Cro
ss-s
tate
var
iati
on in
tim
ing
of
Posi
tive
on
empl
oym
ent,
neg
ativ
epr
ogra
ms
part
icip
atio
nw
aive
r in
trod
ucti
onon
AF
DC
par
tici
pati
on
Scho
eni a
nd B
lank
A
ll st
ate
wai
ver
Lab
or s
uppl
y, e
arni
ngs,
C
ross
-sta
te v
aria
tion
in ti
min
g of
Po
siti
ve e
ffec
ts o
n la
bor
supp
ly,
(200
0)pr
ogra
ms
inco
me,
AF
DC
par
tici
-w
aive
r in
trod
ucti
on c
ombi
ned
wit
h ea
rnin
gs, i
ncom
e; n
egat
ive
effec
ts
pati
ondi
ffer
ence
-in-
diff
eren
ce u
sing
hig
h-on
AF
DC
par
tici
pati
oned
ucat
ed c
ontr
ol g
roup
Wal
lace
and
Bla
nk
All
stat
e w
aive
r A
FD
C c
asel
oad
Cro
ss-s
tate
var
iati
on in
tim
ing
of
Neg
ativ
e(1
999)
prog
ram
sw
aive
r in
trod
ucti
on
Zili
ak e
t al.
(200
0)A
ll st
ate
wai
ver
AF
DC
cas
eloa
dC
ross
-sta
te v
aria
tion
in ti
min
g of
Z
ero
(or
posi
tive
)pr
ogra
ms
wai
ver
intr
oduc
tion
TAN
FC
ounc
il of
Eco
nom
ic
—A
FD
C-T
AN
F c
asel
oad
Cro
ss-s
tate
var
iati
on in
tim
ing
of
Neg
ativ
eA
dvis
ors
(199
9)T
AN
F im
plem
enta
tion
Ellw
ood
(200
0)—
Em
ploy
men
t, e
arni
ngs
Diff
eren
ce-i
n-di
ffer
ence
wit
h hi
gh-
Can
not s
epar
ate
effec
t of E
ITC
w
age
cont
rol g
roup
and
wel
fare
ref
orm
McK
erna
n et
al.
(200
0)—
Em
ploy
men
tD
iffer
ence
-in-
diff
eren
ce w
ith
child
-Po
siti
vele
ss w
omen
con
trol
gro
up
O’N
eill
and
Hill
(200
1)—
Em
ploy
men
t, A
FD
C-
Cro
ss-s
tate
var
iati
on in
tim
ing
of
Posi
tive
on
empl
oym
ent,
neg
ativ
e T
AN
F p
arti
cipa
tion
TA
NF
impl
emen
tati
onon
AF
DC
-TA
NF
par
tici
pati
on
Scho
eni a
nd B
lank
—
Lab
or s
uppl
y, e
arni
ngs,
D
iffer
ence
-in-
diff
eren
ce w
ith
high
-N
o eff
ect o
n la
bor
supp
ly o
r in
di-
(200
0)in
com
e, A
FD
C-T
AN
F
educ
ated
con
trol
gro
upvi
dual
ear
ning
s, p
osit
ive
effec
t on
part
icip
atio
nfa
mily
ear
ning
s an
d in
com
e, n
ega-
tive
eff
ect o
n A
FD
C-T
AN
F p
arti
c-ip
atio
n
Wal
lace
and
Bla
nk
—A
FD
C c
asel
oad
1996
+ y
ear
dum
my
Neg
ativ
e(1
999)
Not
e:D
ashe
s in
dica
te th
at p
rogr
am s
tudi
ed is
TA
NF.
These studies made use of traditional random-assignment methods ratherthan cross-state variation to estimate the effects of reform. These studiesgenerally also find positive effects on employment and earnings and nega-tive effects on welfare participation, like the nonexperimental studies.54
However, the estimated effects on both income and welfare participationare considerably smaller than those estimated from the nonexperimentalliterature. This may be because random-assignment methods are not wellsuited for major structural reforms like the pre-1996 welfare waivers—orfor TANF itself—because such structural reforms tend to cause changes inlocal labor markets and local communities that feed back onto the controlgroup. The policy-induced changes in the economic and programmatic en-vironment, and in the expectations of the eligible population for what levelof work is to be required of welfare recipients, are unlikely not to haveaffected the control group. This is likely to have made control and experi-mental group behavior more similar and therefore to have biased estimatedeffects downward. Another important difference between experimentaland nonexperimental estimates is that the former cannot capture entryeffects, whereas the latter can. Much of the effect of welfare reform on thecaseload, and therefore also on labor supply and earnings, has occurredthrough decreased entry onto welfare. This will also lead to bias in the ex-perimental estimates.
The more important policy issue is the effect of TANF, for the welfarewaivers fell far short of the major restructuring that occurred after 1996and hence cannot be taken as predictive of the effects of TANF. Unfortu-nately, estimating TANF effects is more difficult than estimating the effectsof waivers because the vast majority of the states more or less implementedTANF at the same time, leaving no cross-state variation in the timing of in-troduction to use for estimation. Two studies made use of the fact that fouror five states actually implemented reforms somewhat later than the rest ofthe states, but this source of variation is unlikely to be reliable becausethere may have been unique differences between those states and the oth-ers which were correlated with their late implementation, and becausethere are likely to be significant lags in the effects of the reforms. Most stud-ies have, instead, used difference-in-difference methods which comparetrends in outcomes for low-wage or less-educated single mothers to trendsin outcomes of various other groups (high-wage or highly educated singlemothers, or women who are not single mothers) to assess the effect of wel-fare reform. As Ellwood (2000) and Schoeni and Blank (2000) note, use ofthese methods is particularly problematic when other reforms, such as theEITC, were occurring roughly simultaneously, and when business-cycle and
348 Robert A. Moffitt
54. There have been many more random-assignment studies in this period, but those listedin table 5.9 are those that had the main features of PRWORA, namely, time limits, work re-quirements, sanctions, and enhanced earnings disregards, and that made these reforms withinthe AFDC system rather than outside of it.
economywide trends were occurring that could affect different groups dif-ferently. Ellwood concludes that these difficulties are sufficiently severe thatthe separate contributions of welfare reform, the EITC, and the economycannot be identified. The only remaining studies in the table (excludingWallace and Blank 1999, which uses pure time series variation) are Mc-Kernan et al. (2000) and Schoeni and Blank (2000), one of which finds TANFto have increased employment, whereas the other finds it not to have doneso but to have affected family earnings, income, and AFDC participation.The two studies used different control groups, so this may be the source ofthe difference. What evidence there is, therefore, indicates some TANFeffects in the expected direction, but the small number of studies and prob-lems in statistical inference make the conclusions rather uncertain.
There have also been a number of studies that have attempted to esti-mate the separate effects of different components of pre-1996 waiver re-forms or of TANF, such as time limits, work requirements, sanctions, earn-ings disregards, and other features. Unfortunately, the results from thesestudies have been inconsistent with each other (often providing opposite-signed effects) have generated many insignificant effects, and have gener-ally yielded an uninterpretable set of findings.55 There are many likely rea-sons for this pattern, including the enormous proliferation of differentpolicies across the states and the difficulty in accurately characterizingthose differences with a few simple variables; inherent difficulty in separat-ing the effects of one component from another when they no doubtstrongly interact; differences in the official characterization of policiesfrom those implemented in practice; and lack of statistical power in thedata to detect reasonable-sized effects. For whatever reason, despite theinitial view that the devolution that would follow PRWORA would gener-ate useful cross-state variation in policies for research, very little progresshas been made in that direction to date.56
There has been some research as well on the impact of pre-1996 waiversand TANF on demographic outcomes such as marriage, fertility, and liv-ing arrangements. The direction of impact of reform on marriage and fer-tility is ambiguous at the simplest level, for although a reduction in thecaseload and generosity of a program that mainly supports one-parentfamilies should have positive effects on marriage and negative effects onchildbearing, an increase in women’s employment should have the oppo-site effects, as demonstrated by a large empirical literature on the effect of
The Temporary Assistance for Needy Families Program 349
55. See Bell (2001) for a discussion of the results with caseloads as a dependent variable.56. In addition, with a few exceptions, there have been no random-assignment evaluations
that have varied each feature of reform individually while holding all the other features fixed,even though this is possible in principle in an experiment. It should also be noted that Grog-ger (2000, 2001) has attempted to estimate the independent effects of time limits by using agevariation in children combined with assumptions that that variation does not interact identi-cally with other welfare reform features. The validity of the assumptions needed for thesemethods to be valid is unknown.
female wages and labor supply on marriage and fertility. In addition tothese broad factors, TANF allows states to impose family caps (restrictionson additional benefits from extra births while on welfare) and denies ben-efits to minor mothers who wish to live apart from their families, both ofwhich should be expected to have direct effects on family structure.
The evidence to date on the presence of an effect of welfare reform as awhole on these outcomes is suggestive of a weak effect, at best. Analyses ofpre-1996 waivers are inconsistent, with some showing a negative effect onnonmarital fertility (Horvath and Peters 1999) and others showing noeffect (Fitzgerald and Ribar 2001). Analyses of TANF using difference-in-difference methods, comparing either more-educated and less-educatedwomen or high-wage and low-wage women, show no effect of TANF onmarriage but possibly a negative effect on living independently (Ellwood2000; Schoeni and Blank 2000). Bitler, Gelbach, and Hoynes (2002) founda positive effect of TANF on the likelihood that a child lives with neitherparent and a negative effect on the probability of living with an unmarriedparent, but the effects were estimated only on cross-state variation inTANF implementation dates within a fourteen-month window. Random-assignment evaluations are particularly problematic for the study of fam-ily structure because of the entry-effect problem and the problems ofcontamination noted earlier. Of those noted in table 5.9, only one (theDelaware study) showed a significant effect on marriage. The reason thatparticular experiment showed an effect and others did not is not clear.
The evidence on the specific effects of family caps and living arrange-ments restrictions in the law is quite weak, for the same reason that sepa-rating the impacts of the individual components of welfare reform fromeach other has not been successful in the study of employment and earn-ings impacts. Some waiver evaluations, particularly one conducted in NewJersey (Camasso et al. 1998a, b), have been used to assess the effects of fam-ily caps, but these evaluations are problematic because the family cap wasbundled in with changes in work requirements, earnings disregards, andother features common in welfare waiver programs. Thus there is no directevidence from random-assignment evaluations of family cap effects be-cause none has varied the presence of the family cap, holding other reformfeatures fixed.
Finally, there has been considerable analysis of the effect of the blockgrant structure of TANF on spending on the poor. As noted previously, theshift from a matching to a block grant should be expected to reduce spend-ing. Predictions of the magnitude of the spending decline depend directlyon the size of the price elasticity of benefits, which, as noted before, is notagreed upon in the empirical literature. Ribar and Wilhelm (1999) predictvery small reductions, whereas Chernick (1998) predicts benefit declines inthe range of 15 to 30 percent (see also Chernick and McGuire 1999); In-man and Rubinfeld (1997) predict spending declines of 40 to 66 percent in
350 Robert A. Moffitt
low-income states and 0 to 18 percent in high-income states. In addition,there has been considerable speculation that there will be a “race to thebottom,” as states facing a higher price of benefits become more sensitiveto the influence of cross-state migration in search of higher benefits, lead-ing to a cascading series of real benefit cuts across the states. Theoreticalwork supports this intuitive prediction, and simulations suggest that ben-efits could be seriously underproduced in such a system relative to the so-cial optimum (Brueckner 2000; Wheaton 2000).
To date, none of these predictions have been capable of testing becausethe block grant levels in the 1996 legislation were set at 1994 AFDC levels.Because the AFDC-TANF caseload has fallen so drastically since 1994,states have generally not been able to spend all of their block grant funds.Thus the block grant constraint has not become binding, and hence oneshould not expect either the (extra) spending declines or the race to thebottom predicted in the literature to have occurred. Further work on thisissue must await a rise in spending up to the block grant level.57
5.5 Reforms: Financial Incentives
Most reform discussions at the current point in the evolution of theAFDC-TANF program concern whether the provisions of the 1996 wel-fare law should be modified in some way, such as changing or removing thetime limits, work requirements, rules governing sanctions, block grant andfunding formulas, and the like. There has been no research on the effects ofaltering these provisions beyond what has already been discussed in the re-view of research on AFDC and TANF; as noted, the research base for fore-casting the effects of altering most of these provisions is exceedingly slim.
One area of discussion where economists have a strong research base isin the area of additional financial incentives to encourage TANF recipientsto work, which is the traditional area of interest in the economics literature.Three different types of reforms have been discussed: (a) reductions in thetax rate on earnings in the TANF program (or what are called “enhancedearnings disregards” in policy discussions); (b) earnings or wage subsidiesmade available only to those on TANF; and (c) earnings or wage subsidiesmade available universally to the low-income population. Each will be dis-cussed in turn.
Reductions in the tax rate on earnings have been enacted by many states
The Temporary Assistance for Needy Families Program 351
57. In fact, TANF spending by the states stopped declining in 1998 and has risen since then,even though the economy was still strong, because states began spending their funds on an-cillary services like child care. If this trend continues, it is likely that a relatively modest re-cession could force spending up to the block grant level. Other issues debated in the literatureare the adequacy of countercyclical funds to alleviate the potential spending volatility undera block grant system, and how to reduce inequities in the block grants to high- and low-income states.
in their post-reform benefit schedules, as noted earlier in this review, as ameans to encourage work among recipients in addition to work require-ments. Economic models predict that the effect of reducing welfare tax rateson labor supply is ambiguous in sign because new recipients are drawn ontothe welfare rolls, whose labor supply is thereby reduced. The majority of theevidence, both from nonexperimental and negative income tax (NIT) ex-perimental studies, indicates that the net effect of such reductions on laborsupply is approximately zero. This should, therefore, be the prediction oneshould make for the recent tax rate reductions enacted by the states.
A few recent experiments have addressed the labor supply effects of re-duced welfare tax rates and have shown, instead, that they generally in-crease earnings and employment (Berlin 2000; Blank, Card, and Robins2000). However, the majority of these experiments only test the effects ofreduced tax rates on those who are initially on welfare, and, for that group,positive effects on labor supply should occur. Consequently, although theexperimental results are of value because they confirm, in broad outlines,the predictions of the static labor supply model for how initial recipientswould respond, they do not contradict the literature from prior economet-ric studies and the NIT experiments because they do not account for theoffsetting labor supply effects of new entry.58
A new element in recent discussions, however, is an emphasis on cou-pling work requirements and minimum hours restrictions with tax rate re-ductions. The argument is that the work requirement limits the negative la-bor supply effects that serve as an offset to the work incentives of tax ratereductions and is thus superior to welfare programs with tax rate reduc-tions but no work requirements, and that tax rate reductions accompaniedby such restrictions are more likely to increase labor supply.59 However, this
352 Robert A. Moffitt
58. See Blank, Card, and Robins (2000) for a discussion of entry and how it might be re-duced by imposing barriers such as a waiting period before the financial incentives are allowed(see also Card, Robins, and Lin 1998). Berlin (2000, 35) also draws a contrast between the find-ings of these recent experiments and those of the NIT experiments, noting that the NIT re-duced labor supply whereas the tax rate reductions in the new experiments increased laborsupply. However, this is not a proper comparison because the negative labor supply effects inthe NIT experiments pertained to the effect of an NIT versus nothing at all (i.e., the treatment–control group comparison), which is expected to be negative from simple theory. In fact, asnoted previously, the alternative treatment groups in the NIT experiments that tested alterna-tive welfare tax rates holding the guarantee fixed found generally a zero net effect on laborsupply, consistent with the findings of complete offset in nonexperimental econometric mod-els. The NIT experiments included not just recipients but rather a sample of the entire low-income population, so that the offsetting, negative effects of lowering the tax rate were cap-tured by the comparison of outcomes across alternative treatment groups. This is entirelyconsistent with a positive effect on labor supply of those initially on welfare, and therefore theresults of the NIT experiments and recent recipient-only experiments are not inconsistent.
59. Again, see Berlin (2000) and Blank, Card, and Robins (2000) for a discussion of theseprograms, such as New Hope and the SSP program. Some of the programs tested in thesedemonstrations allowed recipients to take their “earnings supplements” (i.e., benefits) offwelfare. However, in the type of pure transfer program illustrated in figure 5.8, it is immate-rial whether individuals receiving benefits in the region above point K are called welfare re-cipients or not; they are incontrovertibly welfare recipients in the behavioral sense.
is an incorrect comparison because, as discussed previously, work require-ments achieve their positive effects on labor supply by eliminating govern-ment support for those who do not work, which is the rationale for an in-come support program in the first place. Consequently, they must beaccompanied by a categorization of the population into those who can andcannot work. The relative merits of the two approaches depend on whetherthe stronger labor supply effects provided by the work requirement systemare countered by the inefficiencies, disincentives, and possible inequitiescreated by a feasible categorization system.
Some programs with such minimum full-time work conditions havebeen voluntary instead of mandatory (e.g., New Hope, Self-SufficiencyProgram [SSP], and some treatments in the Minnesota Family InvestmentProgram [MFIP]). That is, the greater benefits made possible by the reduc-tion in the tax rate, and which are available only if hours worked are closeto full time, are simply offered to the recipient as an option. Such a pro-gram is not a work requirement program at all but is instead just an NITwith part of the budget constraint deleted (namely, the portion in the part-time range). Relative to an NIT with no hours restrictions, a voluntary pro-gram of this type would affect labor supply in an ambiguous direction, assome who would have worked part time chose to work full time but somechose not to work at all. Relative to a program with a tax rate of 100 per-cent, however, such a restricted tax reduction is indeed more likely to in-crease labor supply than an unrestricted NIT. But that does not mean thatit is preferable, because then the issue is why part-time work is not desirableand why the benefits of work supplements should be denied to those whocan only work part-time, some of whom will instead choose not to workat all.60
The second type of program, offering wage or earnings subsidies to wel-fare recipients instead of reducing welfare tax rates, has essentially thesame effect if those subsidies are permitted only for those who remain onwelfare. It is immaterial whether an increase in W(1 – t) comes from an in-crease in W or a reduction in t.61 The major alternative proposal is insteadthat welfare recipients be allowed to carry those subsidies off the welfarerolls and to keep them after exiting. The effect of this reform on the budget
The Temporary Assistance for Needy Families Program 353
60. This illustrates the more general principle that increases in labor supply should not bethe sole criterion for judging a reform because it must always take into account how the rela-tive benefits of program expenditure are spread across individuals at different points on thebudget constraint and therefore different points in the income distribution. For example, itshould always be possible in principle to increase labor supply simply by offering the popula-tion a large increase in income to anyone willing and able to work high enough hours; that isincontrovertible. But that costs money, and the proper comparison for such a program is in-stead with an equal-expenditure program which would therefore have to reduce funds goingto low-hours workers. The issue of distributional weights, and the relevant optimal tax prob-lem, cannot be avoided.
61. The two may have different effects around the break-even level, however depending onhow the phaseout and cutoff of the earnings or subsidy are handled. A simple graphical anal-ysis easily demonstrates this (not shown for brevity).
constraint is shown in figure 5.9, where CDE is the initial constraint andCD�E� is the constraint after the subsidy is implemented.62 Assuming thatsubstitution effects dominate income effects and therefore that laborsupply curves for this population group are forward-bending, this changehas an unambiguously positive effect on labor supply relative to the initialwelfare program for those initially on the welfare portion of the constraint.The drawbacks to such subsidies are the same as those for a universal wageor earnings subsidy, to be considered next.
It is worth noting that this type of program would approach that of a uni-versal subsidy program if (a) those who carry the subsidy off the programare allowed to keep it indefinitely and (b) all eligibles in the population havea finite probability of entering the program within their lifetimes. If both ofthese conditions hold, all eligibles, including those initially on segmentDE, will eventually cycle through the program and hence will have the sub-sidy available to them off welfare.
The third reform is indeed the offer of a universal earnings or wage sub-sidy to all low-income families. Graphically, this is identical to figure 5.9except that those initially off welfare, on segment DE, are also eligible. Therelative merits of wage rate and earnings subsidies, on the one hand, and
354 Robert A. Moffitt
Fig. 5.9 Effect of earnings subsidy on budget constraint
62. Assuming the subsidy is s percent of earnings, the on-welfare portion of the constraint,segment CD�, has slope W(1 � s)(1 – t), while the off-welfare portion of the constraint, seg-ment D�E�, has slope W(1 � s). This assumes that the subsidy is included in countable incomeby the welfare agency along with presubsidy earnings; if it does not, the on-welfare portion ofthe constraint has slope W(1 – t � s). The figure assumes t � 1.0, but all statements in the textapply as well for t 1.
an NIT or similar income support program with a G and t, on the other,were debated extensively in the late 1960s and early 1970s (e.g., Barth andGreenberg 1971; Garfinkel 1973; Kesselman 1969, 1973; Zeckhauser1971). That literature showed that there will almost certainly be positiveeffects on labor supply if an income support program is completely re-placed by a wage or earnings subsidy. This should not be surprising sincebenefits are no longer paid to nonworkers under a wage or earnings sub-sidy, and since, from a equity and distributional point of view, a progres-sive tax system is replaced by a regressive one. As this early literature rec-ognized (Kesselman 1969; Barth and Greenberg 1971), and has been notedin this review, replacing an income support program with such a subsidywould require a categorization of the eligible population that has its owndifficulties which would have to be factored into the comparison.
The literature also addressed the relative merits of wage rate versus earn-ings subsidies. In general, the former were shown to be superior but wereacknowledged to have implementation problems created by the need foremployers and workers to document hours of work, and the strong incen-tives for fraudulent reporting of those hours and for collusion betweenworkers and employers to overreport hours worked. To date, these difficul-ties have prevented a wage rate subsidy from being enacted in the UnitedStates. Earnings subsidies, on the other hand, have the disadvantage thatthey must be phased out at some earnings level; at and above that point, la-bor supply disincentives are created.63 The corresponding issue for welfarereform is how eligibility for a universal earnings or wage subsidy programaimed at the welfare-eligible population would be determined. If family in-come is used as the eligibility criterion, then a notch will be created at thatincome level where the subsidy is lost, creating disincentives to go beyondthat point as well as incentives for those with higher income to reduce la-bor supply to become eligible. Alternatively, if the subsidy is phased outgradually, as it is in earnings subsidies such as the EITC, then work disin-centives will be created in that region, which will have to be counted againstthe positive labor supply incentives created at lower earnings levels. Thusthe offsetting effects of earnings subsidies on labor supply cannot beavoided.64
The Temporary Assistance for Needy Families Program 355
63. See the chapter on the EITC (Hotz and Scholz, chap. 3 in this volume) for a discussion.64. Once again, an alternative program offers universal earnings subsidies to low-income
families but with a minimum hours constraint. As before, the increased labor supply effectsof this program would have to be balanced by the increased need for categorization of thepopulation, at least if it were made mandatory. If it is made voluntary, then, as noted previ-ously, the only issue is whether part-time work should not also be subsidized. It should alsobe noted that, with a mandatory minimum hours constraint, there is little difference betweena wage or earnings subsidy program and an NIT-like income support program with a reducedtax rate, for the two only differ in the nature of the budget constraint above the hours con-straint point. If the major labor supply decision is the margin between working at the con-straint point or locating below it off welfare, the two programs would have the same effects.
5.6 Summary
Although the 1996 legislation is now six years past, the TANF programmust still be regarded as being in a state of transition and not as havingfully coalesced into a final form. The implementation of the program, aswell as myriad of its provisions, such as the imposition of stricter work re-quirements with more rigorously enforced sanctions for noncomplianceand the imposition of time limits, continues to evolve. States are continu-ing to modify their programs and attempt to change them over time, asthey search for new ways to deal with the difficulties of the population thatthey aim to serve. The uncertainties created by a possible recession, the in-creasing impact of time limits as more recipients hit those limits over thenext few years, and the possibility of further congressional action, all havethe potential to lead to further modifications in the program.
While research on the AFDC program is still useful in many ways, andwhile the models developed for that program are still applicable to TANF,there are many new features of TANF whose effects cannot be easily ex-trapolated from AFDC research results. At the same time, direct evalua-tion of the effects of the TANF program, particularly the evaluation of theindependent contributions of its separate individual components, posesmany empirical challenges. Although the evidence to date is reasonablystrong that the TANF program has increased employment and earningsand decreased the caseload, relative to what would have occurred if AFDChad remained in place, the separate effects of work requirements, time lim-its, sanctions, family caps, and other individual features are essentially un-known. These continuing research challenges, as well as those posed by ad-ditional modifications in the TANF program as they occur, will provide arich agenda for further research.
References
Aaron, H. 1973. Why is welfare so hard to reform? Washington, D.C.: Brookings In-stitution.
Akerlof, G. 1978. The economics of “tagging” as applied to the optimal income tax,welfare programs, and manpower planning. American Economic Review 68(March): 8–19.
Alm, J., S. Dickert-Conlin, and L. Whittington. 1999. Policy watch: The marriagepenalty. Journal of Economic Perspectives 13 (Summer): 193–204.
Baicker, K. 2001. Extensive or intensive generosity? The price and income effects offederal grants. NBER Working Paper no. 8384. Cambridge, Mass.: National Bu-reau of Economic Research, July.
Bane, M. J., and D. Ellwood. 1983. The dynamics of dependence: The routes toself-sufficiency. Cambridge, Mass.: Urban Systems Research and Engineering,Inc.
356 Robert A. Moffitt
———. 1994. Understanding welfare dynamics. In Welfare realities: From rhetoricto reform, ed. M. J. Bane and D. Ellwood, 119–57. Cambridge: Harvard Univer-sity Press.
Barth, M., and D. Greenberg. 1971. Incentive effects of some pure and mixed trans-fer systems. Journal of Human Resources 6 (Spring): 149–70.
Bartik, T., and R. Eberts. 1999. Examining the effect of industry trends and struc-ture on welfare caseloads. In Economic conditions and welfare reform, ed. S.Danziger, 119–57. Kalamazoo, Mich.: Upjohn Institute.
Beaudry, P., and C. Blackorby. 1998. Taxes and employment subsidies in optimalredistribution programs. NBER Working Paper no. 6355. Cambridge, Mass.:National Bureau of Economic Research.
Bell, S. 2001. Why are caseloads falling? Discussion Paper no. 01-02. Washington,D.C.: The Urban Institute.
Berlin, G. 2000. Encouraging work, reducing poverty: The impact of work incen-tive programs. New York: Manpower Demonstration Research Program.
Besley, T., and S. Coate. 1992a. Understanding welfare stigma: Taxpayer resent-ment and statistical discrimination. Journal of Public Economics 48 (July): 165–63.
———. 1992b. Workfare versus welfare: Incentive arguments for work require-ments in poverty-alleviation programs. American Economic Review 82 (March):249–61.
———. 1995. The design of income maintenance programmes. Review of EconomicStudies 62 (April): 187–221.
Bitler, M., J. Gelbach, and H. Hoynes. 2002. The impact of welfare reform on liv-ing arrangements. NBER Working Paper no. 8784. Cambridge, Mass.: NationalBureau of Economic Research.
Blackorby, C., and D. Donaldson. 1988. Cash versus kind, self-selection, and effi-cient transfers. American Economic Review 78 (September): 691–700.
Blank, R. 2001. What causes public assistance caseloads to grow? Journal of Hu-man Resources 36 (Winter): 85–118.
Blank, R., D. Card, and P. Robins. 2000. Financial incentives for increasing workand income among low-income families. In Finding jobs: Work and welfare re-form, ed. D. Card and R. Blank, 373–419. New York: Russell Sage Foundation.
Blank, R., and P. Ruggles. 1994. Short-term recidivism among public assistance re-cipients. American Economic Review 84 (May): 49–53.
———. 1996. When do women use Aid to Families with Dependent Children andfood stamps? Journal of Human Resources 31 (Winter): 57–89.
Blau, F., L. Kahn, and J. Waldfogel. 2000. Understanding young women’s marriagedecisions: The role of labor and marriage market conditions. Industrial and La-bor Relations Review 53 (July): 624–47.
Bloom, D., and C. Michalopoulos. 2001. How welfare and work policies affect em-ployment and income: A synthesis of research. New York: Manpower Demon-stration Research Corporation.
Browning, E. 1975. Redistribution and the welfare system. Washington, D.C.:American Enterprise Institute.
Brueckner, J. 2000. Welfare reform and the race to the bottom: Theory and evi-dence. Southern Economic Journal 66 (January): 505–25.
Burke, V. 1996. New welfare law: Comparison of the New Block Grant Programwith Aid to Families with Dependent Children. Report no. 96-720EPW. Wash-ington, D.C.: Congressional Research Service.
Burtless, G. 1995a. Employment prospects for welfare recipients. In The work al-ternative: Welfare reform and the realities of the job market, ed. D. S. Nightingaleand R. Haveman, 71–106. Washington, D.C.: Urban Institute.
The Temporary Assistance for Needy Families Program 357
———. 1995b. What is the proper balance among various types of welfare-to-workprograms? In Looking before we leap: Social science and welfare reform, ed. R.Weaver and W. Dickens, 52–57. Washington, D.C.: Brookings Institution.
Camasso, M., C. Harvey, R. Jagannathan, and M. Killingsworth. 1998a. A final re-port on the impact of New Jersey’s Family Development Program: Experimen-tal-control analysis. New Brunswick: Rutgers University School of Social Work.
———. 1998b. A final report on the impact of New Jersey’s Family DevelopmentProgram: Results from a pre-post analysis of AFDC case heads from 1990–1996.New Brunswick: Rutgers University School of Social Work.
Card, D., P. Robins, and W. Lin. 1998. Would financial incentives for leaving wel-fare lead some people to stay on welfare longer? An experimental evaluation of“entry effects” in the self-sufficiency project. NBER Working Paper no. 6449.Cambridge, Mass.: National Bureau of Economic Research.
Chernick, H. 1998. Fiscal effects of block grants to the needy: An interpretation ofthe evidence. International Tax and Public Finance 5:205–33.
Chernick, H., and T. McGuire. 1999. The states, welfare reform, and the businesscycle. In Economic conditions and welfare reform, ed. S. Danziger, 275–303. Kala-mazoo, Mich.: Upjohn Institute.
Chone, P., and G. Laroque. 2001. Optimal incentives for labor force participation.INSÉÉ Working Paper no. 2001-25. Paris: Institut National de la Statistique etdes Études Économiques.
Council of Economic Advisors. 1997. Explaining the decline in welfare receipt,1993–1996. Washington, D.C.: Council of Economic Advisors.
———. 1999. The effects of welfare policy and the economic expansion on welfarecaseloads: An update. Washington, D.C.: Council of Economic Advisors.
Cuff, K. 2000. Optimality of workfare with heterogeneous preferences. CanadianJournal of Economics 33 (February): 149–74.
Danziger, S., R. Haveman, and R. Plotnick. 1981. How income transfers affectwork, savings, and the income distribution. Journal of Economic Literature 19(September): 975–1028.
Devere, C., G. Falk, and V. Burke. 2000. Welfare reform research: What have welearned since the Family Support Act of 1988? Washington, D.C.: CongressionalResearch Service.
Dye, R., and R. Antle. 1976. Cost-minimizing welfare programs. Journal of PublicEconomics 30 (July): 259–65.
Ellwood, D. 1986. Targeting the would-be long-term recipient: Who should beserved. Princeton, N.J.: Mathematica Policy Research.
———. 2000. The impact of the Earned Income Tax Credit and social policy re-forms on work, marriage, and living arrangements. National Tax Journal 53, pt.2 (December): 1063–105.
Ellwood, D., and M. J. Bane. 1985. The impact of AFDC on family structure andliving arrangements. In Research in labor economics, vol. 7, ed. R. Ehrenberg,Greenwich: JAI Press.
Evenhouse, E., and S. Reilly. 1999. Pop-swapping? Welfare and children’s livingarrangements. Vanderbilt University, Department of Economics. Mimeograph.
Fein, D., D. Long, J. Behrens, and W. Lee. 2001. The ABC evaluation: Turning thecorner: Delaware’s a better chance welfare reform program at four years. Cam-bridge: Abt Associates.
Figlio, D., and J. Ziliak. 1999. Welfare reform, the business cycle, and the decline inAFDC caseloads. In Economic conditions and welfare reform, ed. S. Danziger, 17–48. Kalamazoo, Mich.: Upjohn Institute.
Fitzgerald, J. 1995. Local labor markets and local area effects on welfare duration.Journal of Policy Analysis and Management 14 (Winter): 43–67.
358 Robert A. Moffitt
Fitzgerald, J., and D. Ribar. 2001. The impact of welfare waivers on female head-ship decisions. George Washington University, Department of Economics.Mimeograph.
Foster, E. M., and S. Hoffman. 2001. The young and the not quite so young: Agevariation in the impact of AFDC benefits on nonmarital childbearing. In Out ofwedlock: Causes and consequences of nonmarital childbearing, ed. L. Wu and B.Wolfe, 173–201. New York: Russell Sage Foundation.
Fraker, T., R. Moffitt, and D. Wolf. 1985. Effective tax rates and guarantees in theAFDC program, 1967–1982. Journal of Human Resources 20 (Spring): 251–63.
Freedman, S. 2000. Four-year impacts of ten programs on employment stabilityand earnings growth. New York: Manpower Demonstration Research Corpora-tion.
Friedlander, D., and G. Burtless. 1995. Five years after: The long-term effects of wel-fare-to-work programs. New York: Russell Sage Foundation.
Friedman, M. 1962. Capitalism and freedom. Chicago: University of Chicago Press.Gallagher, L. J., M. Gallagher, K. Perese, S. Schreiber, and K. Watson. 1998. One
year after federal welfare reform: A description of state Temporary Assistance forNeedy Families (TANF) decisions as of October 1997. Washington, D.C.: UrbanInstitute.
Garfinkel, I. 1973. A skeptical note on “the optimality” of wage subsidy programs.American Economic Review 63 (June): 447–53.
Garfinkel, I., and S. McLanahan. 1986. Single mothers and their children. Wash-ington, D.C.: Urban Institute Press.
Giannarelli, L., and M. Wiseman. 2000. The working poor and the benefit door.Washington, D.C.: Urban Institute.
Gottschalk, P., and R. Moffitt. 1994. Welfare dependence: Concepts, measures,and trends. American Economic Review 84 (May): 38–42.
Gramlich, E. 1982. An econometric examination of the new federalism. BrookingsPapers on Economic Activity, Issue no. 2:327–70. Washington, D.C.: BrookingsInstitution.
Greenberg, D., R. Meyer, C. Michalopoulos, and M. Wiseman. 2001. Explainingvariation in the effects of welfare-to-work programs. Discussion Paper no. 1225-01. Madison, Wis.: Institute for Research on Poverty.
Grogger, J. 2000. Time limits and welfare use. NBER Working Paper no. 7709.Cambridge, Mass.: National Bureau of Economic Research.
———. 2001. The effects of time limits and other policy changes on welfare use,work, and income among female-headed families. NBER Working Paper no.8153. Cambridge, Mass.: National Bureau of Economic Research.
Gueron, J., and M. Pauly. 1991. From welfare to work. New York: Russell Sage.Harris, K. 1993. Work and welfare among single mothers in poverty. American
Journal of Sociology 99 (September): 317–52.———. 1996. Life after welfare: Women, work, and repeat dependency. American
Sociological Review 61 (June): 407–26.Harvey, C., M. Camasso, and R. Jagannathan. 2000. Welfare reform evaluation un-
der section 1115. Journal of Economic Perspectives 14 (fall): 165–88.Hoffman, S., and E. M. Foster. 2000. AFDC benefits and nonmarital births to
young women. Journal of Human Resources 35 (spring): 376–91.Horvath, A., and H. Peters. 1999. Welfare waivers and non-marital childbearing.
Cornell University, Department of Policy Analysis and Management. Mimeo-graph.
Hotz, V. J., G. Imbens, and J. Klerman. 2000. The long-term gains from GAIN: Are-analysis of the impacts of the California GAIN Program. NBER Working Pa-per no. 8007. Cambridge, Mass.: National Bureau of Economic Research.
The Temporary Assistance for Needy Families Program 359
Hoynes, H. 1996. Welfare transfers in two-parent families: Labor supply and wel-fare participation under AFDC-UP. Econometrica 64 (March): 295–332.
———. 1997. Work, welfare, and family structure: What have we learned? In Fis-cal policy: Lessons from economic research, ed. A. Auerbach, 101–46. Cambridge:MIT Press.
———. 2000. Local labor markets and welfare spells: Do demand conditions mat-ter? Review of Economics and Statistics 82 (August): 351–68.
Hoynes, H., and T. MaCurdy. 1994. Has the decline in benefits shortened welfarespells? American Economic Review 84 (May): 43–48.
Hu, W. 2001. Welfare and family stability. Journal of Human Resources 36 (spring):274–303.
Hubbard, G., J. Skinner, and S. Zeldes. 1995. Precautionary saving and social in-surance. Journal of Political Economy 103 (April): 360–99.
Hutchens, R., G. Jakubson, and S. Schwartz. 1989. AFDC and the formation ofsubfamilies. Journal of Human Resources 24 (fall): 599–628.
Immonen, R., R. Kanbur, M. Keen, and M. Tuomala. 1998. Tagging and taxing:The optimal use of categorical and income information in designing tax/transferschemes. Economica 65 (May): 179–92.
Inman, R., and D. Rubinfeld. 1997. Rethinking federalism. Journal of EconomicPerspectives 11 (fall): 43–64.
Keane, M., and R. Moffitt. 1998. A structural model of multiple welfare programparticipation and labor supply. International Economic Review 39 (August): 553–89.
Kesselman, J. R. 1969. Labor-supply effects of income, income-work, and wagesubsidies. Journal of Human Resources 4 (summer): 275–92.
———. 1973. Incentive effects of transfer systems once again. Journal of HumanResources 8 (winter): 119–29.
———. 1976. Tax effects on job search, training, and work effort. Journal of PublicEconomics 6 (October): 255–72.
Ketron, Inc. 1980. The long-term impact of WIN II: A longitudinal evaluation ofthe employment experiences of participants in the Work Incentive Program. Re-port to the Employment and Training Administration, U.S. Department of La-bor. Wayne, Penn: Ketron, Inc.
Klerman, J., and S. Haider. 2001. A stock-flow analysis of the welfare caseload.Santa Monica, Calif.: RAND Corporation.
Lampman, R. 1968. Expanding the American system of transfers to do more forthe poor. U.S. Congress, Joint Economic Committee. Washington, D.C.: Gov-ernment Printing Office.
Lindbeck, A., S. Nyberg, and J. Weibull. 1999. Social norms, the welfare state, andvoting. Quarterly Journal of Economics 114 (February): 1–35.
Lurie, I., ed. 1975. Integrating income maintenance programs. New York: AcademicPress.
McKernan, S. M., R. Lerman, N. Pindus, and J. Valente. 2000. The relationship be-tween metropolitan and non-metropolitan locations, changing welfare policies,and the employment of single mothers. Washington, D.C.: Urban Institute.Mimeograph.
McKinnish, T., S. Sanders, and J. Smith. 1999. Estimates of effective guaranteesand tax rates in the AFDC Program for the post-OBRA period. Journal of Hu-man Resources 34 (spring): 312–45.
Meyer, B., and D. Rosenbaum. 2001. Welfare, the Earned Income Tax Credit, and
360 Robert A. Moffitt
the labor supply of single mothers. Quarterly Journal of Economics 116 (August):1063–114.
Miller, R., and S. Sanders. 1997. Human capital development and welfare partici-pation. Carnegie-Rochester Conference Series on Public Policy 46 (June): 1–43.
Moffitt, R. 1983. An economic model of welfare stigma. American Economic Re-view 73 (December): 1023–35.
———. 1992a. Evaluation methods for program entry effects. In Evaluating welfareand training programs, ed. C. Manski and I. Garfinkel, 231–52. Cambridge: Har-vard University Press.
———. 1992b. Incentive effects of the U.S. welfare system: A review. Journal ofEconomic Literature 30 (March): 1–61.
———. 1996. The effect of employment and training programs on entry and exitfrom the welfare caseload. Journal of Policy Analysis and Management 15 (win-ter): 32–50.
———. 1998. The effect of welfare on marriage and fertility. In Welfare, the family,and reproductive behavior, ed. R. Moffitt, 50–97. Washington, D.C.: NationalAcademy Press.
———. 1999a. The effect of pre-PRWORA waivers on AFDC caseloads and fe-male earnings, income, and labor force behavior. In Economic conditions and wel-fare reform, ed. S. Danziger, 91–118. Kalamazoo: Upjohn Institute.
———. 1999b. Explaining welfare reform: Public choice and the labor market. In-ternational Tax and Public Finance 6:289–316.
———. 2000. Welfare benefits and female headship in U.S. time series. AmericanEconomic Review 90 (May): 373–77.
———. 2001. Demographic change and public assistance expenditures. In Demo-graphic change and fiscal policy, ed. A. Auerbach and R. Lee, 391–425. Cam-bridge: Cambridge University Press.
———. 2002. Experienced-based measures of heterogeneity in the welfare case-load. In Data collection and research issues for studies of welfare populations, ed.C. Citro, R. Moffitt, and S. Ver Ploeg, 473–99. Washington, D.C.: NationalAcademy Press.
Moffitt, R., A. Cherlin, L. Burton, and L. Chase-Lansdale. 2001. Disadvantageamong families remaining on welfare. Paper prepared for the Chicago-Northwestern Joint Center for Poverty Research.
Moffitt, R., R. Reville, and A. Winkler. 1994. State AFDC rules regarding the treat-ment of cohabitors: 1993. Social Security Bulletin 57 (Winter): 26–33.
———. 1998. Beyond single mothers: Cohabitation and marriage in the AFDCprogram. Demography 35 (August): 259–78.
Moffitt, R., D. Ribar, and M. Wilhelm. 1998. The decline of welfare benefits inthe U.S.: The role of wage inequality. Journal of Public Economics 68 (June):421–52.
Moffitt, R., and D. Stevens. 2001. Changing caseloads: Macro influences and mi-cro composition. New York Federal Reserve Bank Economic Policy Review 7(September): 37–49.
Moffitt, R., and S. Ver Ploeg, eds. 2001. Evaluating welfare reform in an era of tran-sition. Washington, D.C.: National Academy Press.
Mueser, P., J. Hotchkiss, C. King, P. Rokicki, and D. Stevens. 2000. The welfarecaseload, economic growth and welfare-to-work policies: An analysis of five ur-ban areas. University of Missouri, Department of Economics. Mimeograph.
Murray, C. 1984. Losing ground. New York: Basic Books.Nechyba, T. 2001. Social approval, values, and AFDC: A re-examination of the il-
legitimacy debate. Journal of Political Economy 109 (June): 637–72.
The Temporary Assistance for Needy Families Program 361
Nichols, A., and R. Zeckhauser. 1982. Targeting transfers through restrictions onrecipients. American Economic Review 72 (May): 372–77.
Oellerich, D. 2001. Welfare reform: Program entrants and recipients. Washington,D.C.: Office of the Assistant Secretary for Planning and Evaluation, Departmentof Health and Human Services. Mimeograph.
O’Neill, J., and M. A. Hill. 2001. Gaining ground? Measuring the impact of wel-fare reform on welfare and work. New York: Manhattan Institute.
O’Neill, D., and J. O’Neill. 1997. Lessons for welfare reform: An analysis of theAFDC caseload and past welfare-to-work programs. Kalamazoo, Mich.: UpjohnInstitute.
Orr, L. 1976. Income transfers as a public good. American Economic Review 66(June): 990–94.
———. 1979. Food stamps for AFDC families: Income supplementation or fiscalrelief. Washington, D.C.: Department of Health and Human Services. Mimeo-graph.
Parsons, D. 1996. Imperfect “tagging” in social insurance programs. Journal ofPublic Economics 62 (October): 183–207.
Plimpton, L., and D. Nightingale. 2000. Welfare employment programs: Impactsand cost-effectiveness of employment and training activities. In Improving theodds: Increasing the effectiveness of publicly funded training, ed. B. Barnow and C.King, 49–100. Washington, D.C.: Urban Institute.
Ribar, D., and M. Wilhelm. 1999. The demand for welfare generosity. Review ofEconomics and Statistics 81 (February): 96–108.
Riccio, J., D. Friedlander, and S. Freedman. 1994. GAIN: Benefits, costs, andthree-year impacts of a welfare-to-work program. New York: ManpowerDemonstration Research Corporation.
Rosenzweig, Mark. 1999. Welfare, marital prospects, and nonmarital childbearing.Journal of Political Economy 107, part 2 (December): S3–S32.
Schoeni, R., and R. Blank. 2000. What has welfare reform accomplished? Impactson welfare participation, employment, income, poverty, and family structure.NBER Working Paper no. 7627. Cambridge, Mass.: National Bureau of Eco-nomic Research.
Smith, S. 2001. Background on the composition of the TANF caseload since wel-fare reform. Washington, D.C.: Brookings Institution.
SRI International. 1983. Final report of the Seattle/Denver income maintenance ex-periment. Vol. 1, Design and results. Menlo Park, Calif.: SRI International.
Tobin, J. 1965. On improving the economic status of the Negro. Daedalus 94 (fall):878–97.
Tobin, J., J. Pechman, and P. Mieszkowski. 1967. Is a negative income tax practical?Yale Law Journal 77 (November): 1–27.
U.S. Congress Committee on Ways and Means. 1994. Background material anddata on programs within the jurisdiction of the Committee on Ways and Means.Washington, D.C.: U.S. Government Printing Office.
———. 1996. Background material and data on programs within the jurisdiction ofthe Committee on Ways and Means. Washington, D.C.: U.S. Government Print-ing Office.
———. 1998. Background material and data on programs within the jurisdiction ofthe Committee on Ways and Means. Washington, D.C.: U.S. Government Print-ing Office.
———. 2000. Background material and data on programs within the jurisdiction ofthe Committee on Ways and Means. Washington, D.C.: U.S. Government Print-ing Office.
362 Robert A. Moffitt
U.S. Department of Commerce, Bureau of the Census. 2000. Statistical abstract ofthe U.S.: 1996. Washington, D.C.: U.S. Government Printing Office.
U.S. Department of Health and Human Services (DHHS). 1995. Report to Con-gress on out-of-wedlock childbearing. Washington, D.C.: U.S. Government Print-ing Office.
———. 1997. Setting the baseline: A report on state welfare waivers. Washington,D.C.: Office of the Assistant Secretary for Planning and Evaluation.
———. 1998. Temporary Assistance for Needy Families Program: First annual re-port to Congress. Washington, D.C.: Administration for Children and Families.
———. 1999. Characteristics and financial circumstances of TANF recipients: Fis-cal year 1998. Washington, D.C.: Administration for Children and Families,Office of Planning, Research, and Evaluation.
———. 2000. Temporary Assistance for Needy Families Program: Third annual re-port to Congress. Washington, D.C.: Administration for Children and Families.
———. 2001. Indicators of welfare dependence: Annual report to Congress 2001.Washington, D.C.: Office of the Assistance Secretary for Planning and Evalua-tion.
U.S. General Accounting Office (GAO). 1999. Welfare reform: Assessing the effec-tiveness of various welfare-to-work approaches. Washington, D.C.: U.S. Gov-ernment Printing Office.
Wallace, G., and R. Blank. 1999. What goes up must come down? In Economic con-ditions and welfare reform, ed. S. Danziger, 49–89. Kalamazoo, Mich.: UpjohnInstitute.
Wheaton, W. 2000. Decentralized welfare: Will there be underprovision? Journal ofUrban Economics 48 (November): 536–55.
Zeckhauser, R. 1971. Optimal mechanisms for income transfer. American Eco-nomic Review 61 (June): 324–34.
Ziliak, J., D. Figlio, E. Davis, and L. Connelly. 2000. Accounting for the decline inAFDC caseloads: Welfare reform or economic growth? Journal of Human Re-sources 35 (Summer): 570–86.
The Temporary Assistance for Needy Families Program 363