M M e e a a s s u u r r e e I I n n f f o o r r m m a a t t i i o o n n T T e e m m p p l l a a t t e e – – O O f f f f i i c c e e T T a a s s k k L L i i g g h h t t i i n n g g C C o o n n t t r r o o l l s s 2013 California Building Energy Efficiency Standards [California Utilities Statewide Codes and Standards Team, February 2011] CONTENTS 1. Overview ....................................................................................................................... 4 2. Methodology................................................................................................................. 5 2.1 Task Lighting and Plug Load Controls.......................................................................................6 2.2 Literature Review .......................................................................................................................6 2.3 Market Survey ............................................................................................................................7 2.3.1 Survey Audience and Objectives .........................................................................................7 2.3.2 Survey Methodology............................................................................................................8 2.4 Energy Savings Analysis ............................................................................................................8 2.5 Cost Analysis ............................................................................................................................10 3. Analysis and Results ................................................................................................. 14 3.1 Task Light and Office Plug Load Characteristics ....................................................................14 3.1.1 Energy Consumption .........................................................................................................14 3.1.2 Definition ...........................................................................................................................15 3.1.3 Characteristics ....................................................................................................................16 3.2 Market Survey ..........................................................................................................................18 3.2.1 Plug Load Control Standards .............................................................................................18 3.2.2 Industry Survey ..................................................................................................................19 3.3 Task Light and Plug Load Control Strategies ..........................................................................20 3.3.1 Dual Circuit ........................................................................................................................21 3.3.2 Available Products .............................................................................................................22 3.3.3 Central Timer Control Design ...........................................................................................24 3.3.4 Occupancy Sensor Control Designs...................................................................................27 3.4 Energy Analysis........................................................................................................................30 3.4.1 Task Lighting and Plug Load Operation and Control Parameters .....................................30
Transcript
MMeeaassuurree IInnffoorrmmaattiioonn TTeemmppllaattee –– OOffffiiccee TTaasskk LLiigghhttiinngg CCoonnttrroollss 2013 California Building Energy Efficiency Standards [California Utilities Statewide Codes and Standards Team, February 2011]
3.5.1 Level 1 Control Cost ..........................................................................................................42
3.5.2 Level 2 Control Cost The last strategy implements task lights and plug load control by controlling central circuits serving open spaces and copy rooms, and controlling locally private spaces and conference rooms. .........................................................................................................45
3.5.3 Level 3 Control Cost ..........................................................................................................48
4. Bibliography and Other Research ............................................................................ 50
FIGURES
Figure 1 Energy Savings Calculation Formula Schedule ..................................................................... 10
Figure 2. Mixed Load Breaker Panel and Lighting Control Panel Base Case ...................................... 11
Figure 3. Single Voltage Load Breaker Panels and Lighting Control Panel Base Case ....................... 11
Figure 4. Overhead Lighting Controllable Breaker Panel and Single Voltage Breaker Panel Base Case ........................................................................................................................................................ 12
Figure 5. Number of circuits per space type ......................................................................................... 13
Figure 6 Office Task Lights Operation during Weekday and Weekend .............................................. 15
Figure 7. Example of Essential Equipment ........................................................................................... 17
Figure 8. One Circuit Practice .............................................................................................................. 21
Figure 9. Dual Circuit Practice ............................................................................................................. 21
Figure 10. Central Control Products ..................................................................................................... 23
Figure 12 Baseline A Improvement: Increase control relay panel capacity ......................................... 25
Figure 13 Baseline B Improvement: Replace breakers by controllable breakers in the plug load breaker panel [option 1] ................................................................................................................. 25
2013 California Building Energy Efficiency Standards – Office Task Lighting [February 2011]
1. Overview
On behalf of Southern California Edison (SCE) as part of the statewide IOU Codes and Standards Programs, Heschong Mahone Group (HMG) is conducting a Codes and Standards Enhancement (CASE) study on office task lighting controls.
According to the California Commercial End-Use Survey1 (CEUS) released in March 2006, interior lighting represents 26.4% of the electricity energy consumption in California office floor space, corresponding to the highest electricity end-use. This interior lighting can be divided into overhead lighting and task lighting. Per the 2008 Title 24 code requirement, the allowed lighting power density in office spaces is 1.1 W/sf which can be broken down as follows: 0.9W/sf for overhead lighting and 0.2W/sf for task lighting. Hence, about 18% of the interior lighting electricity consumption is due to task lighting.
In addition, office equipment has the third highest electricity end-use consumption in California office floor space, representing 19.2% of the total electricity consumption. When considering the energy consumption of miscellaneous equipment and task lighting, office plug loads become the highest electricity end-use of office buildings (28 % of total electricity consumption). Despite penetration of newer and more efficient technologies, this electricity end-use is steadily increasing as the use of personal computers and other electronics devices in offices continues to grow. New Title 24 code proposals that push toward low ambient (overhead) lighting are promoting increased task lighting usage. These two trends are increasing the importance of controlling plug loads in offices.
The CASE study aims to develop Title 24 requirements to reduce office task lighting and plug load energy consumption through automatic shut off controls.
1 California Commercial End-Use Survey.Energy Commission. CEC-400-2006-005
2013 California Building Energy Efficiency Standards – Office Task Lighting [February 2011]
2. Methodology With increased practices of low ambient lighting designs and use of overhead lighting controls in office spaces, task lighting becomes a more prominent office building lighting load in terms of both power density and power consumption. The 2008 Title 24 assumes that task lighting power density can be 0.2 W/sf, which is 18% of the total allowed office lighting power density of 1.1 W/sf.
In a broad view, electricity consumption by office plug loads, which include task lighting load, has been increasing steadily as the use of personal computers and other electronics devices in offices continues to grow. Forecasts by the Energy Information Administration’s 2010 annual energy outlook predict a 36% increase in PC office equipment energy consumption from 2010 to 2030, and a 65% increase for non-PC office equipment energy consumption. Combined, these two end-uses would increase the total office energy consumption by 51%. Although the growth in office equipment use is difficult to control, office equipment use patterns give room for energy savings. The CASE study investigates strategies of applying existing lighting control technologies, especially those already required by 2008 Title 24 for general lightings, to task lightings and plug loads.
Key elements to our study methodology are listed here:
Literature review Industry surveys for installation practices and product information
• Survey of ASHRAE 90.1-2007 Addendum bs. Development • Survey of IgCC code development team • Interview lighting control manufacturers
Energy Savings Analysis The CASE team started the investigation by reviewing literature on these control strategies, on related case studies and on products available to implement these strategies. Then they interviewed product manufacturers, and experts involved in the plug load management fields, such as researchers from NBI and ECOS and ASHRAE committee members who worked on 90.1-2007 Addendum bs.
From this research, different implementation options were defined depending on control product type and common practice, and different possible configurations. The CASE team accounted for control installation system which will be in place in office buildings due to current Title 24 lighting control requirements, and considered incremental changes as well as new installations. They collected further product technical information and product costs by interviewing sales representatives and distributors. They also conducted survey of electrical designers and contractors, as well as system furniture manufacturers in order to characterize installation requirement other than control product, such as new wiring configuration, and in order to determine any implementation issue. In particular, we investigated the prevalence of dual circuit layout in office spaces, and any potential issues or barriers to its implementation. These industry surveys are further described in the next section.
Two office prototypes, described in sectionError! Reference source not found., were developed. For each of those, new equipment requirement was defined depending on the baseline, as well as new wiring requirement. When further considering installation, this led to the assessment of the total incremental cost of each option for each prototype, which enabled the cost-effectiveness analysis in combination with the energy savings estimates.
2013 California Building Energy Efficiency Standards – Office Task Lighting [February 2011]
2.1 Task Lighting and Plug Load Controls
The CASE study team investigated a wide range of plug load control technologies and practices in order to develop Title 24 requirement that maximize task lighting/plug load controls. While many of these technologies are effective control strategies, not all of them are suitable for Title 24 regulations.
Task lighting and plug load can be automatically switched off by an embedded occupancy sensor or by the connected power stripe, which has occupancy sensor or timer control capabilities. These appliance level controls are not suitable for Title 24 regulation considerations.
Lighting control technologies for general lighting shut-off controls can be used for task lighting and plug load controls. Plug load controls require separate electrical circuits, dual circuits, to be installed in office buildings. One is kept uncontrolled (primary circuit) to enable essential and emergency equipment to stay on around the clock while the other (secondary circuit) can be shut off when the connected plug loads, including task lights, are not in use.
Based on existing control technologies, this study considers three levels of control, their implementation feasibility and cost effectiveness. The goal is to achieve maximum granularity of controls with the consideration of availability and costs of control technologies. The three levels of controls are:
Level 1: Dual circuits are provided to all building areas. Secondary circuit are controlled by lighting control panels or controllable breaker panels with timer control capability so that connected task lighting and plug load are automatically shut off during non-business hours.
Level 2: Secondary circuits in all cubicles, private offices, and conference rooms are controlled by occupancy sensors.
Level 3: Secondary circuits in private offices and conference rooms are controlled by occupancy sensors. This is consistent with the 2008 Title 24 requirement of occupancy sensor controls of general lighting in those spaces. Secondary circuits in other building spaces follow the strategy 1.
These three strategies can implemented using lighting control systems widely used for meeting existing Title 24 lighting control requirements.
2.2 Literature Review
The team conducted literature review as the first step to investigating the subject of plug load management. Information pertinent to understanding the current status and technology development associated with plug load we wished to obtain from literature review included:
Task light and plug load characteristics Energy consumption impact from task light and plug load Task light and plug load control strategies
The team identified two main sources of established studies on plug loads. One is a series of studies conducted by Lawrence Berkley National Laboratory (LBNL). The most recent publication in the series is the report titled, “After-hours Power Status of Office Equipment and Energy Use of Miscellaneous Plug-Load Equipment.” This report built on a previous study, “Field Surveys of Office Equipment Operation Patterns,” and presented data on the type, amount and typical annual energy
2013 California Building Energy Efficiency Standards – Office Task Lighting [February 2011]
consumption of miscellaneous plug load equipment usually not accounted for by building managers. The second source of literature is the Office Plug Load Field Monitoring2 ” PIER research conducted by ECOS and RLW Analytics which monitored plug load consumption in commercial offices in 2007 and 2008 inventoried all plug load devices at 47 offices.
2.3 Market Survey
Surveys were conducted amongst the different industry players, using diverse methodologies. The purposes of these surveys were to gather information on
Plug load control recommendation in other codes Wiring industry practice Feasibility of different task light and plug load control options. Product and pricing information
2.3.1 Survey Audience and Objectives
The CASE team interviewed the ASHRAE 90.1 technical committee members who developed the ASHRAE 90.1 Addendum bs on plug load control to understand their code development process and stakeholder reactions on the proposal. The team also interviewed New Building Institute (NBI) staff who helped to develop the plug load control recommendation for both IgCC code and for the the Office of the future 25% solution.
Electrical designers and contractors were interviewed through an on-line survey, while system furniture manufacturers were interviewed through phone calls. Control product technical supports and location distributors were also called for product and pricing information.
The designer and contractor survey was aimed at assessing current wiring practices in private offices and workstation These included the number of independent circuits brought to these spaces. It also sought to determine the feasibility of controlling task lights and plug loads by using a central timer control or local occupancy sensors by asking for potential issues and comments on these strategies. It asked about the frequency of timer and occupancy control strategies implementation in California office spaces.
The system furniture manufacturer survey tried to assess the current practice regarding cubicle workstation wiring, such as the number of independent circuits brought to each workstation and the integration of task light to the workstation partition (under cabinet task light type), in order to evaluate the feasibility of bringing both controlled and uncontrolled circuits to each workstation. It meant to determine the current practice concerning occupancy sensor integration to the system furniture. It addressed the feasibility of integrating occupancy sensor to their system furniture if they hadn’t done it before. It finally asked about the possibility of receptacle colour coding depending on their wiring.
2 2008. Office Plug Load Field Monitoring Report California Energy Commission, PIER Energy-
Related Environmental Research Program. CEC-500-06-007.
2013 California Building Energy Efficiency Standards – Office Task Lighting [February 2011]
After a preliminary research on the internet regarding available and suitable timer control and occupancy sensor products, the technical support of the manufacturers providing these products were called in order to get information not available on specification sheets. Concerning timer control, information on panel type, size (number of circuit), load mixing capability (120V/227V), networking option, override capability and external communication options was collected. Information on controlled area, power pack requirement, sensor technology and wiring voltage was collected on occupancy sensors.
Finally, local distributors were called to get prices of the control systems that would be installed in each building prototypes (small and large offices).
2.3.2 Survey Methodology
Electrical designers and contractors surveys were conducted on-line. Contact information was collected from HMG multifamily building energy efficiency implementation programs, stakeholder meeting attendees and internet resources. A survey form was created using Survey Monkey. A link was then sent to participants in an email using MyEmma. This email explained CASE work general purpose and specificity of this task lighting CASE while inviting them to take part in stakeholder meetings. A reminder was sent a month later to increase the number of response. The survey results were then analyzed using Survey Monkey.
Due to the unavailability of direct contact for system furniture manufacturers, they were called using the technical support number displayed on their website, and HMG staff would fill surveys on Survey Monkey while they talked to their sales engineers. These surveys were then analysed using Survey Monkey analysis capability.
The control product manufacturer survey started with an Internet research on products suitable for task light and plug load control applications in general, and for the two office prototypes more specifically. Specification sheets were collected. Then, the technical support and sales engineers of companies manufacturing these products were called either to confirm information gathered on-line or to collect missing information. Some meetings with sales representatives were also organized for product demonstration, functioning explanation and price collection purpose. Once system components and related model number needed for each prototype were determined, local distributors were called to get price quotes.
2.4 Energy Savings Analysis
The task light and plug load controls aim at managing the energy consumption of these devices by switching off their power supply circuits when employees are not using them. Central timer control reduces plug load power consumption in periods when all employees have left the controlled spaces. In the case of occupancy sensor control, additional savings can be achieved when an occupant is not at his/her desk during business hours, which include two scenarios, away-from-desk times and out-of-office times. Similarly, occupancy sensor control in conference rooms can achieve additional savings when they are not in use.
Basically, there are three scenarios when task lighting and other plug loads can be switched off:
1. During non-business hours 2. An occupant is temporally away from the desk during business hours, or an conference room
is not being used
2013 California Building Energy Efficiency Standards – Office Task Lighting [February 2011]
3. An occupant is not in office during business hours Central timer control can only address the first scenario while occupancy sensor can address all three scenarios. Detailed schedules for all three scenarios are developed.
The amount of energy savings depends on total number of plug load devices connected to the controlled circuit and the average powers of the controlled plug loads when they are switched off. The former depends on office building configurations. The CASE study used two prototype buildings for analysis. The latter were obtained from the LBNL study and ECOS PIER research results.
Based on the above three task lighting and plug load control scenarios, the CASE study evaluated energy savings for each control technology, central timer control and occupancy sensor control in private offices/cubicles and conference rooms. The three levels of building plug load control, as discussed in section 3.2, use different combinations of control technologies. Total building energy savings for each level of control are the summation of savings from all deployed control technologies.
The detailed calculation formulas are as following:
The average load (kW) of a plug load i is:
, ,
i = {controllable plug load for a control technology}
At each hour k, the total energy savings (kWh) are calculated as:
, , _ _ _ , ,
Both SCHj,k and Number_of_Connected_Loadi,j depends on control technology according to Figure 1.
The annual energy savings by a technology is:
,
2013 California Building Energy Efficiency Standards – Office Task Lighting [February 2011]
Control Technology
Control Level
j Number_of_Connected_Loadi,j SCHj,k
Central Timer
1
Non-Business hours
Controllable plug loads in the building
1 2 Controllable plug loads in common areas and open-
space cubicles
3 Controllable plug loads in
common area
OC Sensor
2 Away-from-
Desk and Out-Of-Office
Controllable plug loads in private offices
Fraction of unoccupied time during
business hours 3 Controllable plug loads in private offices & cubicles
OC Sensor – Conference
Room 2&3
Empty Conference
room
Average number of conference room plug load
equipment
Fraction of unoccupied time during
business hours
Figure 1 Energy Savings Calculation Formula Schedule
2.5 Cost Analysis
Incremental cost of the proposed measure is determined by lighting control equipment upgrade and associated costs for additional wiring, installation, configuration, as well as maintenance. The CASE team first assessed the lighting control and electrical wiring base cases that are in compliance with the 2008 Title 24 codes, which include automatic shut off controls and occupancy sensor controls for general; lighting. For each base case, system upgrade options were developed. The corresponding costs were estimated based on lighting control products available from the market and prototype office building configurations.
Two base cases were defined depending on the studied control strategy, representing common practice. The base case for central control assumes that the buildings have central panel controlling overhead lighting. Depending on the equipment used, three different base configurations were defined. In the first configuration depicted in Figure 2, a single breaker panel handles both 120V and 277V (if applicable) loads, and a lighting control panel is used to control overhead lighting (120V, 277V or both depending on the building type).
2013 Califo
F
In the seconoverhead ligloads (all 12
Figur
In the third a controllab
ornia Buildin
Figure 2. M
nd configuraghting, be it 20V) are pro
re 3. Single
configuratioble breaker p
ng Energy Ef
Mixed Load B
ation, separat120V, 277V
otected by a
Voltage Lo
on, the overhpanel. The ot
Efficiency Sta
Breaker Pan
te breaker paV or both voseparate bre
oad Breaker
head lightingther loads (1
andards – Of
nel and Lig
anels handleltages. It is l
eaker panel.
r Panels and
g are both co20V) are pro
ffice Task Li
ghting Contr
e the differenlinked to a li
d Lighting C
ontrolled andotected by a
ighting
rol Panel Ba
nt loads. Oneighting contr
Control Pan
d protected ba regular brea
[February
ase Case
e is dedicaterol panel. Th
nel Base Cas
by the same aker panel.
y 2011]
ed to he other
se
device,
2013 Califo
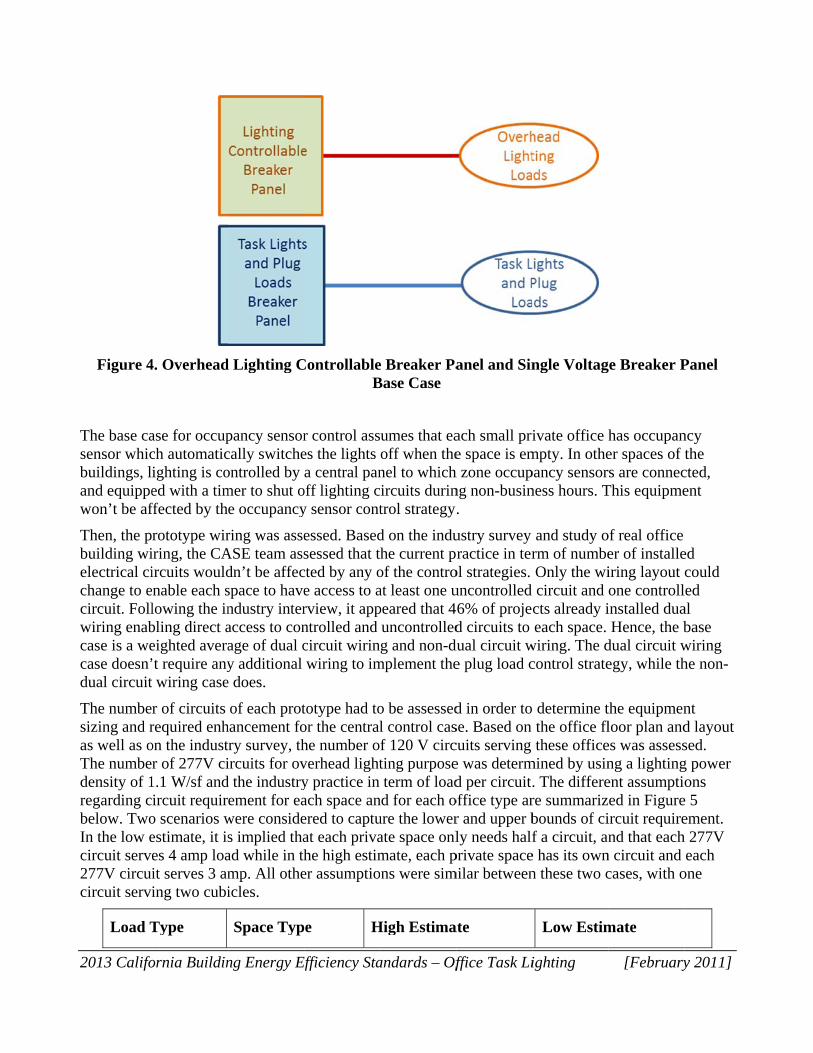
Figure 4
The base casensor whicbuildings, land equippewon’t be af
Then, the pbuilding wielectrical cichange to ecircuit. Follwiring enabcase is a wecase doesn’dual circuit
The numbesizing and ras well as oThe numbedensity of 1regarding cbelow. TwoIn the low ecircuit serve277V circuicircuit servi
Load T
ornia Buildin
4. Overhead
ase for occupch automaticighting is coed with a timffected by th
rototype wiriring, the CAircuits wouldnable each slowing the inbling direct aeighted avera’t require any wiring case
r of circuits required enhon the industr of 277V ci
1.1 W/sf andircuit requir
o scenarios westimate, it ises 4 amp loait serves 3 aming two cubi
Type
ng Energy Ef
d Lighting C
pancy sensorcally switcheontrolled by mer to shut oe occupancy
ring was asseASE team assdn’t be affecspace to havendustry interaccess to conage of dual cy additional
e does.
of each prothancement fotry survey, thircuits for ov
d the industryement for ea
were consides implied thaad while in thmp. All otheicles.
Space Typ
Efficiency Sta
ControllableB
r control asses the lights a central pan
off lighting cy sensor cont
essed. Basedsessed that t
cted by any oe access to arview, it appntrolled and circuit wirinwiring to im
totype had toor the centralhe number overhead lighty practice in ach space anered to captuat each privahe high estimer assumptio
e H
andards – Of
e Breaker PaBase Case
umes that eaoff when thenel to whichircuits durintrol strategy
d on the induhe current p
of the controat least one upeared that 4uncontrolledg and non-du
mplement the
o be assessedl control casf 120 V circting purposeterm of load
nd for each oure the lowerate space onlmate, each pns were sim
High Estima
ffice Task Li
anel and Sin
ach small prie space is em
h zone occupng non-busin.
ustry survey ractice in ter
ol strategies. uncontrolled 6% of projed circuits to
dual circuit we plug load c
d in order tose. Based on cuits serving e was determd per circuit.
office type arr and upper bly needs half
private spacemilar between
ate
ighting
ngle Voltag
ivate office hmpty. In othepancy sensorness hours. T
and study orm of numbeOnly the wicircuit and cts already ieach space.
wiring. The dcontrol strate
determine tthe office flthese office
mined by usin. The differere summarizbounds of cif a circuit, an
e has its ownn these two c
Low Estim
[February
ge Breaker P
has occupaner spaces of rs are connecThis equipme
of real office er of installeiring layout one controllinstalled duaHence, the b
dual circuit wegy, while th
the equipmenloor plan andes was assessng a lightingent assumptied in Figureircuit requirend that each
n circuit and cases, with o
mate
y 2011]
Panel
ncy the
cted, ent
ed could led al base wiring he non-
nt d layout sed. g power ons
e 5 ement. h 277V
each one
2013 California Building Energy Efficiency Standards – Office Task Lighting [February 2011]
2013 California Building Energy Efficiency Standards – Office Task Lighting [February 2011]
3. Analysis and Results This section presents the findings of our data collection efforts and the results of energy analysis.
3.1 Task Light and Office Plug Load Characteristics
The information gathered during the literature review and feedback from industry survey regarding load definition and characteristics are captured in the section below.
3.1.1 Energy Consumption
The team’s literature review efforts also yielded findings on office plug load energy consumption impact. One of LBNL’s studies collected data on the after-hour power state and the technology type of office equipment such as computers, monitors, copiers, scanners, printers, faxes and multi-function devices for the Energy Star Office Equipment program. Their scope included performing the calculation of office and miscellaneous equipment density (per employee and per 1000 sf). Following the convention of LBNL’s studies, office plug loads can be broken down into two categories: office equipment and miscellaneous equipment. Office equipment category further consists of task lighting, computer and monitor and office electronics.
The PIER research by ECOS and RLW Analytics metered a subset of 25 plug load devices and recorded power, current, voltage, and power factor with real-time time stamps over a two week period at one-minute intervals. In total, the team inventoried nearly 7,000 plug load devices and collected meter data from 470 plug load devices.
These above-mentioned studies provide the most comprehensive, updated and valuable data on office plug load energy consumption, status, usage and density in commercial offices. Even though numerous studies have been conducted in the last years regarding energy consumption of office equipment and home electronics, they are relatively old (from 1998 to 2002) and usually not specific to office buildings. In particular, after-hours equipment power status and equipment density are particularly scarce information. Most of the information presented in the following sections and most of the following analysis are based on these two studies. Some key results from these studies are presented in the following paragraphs.
Task lighting, in the form of table lamps and under-cabinet attachments are the third biggest load per 1000 sf after desktop computers and monitors when excluding portable space heater. Imaging equipment energy impact is also substantial. Unusual loads such as space heater can have a significant impact on plug consumption due to their high power rating, even though their density is low.
Plug load energy is wasted due to two mechanisms. First, some equipment is left on by occupants when they are away from their desk, be it for a short break or for an extended period of time such as weekend. Based on a research on task lighting usage conducted by HMG in 2009 (Error! Reference source not found.) and task lighting energy consumption data from the ECOS PIER research on plug loads, task lights which are left on during non-business hours can waste about 8 kWh per year per employee.
2013 California Building Energy Efficiency Standards – Office Task Lighting [February 2011]
Figure 6 Office Task Lights Operation during Weekday and Weekend
Second, some office appliances continuously draw power, even when they aren’t performing their primary function or when they are switched off. This electricity usage is called standby power, and is consumed by power supplies, the circuits or sensors needed to receive a remote signal, soft keypads or displays including miscellaneous LED status lights. Standby power density can be substantial for monitors.
3.1.2 Definition
Office equipment definitions tend to deviate from one study to another. We aim to define devices considered as task light and office plug loads for this study.
Title 24 defines task light as the lighting that is designed specifically to illuminate a task location, and that is generally confined to the task location. Currently, task lighting is not regulated by Title 24. The 2008 Title 24 code only specifies that for task lighting with density above 0.2W/sf, the additional W/sf of task lighting installed should be counted into the space light power density. Task lighting devices are commonly used, and their density usually varies between 1 and 2 task lamps per office workstation. Low ambient lighting strategies, which reduce the overhead lighting power density, focus light to workstations and harvest daylight, tend to increase task light densities.
Plug loads are not defined in Title 24. This label can cover different office appliances depending on the studies. For the purpose of this CASE study, data and taxonomy from the two literature sources, LBNL and ECOS PIER project, were used:
Office equipment refers to electronics products found in any type of offices and are primarily designed for office work. It can be further described as task lighting, computer and monitor and office electronics. It designates the following devices, consistently with Energy Star definition:
o Computers: desktop, laptop (notebook or mobile), thin clients; o Monitors: cathode ray tube (CRT), and liquid crystal display (LCD);
Office electronics
0.00
0.05
0.10
0.15
0.20
0.25
0.30
0 2 4 6 8 10 12 14 16 18 20 22
Fra
ctio
n o
f ta
sk li
gh
ts
swit
ched
on
Hour of the Day
Weekdays Weekends
2013 California Building Energy Efficiency Standards – Office Task Lighting [February 2011]
o Imaging: -Printers: impact, inkjet, laser, thermal, solid ink, and wide format;
-Fax machines: inkjet, laser, and thermal;
-Copiers;
-Scanners: document, flatbed, slide, and wide format;
-Multi-function devices: inkjet and laser;
o Computer Peripheral: -Computer speakers
-External power adapters; and
-Docking station (laptop, PDA)
Miscellaneous equipment refers to plug-load that are typically portable, often occupant-provided units whose number, power consumption and usage patterns are largely unknown [After-hours Power Status of Office Equipment and Inventory of Miscellaneous Plug-Load Equipment, LBNL].
There is not a comprehensive list of any plug load that can be found in offices. Due to the extensive number and variety of office plug loads, the most common and important ones in term of energy consumption identified by ECOS’ field monitoring research, also in agreement with LBNL classification, were considered for this analysis. In general, miscellaneous equipment are categorised as following:
Audio/visual (television, video player/recorder, computer projector, overhead projector) Telephony (speaker phone, answering machine, phone jack) Business Equipment (Portable HVAC such as personal space heater, personal fan…, Food and
beverage such as coffee maker, kettle, microwave oven, vending machine at room temperature, hot beverage dispenser, water cooler, bottled water tap hot and cold… etc.)
3.1.3 Characteristics
Controllable/Non-controllable
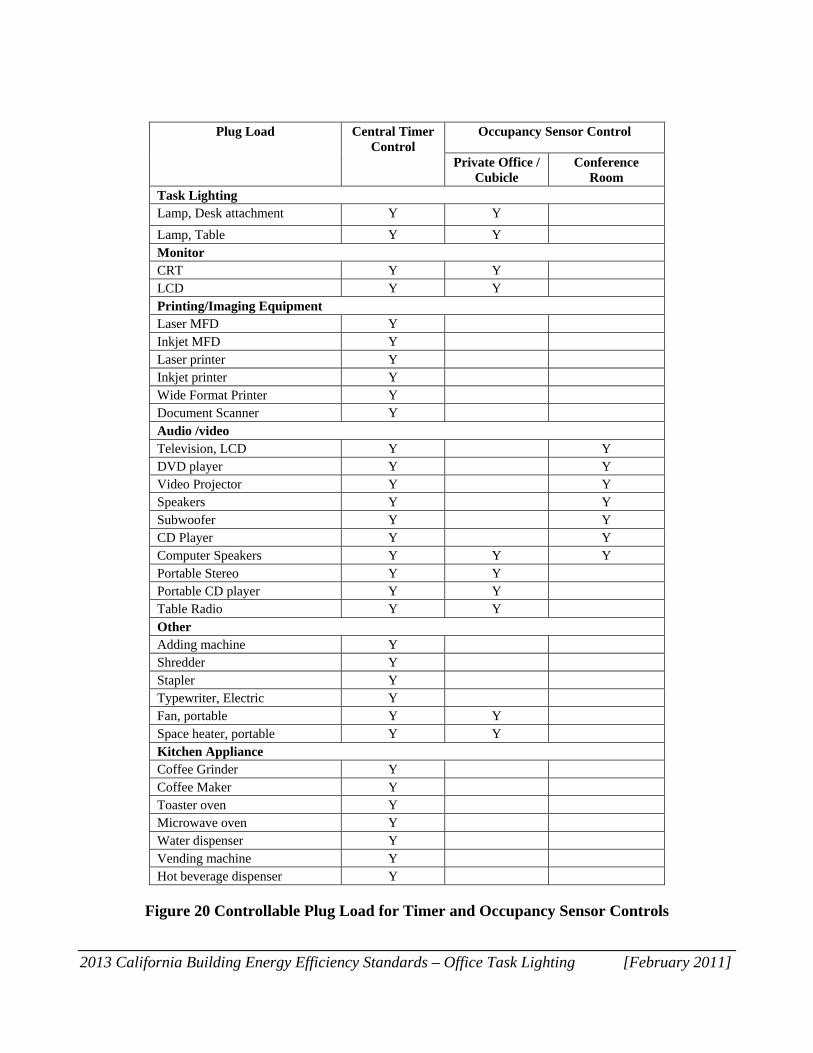
Office plug load can be classified as controllable and non-controllable depending on their function. Non-controllable loads refer to loads, which can’t be switched off due to business operation requirements or security reason. Figure 7 provides examples of non-controllable equipment. Controllable plug loads are loads, which can be switched when occupants are not using them, and switching them off does not compromise safety or security. Controllability of certain plug loads is hard to be determined. For example, battery chargers should be able to be switched off when they are in the standby mode, but not when they are in active mode. For energy savings analysis, the study assumed that those plug loads wouldn’t be connected to the controlled plug load circuits and won’t generate energy savings. The CASE team classified each office device using knowledge of their typical operation and usage.Figure 20 provides the list of plug loads that were considered to be controllable.
Category Equipment Rationale
2013 California Building Energy Efficiency Standards – Office Task Lighting [February 2011]
Computer&Monitor Desktop Computer Have to stay on for people working remotely or for software update during non-business hours
Notebook computer Have to stay on for people working remotely or for software update during non-business hours
Thin Client Have to stay on for people working remotely or for software update during non-business hours
Office Electronics Laser Fax Need to receive messages anytime
Ethernet Hub or Switch Follow desktop usage
Miscellaneous Phone, corded (powered) Need to receive calls anytime
Clock Non-disrupted operation pattern
Refrigerator Non-disrupted operation pattern
Figure 7. Example of Essential Equipment
Operational Mode/Power State
Most office equipment has different operational mode, or power states, which are related to their operational mode. This study adopts the ECOS PIER research definitions of five different power states, and they are listed below:
Disconnected. In this state, the device is not drawing any power. This could occur when a device is unplugged, turned off with a hard switch, or turned off via a surge protector or plug strip.
Standby. This state corresponds to the lowest steady power drawn, and usually occurs when the device doesn’t perform its primary function or when it is switched off with a soft switch but is still plugged.
Sleep. This mode defines a power state between standby and idle. It is only assigned if the device has these two other power modes, and is mostly use for product types with power-saving features.
Idle. A product operates in idle when it is prepared to perform its intended function, but is not doing so.
Active. The device is performing its intended function. In some cases, products may have more than one intended function and therefore a wide range of active mode power. For example, a multifunction device demands different power levels for scanning, printing, and copying; however, when it is performing any of these functions, the device is in active mode.
In ECOS PIER study, a product was considered to be in a power state when it spends a significant and continuous period with its power consumption in a narrow range. An operating mode could include
2013 California Building Energy Efficiency Standards – Office Task Lighting [February 2011]
one or more power states, and may have also included fluctuating power levels that were not considered power states.
3.2 Market Survey
The section describes the team’s survey efforts and the feedback received from stakeholder regarding:
Other code requirement regarding plug load control Current plug load control practice Dual circuit wiring Feasibility and barriers to plug load control implementation
3.2.1 Plug Load Control Standards
Different codes are already requiring or advocating the control of task lighting and plug loads. ASHRAE 90.1 is recommending it, as well as the International Green Construction Code (IgCC). The ASHRAE Lighting Subcommittee developed CMP to 90.1-2007, modifying Addendum “bs”section 8.4.2, labelled “Automatic Receptacle Control”. The revised language is as follows:
“At least 50% of all 125 volt 15- and 20-Ampere receptacles, including those installed in modular partitions, installed in the following space types:
a. Private offices b. Open offices c. Computer Classrooms
shall be controlled by an automatic control device that shall function on:
a. a scheduled basis using a time-of-day operated control device that turns receptacles off at specific programmed times - an independent program schedule shall be provided for areas of no more than 25,000 ft2 but not more than one floor - or
b. an occupant sensor that shall turn receptacles off within
30 minutes of all occupants leaving a space or
c. a signal from another control or alarm system that indicates the area is unoccupied.
Exceptions: Receptacles for the following shall not require an automatic control device:
a. Receptacles specifically designated for equipment requiring 24 hour operation. b. Spaces where an automatic shutoff would endanger the safety or security of the room or building
occupant(s).”
The IgCC also developed plug load control requirements. This is a technical requirement which doesn’t specify implementation means. It was thought rather in the framework of soft-wire control technologies such as timer or occupancy sensor on plug strips or smart strips rather than hard wiring control technologies. The code language is the following:
“609.6 Plug load controls. Receptacles and electrical outlets controlled by an occupant sensor or time switch shall be provided in accordance with all of the following:
1. In Group B office spaces without furniture systems incorporating wired receptacles, at least one switched receptacle shall be provided for each 50 square feet.
2013 California Building Energy Efficiency Standards – Office Task Lighting [February 2011]
2. In Group B office spaces with furniture systems incorporating wired receptacles, at least one switched circuit shall be provided at each electrical outlet used for powering furniture systems.
3. In classrooms in Group B and Group E occupancies, at least four switched receptacles shall be provided in each classroom.
4. In copy rooms, print shops, and computer labs, not less than one switched receptacle shall be provided for each data jack.
5. In spaces with an overhead cabinet above a counter or work surface, not less than one switched receptacle shall be provided for each work surface.
609.6.1 Distribution and marking. Controlled receptacles and electrical outlets shall be distributed in a reasonably uniform pattern throughout each space. Controlled receptacles shall be marked to differentiate them from uncontrolled receptacles.
609.6.2 Furniture systems. Furniture systems incorporating wired receptacles shall include at least two receptacles at each workstation that are connected to a controlled circuit.
609.6.3 Computer office equipment. Computer monitors, plug in space heaters, air purifiers, radios, computer speakers, coffee makers, fans, and task lights located in spaces with controlled receptacles shall be plugged into controlled receptacles.
609.6.4 Audio and visual systems. Displays, projectors, and audio amplifiers in Group B and Group E classrooms, conference and meeting rooms, and multipurpose rooms shall be controlled by an occupant sensor.
609.6.5 Water dispensers. Water dispensers that utilize energy to cool or heat drinking water shall be controlled by time switch controls.
609.6.6 Refrigerator and freezer cases. Lighting integral to vending machines and refrigerator and freezer cases shall be controlled by an occupant sensor or a time switch.”
3.2.2 Industry Survey
Respondent Profile
The pool of electrical designers and contractors surveyed was diversified. Half of the respondents were electrical designers, while the other half were electrical contractors, operating in every area of California. The total number of participants was 12. Half of them have worked on more than 100 office wiring projects, and 65% have worked on more than 50 office wiring projects. The other respondents were also experienced in office wiring (they worked on 10 to 50 office wiring projects).
Wiring practice
Bringing two separate circuits to a private office is done in about a quarter of the office projects wired this way. The main reason for feeding private offices with only one circuit is typically budget constraint. The general rule for private office wiring is to bring 3 circuits to feed 3 to 4 offices. Workstations in open spaces are very rarely served by two independent circuits (only 25% of them are). Most of the respondents agreed that bringing two circuits to a private office or a workstation is a better practice. They argued that it provides flexibility in terms of which equipment can be used at the workstation, and that putting computers and printers on a separate circuit is preferable.
2013 California Building Energy Efficiency Standards – Office Task Lighting [February 2011]
Circuit Controls
No major concerns were voiced about implementation of central timer for task light and plug control. Designers and contractors noted that some circuits would have to remain uncontrolled. Some stressed that this solution may not be widely adapted for businesses which require flexibility, for instance businesses not on a 8am-5pm schedule, or when some workstations need to be switched on while others can be turned off. One respondent was worried about additional cost and complexity while doing business in California, and would rather see this requirement adopted at the federal level.
Apart from cost concerns, comments on the occupancy sensor control strategy are related to implementation considerations. Survey respondents stressed the importance of the equipment quality, in order to detect slight movements and adjust the time delay to avoid disruption. They also suggested that the receptacles would have to be color-coded, and that clocks and some other equipment would have to remain uncontrolled.
While there was little resistance to this proposal, these strategies are not commonly put into practice in the field. Forty two percent (42%) of the respondent replied having experience installing central timer control for office plug loads. The occupancy strategy seemed more common, as 67% of respondents reported having experience with it in office spaces.
In addition to applying central control or occupancy control, some respondents recommended using personal controlled outlet (with either a timer or an occupancy sensor) or occupancy sensor integrated into the task light to avoid wiring configuration change as alternatives.
3.3 Task Light and Plug Load Control Strategies
Significant energy savings can be achieved by switching task lights and plug loads off when not in use. The control strategy requires the ability to control the circuits with these loads separately from non-controlled circuits for emergency and essential plugs. Hence, each office space must be served by at least two independent circuits, with a dual circuit wiring layout. According to the industry survey described in the previous section, this wiring layout is easy to implement, and is already used in 46% of office building projects. Dual circuit wiring requires the plugs to be labelled according to their circuit connection. This practice doesn’t present any implementation issue according to interviewed electrical designers, contractors and system manufacturers.
In general, electrical circuits dedicated to plugs (120 V) can be controlled in the same way as overhead lighting circuits. Controlling task lights and plug loads can hence be done with a variety of lighting control products in the market, be it central lighting control panel, controllable breaker panels or occupancy sensors. In addition, some manufacturers are now marketing products specifically developed for plug load control to respond to the growing concern regarding plug load consumption. Electrical designers, contractors, building managers and building officials are familiar with the design, installation, operation and equipment for plug load control which are similar to lighting control strategies developed on a regular basis due to current lighting code requirements. Hence, there are no infrastructure or skill barriers to plug load control implementation. Adequate products depend on the desired control granularity. Building level control is easier to implement than workstation level control, but this latter strategy can yield additional savings due to the extended number of hours equipment is switched off.
This CASE study investigated different ways of achieving task lights and plug load control at two levels: one at the building level, and a finer-grained control at the workstation level. After examining
2013 Califo
each of themin the sectio
3.3.1 DuaImplementicontrolled afeasibility o
There are twtime from thserve the ne
The other pused to feedthe one circtwo circuits
One buildindepending ofor fewer cu
ornia Buildin
m, the easieson below.
al Circuit ing plug loadand uncontroof dual circu
wo practiceshe 3-circuitsext space. Th
practice entaid the space rcuit practice.s out of the t
ng 3-circuit ion the worksubicles, but t
ng Energy Ef
st and most s
d control reqolled outlets it implemen
s regarding os in-feed. Thhis practice i
F
ils laying oureceptacle, a. This practicthree are con
F
in-feed usuastation type.this is very u
Efficiency Sta
straight-forw
quires a specin each spac
ntation were
office electriche first circuiis depicted in
Figure 8. O
ut the 3 circus seen on Figce is necessa
ntrolled, whil
Figure 9. Du
lly serves a g Some appliuncommon.
andards – Of
ward solution
cific dual circce. Typical pstudied and
cal wiring. Oit is laid out n Figure 8.
One Circuit P
uits at the samgure 9. It resary to be ablle the others
ual Circuit
group of 4 ccations requ
ffice Task Li
ns were furth
cuit electricapractices in tsummarized
One consistsin one space
Practice
me time. In tsults in longe to implem
s are not.
Practice
cubicles, but uire a separat
ighting
her analysed
al wiring layterms of wird in this sect
s of laying oue, and the ne
this case, theer wiring len
ment plug loa
can serve gote in-feed fo
[February
d, and are pre
yout to proviing, as well ion.
ut one circuiext circuit is
e 3 circuits wngth compard control. O
o up to 8 cubor each cubic
y 2011]
esented
ide both as the
it at a used to
will be red to ne or
bicles cle, or
2013 California Building Energy Efficiency Standards – Office Task Lighting [February 2011]
Within the system furniture, three to four separate circuits are commonly laid. Sometime due to economic constraint, less than three building circuits are used to feed the system furniture circuits. A best practice recommended by system furniture manufacturers is to assign one specific building circuit to each cubicle circuit. These wiring configurations enable providing both controlled and uncontrolled receptacles to each workstation.
3.3.2 Available Products Two types of products are suitable for task light and plug load central control: Lighting control panels and controllable breaker panels, while occupancy sensors are suited for workstation control.
Central Control Panels
Lighting control panels are primarily developed for lighting control, but they can be used for plug control as well, as they can control either 120V or 277V circuits. They use relays to switch circuits off. These relays can be controlled by an astronomical timer clock, building management system signal, occupancy sensors or other inputs. Most control panels on the market now are compatible with BACNet, LonWorks, DMX512, and other building management communication protocols. They all come with manual override to ensure services can be provided whenever needed, and most of them are Title 24 compliant certified. These panels usually come in three sizes, the most common sizes being 8, 30 and 48 relays. The number of circuits that can be controlled by one panel ranges from 8 to 48. Hence, most buildings required more than one panel. In this case, panels can be networked, with only one logic controller for the whole network to avoid controller logic redundancy. The number of panels in the network varies from 10 to 128 depending on the manufacturer and the product line. Most of the products can achieve lighting and plug control at the same time, as they can deal with mixed loads (120V and 277V) when using a voltage barrier.
Controllable Breaker Panels
Controllable breaker panels perform two functions at the same time. They protect the circuit from power surge, and they can switch them off depending on the controller logic. They are made of regular breakers, to which control relays are added. A controllable breaker panel can mix controlled loads and uncontrolled loads. Usually, the number of controlled breakers in a panel comes in multiples of four. The number of circuits in a panel ranges from to 4 to 42, the usual panel size being 18, 30 and 42 circuits. Like lighting control panels, they are compatible with BACNet, LonWorks, DMX512, and other common building management communication protocols, have manual overrides, and use the same control inputs as lighting control panels. They also can form networks; the number of panels in a network can go up to 12, the average being 8 panels. Some controllable breaker panels can also accept mixed loads (120V and 277V).
Figure 10 lists a sample of lighting control products to demonstrate product availability.
Product Type
Manufacturer Product Name
Lighting Control
Intelligent Lighting Control Light Master
Leviton e EZMax / ZMax
2013 California Building Energy Efficiency Standards – Office Task Lighting [February 2011]
Panel Lighting Control and Design GR2400 Quintessence
Lightholier/Philips LyteSwitch
Lutron LCP128
Siemens LCP3000EZ System
Wattstopper Lighting Integrator
Breaker Panel
Cutler Hammer Power-R-Command
Lighting Control and design GR2400 SmartBreaker
Lutron XPS
Schneider Square D PowerLink
Siemens I-3 Control Technology P1 series
Synergy lighting control Synergy Controllable Breaker Panel
Figure 10. Central Control Products
Occupancy Sensor
Two occupancy sensor products can be used to achieve workstation level plug load control. A simple infra-red occupancy sensor switch is suitable, or more sophisticated products which feature an occupancy sensor linked to a control box can be used to control both overhead lighting and plug loads.
Passive infra-red technologies are the best suited sensor technology as it performs well in small, enclosed spaces with direct sensor’s field view. In addition, they tend to be less expensive than other technologies.
Occupancy sensors can be mounted in different ways. For workstation control purpose, a wall switch is most appropriate, is easy to install, and doesn’t require much wiring or a power pack. Wall switch occupancy sensors provide a direct manual override and typically cover a small area. Corner mounting can also be practical, in particular for conference room application. The Passive Infra-red (PIR) wall switch products can cover an area up to 500 sf, and have a time delay which can be programmed between 15 seconds to 30 minutes.
Due to the emerging demand for load control in offices, some manufacturers have developed comprehensive products which control both overhead lighting, task lights and plug loads at the room level. The occupancy sensor is connected to a small relay box which controls the different circuits serving the room.
Figure 11 lists the manufacturers and products lines for occupancy sensors and control systems.
2013 California Building Energy Efficiency Standards – Office Task Lighting [February 2011]
Product Type Manufacturer Product Name
Infrared wall switch occupancy sensor
Cooper Controls Greengate OMC-P-0450-R
Enerlites WOSS15-W
Heath Zenith Lighting SL-6107-WH
Leviton OSC04-I0W
Lutron LOS-CIR-450-WH
SensorSwitch CM-9
Wattstopper PW100I
Occupancy sensor load control system
Legrand Wiremold Convia
Lutron Maestro Wireless
Wattstopper Room Controller
Figure 11 Occupancy Sensor Products
3.3.3 Central Timer Control Design
The central control option seeks to control task lights and plug loads using a central control panel. Non-essential electrical circuits are connected to controllable relays which switch them off either with a timer with a set schedule programmed by the building manager, with a signal received from a building management system, a security alarm system, occupancy sensors or other inputs. This panel can control an entire building, a floor or a space depending on the wiring constraint, the size of the building and the building wide plug load control strategy. Different panel types can be used to achieve this purpose, these options are presented below.
In most case, implementing dual circuit design doesn’t require significant equipment investment. Existing circuit protection and control equipment can accommodate dual circuit control by extending the panel capacity. Hence, it only requires an upgrade of equipment that would otherwise have been installed in order to control overhead lighting per current Title 24 requirements.
Different dual circuit control design options can answer specific building needs and user preferences. These different options are presented below, along with the baseline used to assess the energy savings potential and incremental cost of each dual circuit control option. These baselines are designed per 2008 Title 24 requirements, implying among other things that overhead lights would have been controlled to be switched off during non-business hours and that manual override would be provided. Four different baselines are presented below.
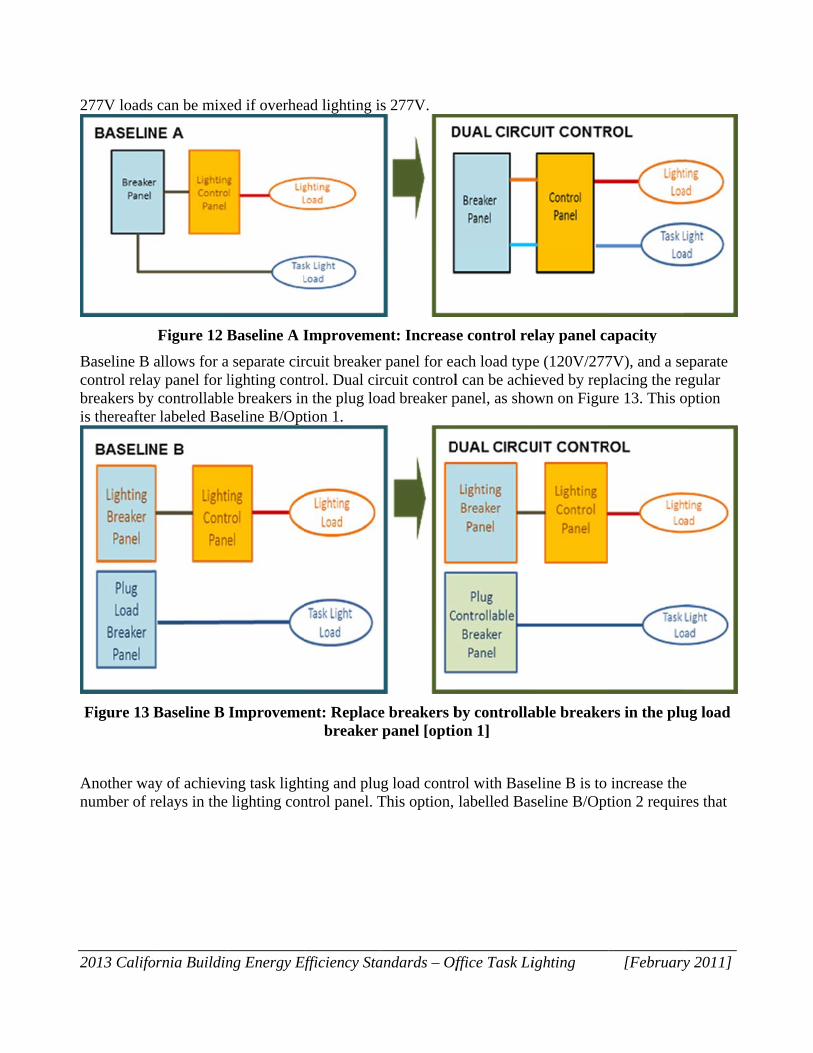
In Baseline A, a single breaker panel is used for all loads (lighting 277V if applicable and plug 120V) in the zone. In this case, dual circuit control can be achieved by increasing the size of the lighting control panel and the number of relays in the panel. This solution requires a panel in which 120V and
2013 Califo
277V loads
Baseline B control relabreakers byis thereafter
Figure 13
Another wanumber of r
ornia Buildin
s can be mixe
Figure 12 B
allows for aay panel for ly controllabler labeled Bas
Baseline B
ay of achievirelays in the
ng Energy Ef
ed if overhea
Baseline A I
a separate cirlighting conte breakers inseline B/Opt
Improveme
ing task lighlighting con
Efficiency Sta
ad lighting i
Improveme
rcuit breakertrol. Dual cirn the plug lotion 1.
ent: Replacebreaker
hting and pluntrol panel. T
andards – Of
s 277V.
ent: Increase
r panel for earcuit controlad breaker p
e breakers bpanel [optio
ug load contrThis option,
ffice Task Li
e control re
ach load typl can be achipanel, as sho
by controllaon 1]
rol with Baselabelled Bas
ighting
elay panel ca
e (120V/277ieved by repown on Figur
able breaker
eline B is to seline B/Opt
[February
apacity
7V), and a selacing the rere 13. This o
rs in the plu
increase thetion 2 requir
y 2011]
eparate egular option
ug load
e res that
2013 Califo
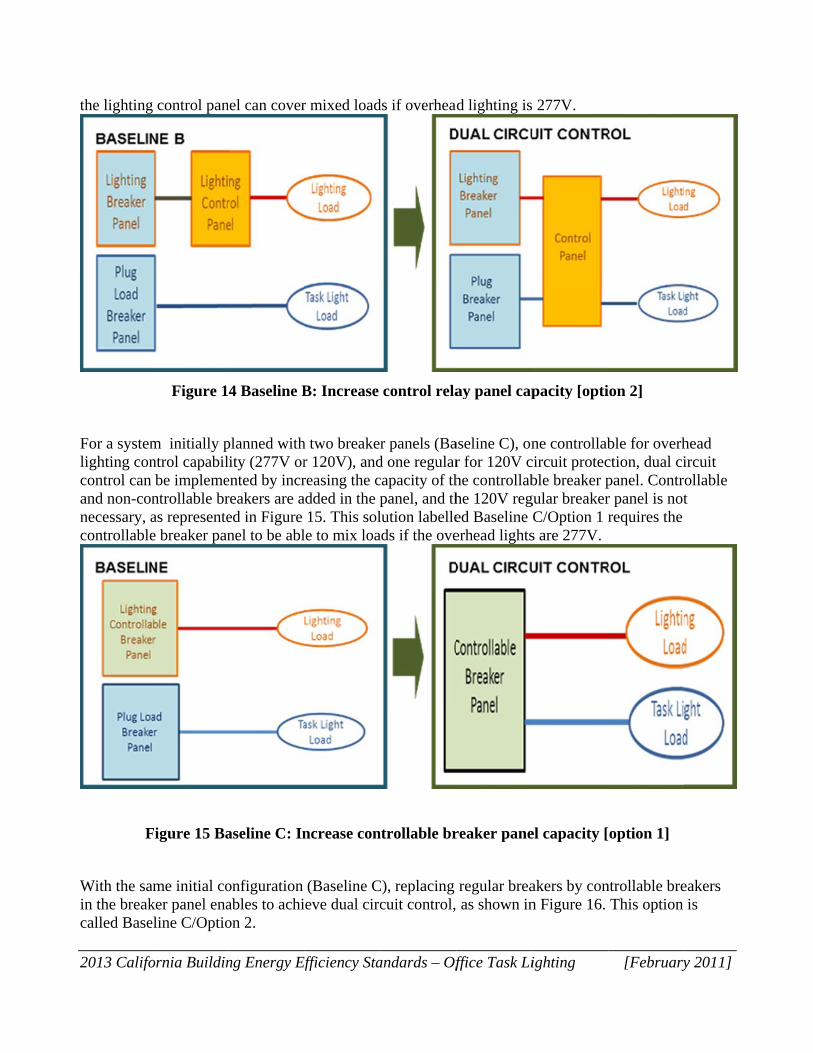
the lighting
For a systemlighting concontrol can and non-connecessary, acontrollable
F
With the sain the breakcalled Base
ornia Buildin
g control pan
Figure 1
m initially pntrol capabilbe implementrollable bras representee breaker pan
Figure 15 Ba
ame initial coker panel enaeline C/Optio
ng Energy Ef
nel can cover
4 Baseline B
planned withlity (277V orented by incrreakers are aed in Figure nel to be abl
aseline C: In
onfiguration ables to achion 2.
Efficiency Sta
r mixed load
B: Increase
h two breakerr 120V), andreasing the cadded in the p
15. This solle to mix loa
ncrease con
(Baseline Cieve dual circ
andards – Of
ds if overhea
control rela
r panels (Bad one regularcapacity of thpanel, and thlution labelleads if the ove
ntrollable br
C), replacing cuit control,
ffice Task Li
d lighting is
ay panel cap
aseline C), onr for 120V che controllabhe 120V reged Baseline erhead lights
reaker pane
regular brea as shown in
ighting
277V.
pacity [opti
ne controllabcircuit protecble breaker p
gular breakerC/Option 1 rs are 277V.
el capacity [
akers by conn Figure 16.
[February
ion 2]
ble for overhction, dual cipanel. Contrr panel is notrequires the
option 1]
ntrollable breThis option
y 2011]
head ircuit ollable t
eakers is
2013 Califo
Figure 16
A last initiaand controlcircuit contload dedica
3.3.4 Occ
The occupaorder to mawhich switcthis occupaon the wall circuit cont
ornia Buildin
Baseline C:
al system con both overherol only requ
ated circuits.
Figure 17
cupancy Se
ancy sensor oaximize the eches non-essncy sensor cor attached rol at the wo
ng Energy Ef
Replace br
nfiguration (ead lighting,uires replaci
Baseline D:
nsor Contro
option aims energy savinsential circuicould be locaunder the de
orkstation lev
Efficiency Sta
reakers by c[o
(Baseline D) task lighting
ing regular b
: Replace re
ol Designs
at controllinngs. Workstaits off when ated under thesk. Two typvel, dependi
andards – Of
controllableoption 2]
) can use a ug and plug lo
breakers by c
egular break
ng task lightsations could boccupants a
he desk. In ppes of configing on the ch
ffice Task Li
e breakers in
unique controoads. In thiscontrollable
kers by con
s and plug lobe equipped
are away fromprivate officegurations canhosen occupa
ighting
n the plug l
ollable breaks case, implebreakers for
trollable br
oads at a fined with an occm their deskes, the senson be used to ancy sensor
[February
oad breaker
ker panel to pementing duar task light an
reakers
er zone levelcupancy sensk. In open spaor can be inst
achieve duaproducts.
y 2011]
r panel
protect al nd plug
l in sor ace, talled
al
2013 Califo
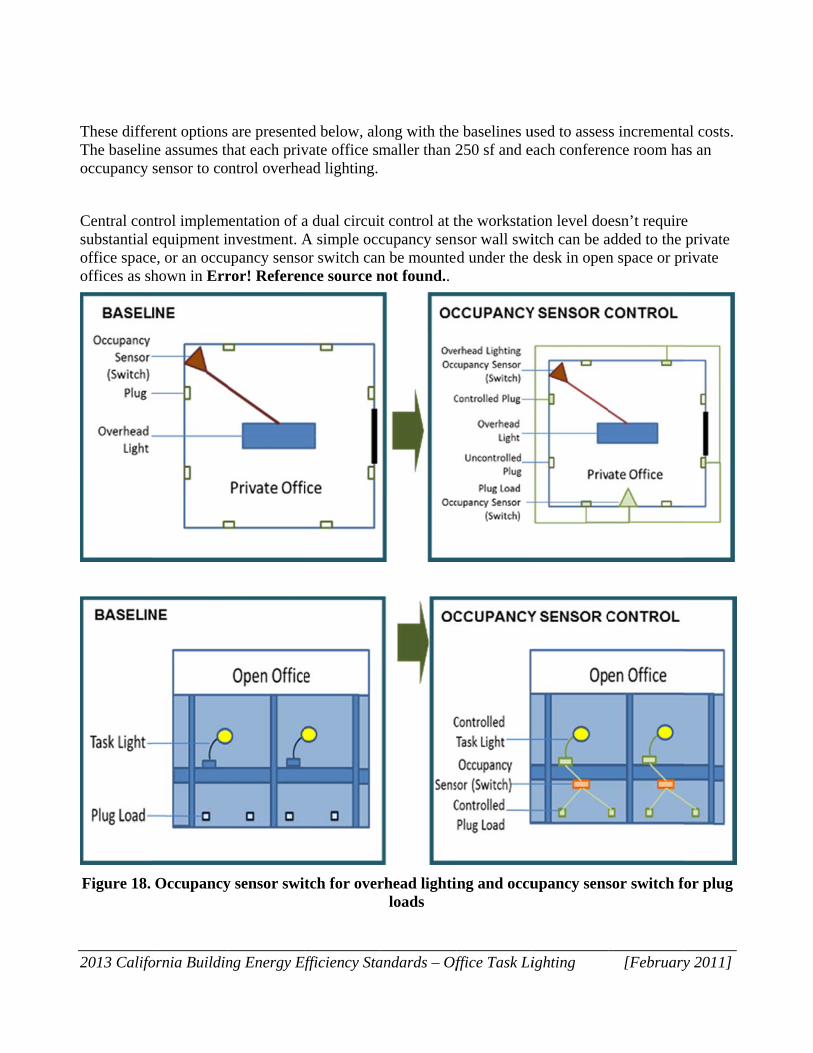
These diffeThe baselinoccupancy
Central consubstantial office spaceoffices as sh
Figure 18.
ornia Buildin
rent options ne assumes thsensor to co
ntrol implemequipment ine, or an occuhown in Err
Occupancy
ng Energy Ef
are presentehat each privntrol overhe
mentation of anvestment. A
upancy sensoror! Referen
y sensor swi
Efficiency Sta
ed below, alovate office smead lighting.
a dual circuitA simple occor switch cannce source n
tch for over
andards – Of
ong with themaller than 2
t control at tcupancy senn be mountenot found..
rhead lightiloads
ffice Task Li
e baselines u250 sf and e
the workstatnsor wall swid under the
ing and occu
ighting
used to asseseach conferen
tion level doeitch can be adesk in open
upancy sens
[February
s incrementance room ha
esn’t requireadded to the n space or pr
sor switch fo
y 2011]
al costs. as an
e private rivate
for plug
2013 Califo
An equipmesensor contthat uses a rand plug loeach works
Occupancy can be split
ornia Buildin
ent upgrade rolling overhrelay box anads togethertation in ope
sensor stratt at the zone
ng Energy Ef
also enableshead lighting
nd a linked or. This last open spaces, as
Figure 19. O
egies do notlevel to crea
Efficiency Sta
s the implemg required byccupancy seption still res pictured in
Occupancy
t require duaate an emerg
andards – Of
mentation of py Title 24 ca
ensor to contquires instalError! Ref
Sensor Lin
al circuit plangency load ci
ffice Task Li
plug load coan be replacetrol both ovellation of simference sour
nked to a Re
nning and inircuit and a c
ighting
ontrol. The eed by a roomerhead lightsmple occuparce not foun
elay Box
nstallation. Tcontrolled ci
[February
existing occum controller s, and task ligncy switche
nd..
The incomingircuit.
y 2011]
upancy system ghts s at
g circuit
2013 California Building Energy Efficiency Standards – Office Task Lighting [February 2011]
3.4 Energy Analysis
The analysis goal is provide energy savings for the three levels of plug load controls for both prototype office buildings. The general analysis methodology were explained in section Error! Reference source not found.. This section provides detailed calculation assumptions and analysis results.
3.4.1 Task Lighting and Plug Load Operation and Control Parameters
According to the formulae provided in section 2.4, energy savings depend on the following parameters:
Controllable Plug Load
Certain office equipment cannot be interrupted event during non-business hours. For example, fax machines need to be in operation all the time and computers need to be connected for remote access or scheduled system upgrade during night. For energy savings assessment, the CASE study only considered plug load that can be safely switched off without affecting equipment functions and office operation. Figure 20 provides the list of controllable plug loads based on the criteria defined in section Error! Reference source not found., as well as the corresponding control technologies. Central timer controls can turn off all the listed plug loads when they are connected. Occupancy sensor controls are only considered to be effective to plug loads in private offices, open-space cubicles, and conference rooms.
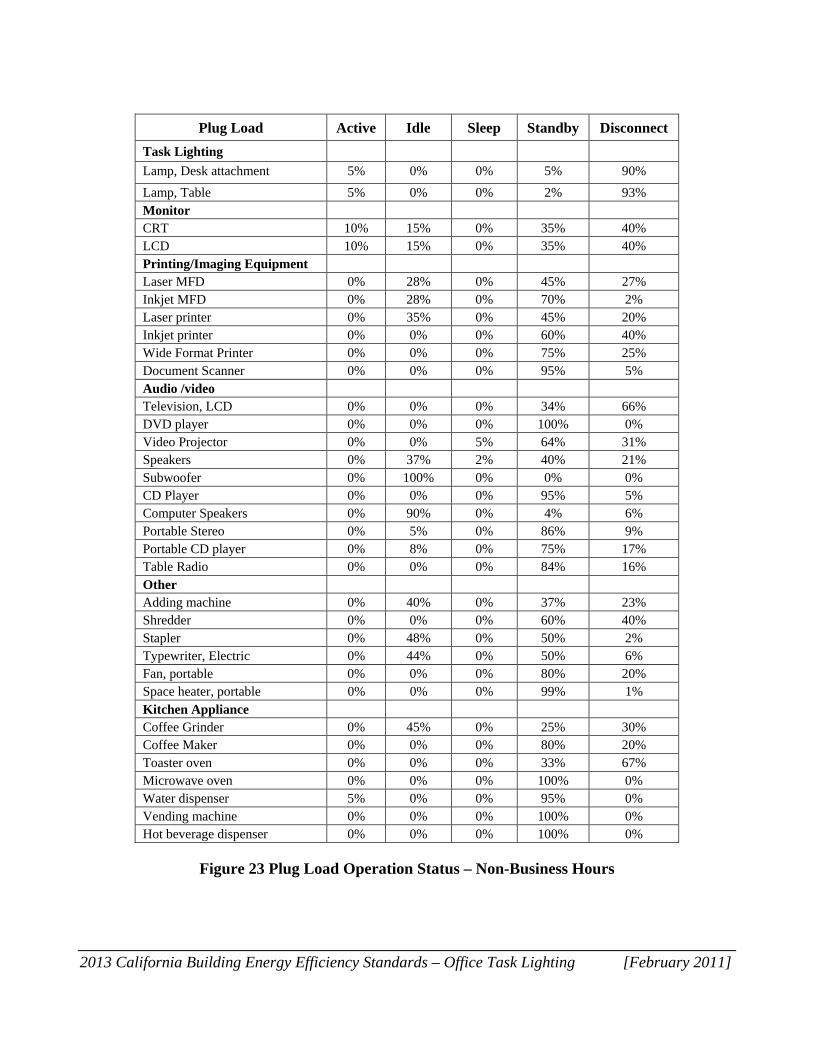
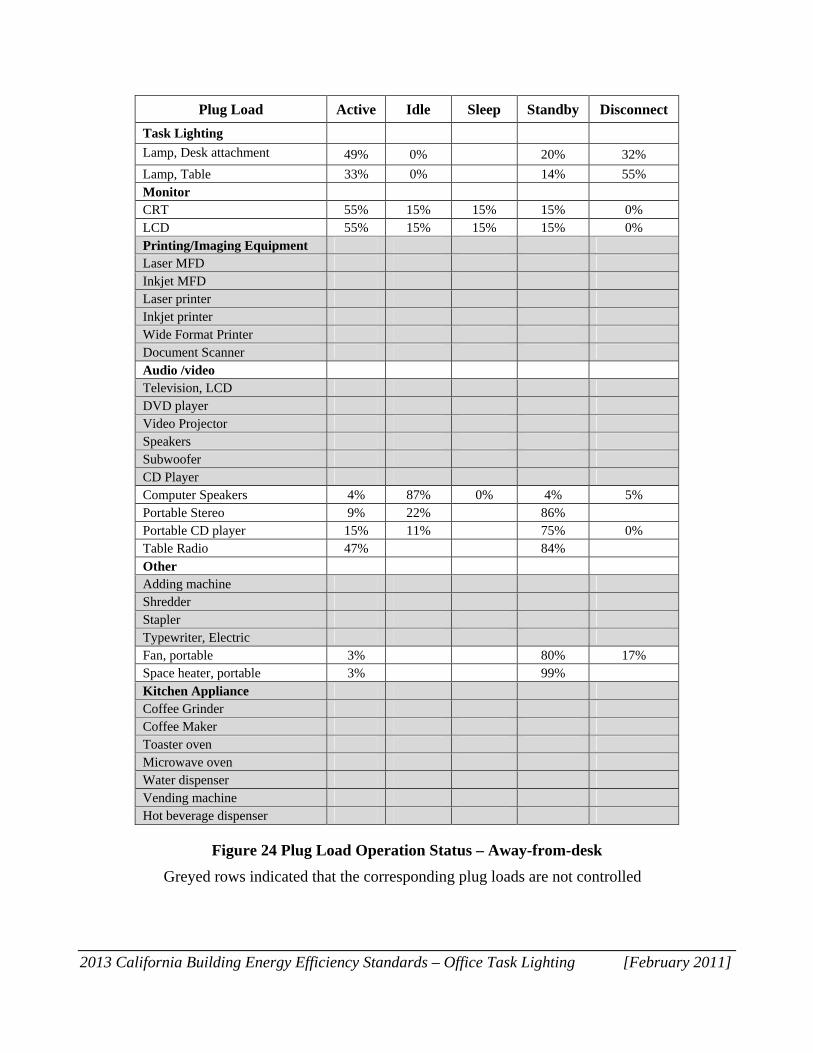
Plug load density and energy consumption in different power states They were obtained from the LBNL study and ECOS PIER research reports and listed in Figure 21.
Building size and configuration Section Error! Reference source not found. provides detailed information of the two office building prototypes
Percentage of the time spent in these different power states during non-business hours and when occupants are away from their desk or out of office The LBNL and ECOS PIER studies are the only data sources that provide relative comprehensive usage pattern statistics of task lighting and plug loads. The LBNL study measured night time operation statistics for computer and office printing equipment. The ECOS PIER study provided averaged daily usage statistics for all plug loads. Based on the two studies, we developed task lighting and plug load power state status during business hours and non-business hours, as shown in . When data are not available, conservative assumptions are made.
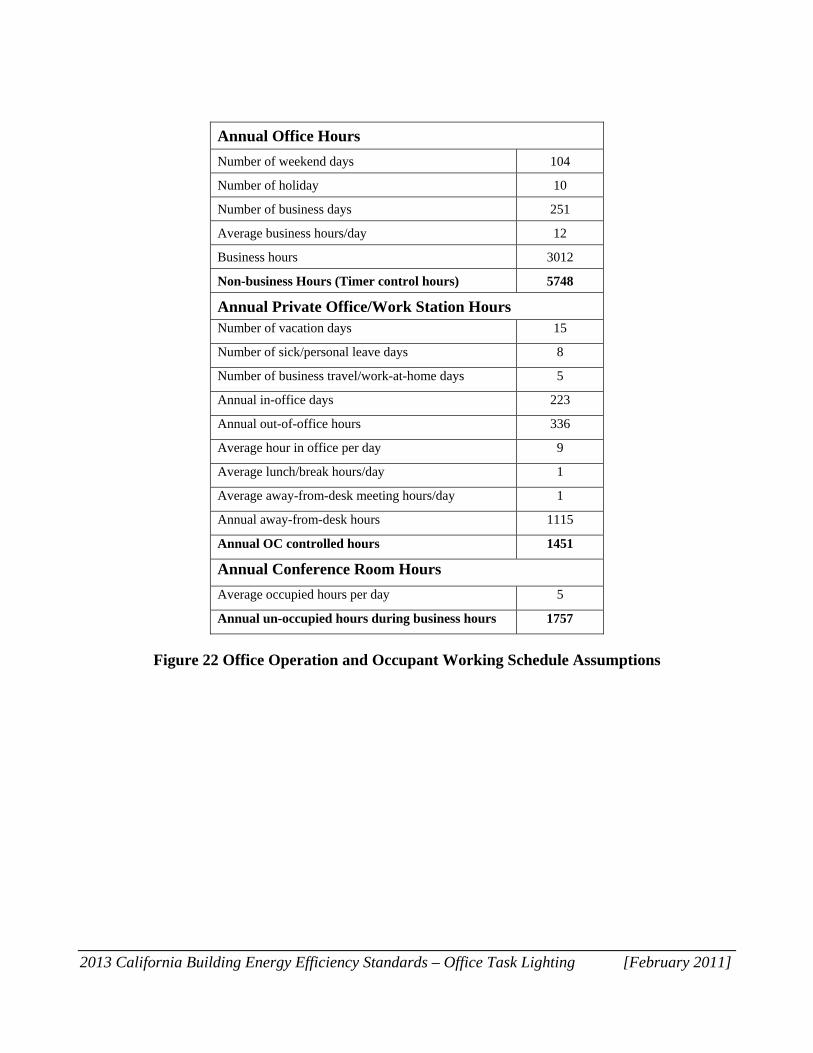
Office operation schedule and private office/open-space cubicle/conference room occupancy Office business hours are based on general office working schedules. For private office/open-space cubicle/conference room occupancy, the CASE team considered average away-from-desk time for events such as lunch break, meetings, early leave, etc., and out-of-office time for events such as vacation, sick leave, business travels, work at home, jury duty, and other personal leaves. Figure 22 lists all assumptions of office operation schedules and employee working schedules.
2013 California Building Energy Efficiency Standards – Office Task Lighting [February 2011]
Plug Load Central Timer Control
Occupancy Sensor Control
Private Office / Cubicle
Conference Room
Task Lighting Lamp, Desk attachment Y Y
Lamp, Table Y Y Monitor CRT Y Y LCD Y Y Printing/Imaging Equipment Laser MFD Y Inkjet MFD Y Laser printer Y Inkjet printer Y Wide Format Printer Y Document Scanner Y Audio /video Television, LCD Y Y DVD player Y Y Video Projector Y Y Speakers Y Y Subwoofer Y Y CD Player Y Y Computer Speakers Y Y Y Portable Stereo Y Y Portable CD player Y Y Table Radio Y Y Other Adding machine Y Shredder Y Stapler Y Typewriter, Electric Y Fan, portable Y Y Space heater, portable Y Y Kitchen Appliance Coffee Grinder Y Coffee Maker Y Toaster oven Y Microwave oven Y Water dispenser Y Vending machine Y Hot beverage dispenser Y
Figure 20 Controllable Plug Load for Timer and Occupancy Sensor Controls
2013 California Building Energy Efficiency Standards – Office Task Lighting [February 2011]
Lamp, Table 33% 0% 14% 55% Monitor CRT 55% 15% 15% 15% 0% LCD 55% 15% 15% 15% 0% Printing/Imaging Equipment Laser MFD Inkjet MFD Laser printer Inkjet printer Wide Format Printer Document Scanner Audio /video Television, LCD DVD player Video Projector Speakers Subwoofer CD Player Computer Speakers 4% 87% 0% 4% 5% Portable Stereo 9% 22% 86% Portable CD player 15% 11% 75% 0% Table Radio 47% 84% Other Adding machine Shredder Stapler Typewriter, Electric Fan, portable 3% 80% 17% Space heater, portable 3% 99% Kitchen Appliance Coffee Grinder Coffee Maker Toaster oven Microwave oven Water dispenser Vending machine Hot beverage dispenser
Figure 24 Plug Load Operation Status – Away-from-desk
Greyed rows indicated that the corresponding plug loads are not controlled
2013 California Building Energy Efficiency Standards – Office Task Lighting [February 2011]
Plug Load Active Idle Sleep Standby Disconnect
Task Lighting Lamp, Desk attachment
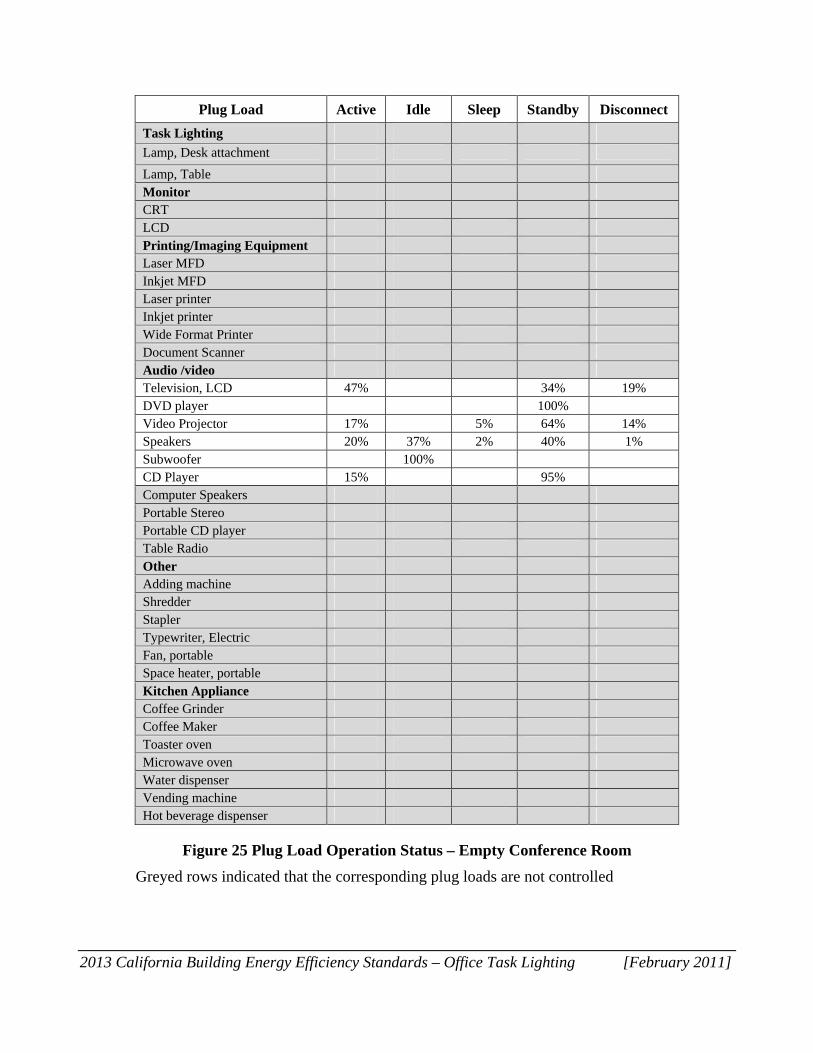
Lamp, Table Monitor CRT LCD Printing/Imaging Equipment Laser MFD Inkjet MFD Laser printer Inkjet printer Wide Format Printer Document Scanner Audio /video Television, LCD 47% 34% 19% DVD player 100% Video Projector 17% 5% 64% 14% Speakers 20% 37% 2% 40% 1% Subwoofer 100% CD Player 15% 95% Computer Speakers Portable Stereo Portable CD player Table Radio Other Adding machine Shredder Stapler Typewriter, Electric Fan, portable Space heater, portable Kitchen Appliance Coffee Grinder Coffee Maker Toaster oven Microwave oven Water dispenser Vending machine Hot beverage dispenser
Figure 25 Plug Load Operation Status – Empty Conference Room
Greyed rows indicated that the corresponding plug loads are not controlled
2013 California Building Energy Efficiency Standards – Office Task Lighting [February 2011]
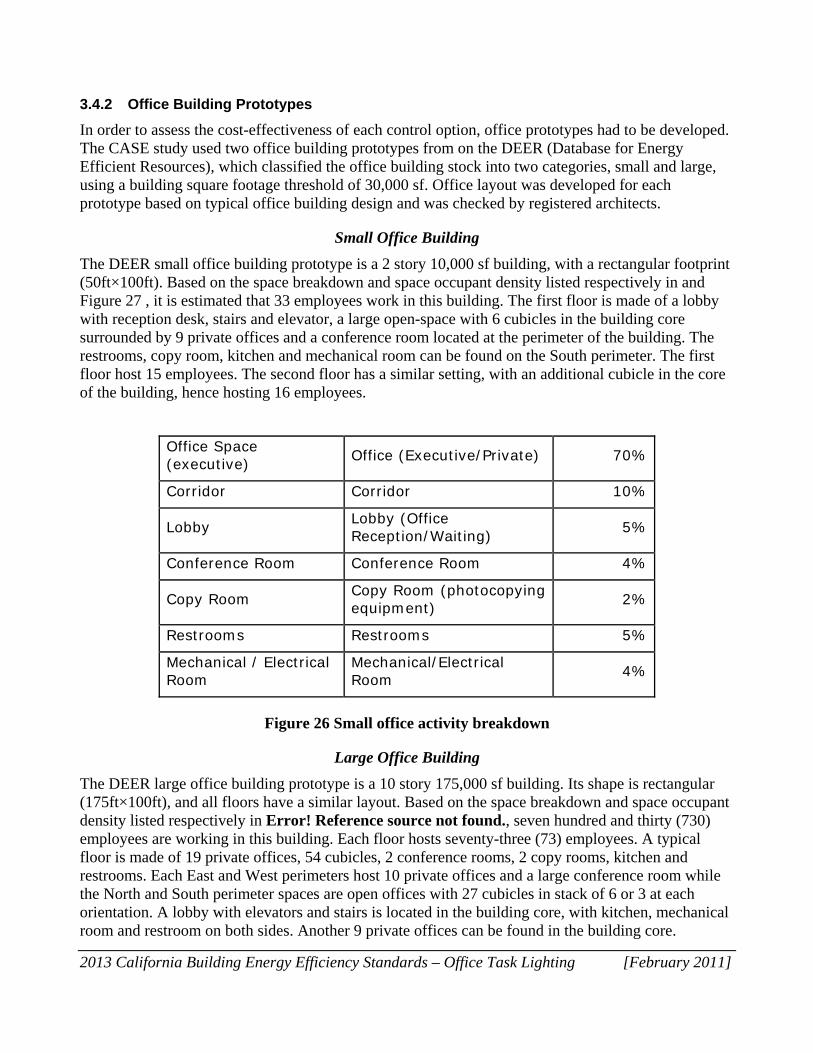
3.4.2 Office Building Prototypes
In order to assess the cost-effectiveness of each control option, office prototypes had to be developed. The CASE study used two office building prototypes from on the DEER (Database for Energy Efficient Resources), which classified the office building stock into two categories, small and large, using a building square footage threshold of 30,000 sf. Office layout was developed for each prototype based on typical office building design and was checked by registered architects.
Small Office Building
The DEER small office building prototype is a 2 story 10,000 sf building, with a rectangular footprint (50ft×100ft). Based on the space breakdown and space occupant density listed respectively in and Figure 27 , it is estimated that 33 employees work in this building. The first floor is made of a lobby with reception desk, stairs and elevator, a large open-space with 6 cubicles in the building core surrounded by 9 private offices and a conference room located at the perimeter of the building. The restrooms, copy room, kitchen and mechanical room can be found on the South perimeter. The first floor host 15 employees. The second floor has a similar setting, with an additional cubicle in the core of the building, hence hosting 16 employees.
Office Space (executive) Office (Executive/Private) 70%
Corridor Corridor 10%
Lobby Lobby (Office Reception/Waiting) 5%
Conference Room Conference Room 4%
Copy Room Copy Room (photocopying equipment) 2%
Restrooms Restrooms 5%
Mechanical / Electrical Room
Mechanical/Electrical Room 4%
Figure 26 Small office activity breakdown
Large Office Building
The DEER large office building prototype is a 10 story 175,000 sf building. Its shape is rectangular (175ft×100ft), and all floors have a similar layout. Based on the space breakdown and space occupant density listed respectively in Error! Reference source not found., seven hundred and thirty (730) employees are working in this building. Each floor hosts seventy-three (73) employees. A typical floor is made of 19 private offices, 54 cubicles, 2 conference rooms, 2 copy rooms, kitchen and restrooms. Each East and West perimeters host 10 private offices and a large conference room while the North and South perimeter spaces are open offices with 27 cubicles in stack of 6 or 3 at each orientation. A lobby with elevators and stairs is located in the building core, with kitchen, mechanical room and restroom on both sides. Another 9 private offices can be found in the building core.
2013 Califo
ornia Buildin
Office Spa
Office Spa(executiv
Corridor
Lobby
Conferenc
Copy Roo
Restroom
MechanicRoom
ng Energy Ef
ace (open)
ace e)
ce Room
om
ms
al / Electric
Figure
Fi
Efficiency Sta
) Office
Office
Corri
LobbRece
Confe
Copyequip
Restr
cal MechRoom
e 27 Large o
igure 28 Lar
andards – Of
e (Open Pla
e (Executiv
dor
y (Office ption/Wait
erence Roo
y Room (phpment)
rooms
hanical/Elecm
office activit
rge Office F
ffice Task Li
an)
ve/Private)
ting)
om
hotocopying
ctrical
ty breakdow
Floor Plan
ighting
45
) 25
10
5
4
g 2
5
4
wn
[February
5.00%
5.00%
0.00%
5.00%
4.00%
2.00%
5.00%
4.00%
y 2011]
2013 California Building Energy Efficiency Standards – Office Task Lighting [February 2011]
3.4.3 Energy Savings Analysis Results
A spreadsheet was developed to perform detailed hourly calculation of energy savings, following the calculation formulae provided in section 2.4. Annual electricity consumption reduction is summarized in Figure 29. Annual building TDV energy savings and lifecycle energy savings benefits are provided in Figure 30 and Figure 31, respectively.
The section provides detailed estimation of incremental costs for the three levels of building task lighting and plug load controls, as described in section Error! Reference source not found.. Costs from following items are considered:
Incremental cost of control panels for central timer controls Cost for addition of occupancy sensor controls Cost for upgrade of dual circuit wiring Labor cost for control system installation and configuration
2013 California Building Energy Efficiency Standards – Office Task Lighting [February 2011]
3.5.1 Component Costs
Control Panel for Central Timer Control
The control equipment and wiring) costs and installation costs, which depends mostly on the number of circuits to be controlled, by central control panels or occupancy sensors.
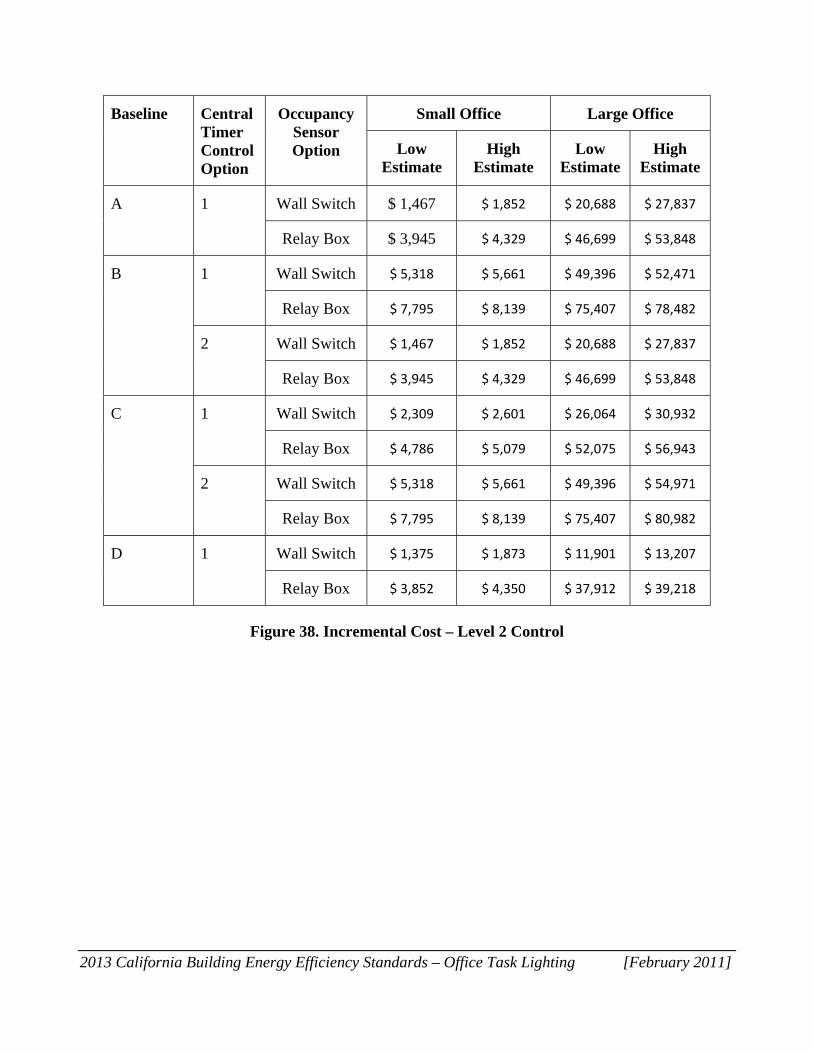
The equipment required for circuit protection and for overhead lighting and task light/plug load circuit control was determined for each base case and related option (as defined in section 3.3.3), based on the number and type of circuits for each office zone, and on the space layout constraints.
Typical circuit protection practice sets 120 ft as the maximum distance from each end of circuit outlet to the circuit breaker due to voltage drop. This practice dictates the number of breaker panel systems to be used for each prototype. The lighting control devices are usually networked, and only one logic controller is used for the entire network. Typical practice places system controls at the same location on each floor, and network each floor using vertical electrical shaft.
The small office is served by two breaker and control panel systems, one on each floor. The first floor hosts the logic controller for overhead lighting control used for the second floor system. Each floor of the large office is served by two systems due to the 120 ft maximum wiring limitation. Two different control networks are used, one for each side of the building. Hence, two logic controllers are required for the large office prototype.
For each system, the controllable breaker or relay panel size was determined including a 20% extra space for future expansion purpose as commonly done in the field.
The sizing estimates were done for two cases:
Low Estimate (building served by fewer electrical circuits) High Estimate (building served by more electrical circuits)
Manufacturers were surveyed to assess the cost of standard size controllable breaker panels and control relay panels (8, 24, 42 relays or breakers) for both master (include the logic controller) and slave panels (without logic controller), as shown in Figure 32.
The panel system cost for each option for each prototype was then determined by interpolating these costs based on the number of the required additional controllable breakers or relays.
Panel Type Controller 8 relays/breakers 24 relays/breakers 42 relays/breakers
Lighting Control/Relay Panel
Master $ 2,305 $ 3,085 $ 3,960
Slave $ 1,495 $ 2,305 $ 3,215
Controllable breaker Panel
Master $ 1,090 $ 2765 $ 4,650
Slave $ 930 $ 2,335 $ 3,915
Figure 32 Control Panel Costs
2013 California Building Energy Efficiency Standards – Office Task Lighting [February 2011]
3.5.2 System Cost
Level 1 Control
This level control requires all task lighting and plug loads be controlled by control panels with timer control capabilities. The number of secondary circuits for control is calculated based on total controllable plug loads, including all task lighting loads, in the building. The control panel upgrade requirements are summarized in Figure 33 and the associated incremental costs are summarised in Error! Reference source not found.. The central timer control doesn’t affect the number of circuits in the building. It only modifies the wiring layout resulting in longer wiring. The additional wiring length was assessed for each prototype by designing the wiring layout according to office layout. The result is summarized in Figure 34 provides.
The wiring material and installation costs and the labor costs were assessed using RS Means data. The cost assumptions are as followed:
2 hr for system additional relay installation 1.27 hr/ 100ft wire installation $ 86.11/hr labor cost No maintenance for 15 years
2013 California Building Energy Efficiency Standards – Office Task Lighting [February 2011]
Baseline Option Small Office Large Office
Low Estimate High Estimate Low Estimate High Estimate
A 1 Add to 6 relays control panel
Add to 8 relays to control panel
Add to 9 relays to control panel
Add to 15 relays to control panel
B 1 Change task/plug loads breaker panel by controllable breaker panel
2 Add to 6 relays control panel
Add to 8 relays to control panel
Add to 9 relays to control panel
Add to 15 relays to control panel
C 1 Increase controllable breaker panel by 6 controlled breakers and 14 breakers
No task/plug breaker panel
Increase controllable breaker panel by 8 controlled breakers and 16 breakers
No task/plug breaker panel
Increase controllable breaker panel by 9 controlled breakers and 16 breakers
No task/plug breaker panel
Increase controllable breaker panel by 15 controlled breakers and 23 breakers
No task/plug breaker panel
2 Change task/plug loads breaker panel by controllable breaker panel
D 1 Replace 6 regular breaker by controllable breakers in the controllable breaker panel
Replace 8 regular breaker by controllable breakers in the controllable breaker panel
Replace 9 regular breaker by controllable breakers in the controllable breaker panel
Replace 15 regular breaker by controllable breakers in the controllable breaker panel
Figure 33. Central Control Strategy – Incremental Equipment Requirement
Small Office Large Office
Low Estimate
High Estimate
Low Estimate
High Estimate
Additional Wire Length (ft)
252 120 3,250 2,340
Figure 34. Central Control Strategy – Additional Wire Requirement
The incremental cost for level 1 control is displayed in Figure 35.
2013 California Building Energy Efficiency Standards – Office Task Lighting [February 2011]
Baseline Option Small Office Large Office
Low Estimate
High Estimate
Low Estimate
High Estimate
A 1 $ 1,647 $ 1,864 $ 19,238 $ 31,121
B 1 $ 4,635 $ 4,612 $ 39,791 $ 48,538
2 $ 1,647 $ 1,864 $ 19,238 $ 31,121
C 1 $ 1,626 $ 1,504 $ 16,309 $ 24,049
2 $ 4,635 $ 4,612 $ 39,791 $ 48,538
D 1 $ 991 $ 775 $ 4,559 $ 5,061
Figure 35 Increment Costs - Level 1 Control
2013 California Building Energy Efficiency Standards – Office Task Lighting [February 2011]
Level 2 Control
In this level of control, central timer control is used for task lights and plug load serving open spaces and common areas, including kitchen and copy room; occupancy sensors are used for private offices and conference rooms.
As for the central control strategy, the equipment required for circuit protection and for overhead lighting and task light/plug load circuit control was determined for each base case and related option, based on number and type of circuits for each office zone and on the space layout constraints. The same network configuration and number of protection and lighting control systems were assumed. The difference between the two cases relies on the number of centrally controlled plug load circuits which translates into a difference in central control equipment size. The control panel upgrade requirements are summarized in Figure 36.
In this strategy, occupancy sensors are only installed in private offices and conference rooms. Either wall switches or occupancy sensors with relay boxes can be installed.
No additional wiring is required in this strategy. Based on the prototype layouts, bringing both controlled and uncontrolled circuits in open space is feasible without longer wires. The additional wiring in the central control only strategy is related to private office wiring.
The total system upgrade cost is listed in Figure 38.
2013 California Building Energy Efficiency Standards – Office Task Lighting [February 2011]
Baseline Option Small Office Large Office
Low Estimate High Estimate Low Estimate High Estimate
A 1 Add to 1 relay control panel
Add to 3 relays to control panel
Add to 5 relays to control panel
Add to 9 relays to control panel
B 1 Change task/plug loads breaker panel by controllable breaker panel
2 Add to 1 relays control panel
Add to 3 relays to control panel
Add to 5 relays to control panel
Add to 9 relays to control panel
C 1 Increase controllable breaker panel by 1 controlled breakers and 17 breakers
No task/plug breaker panel
Increase controllable breaker panel by 3 controlled breakers and 23 breakers
No task/plug breaker panel
Increase controllable breaker panel by 5 controlled breakers and 21 breakers
No task/plug breaker panel
Increase controllable breaker panel by 9 controlled breakers and 29 breakers
No task/plug breaker panel
2 Change task/plug loads breaker panel by controllable breaker panel
D 1 Replace 2 regular breaker by controllable breakers in the controllable breaker panel
Replace 3 regular breaker by controllable breakers in the controllable breaker panel
Replace 8 regular breaker by controllable breakers in the controllable breaker panel
Replace 9 regular breaker by controllable breakers in the controllable breaker panel
Figure 36 Central Control & Occupancy Sensor Strategy - Equipment requirement
Space Type Small Office Large Office
Private Offices 18 190
Conference Room 2 20
Total 20 210
Figure 37 Central Control & Occupancy Sensor Strategy - Equipment requirement
2013 California Building Energy Efficiency Standards – Office Task Lighting [February 2011]
Baseline Central Timer Control Option
Occupancy Sensor Option
Small Office Large Office
Low Estimate
High Estimate
Low Estimate
High Estimate
A 1 Wall Switch $ 1,467 $ 1,852 $ 20,688 $ 27,837
Relay Box $ 3,945 $ 4,329 $ 46,699 $ 53,848
B
1 Wall Switch $ 5,318 $ 5,661 $ 49,396 $ 52,471
Relay Box $ 7,795 $ 8,139 $ 75,407 $ 78,482
2 Wall Switch $ 1,467 $ 1,852 $ 20,688 $ 27,837
Relay Box $ 3,945 $ 4,329 $ 46,699 $ 53,848
C 1 Wall Switch $ 2,309 $ 2,601 $ 26,064 $ 30,932
Relay Box $ 4,786 $ 5,079 $ 52,075 $ 56,943
2 Wall Switch $ 5,318 $ 5,661 $ 49,396 $ 54,971
Relay Box $ 7,795 $ 8,139 $ 75,407 $ 80,982
D 1 Wall Switch $ 1,375 $ 1,873 $ 11,901 $ 13,207
Relay Box $ 3,852 $ 4,350 $ 37,912 $ 39,218
Figure 38. Incremental Cost – Level 2 Control
2013 California Building Energy Efficiency Standards – Office Task Lighting [February 2011]
Level 3 Control Cost
The level 3 control requires occupancy sensor control be installed in private offices, open space cubicles, and conference rooms.
Occupancy sensor control strategy doesn’t affect the wiring in the building, as circuits are split at the zone level. No additional wiring is required.
Manufacturers were surveyed to assess the cost of simple wall switches and occupancy sensor with relay box systems. These results are presented inFigure 40. The cost of wiring for occupancy sensor with relay box system is included in the manufacturer pricing.
Options Unit Price Estimated Installation Time/unit
Measure cost-effectiveness is determined by comparing lifecycle costs to lifecycle savings/benefits. Section 3.5 provides measure lifecycle costs. Lifetime energy savings benefits (PV of 15 years savings) are provided in Figure 31.
Compared to the incremental costs for corresponding control system incremental costs, provided in Figure 35, Figure 38, and Figure 41, lifecycle measure benefits are substantially higher than costs for all three levels of control for both small and large office buildings and for all climate zones.
2013 California Building Energy Efficiency Standards – Office Task Lighting [February 2011]
4. Bibliography and Other Research List and describe each of the research studies, reports, and personal communications that provide background for this research. Identify all resources that have been pursued to further this measure. Identify all “experts” that were involved in further developing the change, all research and analysis reports and documents that were reviewed, and all industry standards that were consulted (e.g., ASTM, UL, ASHRAE test procedures, etc.). Include research that is underway that addresses the measure/change. Indicate if data or information will be produced in time to be used in this update of the Standards.
Webber C., Roberson J., Brown R., Payne C., Nordman B., Koomey J., Energy Analysis Program Environmental Energy Technologies Division Lawrence Berkeley National Laboratory, September 2001, “Field Surveys of Office Equipment Operating Patterns”, http://enduse.lbl.gov/Projects/OffEqpt.html
Roberson J., Webber C., McWhinney M., Brown R., Pinckard M., ansd Busch J., LBNL-53729-Revised, “After-hours Power Status of Office Equipment and Energy Use of Miscellaneous Plug-Load Equipment”,
Sanchez M. Webber C., Brown R., Busch J., Pinckard M., Roberson J., Environmental Energy Technologies Division Ernest Orlando Lawrence Berkeley National Laboratory University of California , February 2007, “Space Heaters, Computers, Cell Phone Chargers: How Plugged In Are Commercial Buildings?”
Webber C., Roberson J., Brown R., Payne C., Nordman B., Koomey J., Energy Analysis Program Environmental Energy Technologies Division Lawrence Berkeley National Laboratory, September 2001, “Field Surveys of Office Equipment Operating Patterns”, http://enduse.lbl.gov/Projects/OffEqpt.html
Roberson J., Webber C., McWhinney M., Brown R., Pinckard M., and Busch J., LBNL-53729-Revised, “After-hours Power Status of Office Equipment and Energy Use of Miscellaneous Plug-Load Equipment”,
Sanchez M. Webber C., Brown R., Busch J., Pinckard M., Roberson J., Environmental Energy Technologies Division Ernest Orlando Lawrence Berkeley National Laboratory University of California , February 2007, “Space Heaters, Computers, Cell Phone Chargers: How Plugged In Are Commercial Buildings?”
“Small office equipment in PG&E Residential territory: RASS Survey 2003 published in “Consumer Electronics: Market Trends, Energy Consumption, and Program Recommendations 2005-2010”. It was adjusted to better match small office buildings.
Chase A.., Ramos R., Pope T., December 2006, “Consumer Electronics: Market Trends, Energy Consumption, and Program Recommendations 2005-2010”
The WattStopper, “Lighting control best practice guide: Office Buildings”, http://www.nxtbook.com/nxtbooks/wattstopper/officebuildingsbpg08/
SmartDraw Communicate Visually, “Easy floor plan software”, http://www.smartdraw.com/specials/floorplans.asp
2013 California Building Energy Efficiency Standards – Office Task Lighting [February 2011]
“Small office equipment in PG&E Residential territory: RASS Survey 2003 published in “Consumer Electronics: Market Trends, Energy Consumption, and Program Recommendations 2005-2010”.
Chase A.., Ramos R., Pope T., December 2006, “Consumer Electronics: Market Trends, Energy Consumption, and Program Recommendations 2005-2010”
The WattStopper, “Lighting control best practice guide: Office Buildings”, http://www.nxtbook.com/nxtbooks/wattstopper/officebuildingsbpg08/
Field Surveys of Office Equipment Operating Patterns
Webber C., Roberson J., Brown R., Payne C., Nordman B., Koomey J., Energy Analysis Program Environmental Energy Technologies Division Lawrence Berkeley National Laboratory, September 2001, “Field Surveys of Office Equipment Operating Patterns”, http://enduse.lbl.gov/Projects/OffEqpt.html